Researchers say the Arctic Ocean crossed a biological tipping point in 2009, when nitrate levels in the water suddenly started dropping due to a drastic reduction in sea ice extent.
By combining seismic, gravity and topographic data, a team of researchers from Italy, Switzerland, Germany and the United Kingdom found that several well-known subglacial basins in East Antarctica are part of a single fan-shaped province whose origins trace back to ancient continental stretching.
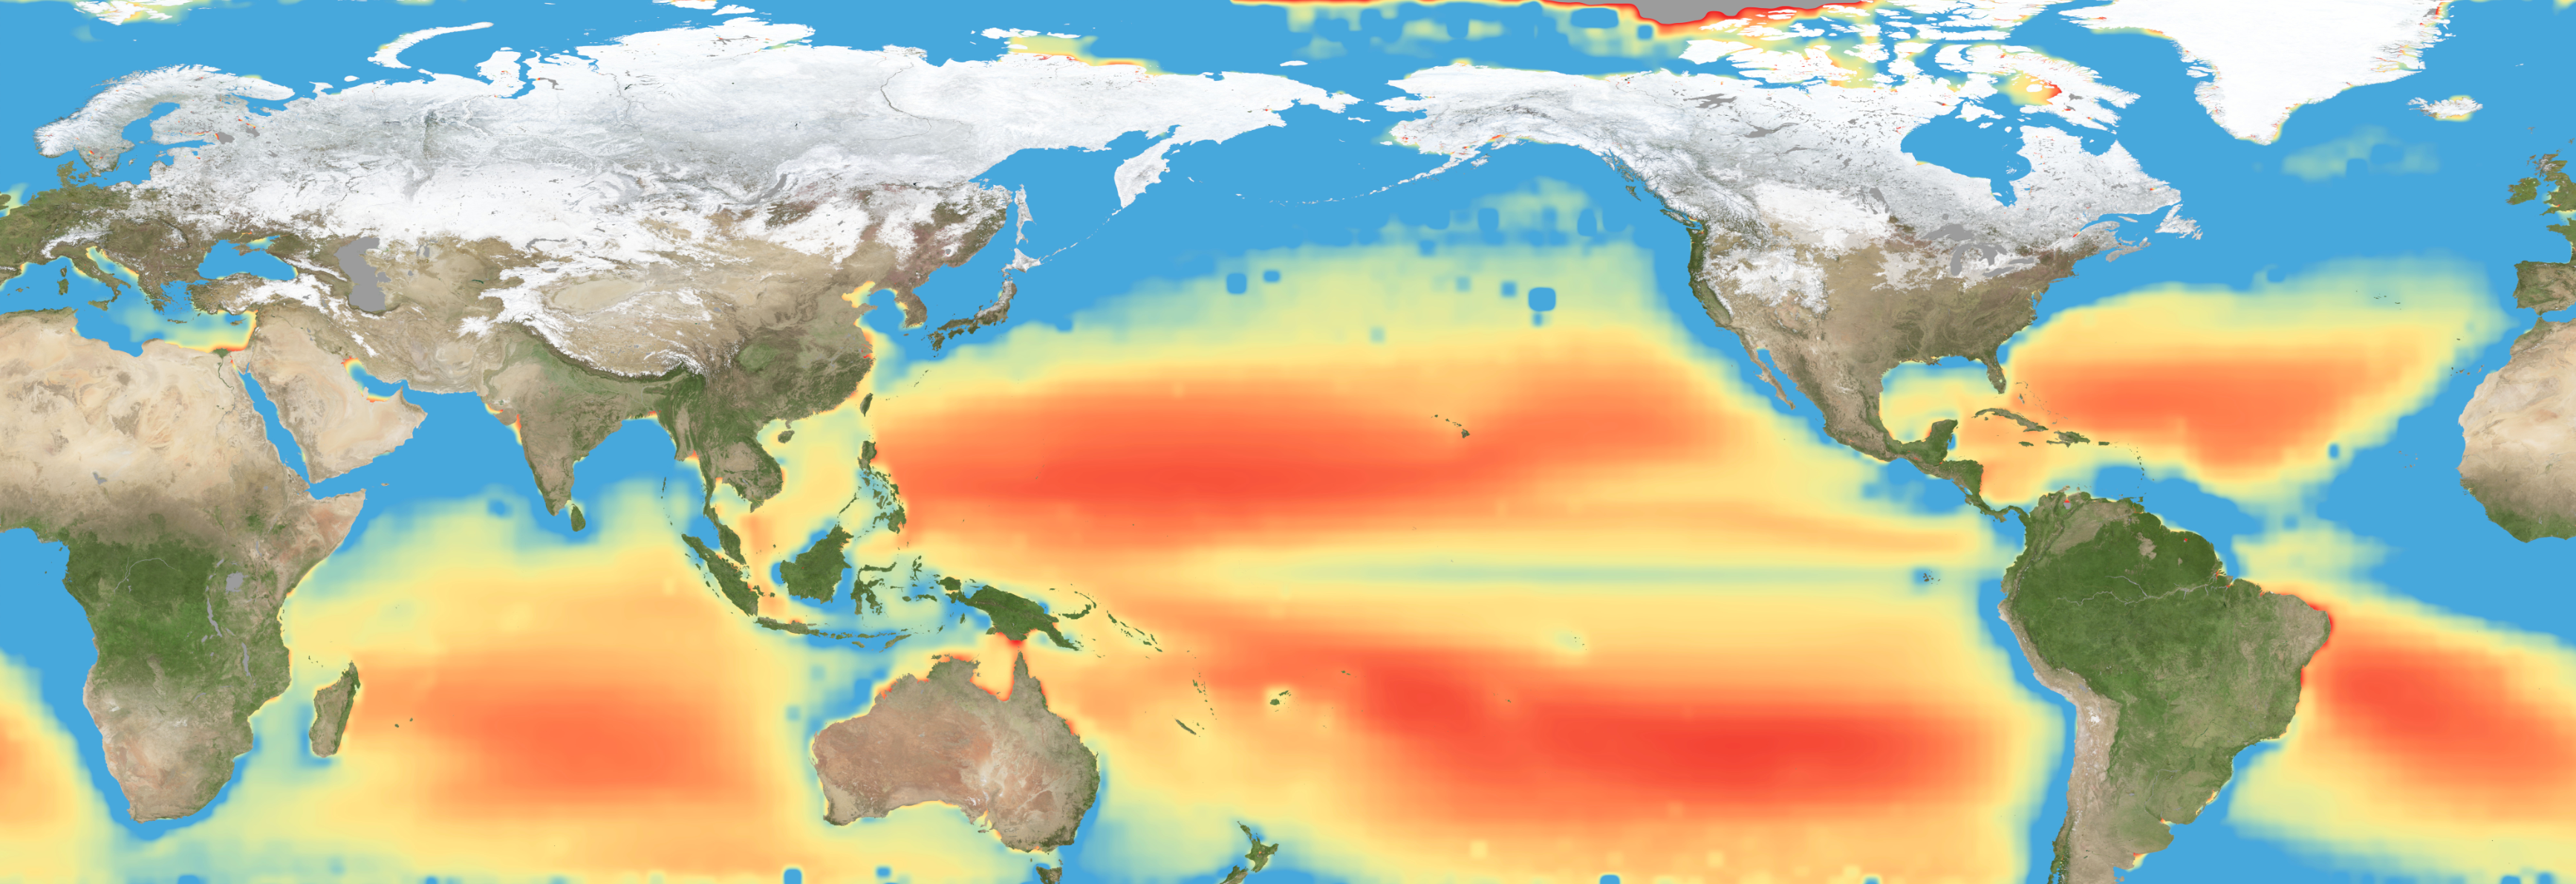
Warming waters decrease upwelling and lead to stress on marine microorganisms due to limited availability of vital nutrients. Red indicates the regions of highest nutrient-related stress.
Kel Elkins/NASA’s Scientific Visualization Studio
Editor’s note: This article was updated on June 5.
A new study combining NASA satellite observations, ocean surveys, and genetic testing on marine microorganisms found evidence that warming ocean waters may be limiting nutrient availability across much of the global ocean. The researchers report that this nutrient stress affects microscopic marine organisms and could influence marine ecosystems over time.
The research, published June 5 in Science Advances, tracked the condition of phytoplankton, which form the base of ocean food webs. Rather than measuring nutrients like nitrogen, iron, and phosphorus directly, the researchers inferred stress by tracking subtle shifts in the ratio of carbon to chlorophyll in phytoplankton observed from space. When the amount of chlorophyll decreases relative to carbon as seen in satellite data, it’s an indication that the plankton are stressed.
“As our ocean continues to change, the ability to observe and track ocean conditions through sustained, high quality remote sensing observations has never been more important,” said Laura Lorenzoni, Program Scientist for NASA’s Ocean Biology and Biogeochemistry Program at NASA Headquarters in Washington. “This is fundamental, as plankton communities are the base of the marine food web on which important economic activities rely.”
The research team combined two decades of data from NASA’s Aqua satellite’s Moderate Resolution Imaging Spectroradiometer (MODIS) sensor with plankton samples collected on research cruises around the world. The approach linked large-scale satellite observations with genetic markers in Prochlorococcus, a tiny but abundant marine microbe that shows signs of nutrient stress in its DNA. The result is a global map revealing where phytoplankton are thriving and where they’re struggling.
Ocean chlorophyll, as observed with NASA’s Moderate Resolution Imaging Spectroradiometer (MODIS) instrument between January 2010 through May 2016.
Marit Jentoft-Nilsen/NASA’s Goddard Space Flight Center
The strongest indications of nutrient stress on plankton appeared in the subtropical gyres, which are vast, relatively calm regions of the Atlantic, Pacific, and Indian oceans. In these areas, a layer of warm surface water stifles the flow of colder water from deeper in the ocean.
“When the surface of the ocean warms, it generates this very stable situation where a layer of low-density water sits on top of higher-density cold water,” said study coauthor Adam Martiny, an oceanographer at the University of California, Irvine. “You’ve probably experienced that if you’ve ever been to a lake in the summertime—it’s super warm right on the surface, and very cold deeper down when you stick your legs in.”
This layering blocks the upward flow of nutrient-rich water, limiting the availability of ocean surface nutrients that are crucial for plankton. In the South Pacific, one of the most nutrient-poor regions, a layer of warm surface water contributed to nitrogen and iron shortages, producing the most severe nutrient-related stress that the team discovered.
But the researchers were surprised to find that parts of the North Atlantic experience less nutrient stress than expected. Although there was evidence of a lack of phosphorus, the impact on microorganisms was comparatively mild.
That difference may reflect the biology of the organisms themselves. Phytoplankton can partially compensate for phosphorus shortages by recycling phosphorus more efficiently or replacing phosphorus-rich molecules inside their cells. Nitrogen shortages are harder to overcome because nitrogen is crucial for the proteins and cellular machinery required for photosynthesis and nutrient uptake.
The study revealed that nutrient stress is strongly correlated with seasons and major weather cycles such as El Niño and the Pacific Decadal Oscillation, which lead to warming waters in the Pacific Ocean. During La Niña events, which cool water over a large part of the Pacific, stronger upwelling brought more nutrients to surface waters and reduced stress in some regions. Superimposed on those multi-year cycles, however, was a longer-term trend.
From 2002 through 2021, average sea-surface temperatures increased across nearly 90% of the ocean area examined in the study. Over the same period, nutrient stress generally intensified, consistent with previous hypothesis that warming oceans may become increasingly stratified and less able to replenish surface nutrients.
In many nutrient-poor regions of the Southern Hemisphere, however, the researchers found evidence that nutrient stress had not increased as much as expected despite significant warming. They suspect that microbes capable of capturing nitrogen from the air may partially offset the effects of reduced nutrient mixing.
That finding hints that marine ecosystems may possess more resilience to warming climates than some models predict. It also underscores the complexity of forecasting how ocean biology will respond to continued warming.
“We have two really powerful tools,” said study coauthor Michael Behrenfeld, a biochemist with Oregon State University in Corvallis, Oregon. The tools include satellite observations and cellular studies. “Both produce big data sets, but they are kind of opposites. We have very detailed data about microscopic phytoplankton … and then we have global coverage with satellites.”
By combining satellites that monitor the entire ocean with genetic clues carried inside microscopic plankton, the researchers say they are gaining a new way to track biological responses to changing environmental conditions near real time.
What happens when pileups of solar wind plasma collide with Earth’s protective magnetosphere? New work uses machine learning to examine how strongly these events affect our planet’s magnetic field.
Plasma Pileups
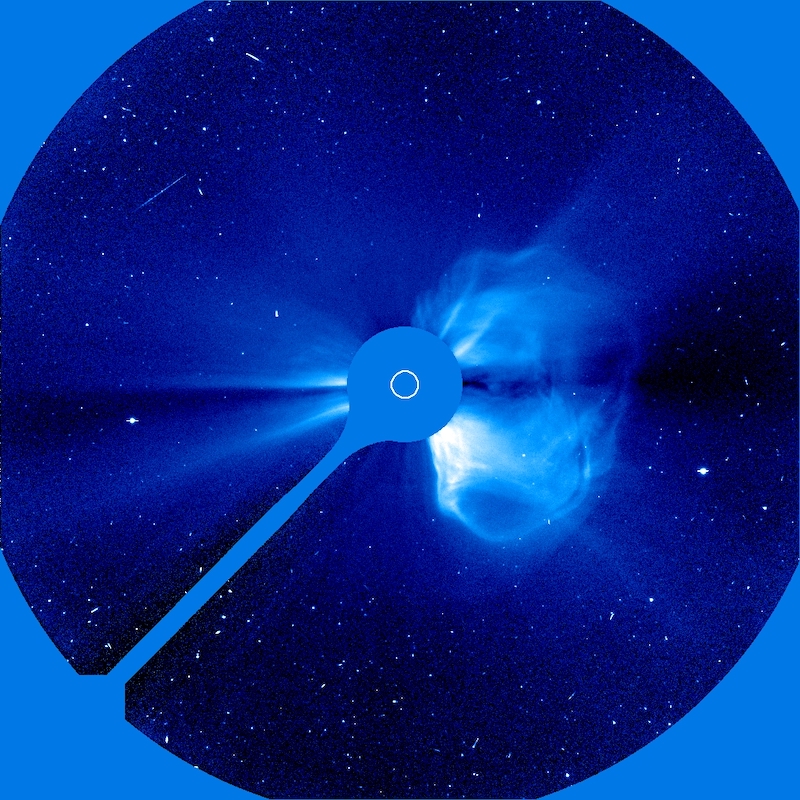
The Solar & Heliospheric Observatory (SOHO) took this coronagraphic image of a coronal mass ejection on 20 April 1998. [SOHO (ESA & NASA)]
Geomagnetic storms driven by solar activity paint night skies with glowing aurorae, but they also threaten spacecraft electronics with showers of high-energy particles. While immense eruptions of solar plasma and magnetic fields called coronal mass ejections are the most infamous example of solar activity, a team led by Yudong Ye (Sun Yat-Sen University) recently focused on another, less destructive form of activity: stream interaction regions.
Stream interaction regions arise when slow-moving solar wind is struck from behind by faster-moving solar wind emitted later. The collision of the two solar wind streams creates a tangle of compressed plasma and strong magnetic fields capable of peeling back Earth’s protective magnetosphere and dumping in high-energy charged particles, with beautiful yet harmful results.
Machine Learning Method
Though stream interaction regions are less disruptive than coronal mass ejections, they’re far more common; they frequently needle Earth’s magnetosphere, especially during the calmer years of the Sun’s activity cycle. Predicting how strongly a stream interaction region will influence Earth’s magnetosphere — in other words, how geoeffective it is — is challenging, however. When two streams of solar wind collide, their properties combine in complex and nonlinear ways that traditional statistical investigations have struggled to pin down.
Now, Ye and collaborators have used machine learning to study the properties and impact of stream interaction regions in a physically meaningful way. They performed their study on a sample of 879 stream interaction events for which there is abundant information, such as temperature, magnetic field strength and direction, and solar wind conditions before and after the event.
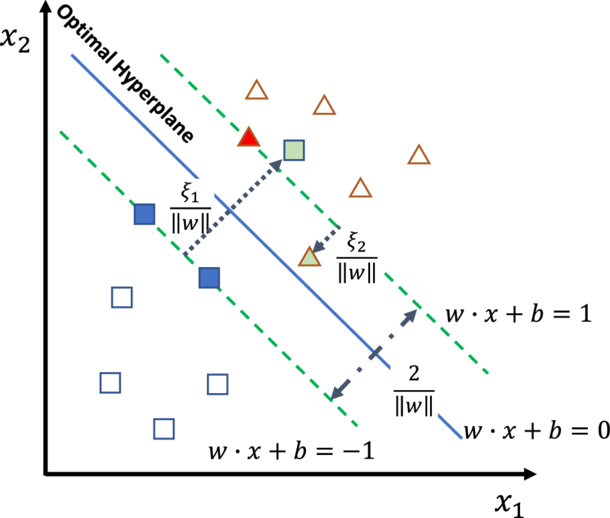
Illustration of the authors’ support vector machine framework. The optimal hyperplane is the boundary that best divides the data by maximizing the distance between the boundary and the data points nearest to it; these points are called support vectors. Square and triangle symbols represent two classes of data. Click to enlarge. [Ye et al. 2025]
Ye’s team based their framework on a support vector machine classifier: a classical machine learning algorithm that draws a mathematical boundary between groups of data while maximizing the distance between the boundary and the data points nearest to the dividing line. The support vector machine algorithm is well-suited to the task of modeling the geoeffectiveness of stream interaction regions because it doesn’t require a particularly vast dataset, can tolerate misclassified events, and allows for a physical interpretation of the results.
A Physical Interpretation
The team first reined in the model’s complexity by identifying the most important features in the dataset. They then determined which features or combination of features had the largest contribution to the output — in other words, which physical parameters most strongly determined the geoeffectiveness of the event.
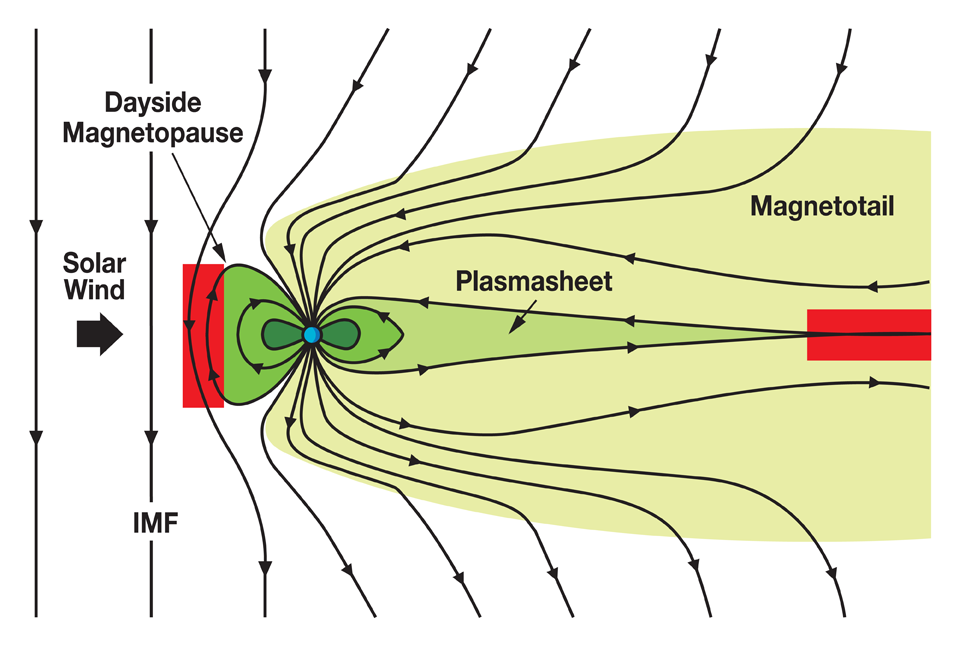
Illustration of how the interplanetary magnetic field (IMF) interacts with Earth’s magnetosphere. When the IMF points southward, as it does in this diagram, the impact on Earth’s magnetosphere is increased, with magnetic reconnection occurring in the red areas. Click to enlarge. [NASA]
Ye and collaborators found that the strongest determinants of an event’s geoeffectiveness were how long the solar wind was directed southward, the strength of the solar wind electric field, and the average and minimum strengths of the southward-pointing solar wind magnetic field. These results align with the current understanding of how energy is transferred from the solar wind to Earth’s magnetosphere through magnetic reconnection, a release of magnetic energy driven by rearrangement of magnetic fields. This shows how classical machine learning methods can enhance our ability to predict the outcome of oncoming space weather while simultaneously examining the physical drivers of the event.
Citation
“Assessing the Geoeffectiveness of Stream Interaction Regions Through Physically Interpretable Machine Learning,” Yudong Ye et al 2025 ApJ993 10. doi:10.3847/1538-4357/ae0454
The Ocean Observatories Initiative has been collecting data on physical, chemical, geological and biological conditions in the Atlantic and Pacific Oceans for the past decade
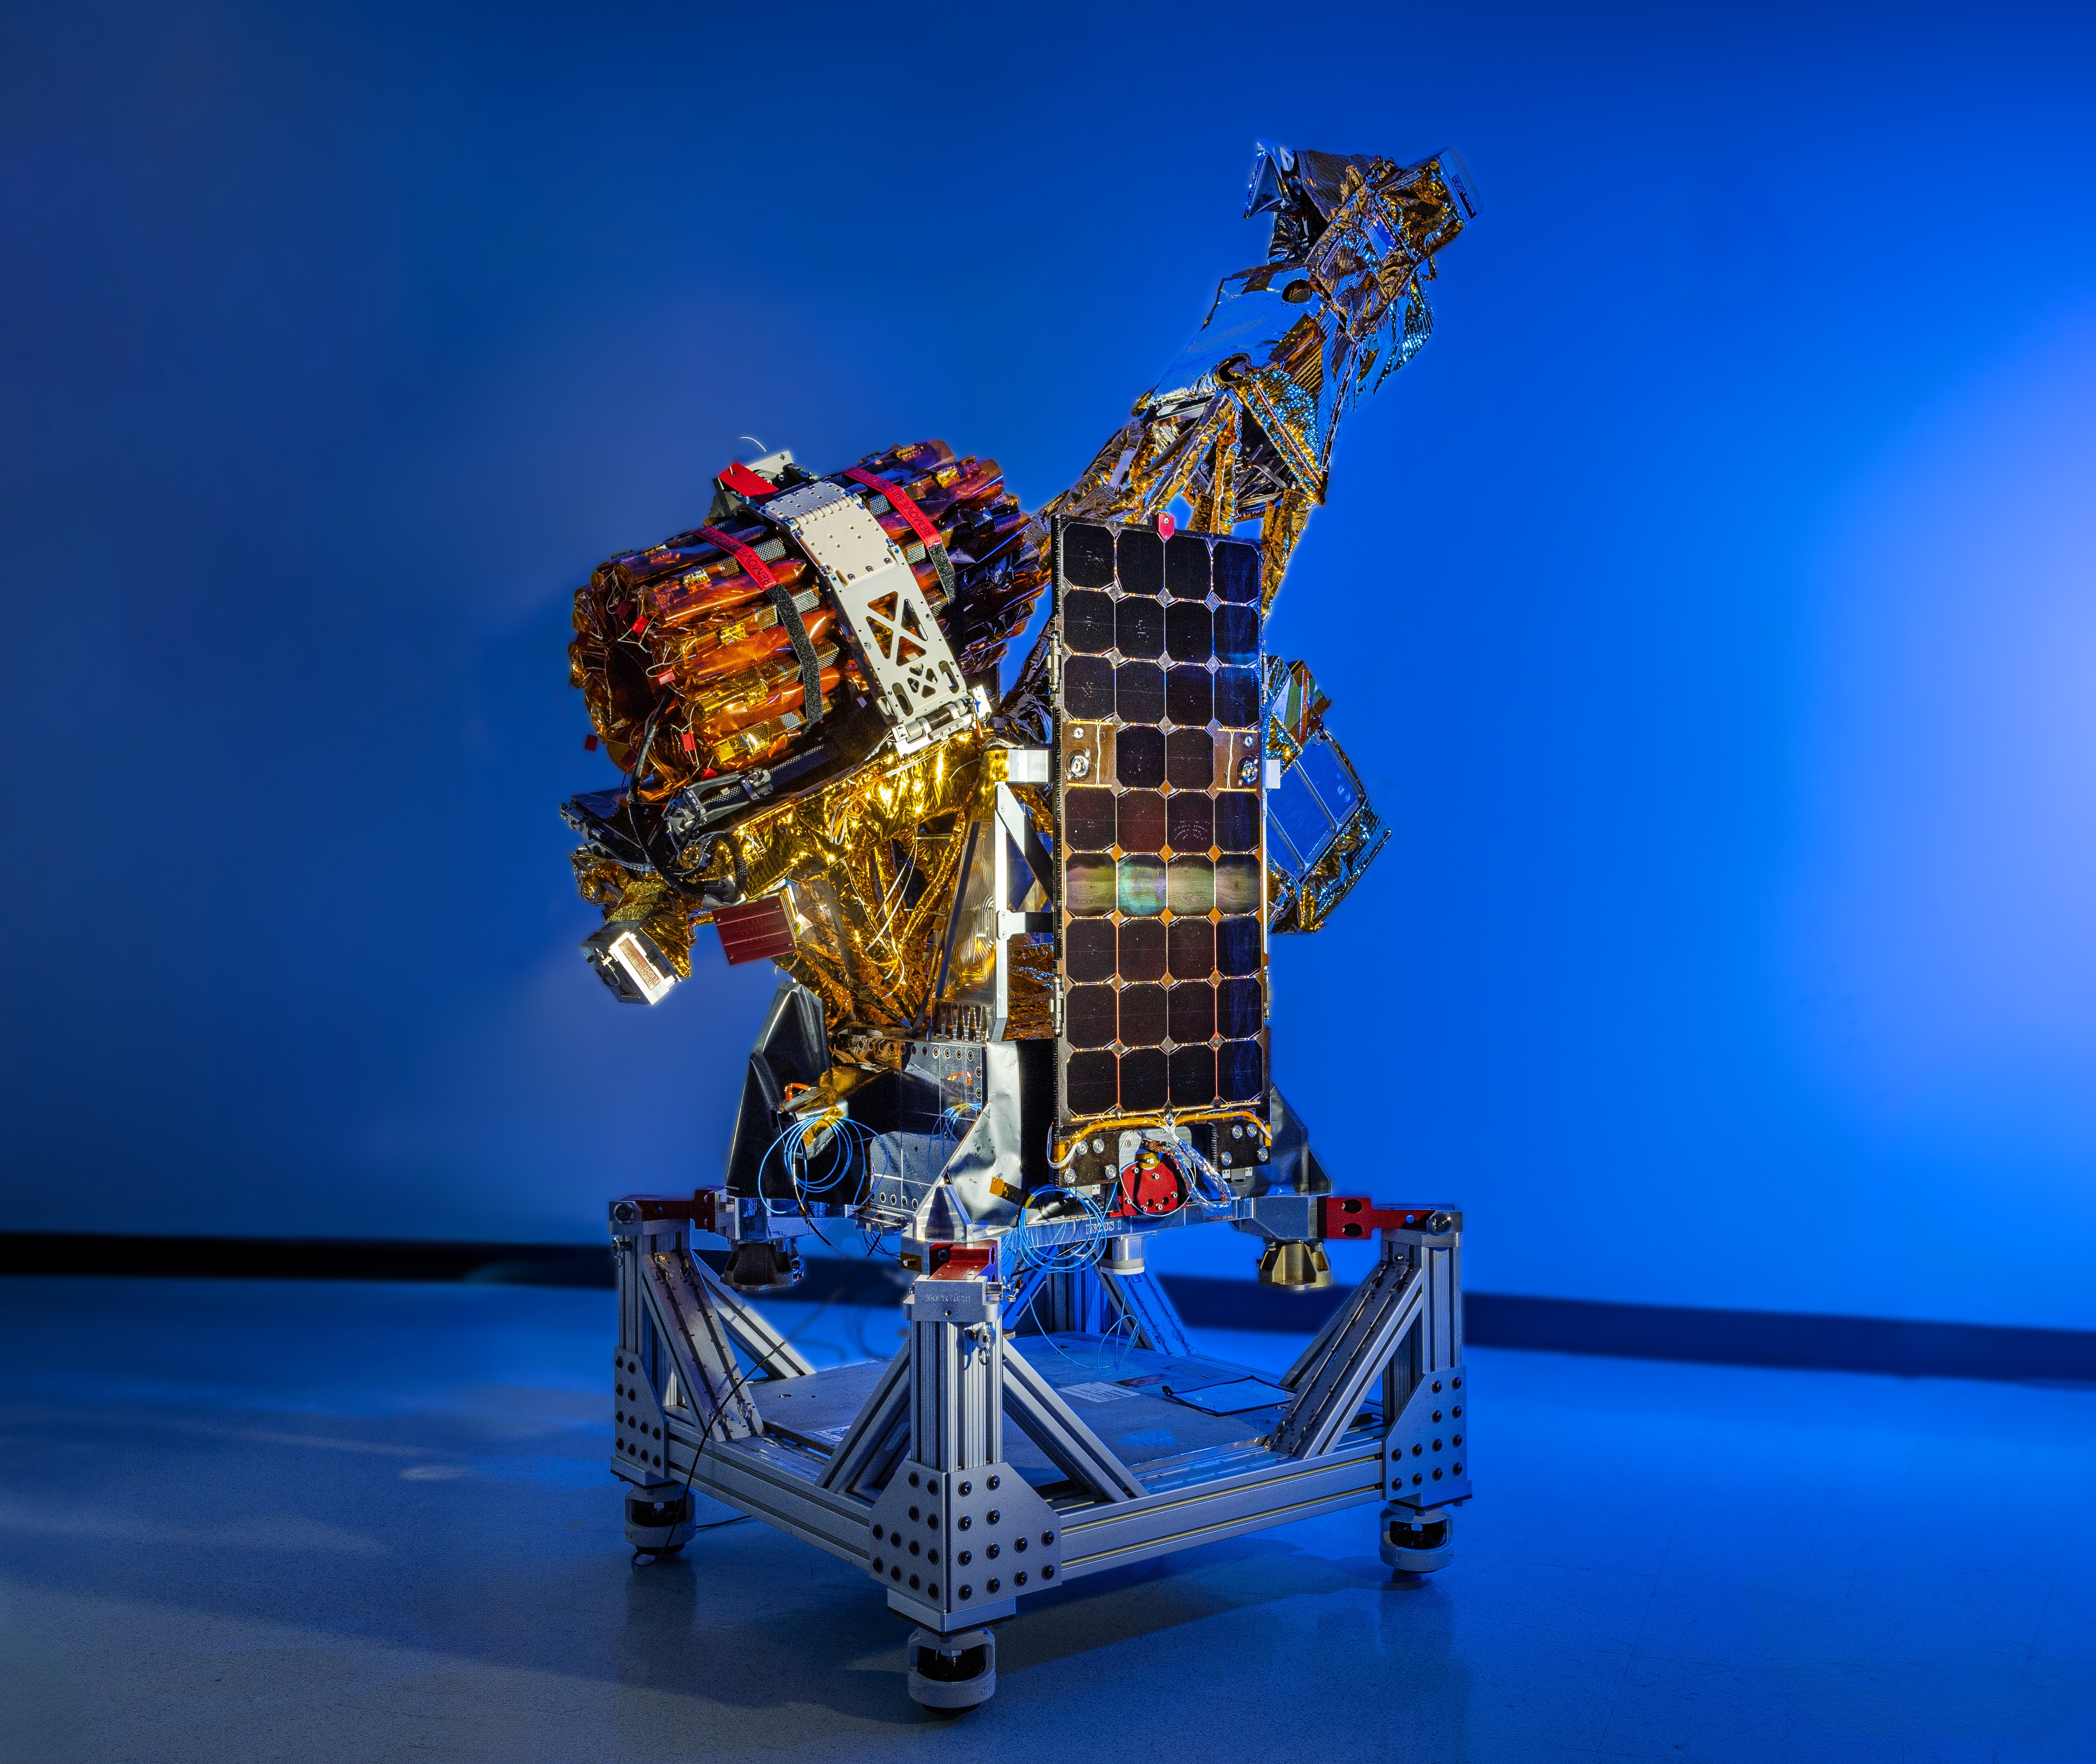
Two of the three SmallSats for NASA’s INCUS mission, including the one shown here, have completed assembly and testing in preparation for shipment to NASA’s Wallops Flight Facility in Virginia for a 2027 launch. From low Earth orbit the satellites will observe the dynamics of tropical convective storms.
Blue Canyon Technologies
Teams working on NASA’s INCUS (Investigation of Convective Updrafts) mission, the first space-based survey of the dynamics of tropical convective storms, have completed assembly and tested two of the mission’s small satellites, or SmallSats. Testing continues on the third SmallSat and is scheduled for completion no earlier than September in advance of a 2027 launch.
The three satellites will fly in tight coordination in low Earth orbit, with the first and second satellites separated by 30 seconds and the second and third satellite by 90 seconds.
Characterized by the sudden and intense lifting of large amounts of air and water, tropical convective storms provide more than half of the world’s precipitation, a crucial source of life-supporting fresh water. But they also produce severe weather, which can increase risks to life and property. The INCUS mission will help improve understanding of where, when, and why convective storms form.
Led by principal investigator Sue van den Heever of Colorado State University in Fort Collins, INCUS will use spaceborne radar instruments developed at NASA’s Jet Propulsion Laboratory in Southern California to observe the vertical motion of air and water, known as convective mass flux, as storms develop and evolve. The mission will also explore how environmental factors such as air temperature, humidity, pressure, wind speed, and wind direction correlate with that movement.
These insights will improve storm forecasting, potentially mitigating loss of life and property damage in affected communities, by helping decision-makers plan for and respond to severe weather events and manage freshwater supplies.
Teams at NASA JPL built each INCUS satellite’s radar, which were combined with a deployable mesh radar reflector made by Tendeg in Louisville, Colorado. The middle satellite also carries a microwave radiometer, also made at NASA JPL, that provides spatial context to the vertical precipitation profiles provided by the radars.
The three assemblies shipped in late 2025 and early 2026 to Blue Canyon Technologies in Lafayette, Colorado, where they were integrated with Blue Canyon’s spacecraft buses. The first two satellites, also called observatories, have successfully undergone vibration and thermal vacuum testing to ensure they will be able to withstand the jostling of launch and the extreme temperatures of space.
These two observatories also shipped to Tendeg, where teams successfully performed test deployments of the reflectors. Then they returned to Blue Canyon for additional testing. They’ll remain in storage before heading out next year to the launch site at NASA’s Wallops Flight Facility in Virginia.
Funded through the Earth Venture Mission-3 acquisition under NASA’s Earth System Science Pathfinder Program, INCUS is one of several missions fulfilling the clouds, convection, and precipitation requirements of NASA’s Earth System Observatory, a series of interconnected missions set to study our home planet’s dynamic natural systems and how they interact. The mission is also part of FALCON (Fleet for the Atmosphere Linking Commercial Observations with NASA), a fleet of atmosphere-observing satellites that will combine hardware contributions from NASA centers, universities, and commercial partners.
Warming waters decrease upwelling and lead to stress on marine microorganisms due to limited availability of vital nutrients. Red indicates the regions of highest nutrient-related stress.
Kel Elkins/NASA’s Scientific Visualization Studio
Editor’s note: This article was updated on June 5.
A new study combining NASA satellite observations, ocean surveys, and genetic testing on marine microorganisms found evidence that warming ocean waters may be limiting nutrient availability across much of the global ocean. The researchers report that this nutrient stress affects microscopic marine organisms and could influence marine ecosystems over time.
The research, published June 5 in Science Advances, tracked the condition of phytoplankton, which form the base of ocean food webs. Rather than measuring nutrients like nitrogen, iron, and phosphorus directly, the researchers inferred stress by tracking subtle shifts in the ratio of carbon to chlorophyll in phytoplankton observed from space. When the amount of chlorophyll decreases relative to carbon as seen in satellite data, it’s an indication that the plankton are stressed.
“As our ocean continues to change, the ability to observe and track ocean conditions through sustained, high quality remote sensing observations has never been more important,” said Laura Lorenzoni, Program Scientist for NASA’s Ocean Biology and Biogeochemistry Program at NASA Headquarters in Washington. “This is fundamental, as plankton communities are the base of the marine food web on which important economic activities rely.”
The research team combined two decades of data from NASA’s Aqua satellite’s Moderate Resolution Imaging Spectroradiometer (MODIS) sensor with plankton samples collected on research cruises around the world. The approach linked large-scale satellite observations with genetic markers in Prochlorococcus, a tiny but abundant marine microbe that shows signs of nutrient stress in its DNA. The result is a global map revealing where phytoplankton are thriving and where they’re struggling.
Ocean chlorophyll, as observed with NASA's Moderate Resolution Imaging Spectroradiometer (MODIS) instrument between January 2010 through May 2016.
Marit Jentoft-Nilsen/NASA's Goddard Space Flight Center
The strongest indications of nutrient stress on plankton appeared in the subtropical gyres, which are vast, relatively calm regions of the Atlantic, Pacific, and Indian oceans. In these areas, a layer of warm surface water stifles the flow of colder water from deeper in the ocean.
“When the surface of the ocean warms, it generates this very stable situation where a layer of low-density water sits on top of higher-density cold water,” said study coauthor Adam Martiny, an oceanographer at the University of California, Irvine. “You’ve probably experienced that if you’ve ever been to a lake in the summertime—it’s super warm right on the surface, and very cold deeper down when you stick your legs in.”
This layering blocks the upward flow of nutrient-rich water, limiting the availability of ocean surface nutrients that are crucial for plankton. In the South Pacific, one of the most nutrient-poor regions, a layer of warm surface water contributed to nitrogen and iron shortages, producing the most severe nutrient-related stress that the team discovered.
But the researchers were surprised to find that parts of the North Atlantic experience less nutrient stress than expected. Although there was evidence of a lack of phosphorus, the impact on microorganisms was comparatively mild.
That difference may reflect the biology of the organisms themselves. Phytoplankton can partially compensate for phosphorus shortages by recycling phosphorus more efficiently or replacing phosphorus-rich molecules inside their cells. Nitrogen shortages are harder to overcome because nitrogen is crucial for the proteins and cellular machinery required for photosynthesis and nutrient uptake.
The study revealed that nutrient stress is strongly correlated with seasons and major weather cycles such as El Niño and the Pacific Decadal Oscillation, which lead to warming waters in the Pacific Ocean. During La Niña events, which cool water over a large part of the Pacific, stronger upwelling brought more nutrients to surface waters and reduced stress in some regions. Superimposed on those multi-year cycles, however, was a longer-term trend.
From 2002 through 2021, average sea-surface temperatures increased across nearly 90% of the ocean area examined in the study. Over the same period, nutrient stress generally intensified, consistent with previous hypothesis that warming oceans may become increasingly stratified and less able to replenish surface nutrients.
In many nutrient-poor regions of the Southern Hemisphere, however, the researchers found evidence that nutrient stress had not increased as much as expected despite significant warming. They suspect that microbes capable of capturing nitrogen from the air may partially offset the effects of reduced nutrient mixing.
That finding hints that marine ecosystems may possess more resilience to warming climates than some models predict. It also underscores the complexity of forecasting how ocean biology will respond to continued warming.
“We have two really powerful tools,” said study coauthor Michael Behrenfeld, a biochemist with Oregon State University in Corvallis, Oregon. The tools include satellite observations and cellular studies. “Both produce big data sets, but they are kind of opposites. We have very detailed data about microscopic phytoplankton … and then we have global coverage with satellites.”
By combining satellites that monitor the entire ocean with genetic clues carried inside microscopic plankton, the researchers say they are gaining a new way to track biological responses to changing environmental conditions near real time.
NASA-Funded Study Shows Wildfire Smoke’s Hidden Ozone Toll
Canadian wildfire smoke carried carbon monoxide — a building block of ground-level ozone — thousands of miles downwind in June 2023.
Credits: NASA’s Goddard Space Flight Center
Wildfire smoke is stoking a new challenge for cleaner air. A NASA-supported study published Thursday found that, over the last decade, wildfires have worsened ground-level ozone pollution across much of the contiguous United States, creating unhealthy air far from active flames.
Wildfires have become an increasingly important contributor to ground-level ozone, or smog, across much of the United States, researchers report June 4 in the journal Science. Nationally, fires offset nearly four years’ worth of ozone-control gains, with larger setbacks in the West and Midwest.
Smoke often is associated with the soot, ash, and other fine particles that make the air look hazy. But wildfires also emit gases such as carbon monoxide, which can help form surface ozone in sunlight when other pollutants are present. Surface ozone is an invisible pollutant harmful to human health, plants, and crops. As smoke plumes travel and mix with other pollution, those reactions can drive ozone increases hundreds or even thousands of miles from active fires.
“NASA Earth observations, along with ground monitoring networks, help reveal air quality risks from wildfires that can cross state lines, giving air quality managers better decision-making information as wildfire smoke affects more communities,” said John Haynes, manager of NASA Earth Action’s Health and Air Quality program at the agency’s Headquarters in Washington. “This is a strong example of NASA science serving communities here in the U.S.”
Building a clearer ozone picture
High in the atmosphere, ozone shields Earth from harmful ultraviolet radiation. Near the ground, however, ozone can irritate lungs, worsen asthma and other respiratory diseases, and increase health risks for children, older adults, outdoor workers, and people with existing health conditions.
To track surface ozone changes, researchers turned to deep learning, a form of artificial intelligence that finds patterns across large datasets. They used it to build a first-of-its-kind dataset estimating daily surface ozone from 2003 to 2024 on a kilometer-by-kilometer grid — about 0.6 miles on each side — across the contiguous U.S. The work received support from NASA’s Health and Air Quality program and other NASA grants.
The scientists combined data from about 1,000 ground-based air quality stations with atmospheric model data, weather information, wildfire pollution data, and satellite-derived information, including products from the Visible Infrared Imaging Radiometer Suite (VIIRS) and the Moderate Resolution Imaging Spectroradiometer (MODIS) instruments.
Smoke from Canada’s 2023 wildfires spread across North America. Tan to deep red colors show smoke intensity, estimated from black carbon in NASA’s GEOS-FP model.
NASA’s Scientific Visualization Studio (SVS) and NASA’s Global Modeling Assimilation Office (GMAO)
Their analysis revealed two distinct periods. From 2003 to 2015, U.S. ground-level ozone generally declined as emissions of ozone-forming pollutants decreased. After 2015, however, those gains slowed or reversed in many places. By comparing estimated ozone levels with scenarios that removed wildfire influence, the researchers found that pollution from wildfires was a main factor in that shift.
Without the wildfire contribution, ground-level ozone in the Midwest, for example, would likely have continued to decline. Instead, wildfires erased about 5.3 years’ worth of ozone-control progress since 2015.
“People in the Midwest may think fires burning far away will not affect them,” said the study’s corresponding author Jun Wang, an atmospheric scientist at the University of Iowa in Iowa City. “But once wildfire pollution is in the air, it can move across regions. Pollution from one place can affect air quality in another.”
Measuring the health toll
The study also found that wildfire-driven ozone increased exposure to unhealthy air and likely contributed to premature deaths. Premature deaths associated with long-term wildfire-related ozone exposure in the U.S. increased by an estimated 318 deaths per year after 2013, with the post-2013 average 46% higher than in the previous decade. The researchers calculated premature deaths using average lifespan, ozone exposure estimates, and population density.
The 2023 Canadian wildfires showed how widely those risks can spread, with smoke-driven ozone increases stretching across the Midwest and into parts of the Northeast and South. Overall, from 2022 to 2024, wildfires exposed an additional 43 million people in the U.S. to conditions that did not meet current federal air quality standards for ozone, the researchers estimated.
Capturing that national picture is difficult from ground monitors alone. Ground monitors remain the backbone of U.S. air quality tracking, but they do not cover every community. NASA’s scientifically validated satellite observations and models help researchers and agencies see air quality patterns across states, regions, and fire seasons.
That broader air quality work includes newer missions such as TEMPO (Tropospheric Emissions: Monitoring of Pollution). Launched in 2023, TEMPO is NASA’s first mission to use a space-based spectrometer to provide hourly daytime measurements of air quality over North America. Its view is sharp enough to distinguish pollution patterns, including surface ozone, across areas only a few square miles wide, a major improvement over earlier satellites.
Together, these capabilities help researchers and agencies see smoke-related ozone patterns that might otherwise be harder to detect, especially in rural and remote areas.
The work also points toward a practical use of NASA science during fire season. Wang’s team has used NASA support to develop FireAQ, a decision-support system that brings satellite observations, model forecasts, and fire and aerosol products into weekly briefings with state and local air quality officials. The goal is to help officials see where smoke-related pollution may move next and give communities better information.
Typhoon Jangmi dazzled from space with a giant swirling eye while drenching parts of Japan with heavy rain. From late May into early June 2026, Typhoon Jangmi slowly tracked north-northwest across the Philippine Sea on a path toward southern Japan. Although the storm moved at a relatively slow pace, it spread intense rainfall across a [...]
A rapidly intensifying super typhoon sent giant atmospheric ripples skyward, revealing a hidden connection between extreme weather and near-space. In April 2026, Super Typhoon Sinlaku swept across the North Pacific, bringing torrential rain and flooding to parts of the Mariana Islands. The storm intensified into a “violent typhoon,” the highest category used by the Japan [...]
Sweden’s celebrated wolverine recovery program is losing momentum, raising concerns about the future of one of the world’s most famous conservation success stories. A conservation program once praised as a global model for helping people and wildlife coexist may be losing its effectiveness because of decades of inadequate government support, according to new research. In [...]
A volcano that erupted after being asleep for more than 100,000 years is leading more volcanologists to say we must redefine volcano activity to ensure eruptions don't surprise us.
Seeds from the last surviving wild Dendroseris neriifolia tree are now stored in Kew Gardens' Millennium Seed Bank as researchers work to find ways to reintroduce the species into the wild.
A new study finds mangrove forests are no longer shrinking worldwide, offering hope for coastal protection and climate resilience. But other research warns sea level rise could reduce their ability to store carbon.
A rainbow blanket of patchwork colors sprawls across South Africa in this new composite image created using data from NASA's latest Earth-observing mission.
The Northwest Africa (NWA) 12774, an angrite meteorite discovered in the Sahara Desert, likely in Mauritania, appears to be a fragment of a vanished protoplanet, offering the strongest evidence yet that a large planetary body formed and was later destroyed during the Solar System’s chaotic infancy.
The COVID-19 pandemic and “safe and effective” vaccines are lies propagated by governments and “experts”. Many widely accepted scientific beliefs are false narratives based on Satan’s lies. Spiritual deception underlies many societal misconceptions. We must return to the foundation of biblical truths from creation to what is real science.

 Login