❌

Normal view

NASA’s Moon Orbiter Spots New, ‘Once-in-Century’ Moon Crater

16 September 2026 at 19:06
6 Min Read

NASA’s Moon Orbiter Spots New, ‘Once-in-Century’ Moon Crater

Black-and-white image of a textured, cratered surface. Two black arrows near the center point inward toward a small, dark, circular feature.
A zoomed-in view of the Moon made from images from NASA’s Lunar Reconnaissance Orbiter Camera. (More information at the bottom of article.)
Credits: NASA Goddard/Intuitive Machines/Robert Wagner

It started as a routine data-quality check. But as Robert Wagner, a scientist with NASA’s Lunar Reconnaissance Orbiter (LRO), scanned a giant Moon map on his computer screen, an unusually large bright spot circled by a dark halo caught his eye, as it implied that surface material in that area had been shaken up.

“I just stopped, dropped everything, and started looking into what that spot was,” said Wagner, an image-processing specialist from Intuitive Machines who works with data from the Lunar Reconnaissance Orbiter Camera (LROC) system.

By comparing before and after images of the Moon, Wagner realized he had discovered the largest, newly formed crater ever found in the solar system, as scientists reported Wednesday in Science Advances. This discovery highlights the value of NASA’s Moon orbiter data in studying a dynamic landscape as the agency advances a sustained human presence and expanded scientific and commercial activity on the Moon.
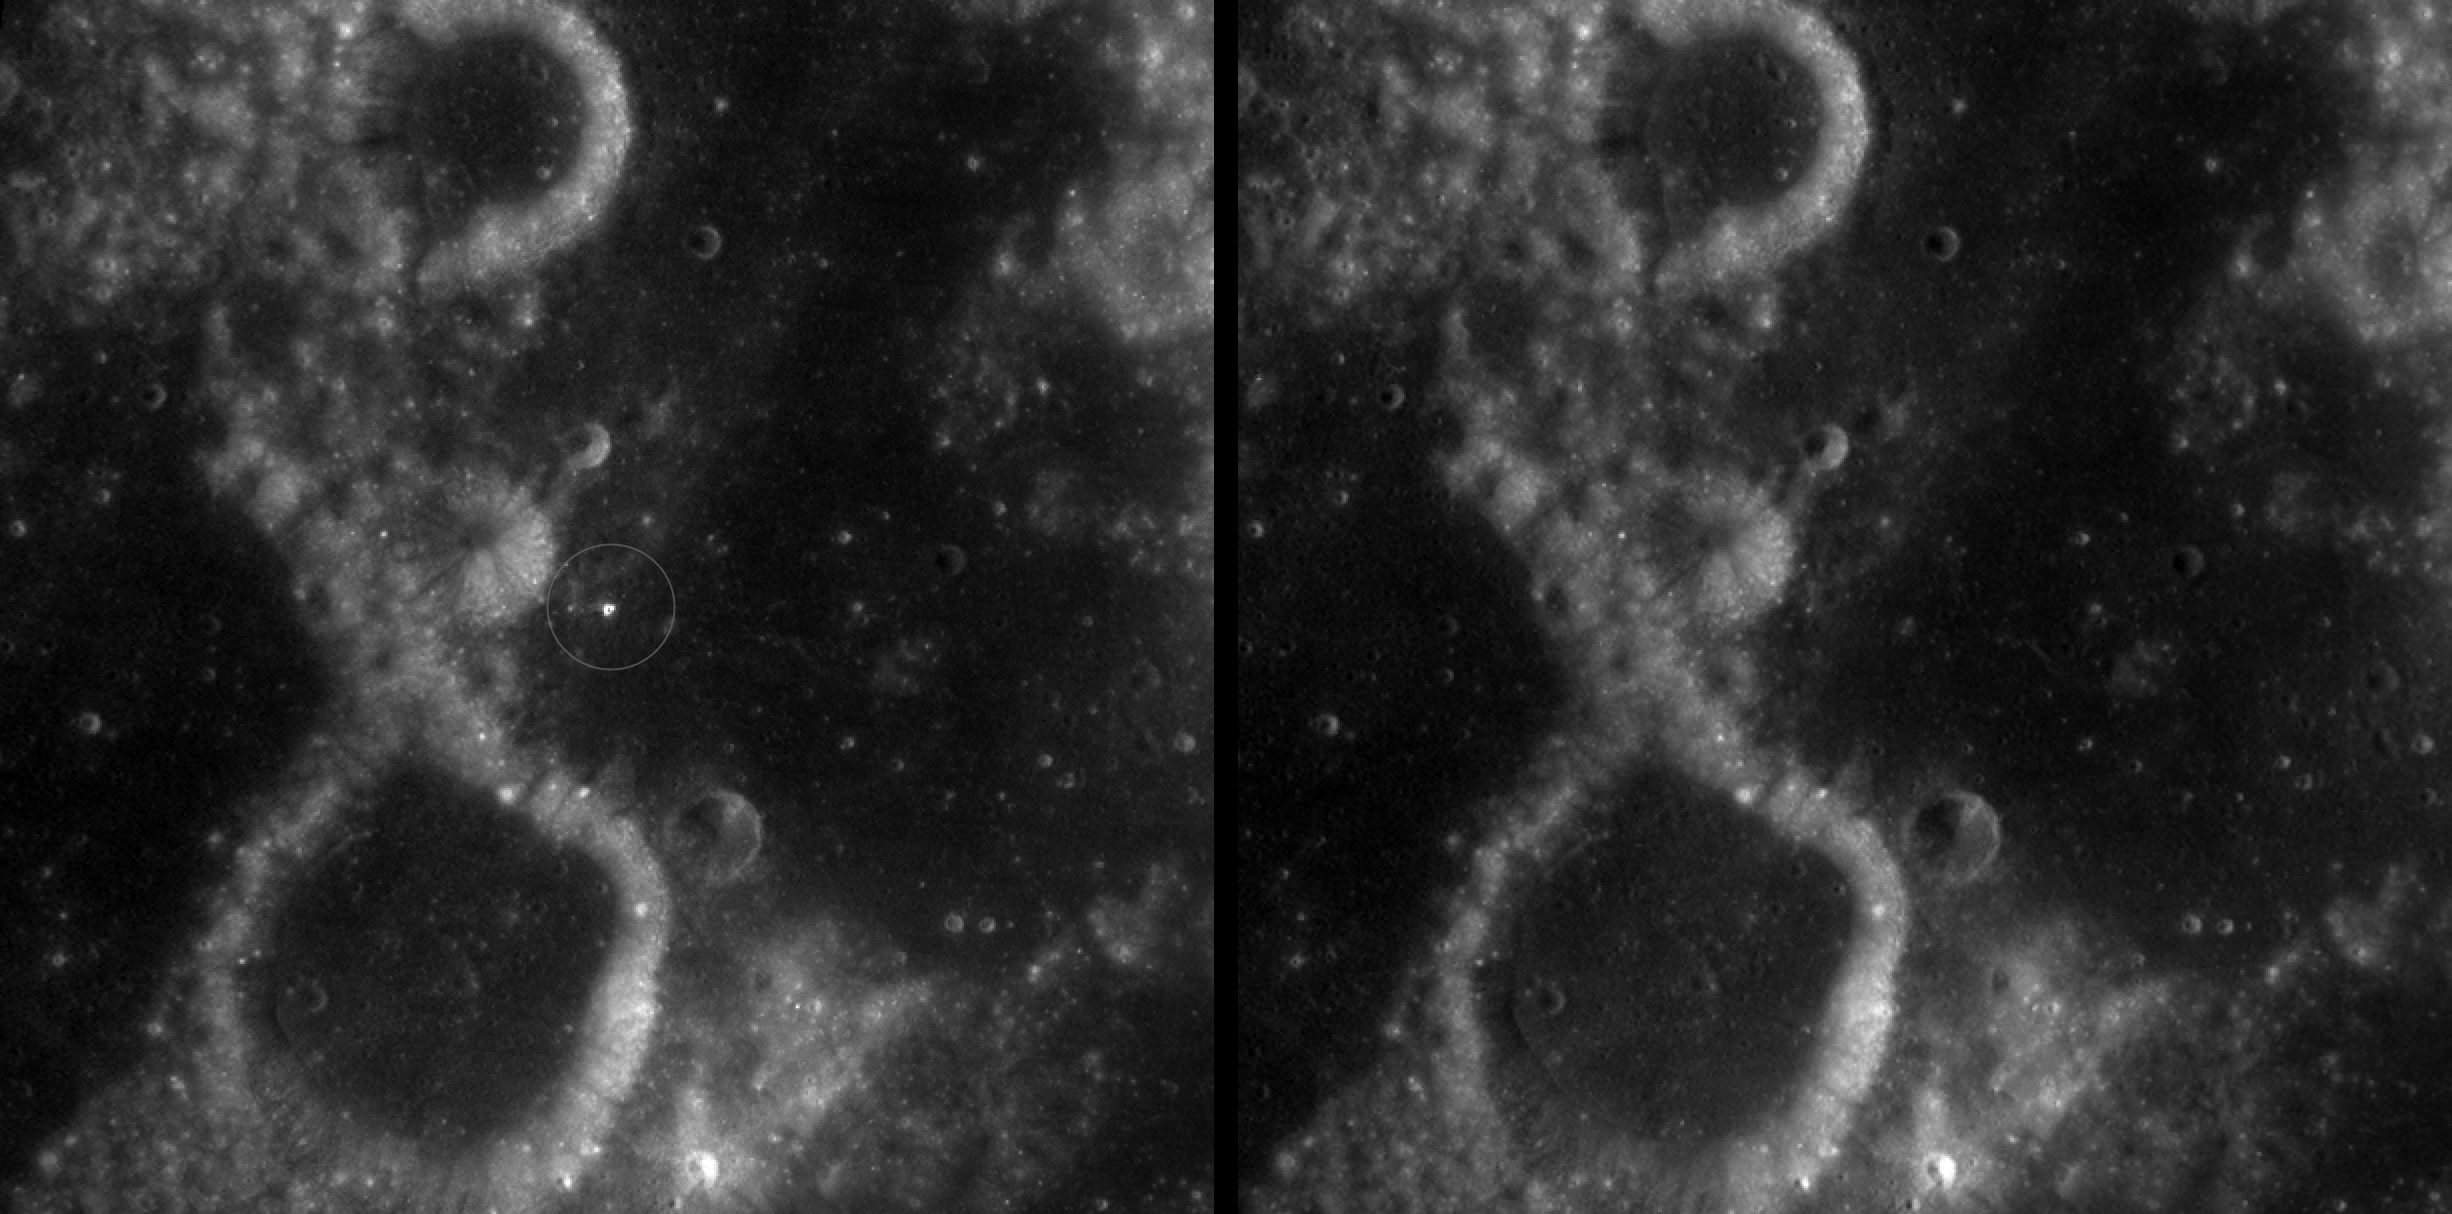
Two nearly identical black-and-white images appear side by side, separated by a vertical black line. Each shows a dark, uneven surface with scattered small circular depressions and several larger round formations with bright, raised rims. In the left image, a thin white circle marks a small, white spot near the center; there is no circled, white spot in the the corresponding area in the right image.
A zoomed-in view of McGetchin crater, circled on the left, next to a “before” image on the right. The panel on the left is made from images captured by NASA’s Lunar Reconnaissance Orbiter Wide-Angle Camera in summer 2025; the right panel was made from images taken in spring 2011. The white spot is not the crater itself, but rather material flung out of the crater, which formed when a rock, possibly this size of a three- to six‑story building, crashed into the Moon between April 11 and May 22, 2024 – a once-in-a-century event, as scientists reported on Sept. 15, 2026, in a pair of papers in Science Advances. The area shown in the images is 38 miles wide.
NASA Goddard/Intuitive Machines/Robert Wagner

Officially named McGetchin after pioneering lunar scientist Tom McGetchin, the crater formed on the Moon’s eastern edge sometime between April 11 and May 22, 2024, after a comet or asteroid the size of a three- to six-story building hit the surface.
 
The crash left a crater, 728 feet wide, that spans the length of two football fields. And at 141 feet deep, the crater could fit three vertically stacked yellow school buses.
 
Scientists estimate that an impact of this magnitude happens on the Moon about once in a century or even longer.

Moon takes some hits

For more than 17 years, LRO has been circling the Moon and using its seven instruments to map the topography, surface composition, temperature, and radiation environment there. The spacecraft’s team has identified at least 1,000 new impact craters throughout the mission and flagged 100,000 more surface changes from an object smashing into the Moon or from the debris that flung out after.

With no atmosphere to slow them or burn them up, space rocks and other objects easily reach the lunar surface. Most are much smaller compared to the object that carved out McGetchin crater. The smallest craters scientists can distinguish from LRO images are about 30 feet wide, the length of a three-story building laid on its side, made by rocks about 43 inches wide, the size of a monster-truck tire. Scientists estimate that impacts of this scale produce about 140 new craters across the Moon each year. But most new ones are made by microscopic projectiles that leave holes too small to identify in orbital images.

With its numerous instruments, the spacecraft can observe changes to the lunar surface that aren’t apparent in the LROC images alone. After the crater was discovered, scientists working with LRO’s thermal instrument, Diviner, made follow-up observations of the site. They found a 4-mile-wide area around the crater that is about 16 degrees Fahrenheit cooler at night than its surroundings.
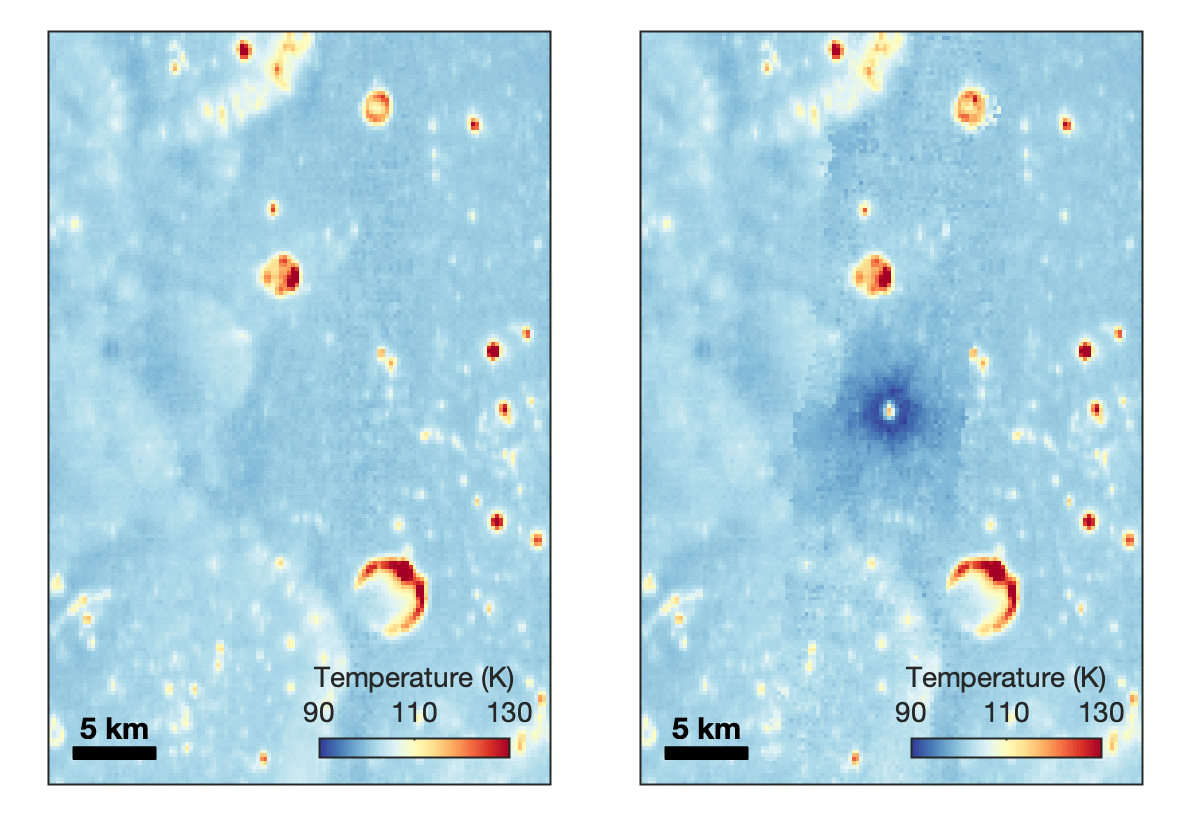
Animated temperature map that alternates between two images. A vertical strip through the center blinks on and off, revealing a dark blue circular area surrounding a small white spot near the middle. The pale blue map also contains scattered yellow, orange, and red spots and rings, including a large, curved red-and-yellow feature near the lower center. A 5-kilometer scale bar appears at lower left, and a color key ranges from 90 kelvin in dark blue to 130 kelvin in dark red.
This animated image set shows an area on the eastern limb of the Moon before and after McGetchin crater formed there sometime between April 11 and May 22, 2024. The post-impact image was constructed using data taken by NASA’s Lunar Reconnaissance Orbiter (LRO) thermal instrument, Diviner, between Nov. 15, 2025, and Feb. 18, 2026, after scientists discovered the crater in visible-light images taken by LRO’s Wide-Angle Camera. Pre-impact temperatures are from the Diviner Global High-Resolution Mosaics (GHRM). The crater formed on the Moon after a comet or asteroid, possibly the size of a six-story building, hit the surface in a rare, once-in-a-century collision. The dark blue strip that flashes into view reveals a 4-mile-wide “cold spot” around the crater that is about 16 degrees Fahrenheit cooler at night than its surroundings. This cooling happens because an impact fluffs up regolith around a crater, making it less dense and therefore less able to retain heat. Scientists on the Diviner team reported this finding in a paper published on Sept. 16, 2026, in Science Advances. The red and yellow spots indicate areas typically associated with rocks excavated by long-ago impacts which, though still at cryogenic temperatures like their surroundings, remain slightly warmer at night.
NASA Goddard/UCLA/JHU APL

Reporting in a second paper Wednesday in the same journal, researchers say that the cooling happens because the impact fluffs up the regolith around the crater, making it less dense and therefore less able to retain heat.

The large extent of this “cold spot” is striking, scientists say, because it shows that impacts can modify the Moon’s surface far beyond the crater itself. These physical changes could affect how rover wheels interact with the surface, for instance.
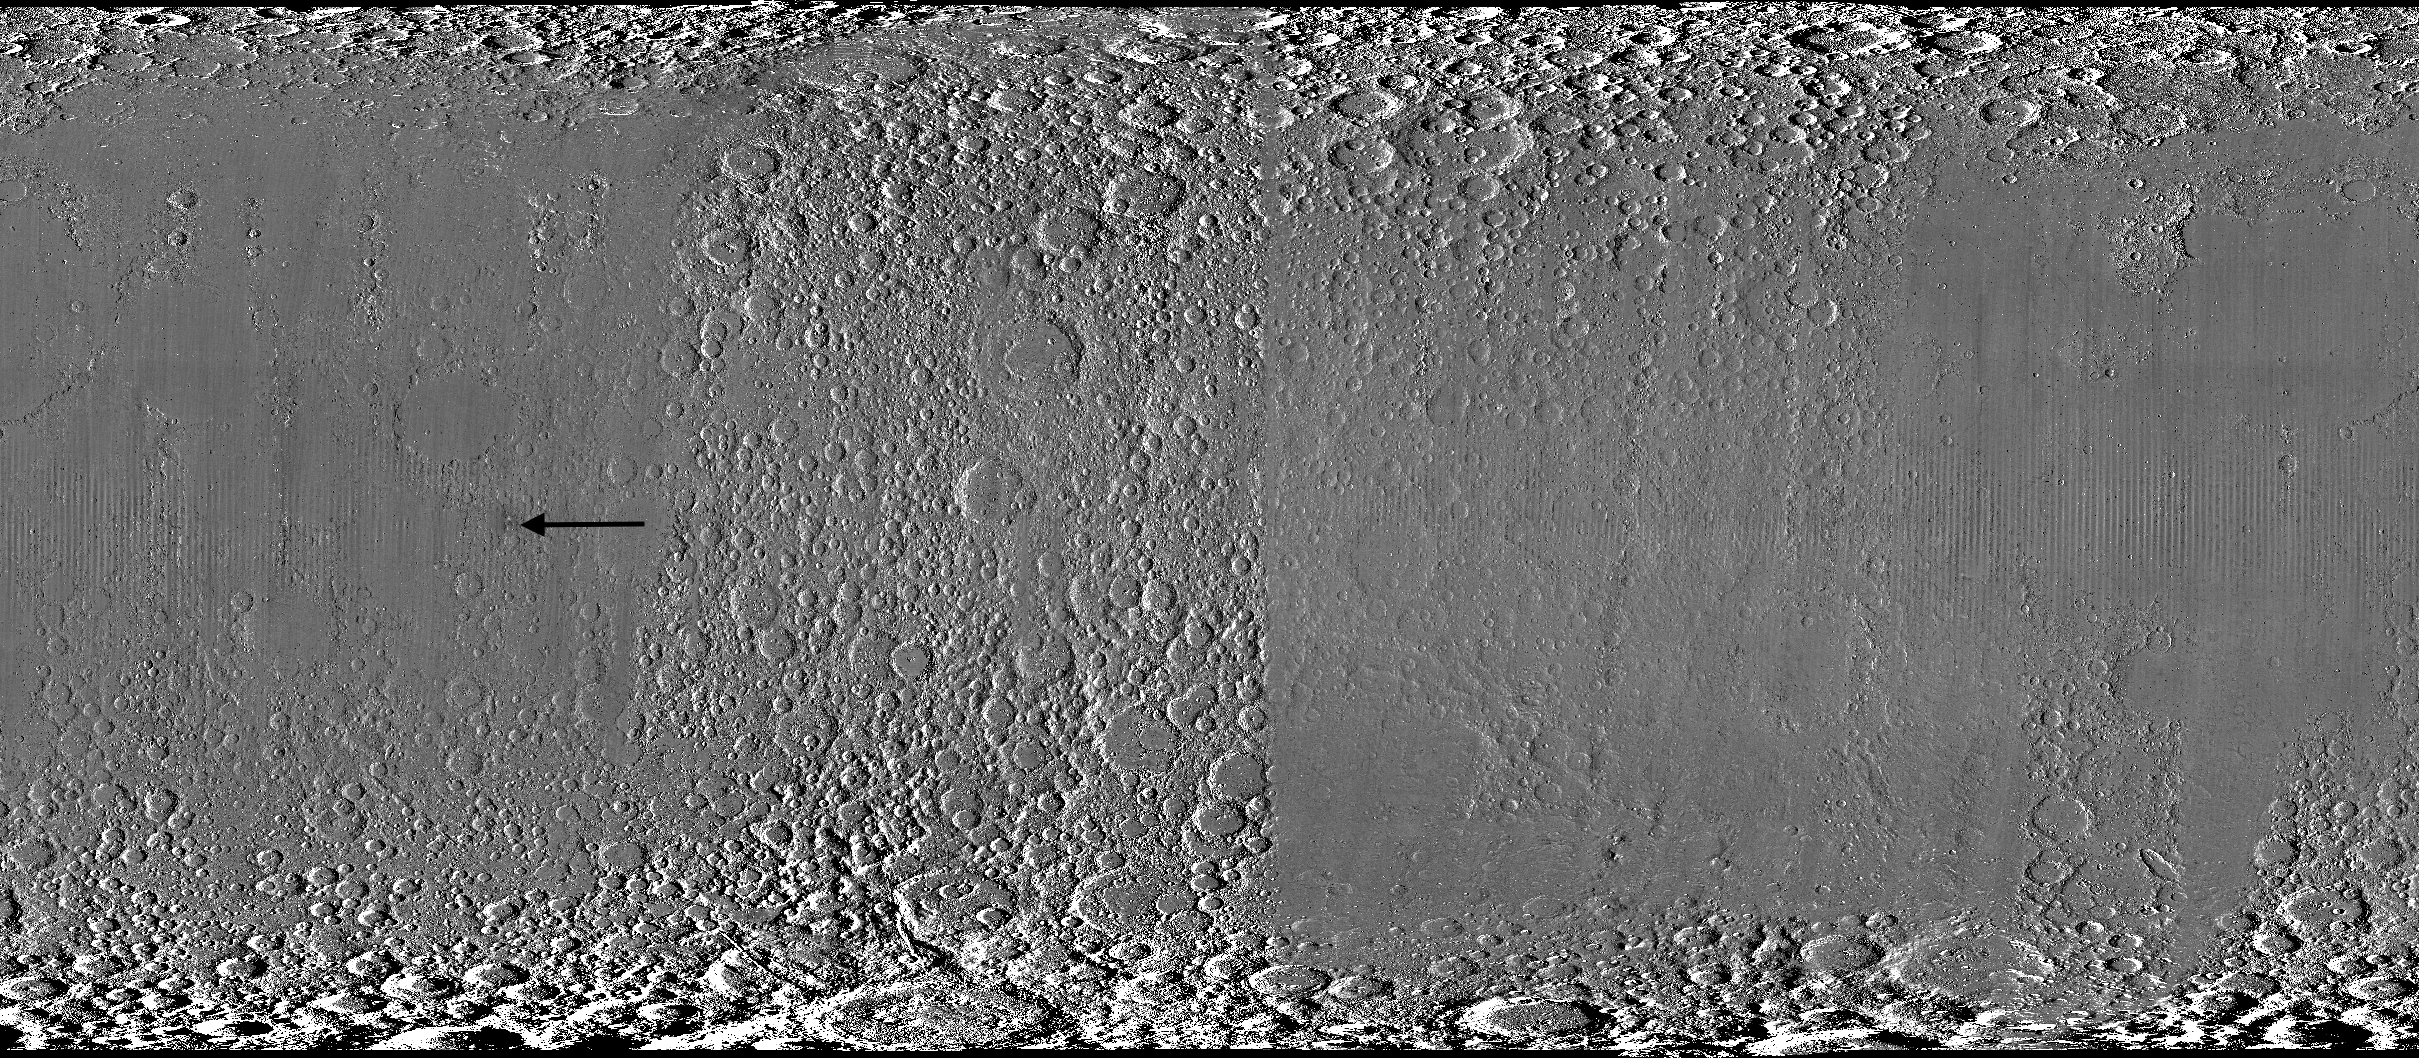
Wide black-and-white image of a rough, uneven surface densely covered with circular depressions and raised areas. The upper and lower edges are especially rugged, while the center is smoother and divided by subtle vertical bands. A black arrow left of center points toward a faint, narrow vertical mark.
A global view of the Moon made by stitching together hundreds of images from the Wide-Angle Camera aboard NASA’s Lunar Reconnaissance Orbiter (LRO). Robert Wagner, image processing specialist for LRO, made this map using two sets of mages taken several years apart. He used a software designed to highlight any changes between the two sets. Anything that stayed the same turned gray; anything different showed up as bright or dark patches. A black arrow just left of center points to McGetchin crater.
NASA Goddard/Intuitive Machines/Robert Wagner

Road to discovery

The LROC system collects images from about 60 miles above the Moon as LRO loops from pole to pole. The system includes two cameras that capture high‑resolution black‑and‑white images and one camera for moderate‑resolution multispectral images. Over the years and thousands of passes, scientists have built maps detailed enough to spot not only new craters, but also landslides, landers, seismic faults, and even hints of lava tubes.

LROC scientists regularly analyze close-up images of small portions of the Moon’s surface taken by the Narrow-Angle Camera. Using these images, they look for changes that are typically less than 30 feet across. But every few years the team searches for large (wider than 150 feet) features by creating global Moon maps and comparing them to older versions.

Square black-and-white image of a dark, uneven surface. At the center is a dark, roughly circular depression surrounded by a bright irregular area, with long streaks of lighter material radiating outward in all directions.
An overhead, close-up view of McGetchin crater that was taken on Dec. 5, 2025, by NASA’s Lunar Reconnaissance Orbiter (LRO) Narrow-Angle Camera (NAC). After the crater was discovered on Oct. 24, 2025, in global images from LRO’s Wide-Angle Camera, which captures broad views with pixels the size of American football fields, scientists turned to the NAC, which takes much sharper views at about 3 feet per pixel. The NAC images, taken as LRO flew over the impact site again, revealed the crater size, shape, and how the surrounding terrain was affected by the impact that carved McGetchin. The image covers an area that’s ¾ mile wide.
NASA Goddard/Intuitive Machines
Square black-and-white image of a dark, gently uneven surface scattered with small circular depressions. Near the center is a small oval crater with a bright raised rim and dark interior. Fine, bright streaks radiate outward from the crater across the surrounding surface.
This view from the side (55° away from straight down) towards the east, covers an area of the Moon that’s about 1.5 miles wide. It was taken by NASA’s Lunar Reconnaissance Orbiter Narrow-Angle Camera on March 3, 2026.
NASA Goddard/Intuitive Machines

That’s what Wagner was doing on Oct. 24, 2025, when he came across McGetchin. Using images from LROC’s Wide-Angle Camera, which captures broad views with pixels the size of football fields, he stacked hundreds of “before” and “after” frames with software designed to highlight change. Anything that stayed the same turned gray while anything different showed up as bright or dark patches.

While the process sounds straightforward, spotting real craters requires a lot of manual work. The software flags every tiny shift in lighting or shadow, generating hundreds of false alarms. For this reason, Wagner typically verifies the software, looking for small fuzzy halos around pixel‑wide bright points, which indicate splashes of regolith around a new crater.

Spanning hundreds of pixels, McGetchin stood out immediately. “It was by far the most obvious impact debris pattern I’ve ever seen in one of these images,” Wagner said.

After his discovery, scientists turned to the Narrow-Angle Camera, which takes much sharper views at about 3 feet per pixel. This camera’s close-up images, taken as LRO flew over the impact site again, revealed the crater size, shape, and how the surrounding terrain was affected. These images also helped researchers estimate the size and force of the rock fragment that formed the new crater, details that are expected to appear in a future paper.

Banner image caption: A zoomed-in view of the Moon, with debris around McGetchin crater visible as a white spot circled by a dark halo just right of center of the image (marked with black arrows). This is the view that Robert Wagner saw on Oct. 24, 2025, during a routine data-quality check. Wagner is an image processing specialist for NASA’s Lunar Reconnaissance Orbiter Camera, a system of three cameras. Using images from the Wide-Angle Camera (WAC), which captures broad views with pixels the size of American football fields, he stacked hundreds of images captured by WAC over the last several years with software designed to highlight change. Anything that stayed the same is gray; anything that changed showed up as bright or dark patches. The stripes in the image are due to slight changes in lighting between the older and newer images. This image composite shows an area of the Moon approximately 900 miles across.

About the Author

Lonnie Shekhtman

Lonnie Shekhtman

Senior Science Writer

Shekhtman helps communicate NASA planetary science to the world through news and feature stories on NASA.gov, videos for NASA+ and YouTube, and by working with the media. She reports on lunar and Mars science and exploration; NASA's search for life; missions to Venus, Titan, and Jupiter's Trojan asteroids; and many other topics related to NASA's exploration of our solar system and beyond.

Keep Exploring

Discover More Topics From NASA

Simplified Summary

Scientists discovered a crater on the Moon that formed sometime between April 11 and May 22, 2024, after a comet or asteroid the size of a three- to six-story building hit the surface.   The crash left a crater, 728 feet wide, that spans the length of two football fields. And at 141 feet deep, the crater could fit three vertically stacked yellow school buses.

The post NASA’s Moon Orbiter Spots New, ‘Once-in-Century’ Moon Crater appeared first on NASA Science.


NASA’s Moon Orbiter Spots New, ‘Once-in-Century’ Moon Crater

16 September 2026 at 19:06
6 Min Read

NASA’s Moon Orbiter Spots New, ‘Once-in-Century’ Moon Crater

Black-and-white image of a textured, cratered surface. Two black arrows near the center point inward toward a small, dark, circular feature.
A zoomed-in view of the Moon made from images from NASA’s Lunar Reconnaissance Orbiter Camera. (More information at the bottom of article.)
Credits:
NASA Goddard/Intuitive Machines/Robert Wagner

It started as a routine data-quality check. But as Robert Wagner, a scientist with NASA’s Lunar Reconnaissance Orbiter (LRO), scanned a giant Moon map on his computer screen, an unusually large bright spot circled by a dark halo caught his eye, as it implied that surface material in that area had been shaken up.

“I just stopped, dropped everything, and started looking into what that spot was,” said Wagner, an image-processing specialist from Intuitive Machines who works with data from the Lunar Reconnaissance Orbiter Camera (LROC) system.

By comparing before and after images of the Moon, Wagner realized he had discovered the largest, newly formed crater ever found in the solar system, as scientists reported Wednesday in Science Advances. This discovery highlights the value of NASA’s Moon orbiter data in studying a dynamic landscape as the agency advances a sustained human presence and expanded scientific and commercial activity on the Moon.

Two nearly identical black-and-white images appear side by side, separated by a vertical black line. Each shows a dark, uneven surface with scattered small circular depressions and several larger round formations with bright, raised rims. In the left image, a thin white circle marks a small, white spot near the center; there is no circled, white spot in the the corresponding area in the right image.
A zoomed-in view of McGetchin crater, circled on the left, next to a “before” image on the right. The panel on the left is made from images captured by NASA’s Lunar Reconnaissance Orbiter Wide-Angle Camera in summer 2025; the right panel was made from images taken in spring 2011. The white spot is not the crater itself, but rather material flung out of the crater, which formed when a rock, possibly this size of a three- to six‑story building, crashed into the Moon between April 11 and May 22, 2024 – a once-in-a-century event, as scientists reported on Sept. 15, 2026, in a pair of papers in Science Advances. The area shown in the images is 38 miles wide.
NASA Goddard/Intuitive Machines/Robert Wagner

Officially named McGetchin after pioneering lunar scientist Tom McGetchin, the crater formed on the Moon’s eastern edge sometime between April 11 and May 22, 2024, after a comet or asteroid the size of a three- to six-story building hit the surface.
 
The crash left a crater, 728 feet wide, that spans the length of two football fields. And at 141 feet deep, the crater could fit three vertically stacked yellow school buses.
 
Scientists estimate that an impact of this magnitude happens on the Moon about once in a century or even longer.

Moon takes some hits

For more than 17 years, LRO has been circling the Moon and using its seven instruments to map the topography, surface composition, temperature, and radiation environment there. The spacecraft’s team has identified at least 1,000 new impact craters throughout the mission and flagged 100,000 more surface changes from an object smashing into the Moon or from the debris that flung out after.

With no atmosphere to slow them or burn them up, space rocks and other objects easily reach the lunar surface. Most are much smaller compared to the object that carved out McGetchin crater. The smallest craters scientists can distinguish from LRO images are about 30 feet wide, the length of a three-story building laid on its side, made by rocks about 43 inches wide, the size of a monster-truck tire. Scientists estimate that impacts of this scale produce about 140 new craters across the Moon each year. But most new ones are made by microscopic projectiles that leave holes too small to identify in orbital images.

With its numerous instruments, the spacecraft can observe changes to the lunar surface that aren’t apparent in the LROC images alone. After the crater was discovered, scientists working with LRO’s thermal instrument, Diviner, made follow-up observations of the site. They found a 4-mile-wide area around the crater that is about 16 degrees Fahrenheit cooler at night than its surroundings.

Animated temperature map that alternates between two images. A vertical strip through the center blinks on and off, revealing a dark blue circular area surrounding a small white spot near the middle. The pale blue map also contains scattered yellow, orange, and red spots and rings, including a large, curved red-and-yellow feature near the lower center. A 5-kilometer scale bar appears at lower left, and a color key ranges from 90 kelvin in dark blue to 130 kelvin in dark red.
This animated image set shows an area on the eastern limb of the Moon before and after McGetchin crater formed there sometime between April 11 and May 22, 2024. The post-impact image was constructed using data taken by NASA’s Lunar Reconnaissance Orbiter (LRO) thermal instrument, Diviner, between Nov. 15, 2025, and Feb. 18, 2026, after scientists discovered the crater in visible-light images taken by LRO’s Wide-Angle Camera. Pre-impact temperatures are from the Diviner Global High-Resolution Mosaics (GHRM). The crater formed on the Moon after a comet or asteroid, possibly the size of a six-story building, hit the surface in a rare, once-in-a-century collision. The dark blue strip that flashes into view reveals a 4-mile-wide “cold spot” around the crater that is about 16 degrees Fahrenheit cooler at night than its surroundings. This cooling happens because an impact fluffs up regolith around a crater, making it less dense and therefore less able to retain heat. Scientists on the Diviner team reported this finding in a paper published on Sept. 16, 2026, in Science Advances. The red and yellow spots indicate areas typically associated with rocks excavated by long-ago impacts which, though still at cryogenic temperatures like their surroundings, remain slightly warmer at night.
NASA Goddard/UCLA/JHU APL

Reporting in a second paper Wednesday in the same journal, researchers say that the cooling happens because the impact fluffs up the regolith around the crater, making it less dense and therefore less able to retain heat.

The large extent of this “cold spot” is striking, scientists say, because it shows that impacts can modify the Moon’s surface far beyond the crater itself. These physical changes could affect how rover wheels interact with the surface, for instance.

Wide black-and-white image of a rough, uneven surface densely covered with circular depressions and raised areas. The upper and lower edges are especially rugged, while the center is smoother and divided by subtle vertical bands. A black arrow left of center points toward a faint, narrow vertical mark.
A global view of the Moon made by stitching together hundreds of images from the Wide-Angle Camera aboard NASA’s Lunar Reconnaissance Orbiter (LRO). Robert Wagner, image processing specialist for LRO, made this map using two sets of mages taken several years apart. He used a software designed to highlight any changes between the two sets. Anything that stayed the same turned gray; anything different showed up as bright or dark patches. A black arrow just left of center points to McGetchin crater.
NASA Goddard/Intuitive Machines/Robert Wagner

Road to discovery

The LROC system collects images from about 60 miles above the Moon as LRO loops from pole to pole. The system includes two cameras that capture high‑resolution black‑and‑white images and one camera for moderate‑resolution multispectral images. Over the years and thousands of passes, scientists have built maps detailed enough to spot not only new craters, but also landslides, landers, seismic faults, and even hints of lava tubes.

LROC scientists regularly analyze close-up images of small portions of the Moon’s surface taken by the Narrow-Angle Camera. Using these images, they look for changes that are typically less than 30 feet across. But every few years the team searches for large (wider than 150 feet) features by creating global Moon maps and comparing them to older versions.

Square black-and-white image of a dark, uneven surface. At the center is a dark, roughly circular depression surrounded by a bright irregular area, with long streaks of lighter material radiating outward in all directions.
An overhead, close-up view of McGetchin crater that was taken on Dec. 5, 2025, by NASA’s Lunar Reconnaissance Orbiter (LRO) Narrow-Angle Camera (NAC). After the crater was discovered on Oct. 24, 2025, in global images from LRO’s Wide-Angle Camera, which captures broad views with pixels the size of American football fields, scientists turned to the NAC, which takes much sharper views at about 3 feet per pixel. The NAC images, taken as LRO flew over the impact site again, revealed the crater size, shape, and how the surrounding terrain was affected by the impact that carved McGetchin. The image covers an area that’s ¾ mile wide.
NASA Goddard/Intuitive Machines
Square black-and-white image of a dark, gently uneven surface scattered with small circular depressions. Near the center is a small oval crater with a bright raised rim and dark interior. Fine, bright streaks radiate outward from the crater across the surrounding surface.
This view from the side (55° away from straight down) towards the east, covers an area of the Moon that’s about 1.5 miles wide. It was taken by NASA’s Lunar Reconnaissance Orbiter Narrow-Angle Camera on March 3, 2026.
NASA Goddard/Intuitive Machines

That’s what Wagner was doing on Oct. 24, 2025, when he came across McGetchin. Using images from LROC’s Wide-Angle Camera, which captures broad views with pixels the size of football fields, he stacked hundreds of “before” and “after” frames with software designed to highlight change. Anything that stayed the same turned gray while anything different showed up as bright or dark patches.

While the process sounds straightforward, spotting real craters requires a lot of manual work. The software flags every tiny shift in lighting or shadow, generating hundreds of false alarms. For this reason, Wagner typically verifies the software, looking for small fuzzy halos around pixel‑wide bright points, which indicate splashes of regolith around a new crater.

Spanning hundreds of pixels, McGetchin stood out immediately. “It was by far the most obvious impact debris pattern I’ve ever seen in one of these images,” Wagner said.

After his discovery, scientists turned to the Narrow-Angle Camera, which takes much sharper views at about 3 feet per pixel. This camera’s close-up images, taken as LRO flew over the impact site again, revealed the crater size, shape, and how the surrounding terrain was affected. These images also helped researchers estimate the size and force of the rock fragment that formed the new crater, details that are expected to appear in a future paper.

Banner image caption: A zoomed-in view of the Moon, with debris around McGetchin crater visible as a white spot circled by a dark halo just right of center of the image (marked with black arrows). This is the view that Robert Wagner saw on Oct. 24, 2025, during a routine data-quality check. Wagner is an image processing specialist for NASA’s Lunar Reconnaissance Orbiter Camera, a system of three cameras. Using images from the Wide-Angle Camera (WAC), which captures broad views with pixels the size of American football fields, he stacked hundreds of images captured by WAC over the last several years with software designed to highlight change. Anything that stayed the same is gray; anything that changed showed up as bright or dark patches. The stripes in the image are due to slight changes in lighting between the older and newer images. This image composite shows an area of the Moon approximately 900 miles across.

About the Author

Lonnie Shekhtman

Lonnie Shekhtman

Senior Science Writer

Shekhtman helps communicate NASA planetary science to the world through news and feature stories on NASA.gov, videos for NASA+ and YouTube, and by working with the media. She reports on lunar and Mars science and exploration; NASA’s search for life; missions to Venus, Titan, and Jupiter’s Trojan asteroids; and many other topics related to NASA’s exploration of our solar system and beyond.

Keep Exploring

Discover More Topics From NASA

Simplified Summary

Scientists discovered a crater on the Moon that formed sometime between April 11 and May 22, 2024, after a comet or asteroid the size of a three- to six-story building hit the surface.
 
The crash left a crater, 728 feet wide, that spans the length of two football fields. And at 141 feet deep, the crater could fit three vertically stacked yellow school buses.

NASA Celebrates Restoration of Guam Station Damaged by Typhoon Mawar 

16 September 2026 at 17:12
A large group gathers behind a red ribbon for a ribbon-cutting ceremony beneath white tents, with a large white geodesic radome in the background.
On Sept. 10, 2026, NASA commemorated the completed repairs of the Guam Remote Station’s central antenna with a ribbon-cutting ceremony.
Members of NASA, the Governor’s Office of Guam, military personnel, and family members gathered to celebrate the Guam Remote Station’s return to operations.
NASA
Employees and guests gather beneath white event tents outside a large white geodesic radome during an outdoor ceremony under partly cloudy skies. A woman in a dark suit addresses the audience.
The ribbon-cutting event was held in front of the repaired central antenna. As of 2026, the newly hardened station has withstood two super typhoons more powerful than Mawar with minimal damage.
SCaN Deputy Manager for Network Operations Jena Garrahy addresses members of the Guam Remote Station ribbon-cutting event.
NASA
Two people smile while holding a framed award during an outdoor ceremony; a podium decorated with a large red bow stands beside them, with facility buildings and the ocean in the background.
Guam Remote Station Site Manager Kristopher Copple was among those recognized during the ceremony.
Jena Garrahy (right), SCaN Deputy Manager for Network Operations, presents a certificate of recognition to Guam Remote Station Site Manager Kristopher Copple (left).
NASA
NASA’s Guam Remote Station is key to the Tracking and Data Relay Satellite (TDRS) constellation maintaining continuous communications with the International Space Station.
An artist’s concept of the International Space Station using NASA’s Tracking and Data Relay Satellite (TDRS) fleet to transmit data to Earth.
NASA
Aerial view of a communications facility surrounded by dense vegetation, showing several white radomes, support buildings, and an access road.
A 2023 aerial photo of the Guam Remote Station prior to Super Typhoon Mawar landing on the island. 
Satellite image of NASA remote ground terminal located in Dededo area, Guam, released by U.S. commercial satellite company MAXAR.
MAXAR
Aerial view of the same communications facility after severe storm damage, with several radomes torn open or damaged and debris scattered across the surrounding grounds.
An aerial photo of the Guam Remote Station immediately after Super Typhoon Mawar struck the station. of the station’s three ground antennas were demolished.
Satellite image of NASA remote ground terminal located in Dededo area, Guam, released by U.S. commercial satellite company MAXAR.
MAXAR

NASA celebrated the full restoration of its Guam Remote Station with a ribbon-cutting on Sept. 10, closing out more than three years of recovery after Super Typhoon Mawar devastated the site in 2023. Engineers from across the agency completed the final and most complex step of the rebuild on July 1, when they returned the station’s central antenna to service.

Three large white spherical radio antennas at the repaired Guam Remote Station stand behind a security fence on a grassy field. A rainbow arcs through the partly cloudy blue sky behind the antennas.
A rainbow arcs over the newly repaired Guam Remote Station antennas.
NASA

For nearly three decades, the Guam Remote Station has been one of three ground stations supporting NASA’s Tracking and Data Relay Satellites, or TDRS, a critical part of the Near Space Network. From 22,000 miles above Earth, the relays link spacecraft in low Earth orbit with the ground, allowing flight controllers to communicate with astronauts, command spacecraft, and receive mission data. The Guam station alone closes the “Zone of Exclusion,” a stretch of orbit beyond the relays’ line of sight. Without it, the International Space Station can lose contact with Earth for up to 20 minutes of every 90-minute orbit, an unacceptable risk for crewed missions.

On May 24, 2023, the Category 4 super typhoon struck Guam with 185 mph winds and more than 28 inches of rain, destroying two 16.5-meter antennas and damaging an 11-meter north antenna and the Inter Facility Link building at NASA’s station. The Zone of Exclusion reopened for the first time since 1998, cutting TDRS coverage to about 85% of a spacecraft’s orbit.

NASA made emergency repairs to the least-damaged antenna and borrowed two mobile terminals from the U.S. Army to expand coverage. The patchwork restored partial service within months, in time for a November 2023 spacewalk.

In early 2025, Congress dedicated disaster-relief funding to rebuild the ground station and harden the network against future storms. Construction began that summer and finished in summer 2026, when the rebuilt central antenna rejoined TDRS operations and the Zone of Exclusion closed once more. The same appropriation funded critical upgrades at three additional Near Space Network ground stations.

The return to service of the Guam Remote Station’s central antenna represents far more than the restoration of a critical piece of infrastructure — it is a testament to the dedication, resilience, and ingenuity of the people who made it possible.

Jena Garrahy

Jena Garrahy

SCaN Deputy Program Manager for Network Operations

At the ribbon-cutting, representatives from NASA’s SCaN (Space Communications and Navigation) Division joined the station’s workforce and local leaders to mark the central antenna’s return to service. The Guam team, which led debris removal, site security, and on-island recovery, was recognized for its  work to keep NASA connected to its missions through the outage and rebuild. A companion ceremony at NASA’s White Sands Complex in Las Cruces, New Mexico, honored the engineers and specialists across SCaN who supported the recovery off island.

“The return to service of the Guam Remote Station’s central antenna represents far more than the restoration of a critical piece of infrastructure — it is a testament to the dedication, resilience, and ingenuity of the people who made it possible,” said Jena Garrahy, Deputy Program Manager for Network Operations. “Through long days, challenging conditions, and unexpected obstacles, this team remained focused on the missions that depend on these critical assets every day.”

The Near Space Network is funded by SCaN, a division of NASA’s Research and Technology Mission Directorate, at the agency’s Headquarters in Washington. The network is operated out of NASA’s Goddard Space Flight Center in Greenbelt, Maryland. Repairs of the Guam Remote Station were managed out of NASA’s Glenn Research Center in Cleveland.

About the Author

Korine Powers

Korine Powers

Lead Writer and Communications Strategist

Korine Powers, Ph.D. is a writer for NASA's SCaN (Space Communications and Navigation) Program office and covers emerging technologies, commercialization efforts, exploration activities, and more.

The Roman telescope has enough gas for 22 years, double NASA's expectations

15 September 2026 at 23:26

NASA's Nancy Grace Roman Space Telescope is gliding toward its distant observation post on a pinpoint trajectory so precise that engineers estimate the spacecraft's fuel load will last twice as long as their initial expectations, the space agency confirmed Monday.

The $4.3 billion observatory's designers originally planned to load enough propellant into Roman's four fuel tanks for a minimum lifetime of five years, plus a potential five-year mission extension. That was a conservative estimate. NASA officials knew an on-target launch and perfect execution of the observatory's first post-launch course correction maneuver would leave Roman with a hearty fuel reserve.

"As a result of exquisite planning by our orbital dynamics team, brilliant execution by the operations team, and a precise launch from SpaceX, Roman has fuel for at least 22 years of potential science operations," Jamie Dunn, center director at NASA's Goddard Space Flight Center, said in a press release.

Read full article

Comments

© SpaceX

Celebrate International Observe the Moon Night with NASA

15 September 2026 at 17:15

In April, the world watched as four humans circled the Moon for the first time in over 50 years with NASA’s Artemis II mission. On Saturday, Sept. 19, the public is invited to look up again with NASA events across the country, including the International Observe the Moon Night celebration held at NASA’s Goddard Space Flight Center Visitor Center in Greenbelt, Maryland.

Graphic advertising International Observe the Moon Night.
This year, NASA will celebrate International Observe the Moon Night with people around the world on Sept. 19.
NASA/Vi Nguyen

International Observe the Moon Night is an annual celebration that brings people together to learn about the Moon and explore our connection to Earth’s nearest celestial neighbor. Since the program began in 2010, people around the world have participated through lunar observations, hands-on activities, artwork, music, and more.
 
At NASA Goddard, this year’s celebration will highlight the agency’s ongoing exploration of the Moon, including the historic Artemis II mission. Visitors can peer behind the scenes to learn more about what it took to make Artemis II’s journey around the Moon a success and discover how Goddard scientists and engineers are helping advance our understanding of the Moon, solar system, and beyond.
 
The event will run from 6 p.m. to 9 p.m. EDT.
 
Throughout the event at NASA Goddard, visitors can take part in interactive hands-on activities, create artwork and crafts, and capture selfies at a photo kiosk. Telescopes will also be set up outside (depending on weather), giving attendees an opportunity to observe the Moon and other astronomical objects up close. Inside the Visitor Center, guests can even see a real Apollo 14 Moon rock on display.

  • At 6:30 p.m., Dr. Amanda Nahm, planetary scientist at NASA Headquarters, will explore the lunar science and Moon joy from Artemis II.
  • At 7:30 p.m., Ernie Wright, scientific visualizer at NASA Goddard, will offer a more technical look at how scientists use real data to create videos and visualizations of the Moon.
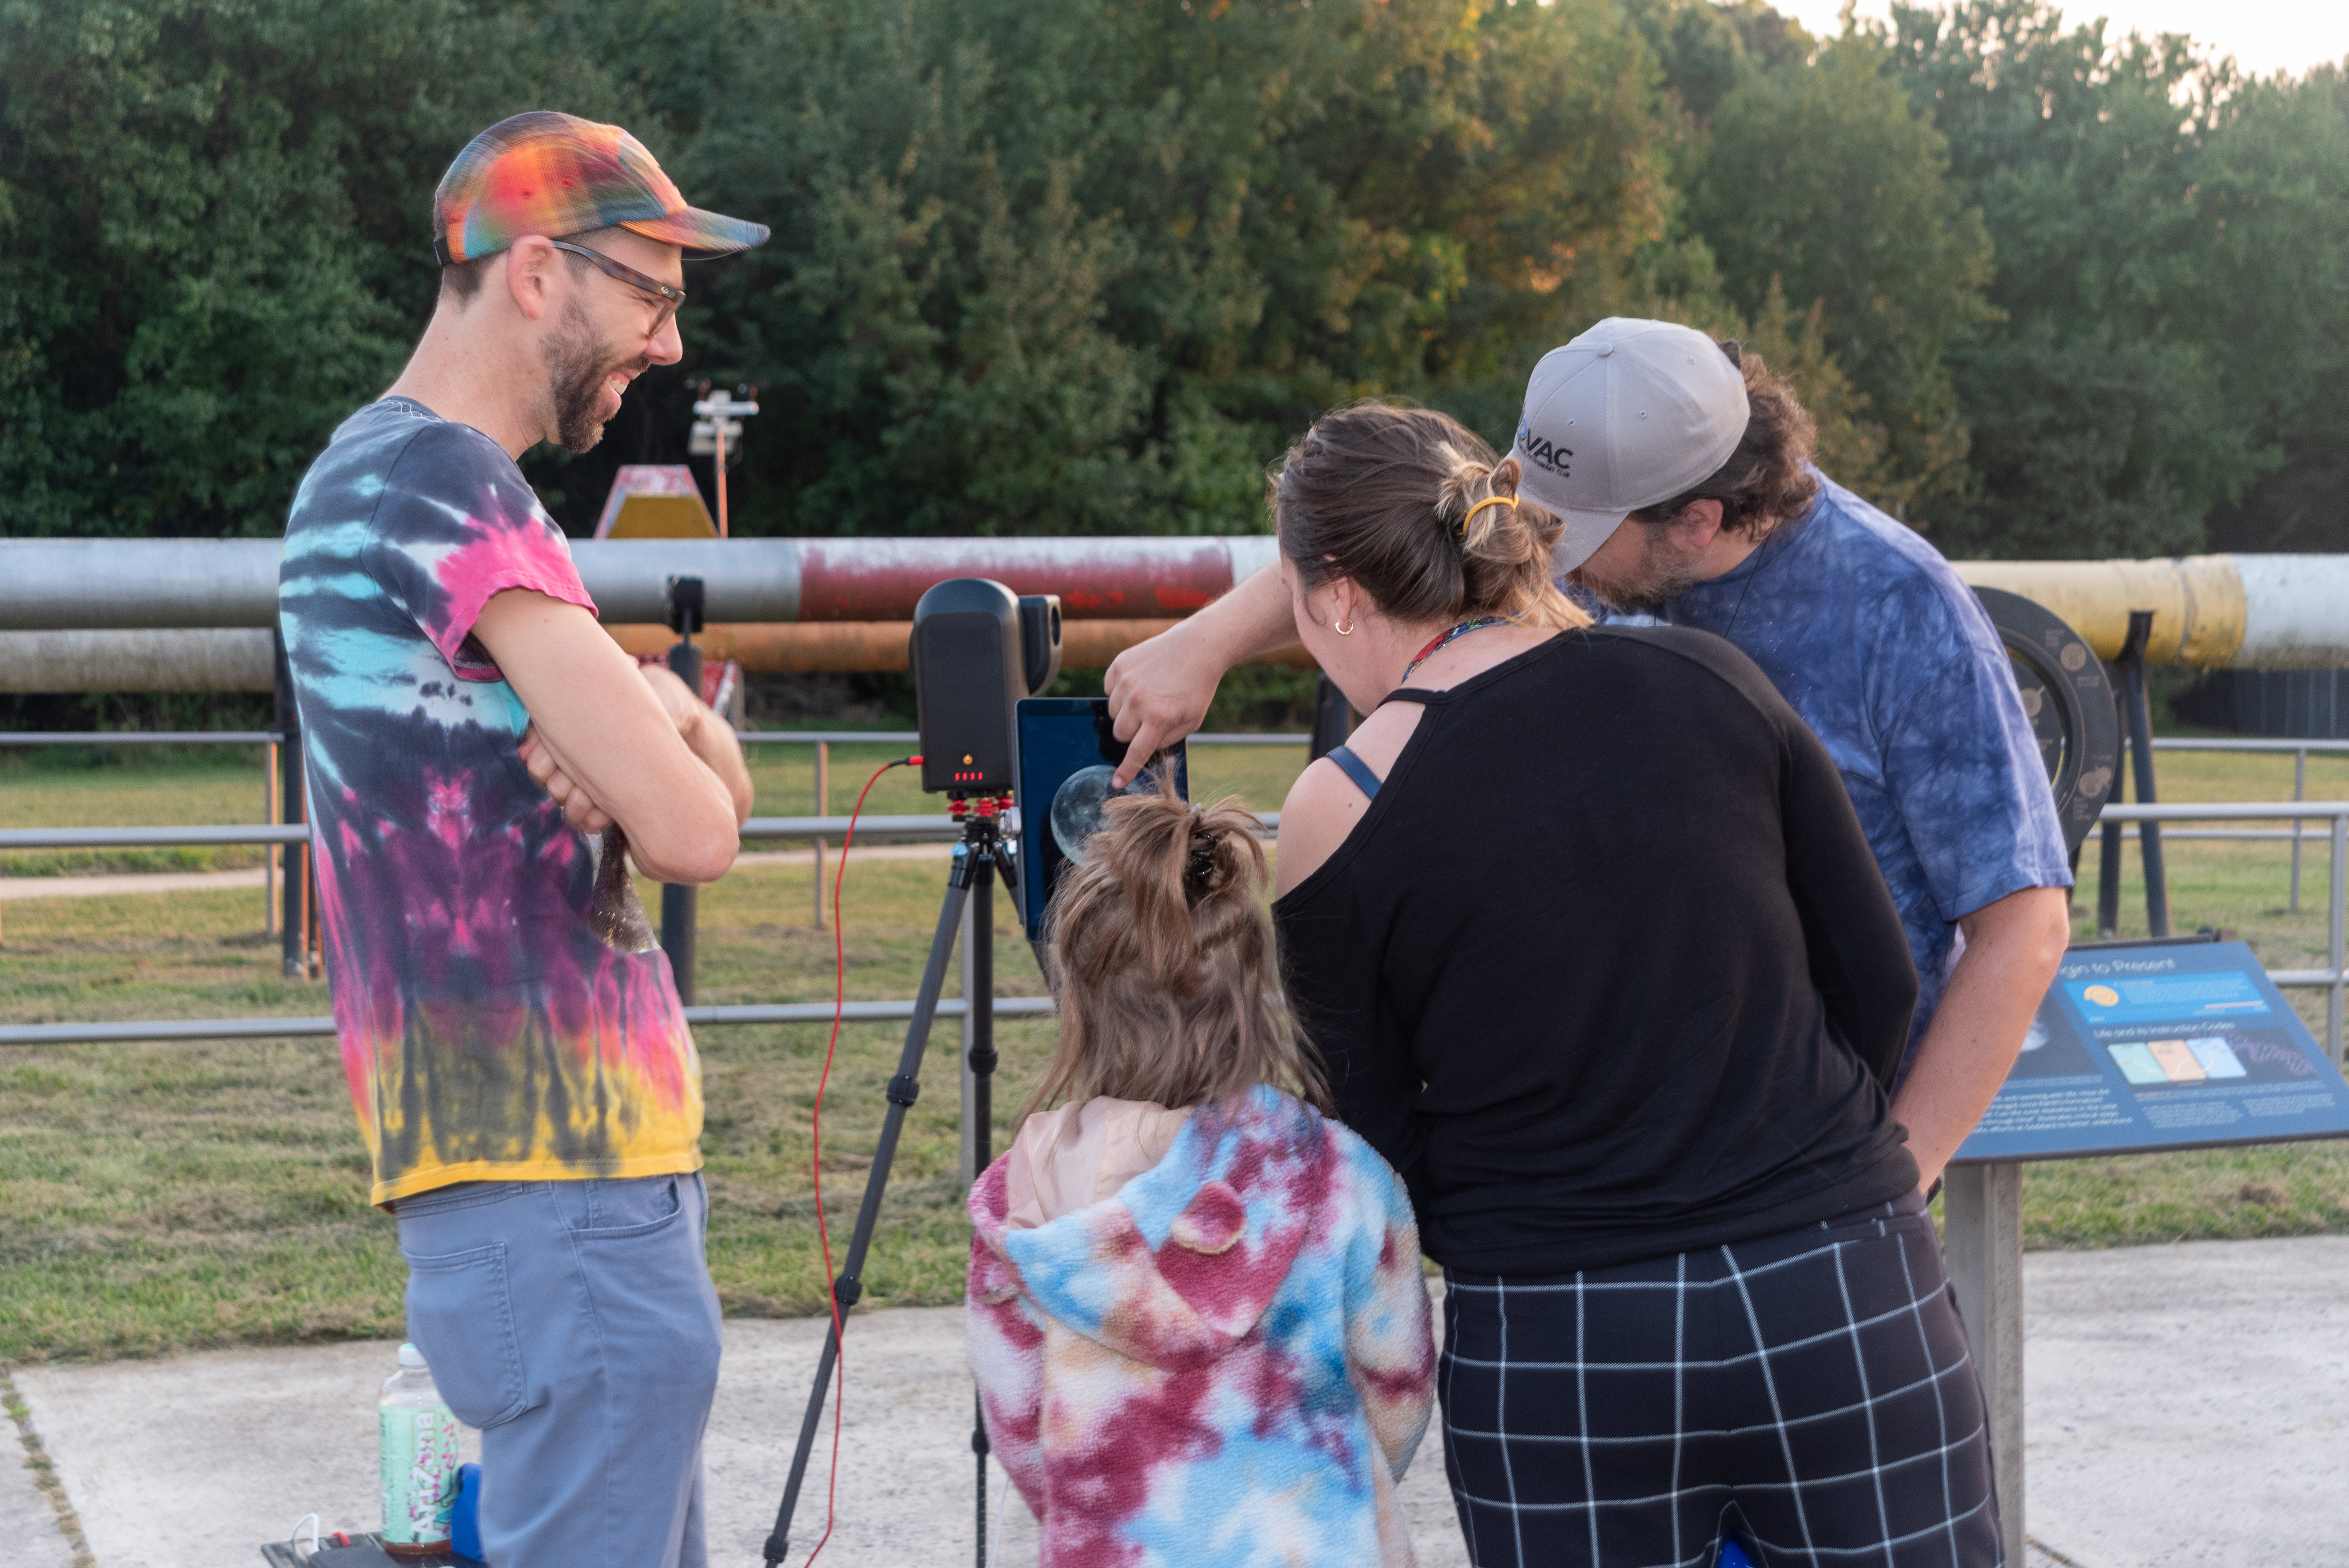
A child and two adults look at a tablet screen with a telescope’s display showing the full Moon. Another person stands to the left, smiling and looking on.
A family observes the Moon through a telescope at NASA’s Goddard Space Flight Center in Greenbelt, Md. during the International Observe the Moon Night celebration on Saturday, Sept. 14, 2024.
NASA/Britt Griswold

The event will also offer a chance to learn more about the groundbreaking research happening at NASA Goddard as scientists work to unlock the secrets of the Moon with missions like the Lunar Reconnaissance Orbiter (LRO) and explore our solar system and the universe beyond.
 
International Observe the Moon Night at Goddard is free and family friendly. Registration is not required, although registering in advance will help the Visitor Center team plan for the event. The event will take place rain or shine, and free parking is available at the Visitor Center.
 
Additional event details, including registration, accessibility and other logistics: https://www.nasa.gov/goddard/visitor-center/events-and-programs/.
 
For people who cannot travel to Greenbelt, there are opportunities to participate in International Observe the Moon Night from all around the planet. Join lunar observers around the world by observing the Moon with friends and family, attending a virtual event or finding an event in your area. Learn more and register your participation at go.nasa.gov/ObserveTheMoon.
 
International Observe the Moon Night is sponsored by NASA’s LRO mission and the Solar System Exploration Division of NASA’s Goddard Space Flight Center, with support from many partners. The celebration is a way for people to pause and look up at our future destination, as NASA prepares for deep space missions to the Moon and beyond.
 
To learn about NASA’s Artemis program, visit:
https://www.nasa.gov/artemis
 
To learn about LRO, visit:
https://www.nasa.gov/lro

Share

Details

Last Updated
Sep 15, 2026

Hubble Discovers a Mysterious 10-Sided Wave Forming on Saturn

15 September 2026 at 14:48
Decagon Encircling Saturn’s South PoleA giant 10-sided wave is emerging around Saturn’s south pole, giving scientists a rare chance to watch a planetary weather pattern take shape. NASA’s Hubble Space Telescope has detected a huge, evolving atmospheric wave with 10 sides wrapped around Saturn’s south pole. It is the first time scientists have seen a large, regular-sided jet pattern [...]

NASA Completes Astronaut-Deployed Science Instrument for Lunar Surface

11 August 2026 at 20:41
Rectangular box-shaped device resting on a metal table. The front face is covered with a grid of many small black rectangular panels bordered in white. Metal components, brackets, and small box units are mounted along the top. The background shows a large windowed wall with a blurred American flag and an Artemis flag visible behind the device.
The fully-integrated LEMS (Lunar Environment Monitoring Station) ready for environmental testing. A small suitcase-size instrument suite built at NASA Goddard, LEMS is designed to carry out continuous, long-term monitoring of the seismic environment at the Moon, including surface motion caused by moonquakes and meteorite impacts in the lunar south polar region.
NASA Goddard/Mike Guinto

NASA has declared “wrenches down” on the first completed payload designed for Artemis astronauts to deploy on the Moon’s surface. Engineers working on NASA’s Lunar Environment Monitoring Station, or LEMS, have completed hardware development and testing and the payload is ready for its permanent home near the lunar South Pole. With the hardware complete, LEMS is ready to support one of the Artemis program’s core goals: enabling sustained lunar science and exploration.

The LEMS instrument package contains two highly sensitive seismometers that will monitor ground vibrations from moonquakes and meteorite impacts, providing scientists with insights into the Moon’s interior and the seismic hazards astronauts might encounter at the surface. Its modular design allows the system to be adapted or expanded to host new instruments in the future, creating a reusable platform that can evolve as scientific priorities grow.

The payload will remain in a clean room at NASA’s Goddard Space Flight Center in Greenbelt, Maryland, where it was built, until it is assigned to an Artemis mission for deployment to the lunar surface.

“The completion of the LEMS scientific instrument is a major step in a new era of lunar surface science. Innovative science experiments will uncover, measure, and reveal the Moon’s secrets while astronauts open new frontiers for discovery,” said Joel Kearns, deputy associate administrator for exploration, Science Mission Directorate, NASA Headquarters in Washington. “And, behind the scenes, countless teams across NASA and our partners are pushing the boundaries of what surface instruments can do, building the tools that will make future exploration possible and safer.”

An astronaut in a white spacesuit kneels in simulated lunar soil while working with scientific equipment in a large testing facility. Staff members and support structures are visible in the background.
A scientist wearing NASA’s xEMU prototype space suit is testing the handling of a mockup version of NASA’s Lunar Environment Monitoring Station, or LEMS. The testing took place at the Active Response Gravity Offload System, a simulated reduced gravity environment at NASA’s Johnson Space Center in Houston.
NASA Johnson

The LEMS payload builds on a legacy of lunar seismic tracking. Apollo astronauts deployed a network of seismometers on the Moon’s nearside equatorial region between 1969 and 1972. Those instruments operated until 1977, recording about 13,000 moonquakes and other ground vibrations that helped scientists begin to understand the composition of the Moon’s interior. For decades, researchers have hoped to spread more seismometers, updated with new technologies, across the lunar surface.

Now, LEMS will carry the first seismometers to be deployed by future astronauts to listen for faint ground vibrations, collecting new clues to the Moon’s internal structure and ongoing seismic activity. The sensors will be the most compact, sensitive, and energy-efficient seismometers ever built for planetary exploration.

LEMS itself is about the size of a small suitcase, weighing 11 pounds in the Moon’s low-gravity environment. It will carry not just these seismic sensors, but everything it needs to function independently of humans after deployment. LEMS is built to manage its own power production via a lightweight, flexible solar array that conforms to the shape of the LEMS unit. It also will manage its operational activities to ensure continuous data collection based on a preset plan, and monthly data transmission to Earth. The payload will do all this while maintaining a stable internal temperature throughout the massive day-to-night temperature swings of the South Pole region.

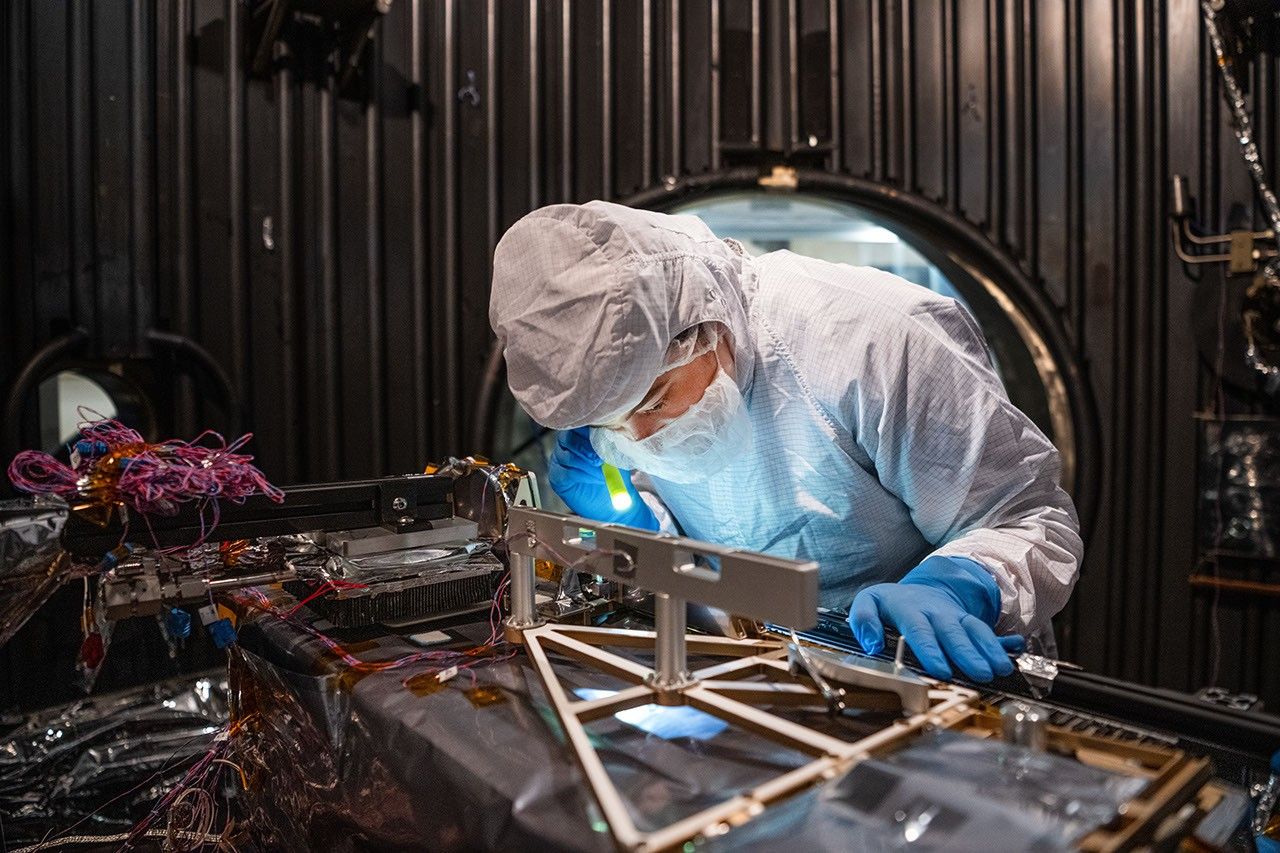
A technician in a white clean-room suit and blue gloves uses a small flashlight to inspect a spacecraft instrument inside a dark testing chamber. Colorful wires and metallic components surround the instrument.
Mechanical Engineer Brie Ludwig inspects the Lunar Environment Monitoring Station (LEMS) in preparation for testing in a thermal vacuum chamber at Goddard Space Flight Center in Greenbelt, Maryland, on March 31, 2026. LEMS is a compact, autonomous, and self-sustaining seismometer suite designed to carry out continuous, long-term monitoring of the lunar seismic environment at the South Polar region.
NASA/Denny Henry

“When we conceived of LEMS, we weren’t just thinking about the next mission, we were thinking about the next generation of lunar exploration,” said Mehdi Benna, a University of Maryland Baltimore County scientist who leads LEMS from NASA Goddard. “Our vision was to create a scientific buoy for the Moon. Like an ocean buoy on Earth, LEMS is designed to be easy to build, adaptable to different scientific objectives, and capable of operating independently for years.”

Before any surface science could happen, Benna and his team had to ensure that LEMS could survive the trip to the Moon and the harsh environment of its surface. Over the past five months, LEMS and its components have been subjected to a demanding series of environmental and operational tests. Engineers verified LEMS can endure the violent shaking of launch, the journey to the lunar surface, and the Moon’s temperature and radiation environment. The team also showed that the instrument package’s mechanical and electrical design is safe for astronaut handling.

The LEMS payload was built to operate through the lunar night, which lasts two Earth weeks, without external power assistance or a heat source. Past lunar surface instruments relied on radioisotope heaters for warmth and power. But LEMS instead will withstand temperatures that dip to minus 400 degrees Fahrenheit in some areas by using advanced insulation materials, low-thermal-conductivity cables that minimize heat loss, and a thermal regulator that conducts heat away during the day to prevent overheating and helps retain heat at night.

These innovations reduce mass and power needs, setting the stage for lighter, energy-efficient instruments that can operate continuously at future Artemis landing sites and the NASA-led Moon Base.

The LEMS payload is led by University of Maryland Baltimore County and University of Maryland College Park. Technical implementation is led by NASA Goddard. The University of Arizona, in partnership with Silicon Audio, Inc., supplied LEMS’ two state-of-the-art seismometers. Morehead State University in Kentucky provided LEMS’ telecommunication system and will operate the instrument on the surface. Washington University in St. Louis will manage the instrument’s data processing and dissemination to the larger scientific community.

Lion Nebula Roars to Life With NASA’s Webb

10 August 2026 at 15:00
 
4 Min Read

Lion Nebula Roars to Life With NASA’s Webb

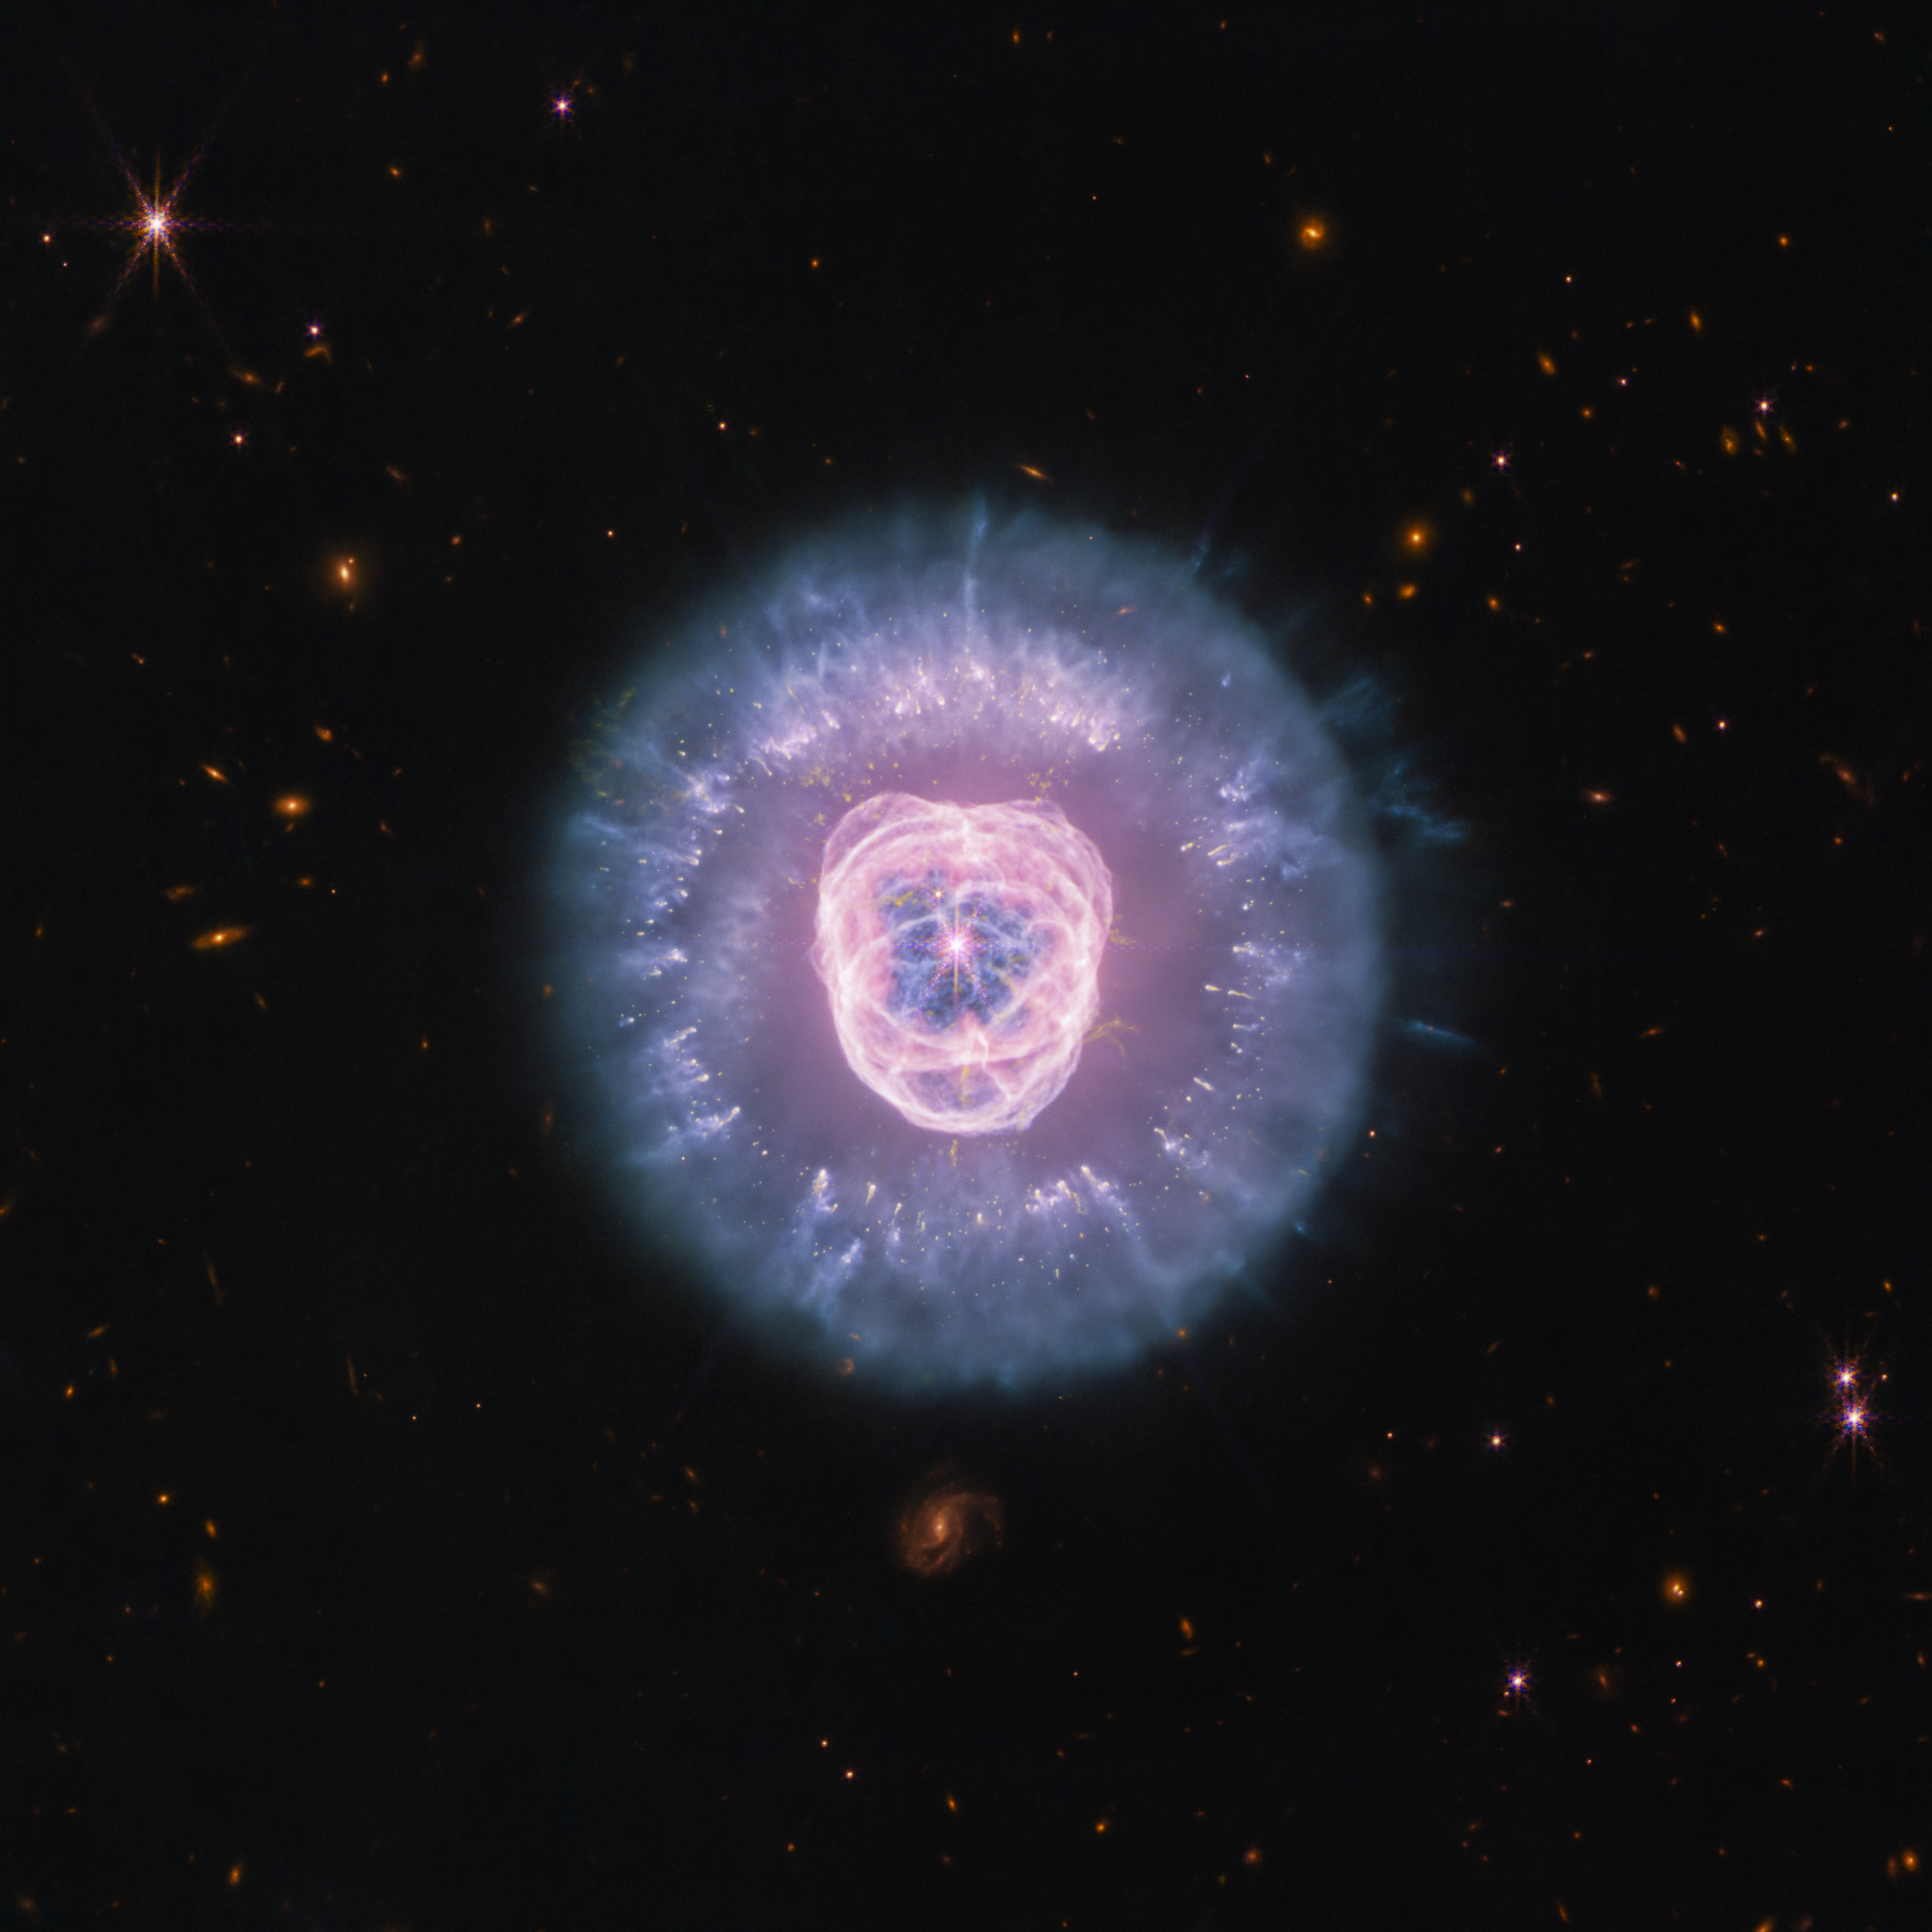
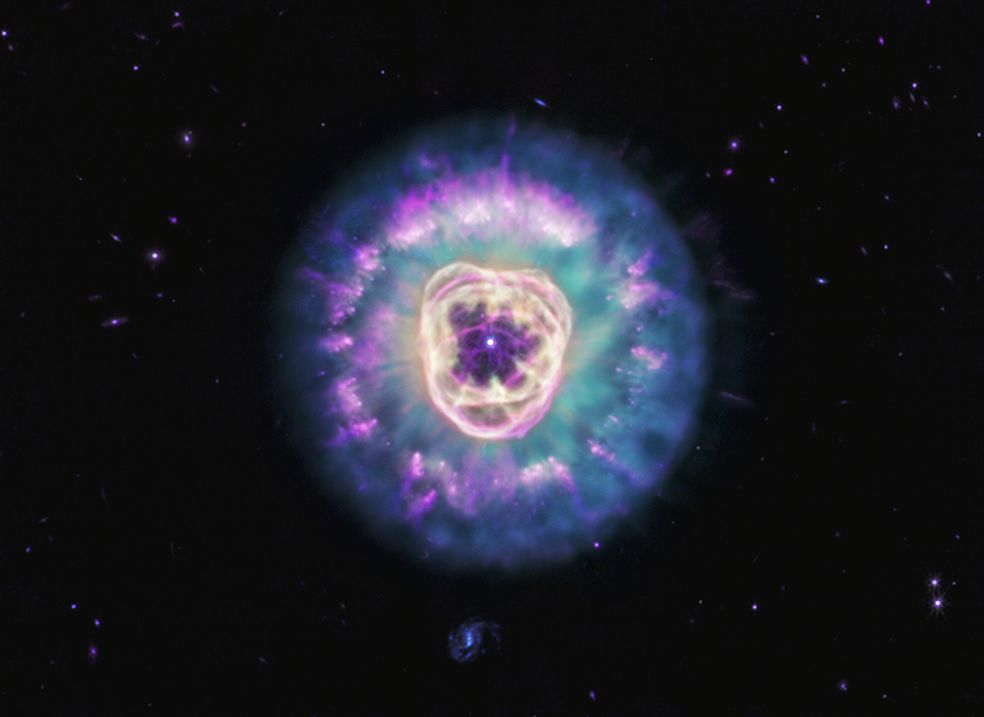
JWST’s Near Infrared Camera and Mid Infrared Instrument combined image of planetary nebula NGC 2392, the Lion Nebula, against the black background of space. The nebula is at center, circular in shape, and looks like a male lion’s head. In the center is a small, pinkish-white circle with eight-point diffraction spikes, a white dwarf star. Surrounding the star are purple-pink cavernous bubbles and shell-like rings. The bubbles and shells collectively form an oval with two small, wide arcs near the top, reminiscent of a lion’s face and its ears. What appears to be extended outward from the lion’s face is a thick ring of purple-blue material. The width of the ring is consistent throughout and resembles a mane. The area closest to the lion’s face looks cloudy, while the edges of the mane look like there are clumps of dust with comet-like tails. In the background are distant galaxies and stars. Some galaxies are yellow and orange points of light and others have spiral structures. Some stars have diffraction spikes.
NASA’s James Webb Space Telescope imaged the planetary nebula NGC 2392, the Lion Nebula, using the observatory’s NIRCam and MIRI instruments. The central star’s remains are responsible for the nebula’s structure, including a lion face-shaped bubble of ionized gas and dust “mane.”
Credits:
Image: NASA, ESA, CSA, STScI; Image Processing: Alyssa Pagan (STScI)

Observing across the starry “plains” of space, NASA’s James Webb Space Telescope has taken new images of NGC 2392, nicknamed the Lion Nebula. NASA’s Hubble Space Telescope previously viewed this planetary nebula in 2000, imaging the lion face-shaped target in visible light and revealing features such as the “mane” of hazy, comet-shaped objects. Now Webb has captured a clearer, more detailed view of the Lion Nebula due to its high-resolution imaging.

Lion Nebula (NIRCam and MIRI Image)

JWSTu2019s Near Infrared Camera and Mid Infrared Instrument combined image of planetary nebula NGC 2392, the Lion Nebula, against the black background of space. The nebula is at center, circular in shape, and looks like a male lionu2019s head. In the center is a small, pinkish-white circle with eight-point diffraction spikes, a white dwarf star. Surrounding the star are purple-pink cavernous bubbles and shell-like rings. The bubbles and shells collectively form an oval with two small, wide arcs near the top, reminiscent of a lionu2019s face and its ears. What appears to be extended outward from the lionu2019s face is a thick ring of purple-blue material. The width of the ring is consistent throughout and resembles a mane. The area closest to the lionu2019s face looks cloudy, while the edges of the mane look like there are clumps of dust with comet-like tails. In the background are distant galaxies and stars. Some galaxies are yellow and orange points of light and others have spiral structures. Some stars have diffraction spikes.
NASA’s James Webb Space Telescope imaged the planetary nebula NGC 2392, the Lion Nebula, using the observatory’s NIRCam and MIRI instruments. The central star’s remains are responsible for the nebula’s structure, including a lion face-shaped bubble of ionized gas and dust “mane.”
Image: NASA, ESA, CSA, STScI; Image Processing: Alyssa Pagan (STScI)

At first glance the nebula’s overall structure in Webb’s infrared images, with both the NIRCam (Near Infrared Camera) and MIRI (Mid Infrared Instrument) instruments, may look quite similar to Hubble’s earlier visible-light view. However, Webb’s infrared vision highlights features like compact clumps of dust and a haze of ionized gas. It’s taken several thousand years for this collection of gas and dust to reach its current shape, and the nebula’s components continue to be altered.

The source of these constant changes and the reason for the Lion Nebula’s distinct appearance is located at the center: the remains of a dying star. Though it looks like the button nose of the lion, its energy and radiation are powering the intricate structures seen here.

Lion Nebula (MIRI Image)

Planetary nebula NGC 2392, also called the Lion Nebula, against the black background of space. The nebula is in the center, circular in shape, and looks like a male lion’s head. In the very center is a small, bluish-white circle with eight-point diffraction spikes, a white dwarf star. Surrounding the star are light purple-red cavernous bubbles and shell-like rings. The bubbles and shells collectively form an oval with two small, wide arcs near the top, reminiscent of a lion’s face and its ears. What appears to be extended outward from the lion’s face is a thick ring of cyan material. The width of the ring is consistent throughout and resembles a mane. The area closest to the lion’s face looks cloudy, while the edges of the mane look like there are purple clumps of dust with comet-like tails and strands. In the background are distant galaxies and stars. Some galaxies appear as small purple points of light and others with visible blue spiral structures. A couple of the stars have diffraction spikes.
NASA’s James Webb Space Telescope’s mid-infrared image of planetary nebula NGC 2392, nicknamed the Lion Nebula, highlights the varying dust structures. Some dust is being destroyed by the dying central star’s radiation, while some dust filaments manage to survive.
Image: NASA, ESA, CSA, STScI; Image Processing: Alyssa Pagan (STScI)

Massive stars undergo supernova explosions at the end of their lives, but these kinds of events are few and far in between. Most of the universe’s stars have lower masses, like the one belonging to NGC 2392. When a lower-mass star can no longer sustain itself with nuclear reactions in its core, the star becomes unstable and pulsates, losing its mass by shedding its outer layers, which then turn into shells of gas and dust called a planetary nebula. (Stars at this life stage are responsible for producing much of the universe’s observable dust.) The star’s radiation drives the ejected material away, leaving behind the very hot stellar core, also known as a white dwarf.

In the Lion Nebula’s case, the death of the oxygen-rich central star has left behind a white dwarf that is “cooking” everything from the inside and producing a bubble of ionized gas as it does. The gas bubble, which forms the lion’s face, is expanding over time and destroying dust that is in its path. Understanding why the swept-up gas has a complex structure of rings and shells, a common feature in planetary nebulae, is an ongoing endeavor.

The mane of the lion is the interior of a dust shell that is being illuminated by the white dwarf at the center. The tufts of hair, which look like cometary tails of material, are compact clumps of dust that have survived the stellar core’s radiation and protect the material that lies behind them.

Webb’s imagery “freezes” this planetary nebula in time, though the star’s death, and its tumultuous effects, go on. NGC 2392 will continue to undergo changes as its gas and dust migrate away from the stellar core. Astronomers estimate the lion will eventually disperse in approximately 10,000 years — a relatively short period in astronomical terms.

The James Webb Space Telescope is the world’s premier space science observatory. Webb is solving mysteries in our solar system, looking beyond to distant worlds around other stars, and probing the mysterious structures and origins of our universe and our place in it. Webb is an international program led by NASA with its partners, ESA (European Space Agency) and CSA (Canadian Space Agency).

To learn more about Webb, visit:

https://science.nasa.gov/webb

Downloads & Related Information

The following sections contain links to download this article’s images and videos in all available resolutions followed by related information links, media contacts, and if available, research paper and Spanish translation links.

Related Images & Videos

JWSTu2019s Near Infrared Camera and Mid Infrared Instrument combined image of planetary nebula NGC 2392, the Lion Nebula, against the black background of space. The nebula is at center, circular in shape, and looks like a male lionu2019s head. In the center is a small, pinkish-white circle with eight-point diffraction spikes, a white dwarf star. Surrounding the star are purple-pink cavernous bubbles and shell-like rings. The bubbles and shells collectively form an oval with two small, wide arcs near the top, reminiscent of a lionu2019s face and its ears. What appears to be extended outward from the lionu2019s face is a thick ring of purple-blue material. The width of the ring is consistent throughout and resembles a mane. The area closest to the lionu2019s face looks cloudy, while the edges of the mane look like there are clumps of dust with comet-like tails. In the background are distant galaxies and stars. Some galaxies are yellow and orange points of light and others have spiral structures. Some stars have diffraction spikes.

Lion Nebula (NIRCam and MIRI Image)

NASA’s James Webb Space Telescope imaged the planetary nebula NGC 2392, the Lion Nebula, using the observatory’s NIRCam and MIRI instruments. The central star’s remains are responsible for the nebula’s structure, including a lion face-shaped bubble of ionized gas and dust “mane.”

Planetary nebula NGC 2392, also called the Lion Nebula, against the black background of space. The nebula is in the center, circular in shape, and looks like a male lionu2019s head. In the very center is a small, bluish-white circle with eight-point diffraction spikes, a white dwarf star. Surrounding the star are light purple-red cavernous bubbles and shell-like rings. The bubbles and shells collectively form an oval with two small, wide arcs near the top, reminiscent of a lionu2019s face and its ears. What appears to be extended outward from the lionu2019s face is a thick ring of cyan material. The width of the ring is consistent throughout and resembles a mane. The area closest to the lionu2019s face looks cloudy, while the edges of the mane look like there are purple clumps of dust with comet-like tails and strands. In the background are distant galaxies and stars. Some galaxies appear as small purple points of light and others with visible blue spiral structures. A couple of the stars have diffraction spikes.

Lion Nebula (MIRI Image)

NASA’s James Webb Space Telescope’s mid-infrared image of planetary nebula NGC 2392, nicknamed the Lion Nebula, highlights the varying dust structures. Some dust is being destroyed by the dying central star’s radiation, while some dust filaments manage to survive.

Related Links

Explore more: Sonification of NGC 2392

View more: Hubble Image of NGC 2392

View more: Chandra X-ray Observatory Image of NGC 2392

More Webb: News | Images | Science | Home Page


Share

Details

Last Updated
Aug 10, 2026

Contact
Media

Laura Betz
NASA’s Goddard Space Flight Center
Greenbelt, Maryland
laura.e.betz@nasa.gov

Abigail Major
Space Telescope Science Institute
Baltimore, Maryland

Christine Pulliam
Space Telescope Science Institute
Baltimore, Maryland

Efforts Continue to Stabilize LINK Spacecraft for NASA’s Swift Boost

31 July 2026 at 23:28

Teams at Katalyst Space are making progress slowing the spin of their LINK spacecraft, which is designed to boost the orbit of NASA’s Neil Gehrels Swift Observatory. A series of thruster burns this week reduced the rate of spin from approximately 9 degrees per second to less than 4 degrees per second. Katalyst is continuing with this approach to restabilize the spacecraft in the coming days.

Teams also further evaluated LINK’s functionality and determined there are still potential paths forward for a boost. NASA is working closely with Katalyst to consider revised, innovative approaches. The agency will continue to provide updates about stabilization of LINK and next steps for the mission. LINK is now expected to approach Swift around the end of August.

Learn more from Katalyst, and monitor NASA’s Swift blog for continued updates:

https://science.nasa.gov/blogs/swift

The post Efforts Continue to Stabilize LINK Spacecraft for NASA’s Swift Boost appeared first on NASA Science.
NASA’s Roman Telescope to Carry 1.35 Million Names to Deep Space

31 July 2026 at 15:11
People in blue protective suits and a red cherry picker work in an industrial high bay.

On July 27, technicians at NASA’s Kennedy Space Center in Florida installed a memory card containing 1,350,144 names as part of a commemorative plaque on the Nancy Grace Roman Space Telescope. The names were submitted by people globally, including astronauts from Artemis II and Artemis III. The memory card will travel with the Roman observatory to the Sun-Earth Lagrange point 2, or L2, about one million miles from Earth, where the Sun’s and Earth’s gravity balance out.

Roman is named after Dr. Nancy Grace Roman, NASA’s first chief astronomer and one of the architects of the agency’s modern science program. Roman championed space-based observatories that could study the universe from above Earth’s hazy atmosphere while making their data broadly available to the scientific community.

NASA and SpaceX are targeting launch for no earlier than 7:26 a.m. EDT Sunday, Aug. 30 aboard a SpaceX Falcon Heavy from Launch Complex 39A at Kennedy.

To learn more about the Roman mission, visit:

https://www.nasa.gov/roman

Image credit: NASA/Jolearra Tshiteya

Sizing Up the Sargassum Belt

29 July 2026 at 05:00
Map of the Atlantic Ocean showing Sargassum density from low (blue) to high (red) in June 2026, with the highest concentrations in the tropical Atlantic.
This map, based on data from the OCI (Ocean Color Instrument) on NASA’s PACE (Plankton, Aerosol, Cloud, ocean Ecosystem) satellite, shows Sargassum highly concentrated in the tropical Atlantic in June 2026.
NASA Earth Observatory/Lauren Dauphin

Sargassum, a type of brown floating algae, has shifted its range in recent decades, thinning out in the North Atlantic’s Sargasso Sea while proliferating in the tropical Atlantic. That trend, underway since 2011, continued in 2026 as the algae, commonly known as a type of seaweed, reached its annual peak in June across a stretch of ocean known as the Great Atlantic Sargassum Belt.

The belt’s Sargassum abundance in June 2026 made it the second-highest Sargassum year in the satellite record, slightly behind 2025, according to scientists at the University of South Florida (USF) College of Marine Science. Regionally, the Caribbean Sea and the Gulf of America (Gulf of Mexico) both hit record highs, according to USF’s June 2026 Sargassum outlook. The western and eastern Caribbean saw 3.6 and 9 million metric tons, respectively, while the Gulf saw 5 million metric tons—nearly double its previous record, also set in 2025. 

“The belt is a basin-scale phenomenon that can have devastating local-scale impacts throughout the Caribbean and Gulf, and satellite observations are the only method that captures both scales on a daily basis,” said Brian Barnes, a marine scientist at the Optical Oceanography Laboratory at USF. “The tracking done by our lab helps communities know the current extent of Sargassum and prepare for what’s to come.”

In moderate amounts in the open ocean, Sargassum provides habitat for turtles, invertebrates, fish, and birds, and adds oxygen to the water through photosynthesis. But too much of it near shore can tangle and suffocate marine life, and mats that sink can smother corals and seagrasses. On beaches, decomposing Sargassum releases hydrogen sulfide, a rotten-egg-smelling gas that’s a potential problem for both ecosystems and tourism.

The map above shows Sargassum density in the tropical Atlantic Ocean in June 2026. Red and orange areas are where Sargassum densities were the highest. Note that although the “belt” appears continuous, discrete Sargassum mats are scattered across the ocean surface. The map is based on satellite measurements of how much of the ocean surface was covered by the seaweed, averaged per pixel across all observations made in June by the OCI (Ocean Color Instrument) on NASA’s PACE (Plankton, Aerosol, Cloud, ocean Ecosystem) satellite.

A detailed map of the Atlantic Ocean centered on the Caribbean Sea shows Sargassum density from low (blue) to high (red) in June 2026.
This detailed view of the same PACE OCI map highlights Sargassum concentrations across the Caribbean Sea and Gulf of America, both of which saw record-high amounts of the floating algae in June 2026.
NASA Earth Observatory/Lauren Dauphin

Ocean currents and winds shape the Sargassum belt, which, despite the patchiness, stretches nearly continuously from West Africa to the Gulf and holds a fairly steady “width” from the western tropical Atlantic westward, explained Chuanmin Hu, also an optical oceanographer at USF. The ocean currents have also spared Florida’s west coast from inundation this summer, while delivering large amounts of seaweed to the Florida Keys and the state’s east coast. The bulk of the Sargassum, however, is visible in the Caribbean Sea, shown in detail above, where problems associated with inundation have been more severe, Hu said.

Data for the maps were provided by Lin Qi, an oceanographer at NOAA’s Center for Satellite Applications and Research, who has been working to generate Sargassum maps based on data from PACE, which was launched in February 2024. The work extends that of Qi and colleagues at USF’s Optical Oceanography Laboratory. This team first developed Sargassum detection techniques using MODIS (Moderate Resolution Imaging Spectroradiometer) on NASA’s long-running Terra and Aqua satellites and VIIRS (Visible Infrared Imaging Radiometer Suite) on the NOAA-20 satellite—data that have been a key component of USF’s Sargassum Watch System and of research into the seaweed’s longer-term trends.

Satellites detect Sargassum by its signals in reflected sunlight. Because of its plant structure and chlorophyll pigments, Sargassum reflects more near-infrared light than water. Scientists flag pixels where the reflectance spikes above the levels produced by plain seawater, and then they use the strength of this spike to estimate Sargassum density, which refers to the fraction of ocean surface covered by the seaweed in each pixel. Density estimates can then be converted into biomass, or the total weight of Sargassum present within a pixel, which is how the longer-term trends in the chart below are tracked.

A chart of Sargassum biomass detected by MODIS since the early 2000s, showing amounts increasing beginning in 2011, with progressively higher spikes through summer 2025 and 2026.
NASA Earth Observatory/Lauren Dauphin

The chart above uses the continuous MODIS record since March 2000 to show how Sargassum biomass across the Great Atlantic Sargassum Belt has changed through June 2026. Notice the uptick beginning around 2011, when the belt was first developing, and the seasonal dips in winter and peaks in spring and summer. The record high in July 2025 stands out, followed by the quick rise in early 2026—especially in the first four months of the year—that culminated in the year’s peak in June. More recent observations, not yet reflected in the chart, indicate Sargassum biomass declined through the following month of July.

“Since the initial appearance of the Great Atlantic Sargassum Belt in 2011, the total Sargassum amount in the Atlantic Ocean has increased substantially, more than doubling every five years,” Hu said. He added that the exact mechanism is still being investigated, but it’s possibly related to ocean warming, multiple nutrient sources, and the fact that large Sargassum mats attract other organisms—such as nitrogen-fixing bacteria—that can supply additional nutrients to sustain further growth.

Alongside data from MODIS and VIIRS, OCI data from PACE now feeds into the Sargassum Watch System’s near-real-time daily and weekly composite maps. A recent study of the central-west Atlantic led by Qi, spanning May through August 2024, found that OCI offers several advantages over its predecessors, observing more of the ocean and detecting Sargassum with greater sensitivity.  

Hu noted that the added pixels from OCI can improve near-real-time monitoring and analyses of short-term fluctuations. And its higher sensitivity, he said, will also lead to improved maps during winter months, “thus helping understand Sargassum changes over time.”

Additionally, the study’s authors found that OCI’s hyperspectral capability makes it the only sensor able to spectrally discriminate Sargassum pixels across the Atlantic Ocean “without ambiguity,” adding confidence to the interpretation of detected image features—especially in parts of the Atlantic where another type of floating algae, Trichodesmium, has been reported.

“I think I can speak for all project members, past and present, in sharing how rewarding it is to see the promise of PACE’s advancements come to life,” said Jeremy Werdell, PACE project scientist at NASA’s Goddard Space Flight Center. “OCI has started a true renaissance in aquatic ecosystem monitoring from space.”

NASA Earth Observatory maps and chart by Lauren Dauphin, using PACE and MODIS data courtesy of Lin Qi (NOAA), and Brian Barnes and Chuanmin Hu (University of South Florida, Optical Oceanography Laboratory). Story by Kathryn Hansen.

Downloads

Map of the Atlantic Ocean showing Sargassum density from low (blue) to high (red) in June 2026, with the highest concentrations in the tropical Atlantic.

June 2026

JPEG (2.43 MB)

References & Resources

You may also be interested in:

Stay up-to-date with the latest content from NASA as we explore the universe and discover more about our home planet.

Color Off the Mid-Atlantic Coast

4 min read

Something is brewing in shallow waters offshore of Delaware, New Jersey, Maryland, and Virginia.

Article

A Turquoise Tint for the Black Sea

3 min read

Phytoplankton added a milky blue hue to the waters of the Black Sea and nearby waterways in spring and summer…

Article

El Niño Is Underway

4 min read

Satellite observations of sea surface height indicated that the 2026 event continued to strengthen in early June.

Article

NASA Science Soars During August Total Solar Eclipse

27 July 2026 at 19:01

6 min read

NASA Science Soars During August Total Solar Eclipse

Each time the Moon covers the Sun during a total solar eclipse — darkening daytime skies and briefly revealing the Sun’s ethereal outer atmosphere, the corona — it presents new opportunities to better understand our star and its influence on Earth.

On Wednesday, Aug. 12, as the next total solar eclipse sweeps over Greenland, Iceland, and Spain, NASA-funded science teams will be chasing the Moon’s shadow with a high-altitude jet and scientific balloons to investigate the Sun’s dynamics and how the temporary darkening of our skies affects our atmosphere.

“From our unique perspective on Earth during a total solar eclipse, scientists can study the Sun’s corona in a way we can’t from anywhere else in the solar system,” said Kelly Korreck, eclipse program manager at NASA Headquarters in Washington. “The Sun impacts our daily life, satellites, and astronauts in space, and we can take advantage of this moment to advance our understanding of that influence.”

High-flying jet to record solar dynamics

Soaring in the nose cone of NASA’s WB-57 high-altitude research aircraft is a suite of four cameras to take high-resolution images of the corona in several different wavelengths of visible and infrared light. Part of an instrument developed by the NASA Scientifically Calibrated In-Flight Imagery (SCIFLI) team at NASA’s Langley Research Center in Hampton, Virginia, the cameras will capture at least 20 images per second, recording structures, outflows, and rapid changes in the corona during the total solar eclipse.

With these images, scientists hope to learn more about the formation of prominences (solar material that gets suspended above the Sun’s surface), better understand the corona and how it gets heated to nearly a million degrees, and investigate how material in the corona and the solar wind are related, which flows out from the Sun across the solar system.

These images of the corona and solar prominences were taken in different wavelengths of visible and infrared light by imagers aboard a NASA’s WB-57 jet during the April 8, 2024, total solar eclipse. The same cameras will fly on a NASA WB-57 jet again during the Aug. 12 eclipse.
NASA / SwRI / William Ashfield

By chasing the Moon’s shadow, the jet will extend how long the cameras can observe the corona. On the ground, the longest anyone will be able to see the corona is two minutes and 18 seconds. But flying along the eclipse path at 460 miles per hour, the jet’s view of the corona will last nearly three minutes.

NASA’s WB-57 will fly at 50,000 feet, above any clouds that might obscure the view of the corona from the ground. The altitude also allows the cameras to observe some infrared wavelengths that get absorbed by the lower atmosphere before reaching the ground, and the corona only has been observed in those wavelengths a few times before.

A small white airplane sis on a beige tarmac. It has a skinny nosecone and a fin that sticks straight up, with the NASA insignia.
One of NASA’s WB-57 high-altitude jets will carry a suite of cameras up to 50,000 feet to capture images of the solar corona during the Aug. 12 total solar eclipse.
NASA

The instrument, called SCIFLI Multispectral Airborne Imager, or SAMI, also flew on a WB-57 during the total solar eclipse on April 8, 2024, providing valuable imagery and information about the corona. However, the study’s principal investigator, Amir Caspi of the Southwest Research Institute in Boulder, Colorado, says each total solar eclipse provides new opportunities to learn more about the corona.

“The Sun is always changing,” Caspi said. “Every eclipse is different. So we could see things we didn’t see before. And we learn from each eclipse how to better observe the next one.”

Caspi’s team also is making some enhancements for the 2026 campaign based on lessons learned in 2024. For example, the team will adjust exposure times to better capture bright features that were overexposed in 2024 imagery. They will also leverage software developed since 2024 to process and analyze the data sooner than before.

The experiment is funded by NASA’s Heliophysics Low Cost Access to Space Program.

As a total solar eclipse crosses Russia, Greenland, Iceland, Spain, and Portugal on Aug. 12, 2026, some of the best views will come from 50,000 feet up, aboard NASA’s WB-57 jet. Credit: NASA’s Goddard Space Flight Center

Balloons to watch atmospheric changes

When a total solar eclipse suddenly turns daytime skies dark, our atmosphere changes in ways we don’t yet fully understand.

The NASA-supported Nationwide Eclipse Ballooning Project, led by Angela Des Jardins at Montana State University, is sending students from several U.S. universities to Iceland and Spain to launch scientific balloons before, during, and after the eclipse to better understand those changes.

A photograph shows several people in silhouette standing in a large field in front of the setting Sun, gathered around a large, round, white balloon floating just above their heads against a blue sky.
A student team from the University of Kentucky prepares to launch a ballon from Bloomington, Indiana, to take atmospheric measurements on April 8, 2024, during the 2024 Nationwide Eclipse Ballooning Project campaign.
Sean Bailey (University of Kentucky)

In Iceland, two teams will launch a total of 80 balloons starting 18 hours before the eclipse until eight hours afterward to study how the eclipse affects Earth’s “boundary layer,” the part of the atmosphere that touches the ground. The thickness of the boundary layer changes depending on factors such as surface temperature and moisture in the air.

Previous balloon flights during solar eclipses in October 2023 and April 2024 showed that the boundary layer collapsed, or decreased in thickness, in locations with clear skies but not where there were cloudy skies. Scientists wonder whether that will be different in Iceland in 2026. Changes in the boundary layer are driven by the day-night cycle. However, in Iceland in August, the days are long and nights are short, so the nighttime influences might not be as strong as in 2023 or 2024.

“Will this eclipse be able to collapse the boundary layer?” said Matthew Bernards, a chemical engineering professor at the University of Idaho, who leads one of the Iceland teams.

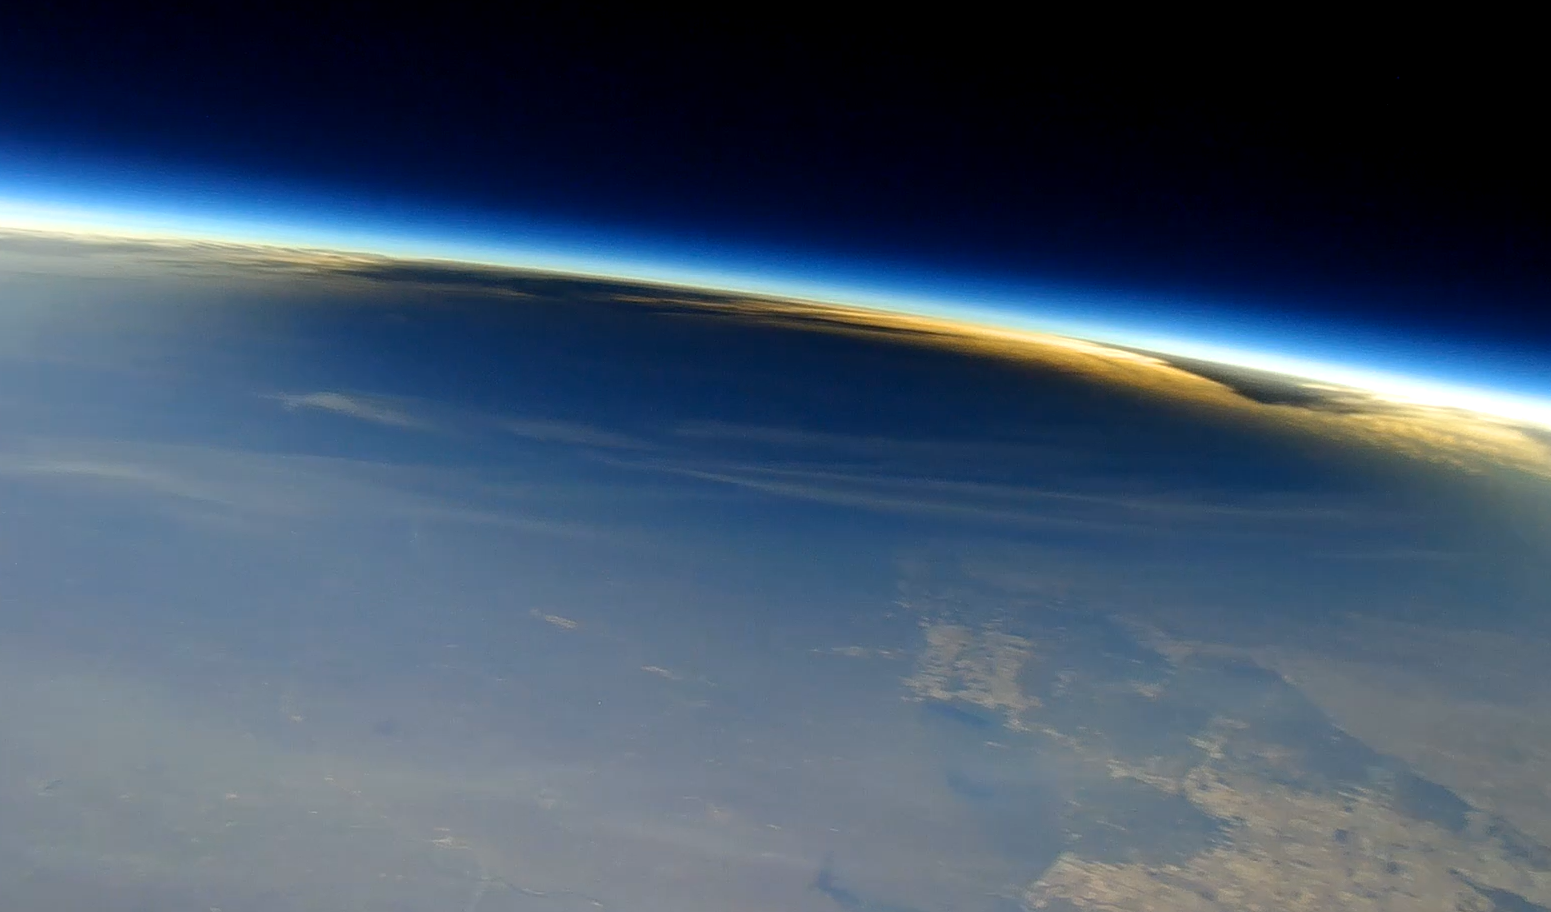
A small part of Earth appears in the lower portion of the view, with the blackness of space in the background at the top. The atmosphere appears as a thin, blue band separating Earth from space. Projected on to Earth is a dark, oval-shaped shadow cast by the Moon during a total solar eclipse.
This image shows the Moon’s shadow on Earth during the total solar eclipse on April 8, 2024, as seen from about 90,000 feet from a camera carried by a scientific balloon. Cameras carried by balloons launched from Spain will capture similar images during the Aug. 12 total solar eclipse.
Nationwide Eclipse Ballooning Project/Virginia Tech

In Spain, three balloon teams will launch a total of six balloons with 360-degree cameras to image the eclipse shadow from above. These balloons also will include instruments designed to measure levels of ozone in the atmosphere, which requires sunlight to form. Similar balloon experiments showed that ozone decreased during totality in April 2024. Scientists wonder whether there will be differences with this eclipse, particularly since it happens at a later time of day and during a different season.

The NASA-funded Nationwide Eclipse Ballooning Project will allow teams of students from across the U.S. to get a unique view of the August total solar eclipse with scientific balloons. Credit: NASA’s Goddard Space Flight Center

Follow along

While the total solar eclipse won’t be visible in the U.S., some parts of the country will be able to see a partial solar eclipse. Learn more about where to see the eclipse and how to view it safely.

by Vanessa Thomas
NASA’s Goddard Space Flight Center, Greenbelt, Md.

Lee esta historia en español aquí.

Keep Exploring

Discover More Topics From NASA

NASA’s Swift Sees ‘Wandering’ Mega Black Hole Shredding Star

27 July 2026 at 17:06
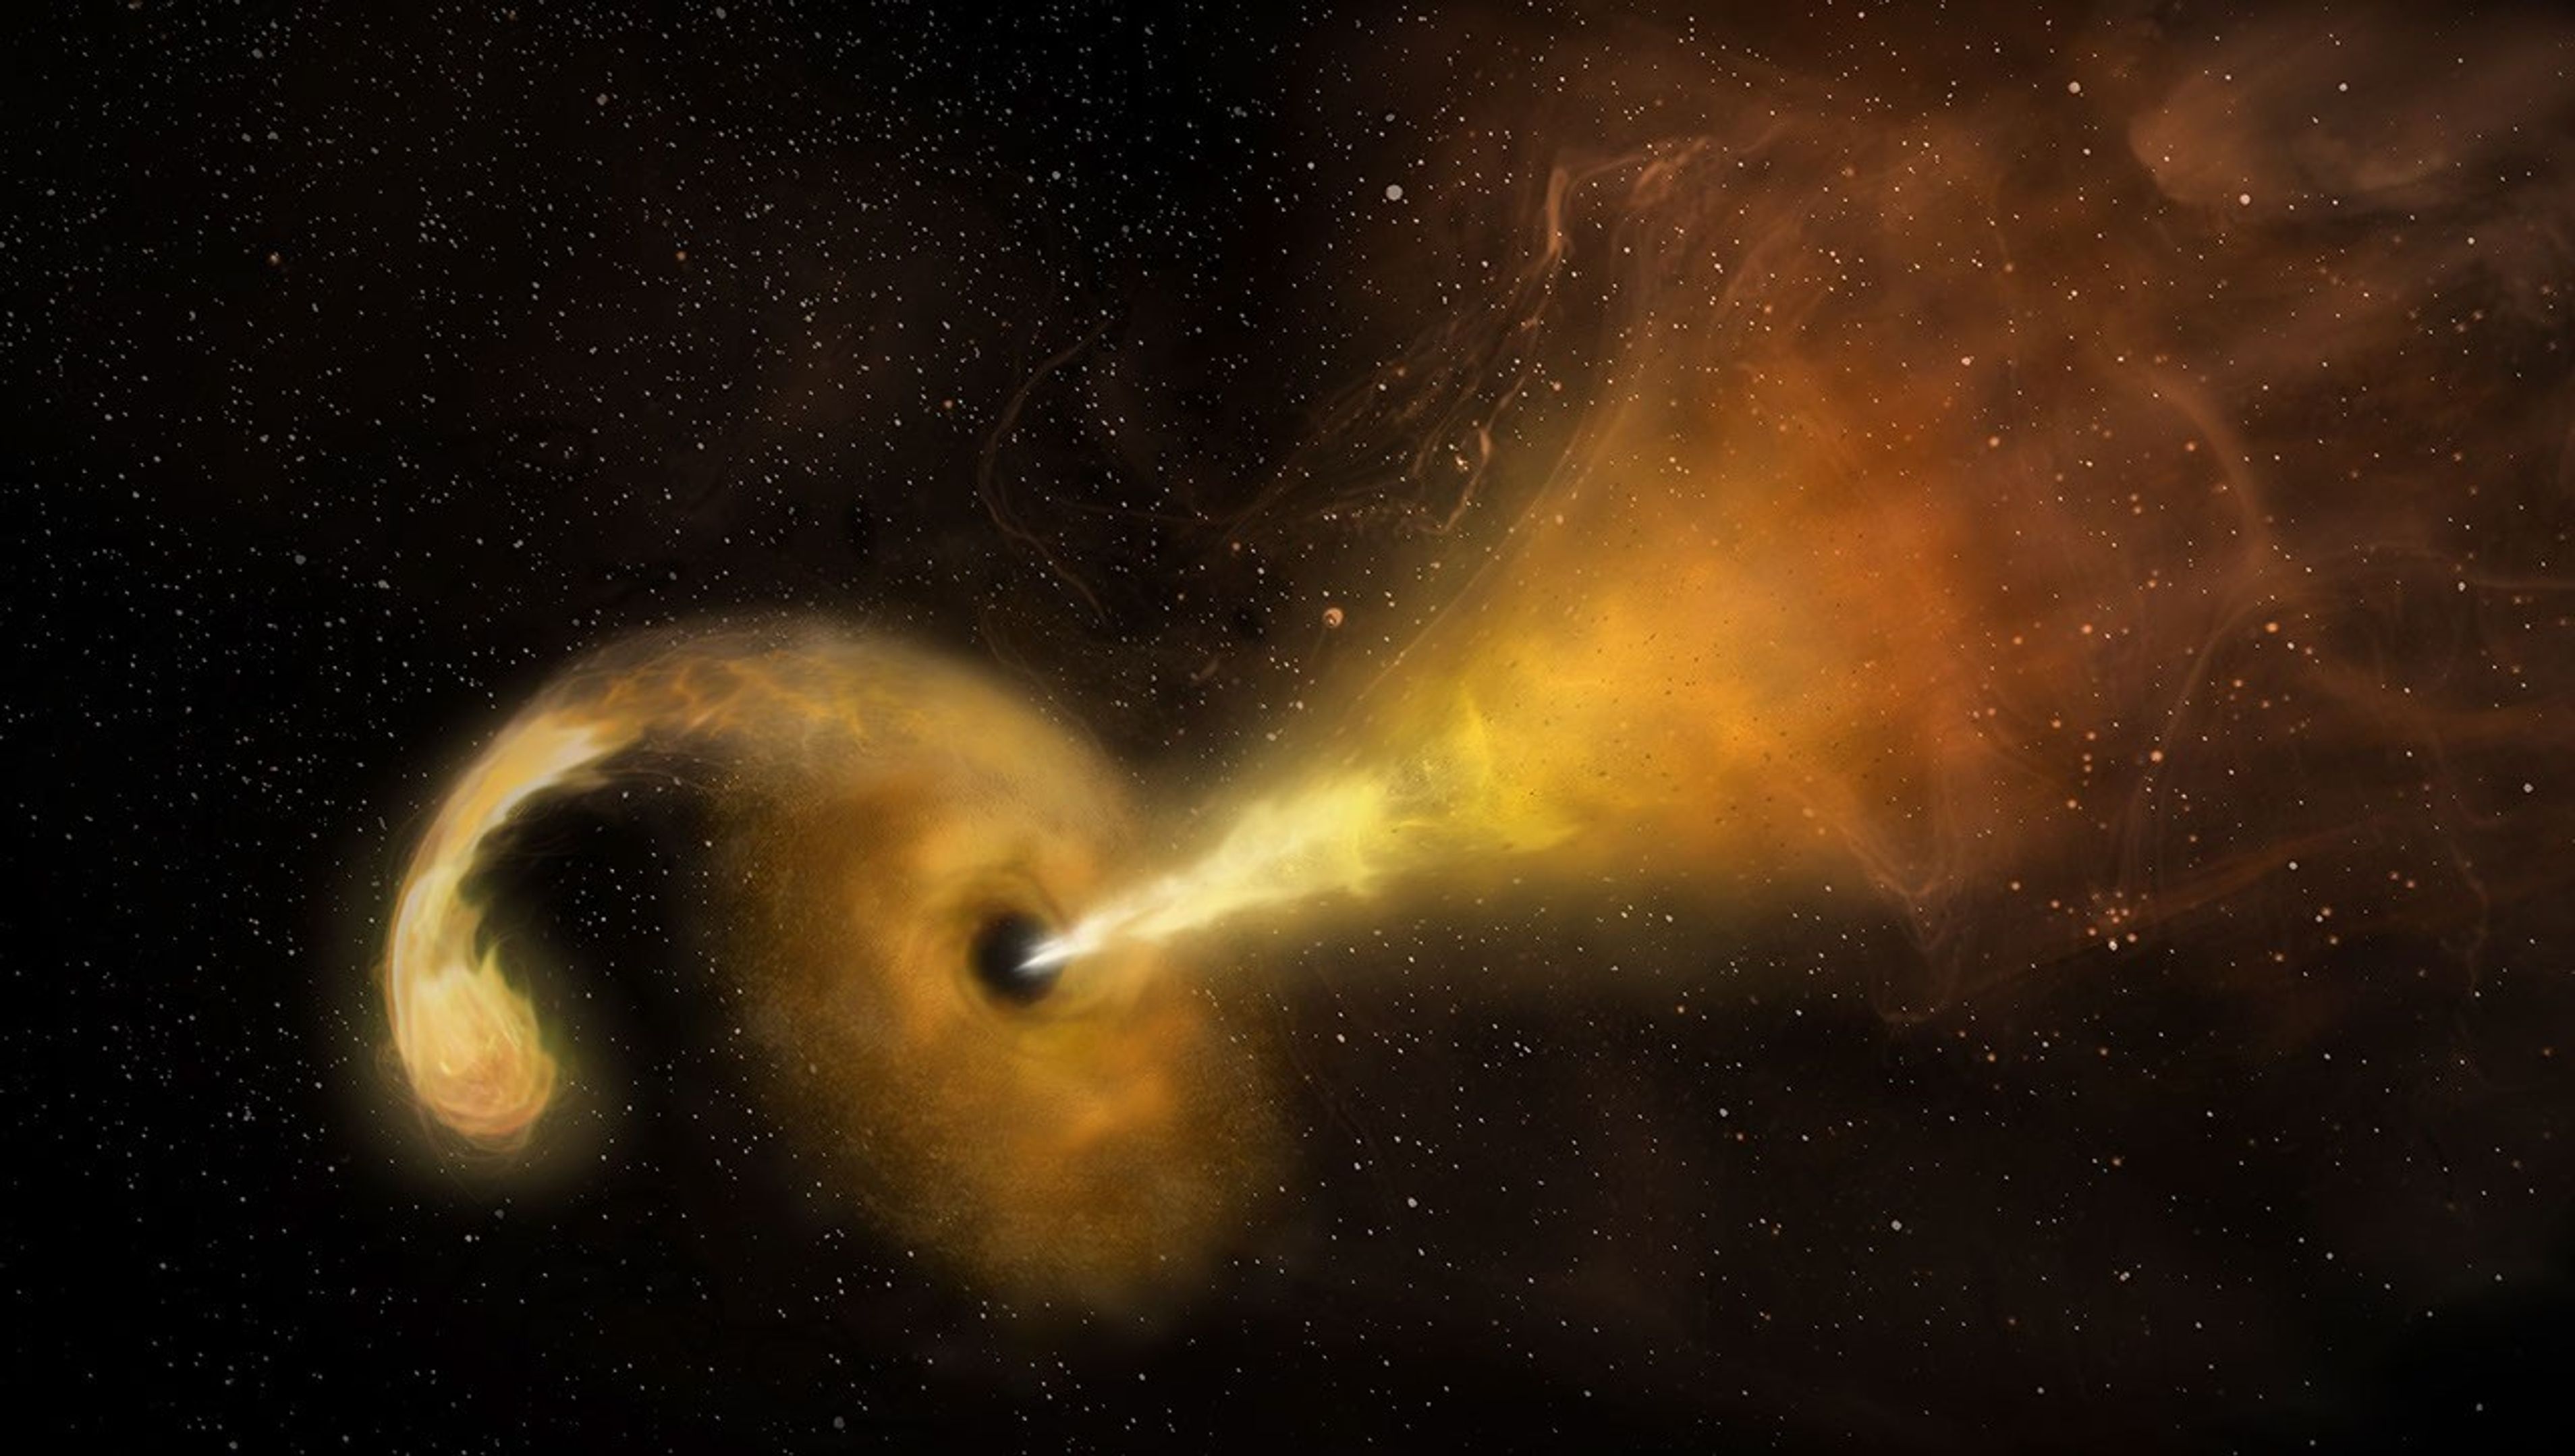
An artist's concept of a tidal disruption event
This artist’s concept depicts a tidal disruption event, which occurs when a star passes fatally close to a supermassive black hole. Crumbs of the splintering star heat up as they swirl around the black hole, creating a glow astronomers can see from far across the cosmos, and the black hole launches a relativistic jet into space.
NRAO/AUI/NSF/NASA

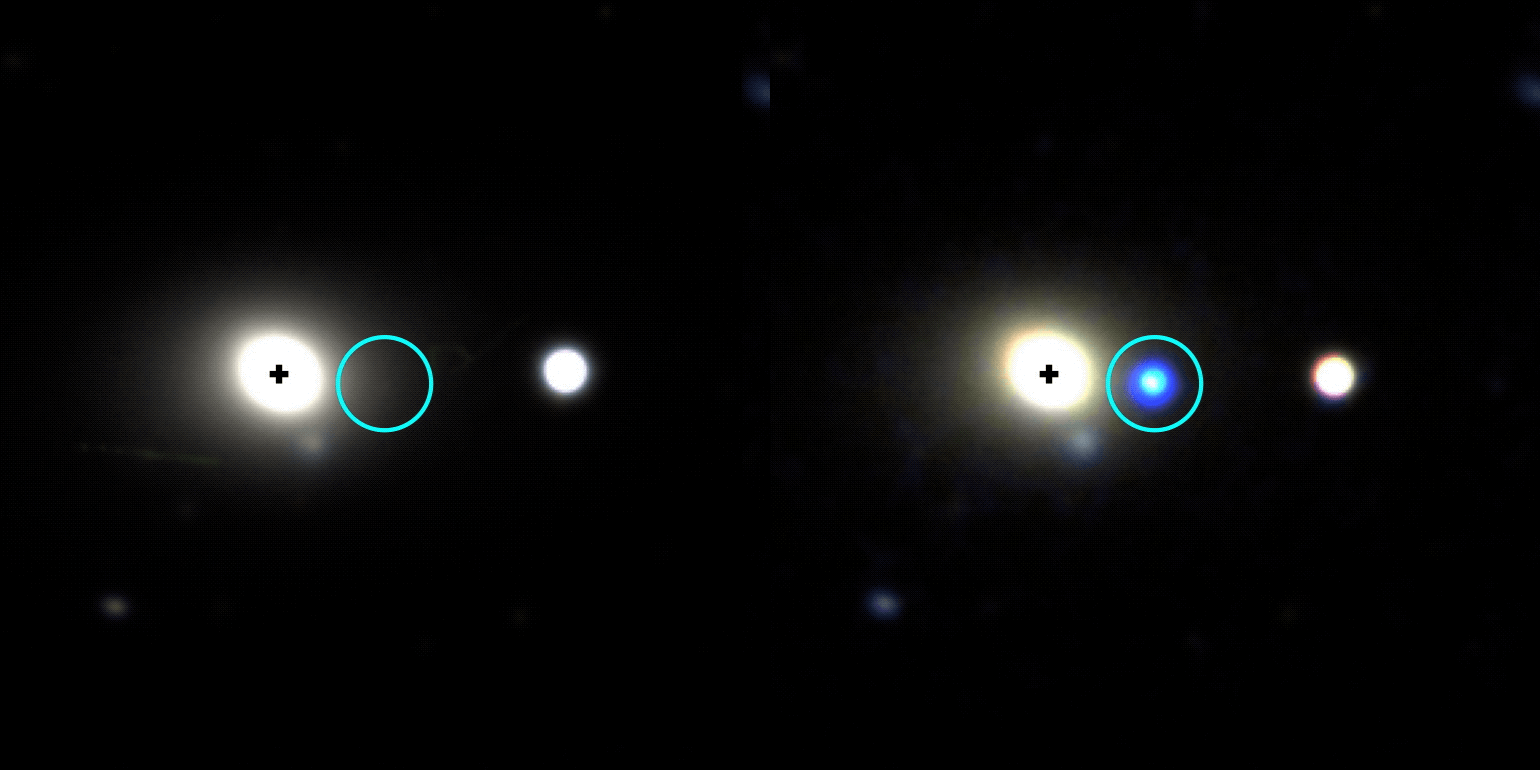
NASA’s Neil Gehrels Swift Observatory captured an “orphan” black hole lighting up as it devoured a star on the outskirts of a faraway galaxy. These phenomena are rare to begin with, and none had ever before been seen so far outside of a galaxy’s core.

“We were looking for these star-shredding events as a way to find otherwise invisible supermassive black holes wandering away from the galactic cores where they usually reside,” said Robert Stein, a research fellow at The University of Maryland, College Park and NASA’s Goddard Space Flight Center in Greenbelt, Maryland. “With this discovery, which is one of just a couple that have been confirmed so far, we’ve validated a new technique and can use it to hunt for more.”

A paper describing the results, led by Stein, was published Monday in The Astrophysical Journal Letters.

Researchers saw an ultrabright flare unleashed by a star being torn apart by extreme gravitational forces after drifting too close to a monster black hole — a phenomenon called a tidal disruption event. The black hole behind the blast weighs in at about a million times the Sun’s mass. Its existence was first flagged in November 2025 as an unusual brightening in a galaxy about 750 million light-years away by ZTF (Zwicky Transient Facility), a survey conducted by the Palomar Observatory in Southern California.

“Out of the half million flashes ZTF detects each night, our new artificial intelligence algorithm automatically recognized a flare that looked a lot like a tidal disruption event, despite its unusual location in the outskirts of a galaxy,” Stein said. For a few months, the tidal disruption event outshone its entire host galaxy in ultraviolet wavelengths, temporarily radiating with the light of about 10 billion suns.

Animated observation showing the appearance of a blue orb
This gif shows the galaxy WISEA J014656.04-152214.7, located about 750 million light-years away in the constellation Cetus, before and after a tidal disruption event was spotted on its outer edge in November 2025. The image at left was taken by the DESI (Dark Energy Spectroscopic Instrument) Legacy Survey and the one at right is from the Lowell Discovery Telescope.
Lowell Discovery Telescope/Legacy Survey/Robert Stein

Other telescopes, including the SOAR (Southern Astrophysical Research) telescope in Chile, followed up on the ZTF source to look at the event’s spectrum, which revealed features supporting that it was likely a tidal disruption event. Astronomers then used NASA’s Swift to look at wavelengths they can’t detect with ground-based telescopes to uncover new information. For example, Swift’s UVOT (Ultraviolet/Optical Telescope) took the blip’s temperature and found that it had quite a fever at about 54,000 degrees Fahrenheit (30,000 degrees Celsius).

“The combination of all this data helped us rule out other explanations and confidently say it’s a tidal disruption event, despite its strange location,” said Jonathan Carney, a doctoral student at the University of North Carolina at Chapel Hill, who took the first spectra that supported the flare’s interpretation as a tidal disruption event.

Hidden heavyweights

Nearly every galaxy in the universe is anchored by a supermassive black hole sitting right in the center. About once every 100,000 years, a star will drift too close to this invisible heavyweight and trigger a tidal disruption event.

While they’re rather rare in any given galaxy, scientists scour millions of galaxies for them. Each year, astronomical surveys typically spot about 30 tidal disruption events occurring somewhere in the universe.

Prior to 2024, they’d only been seen in galaxy cores. That’s partly because astronomers mainly looked for them there; after all, it’s where all the known supermassive black holes were, and you can’t get a tidal disruption event without one (the gravitational pull of lighter black holes isn’t strong enough).

Then scientists saw the telltale signs of a star being shredded 2,600 light-years from the center of its host galaxy. That inspired more astronomers to look beyond galaxy cores for similar events, and now a team has identified one more than 30,000 light-years away from a galaxy’s center.

This video visualizes a star approaching a supermassive black hole so closely that it’s stretched to a breaking point by the black hole’s strong gravity. Intense tidal forces crack the star open and hurl its gaseous guts outward. Stellar debris forms a spinning accretion disk as it continues to spiral into the black hole.
NASA, ESA, STScI, Ralf Crawford (STScI)

Oddball origin story

So how did the newfound black hole become so off-kilter?

“It must have originated in a galaxy’s center, but not the one it’s in the outskirts of now,” Stein said. “We think the host galaxy’s supermassive black hole is still at its core, but the one eating the star could have started off in a small galaxy that merged with the big one we see today.”

The researchers have outlined two possibilities. Three or more galaxies may have merged together, and the gravitational tug-of-war between their central supermassive black holes may have flung the lightest black hole out to the galaxy’s edge.

Or a dwarf galaxy could be midway through a merger. As the dwarf’s stars fell into the larger galaxy, one may have passed too close to the dwarf’s supermassive black hole.

“Further discoveries could reveal the origin of this apparent ‘orphan’ black hole,” Stein said. “The key science question we want to answer is: How common are wandering black holes?”

The answer may soon be within reach. “Pointed science observations with Swift’s UVOT and XRT (X-Ray Telescope) instruments are temporarily suspended as the mission awaits an orbit boost, which is planned for this summer,” said co-author S. Bradley Cenko, Swift’s principal investigator at NASA Goddard. The spacecraft, whose primary mission ran from 2004 to 2006, is slowly sinking toward Earth due to atmospheric drag after more than 20 years of observations of the changing universe. Nudging it to a higher orbit could extend its lifetime even longer. “Once it resumes normal operations, Swift could continue searching for more examples of out-of-place black holes.”

In the coming years, scientists will use the new technique to search for disintegrating stars in observations from the newly operational Vera C. Rubin Observatory, jointly funded by the U.S. Department of Energy and National Science Foundation, in Chile and NASA’s upcoming Nancy Grace Roman Space Telescope.

“Rubin’s wide, deep surveys will reveal a much larger sample of tidal disruption events than current observatories are capable of collecting, including ones that are off-center,” Carney said. “And Roman’s space-based surveys will extend the current search zone by seeing ones that are farther away, looking back through 9 billion years of cosmic history.” Adding their observations to Swift’s and those from ground-based observatories will bring astronomers closer than ever before to completing a census of the universe’s behemoth black holes.

To learn more about the Swift mission, visit:

https://nasa.gov/swift

By Ashley Balzer
NASA’s Goddard Space Flight Center, Greenbelt, Md.

Media contact:

Claire Andreoli
NASA’s Goddard Space Flight Center, Greenbelt, Md.
301-286-1940

NASA’s Hubble Shows Star Formation in Andromeda Galaxy Winding Down

27 July 2026 at 15:00
6 Min Read

NASA’s Hubble Shows Star Formation in Andromeda Galaxy Winding Down

The left half of the disk of the Andromeda galaxy, with a jagged outer edge at the top and bottom on a black background. At right, the galaxy’s center is a horizontal yellow oval extending across about a third of the image. Two crescent shaped clumpy, dark dust lanes with abundant stars throughout extend out from the center. The galaxy becomes bluer as you move outward. At top middle, the satellite galaxy M32 appears as a small, fuzzy yellow oval. Within the disk of Andromeda, two regions at upper right and lower middle are outlined in small white boxes labeled 1 and 2, respectively. At the left side of the image, those two regions are enlarged in pullouts. Both contain a dense, grainy-appearing field of thousands of stars. Region 1 is noticeably bluer than region 2 and contains blue star-forming clumps.
NASA Hubble’s view of part of the Andromeda galaxy.
Credits:
Image: NASA, ESA, Benjamin Williams (UWashington), Zhuo Chen (UWashington), L. Clifton Johnson (Northwestern); Image Processing: Joseph DePasquale (STScI)

A new study using data from NASA’s Hubble Space Telescope finds that star formation in the nearby Andromeda galaxy has undergone a 500-million-year decline, with an even steeper drop in the last 40 million years. Andromeda, a spiral galaxy comparable in size to our Milky Way, is close enough to be seen with the unaided eye from areas with dark skies. Located about 2.5 million light-years from Earth, practically our cosmic backyard, Andromeda offers an opportunity for astronomers to examine its stellar populations in detail, leading to better understanding of the past of galaxies like our own.

The results published Monday in The Astrophysical Journal.

To reach this conclusion, the researchers combined data from two Hubble surveys: the Panchromatic Hubble Andromeda Treasury and the Panchromatic Hubble Andromeda Southern Treasury. Together, these two surveys mapped two-thirds of the disk of Andromeda in ultra-sharp detail. In total, the team measured about 200 million individual stars across the galaxy, giving them a detailed picture of Andromeda’s past activity.

“We need to measure the individual stars because they are the fossil record of the galaxy’s formation. Hubble is the only telescope that can give you high enough spatial resolution over a large enough area to be able to do that in Andromeda,” said Ben Williams, astronomer at the University of Washington and a co-author on the study.

Massive stars are bluer and short-lived, while less massive stars are redder and longer-lived. As a result, areas that have experienced recent star formation tend to have a larger fraction of blue stars, while areas with less recent star formation typically have a redder population. The team divided the Andromeda images into thousands of squares, spanning 300 light-years on each side of the square, and determined the history of star formation within each parcel to gain a comprehensive view of the galaxy’s past.

NASA’s Hubble Space Telescope has provided a detailed view of millions of stars in the Andromeda galaxy. Regions that have experienced recent star formation (1) appear significantly bluer than regions with less recent star formation (2).
NASA, ESA, Benjamin Williams (UWashington), Zhuo Chen (UWashington), L. Clifton Johnson (Northwestern); Image Processing: Joseph DePasquale (STScI)

Steady decline

Previous research showed the Andromeda galaxy experienced a dramatic burst of star formation about 2 billion years ago, likely due to a past interaction or merger with another galaxy. Since that time, star formation has been steadily declining.

Astronomers measure the rate of star formation in terms of the mass, or amount of gas and dust, converted into stars per year. The researchers calculated that, 500 million years ago, Andromeda formed stars at a rate of about one solar mass per year. However, the formation rate dropped to about half that by 40 million years ago. The current rate has plummeted even farther, to about one-fifth the mass of our Sun per year.

The team also examined whether that decline was consistent across the galaxy or concentrated in certain areas. They found that much of the recent star formation has occurred in a star-forming ring located about 32,000 light-years from the galaxy’s center. As a result, much of the decline they measure is driven by decreasing activity within that ring.

Rather than being the result of reduced material from which new stars can form, the decline is more likely to be a natural winding down from its previous, more active state.

“It’s just like after running a marathon, sometimes you’ve got to take a bit of a breather,” said Tobin Wainer, lead author, University of Washington.

Likely suspect

The team also investigated whether there was any connection between the decrease of activity in Andromeda and its proximity to satellite galaxy M32 (Messier 32). The M32 galaxy is separated from Andromeda by about 16,000 light-years in the plane of the sky; however, its 3D location in space is uncertain. As a result, astronomers are unsure if or when it might have interacted with Andromeda in the past.

“One of the major motivations for this program was to probe potential interactions between M32 and Andromeda’s disk,” said Zhuo Chen, co-author, University of Washington.

Survey data from the Panchromatic Hubble Andromeda Southern Treasury allowed the team to study the history of star formation in Andromeda near M32. They found that this area showed signs of decreased star formation compared with other regions. The timing of this decrease, which this study finds began roughly 60 million years ago, could help constrain when the M32 galaxy interacted with Andromeda’s disk.

“We can’t explicitly say that we are seeing a decrease in star formation because of M32. But it’s right there, and it’s definitely the most likely suspect,” said Wainer.

This movie, created from an analysis of data from NASA’s Hubble Space Telescope, demonstrates how the rate of star formation in the Andromeda galaxy has declined over the past 500 million years. Brighter colors indicate where star formation was highest during a given time.
Visualization: Tobin Wainer (UWashington); Image Processing: Joseph DePasquale (STScI); Video: NASA, ESA, STScI, Gregory Bacon (STScI)

The team plans to continue analyzing the Hubble data and combine it with data from ground-based observatories to gain additional insights into the history of Andromeda.

“There’s a strong scientific value to this archival data. Andromeda is important because it’s a neighbor that is close enough that we can see it in great detail while also getting a global perspective,” said Raja GuhaThakurta, co-author, University of California Santa Cruz.

An even greater global perspective is likely to come from NASA’s Nancy Grace Roman Space Telescope after it launches as early as Sunday, Aug. 30. Roman’s gigantic field of view can cover at least 100 times as much area as Hubble at near-infrared wavelengths in a single observation. A newly approved Roman observing program will image the entirety of Andromeda’s disk and areas of its surrounding halo, allowing astronomers to measure hundreds of millions of stars and enabling groundbreaking new science.

The Hubble Space Telescope has been operating for more than three decades and continues to make ground-breaking discoveries that shape our fundamental understanding of the universe. Hubble is a project of international cooperation between NASA and ESA (European Space Agency). NASA’s Goddard Space Flight Center in Greenbelt, Maryland, manages the telescope and mission operations. Lockheed Martin Space also supports mission operations at Goddard. The Space Telescope Science Institute in Baltimore, which is operated by the Association of Universities for Research in Astronomy, conducts Hubble science operations for NASA.


Related Images & Videos

The left half of the disk of the Andromeda galaxy, with a jagged outer edge at the top and bottom on a black background. At right, the galaxyu2019s center is a horizontal yellow oval extending across about a third of the image. Two crescent shaped clumpy, dark dust lanes with abundant stars throughout extend out from the center. The galaxy becomes bluer as you move outward. At top middle, the satellite galaxy M32 appears as a small, fuzzy yellow oval. Within the disk of Andromeda, two regions at upper right and lower middle are outlined in small white boxes labeled 1 and 2, respectively. At the left side of the image, those two regions are enlarged in pullouts. Both contain a dense, grainy-appearing field of thousands of stars. Region 1 is noticeably bluer than region 2 and contains blue star-forming clumps.

Andromeda Galaxy

NASA’s Hubble Space Telescope has provided a detailed view of millions of stars in the Andromeda galaxy.

On a black background, a pixelated, partial ring of bright pink and purple extends from 8 ou2019clock clockwise to 3 ou2019clock. There is a black gap at the bottom of the ring as well as in the middle. Below the ring, a timeline labeled millions of years ago lists the numbers 500, 200, 100, 50, 25, 0. The numbers 500 and 200 are yellow with a yellow line between them, indicating that the image shows the rate of star formation that was occurring in that timeframe.

Star Formation Rate in Andromeda Over Time

This movie, created from an analysis of data from NASA’s Hubble Space Telescope, demonstrates how the rate of star formation in the Andromeda galaxy has declined over the past 500 million years.


Share

Details

Last Updated
Jul 27, 2026
Editor
Andrea Gianopoulos
Contact
Media

Claire Andreoli
NASA’s Goddard Space Flight Center
Greenbelt, Maryland
claire.andreoli@nasa.gov

Christine Pulliam
Space Telescope Science Institute
Baltimore, Maryland

NASA’s ESCAPADE Snaps Family Portrait of Earth, Moon

24 July 2026 at 18:47

On July 3, one of NASA’s two Mars-destined ESCAPADE (Escape and Plasma Acceleration and Dynamics Explorers) spacecraft captured photos of Earth and the Moon in visible and thermal infrared light. At the time, the spacecraft was 363,250 miles (584,600 kilometers) from Earth and 115,600 miles (186,100 kilometers) from the Moon, making the Moon appear relatively large.

Taken with the Sun only partly illuminating Earth and the Moon, the visible light image shows the two bodies as crescents, with only around 8% of each face sunlit. Yet in the thermal infrared image, the shadowed hemisphere of Earth is illuminated by its own heat from both the atmosphere and surface, glowing at minus 10 to minus 44 degrees Fahrenheit (250 to 280 kelvins). Without the insulating blankets of oceans and atmospheres, the Moon’s far side remains at a much cooler minus 280 degrees Fahrenheit (100 kelvins).

visible light
thermal infrared light
A black background with a thin white crescent on the left representing the Earth, and a thin off-white crescent on the right represents the Moon.
Caption: In these images from NASA’s ESCAPADE mission, Earth (left) and Moon (right) can be seen. The image to the left of the slider shows visible light reflected by the Sun while the infrared image to the right shows the bodies’ emitted energy. White rings have been added in the thermal image to show the actual size of Earth and the Moon. Credit: NASA/UCB-SSL/NAU-Radiant/Lucint
NASA/UCB-SSL/NAU-Radiant/Lucint
On a pitch black background sits a bright circle on the left filled with yellow, orange, and red and surrounded by a faint halo of purple. On the right, is a circle outlined with a white line, filled with black and a thin purple crescent on the right side of the circle.
In these images from NASA’s ESCAPADE mission, Earth (left) and Moon (right) can be seen. The image to the left of the slider shows visible light reflected by the Sun while the infrared image to the right shows the bodies’ emitted energy. White rings have been added in the thermal image to show the actual size of Earth and the Moon.
NASA/UCB-SSL/NAU-Radiant/Lucint
visible light
thermal infrared light

ESCAPADE Photos of Earth and Moon

July 3, 2026

In these images from NASA’s ESCAPADE mission, Earth (left) and Moon (right) can be seen. The image to the left of the slider shows visible light reflected by the Sun while the infrared image to the right shows the bodies’ emitted energy. White rings have been added in the thermal image to show the actual size of Earth and the Moon. Credit: NASA/UCB-SSL/NAU-Radiant/Lucint

The ESCAPADE mission used its Visible and Infrared Observation System cameras, provided by Northern Arizona University in Flagstaff, to capture the images, which are more than just road trip photo album snaps.

“We are thrilled that ESCAPADE was able to accommodate these excellent space-qualified cameras which will search for visible Martian aurora and investigate thermal properties of the Martian surface and atmosphere,” said Rob Lillis, the mission’s principal investigator at the University of California, Berkeley. “Since Earth and the Moon are well-known targets, imaging them provides an important calibration check for ESCAPADE’s cameras.”

The ESCAPADE spacecraft, which were built by Rocket Lab, are currently in a “loiter” orbit around Lagrange point 2, a location in space about a million miles from Earth. In November 2026, the spacecraft will fly by Earth to use the planet’s gravity to slingshot their way to Mars. When the spacecraft arrive in September 2027, they will study how a million-mile-per-hour stream of material flowing from the Sun, known as solar wind, interacts with the Martian environment and how that drives atmospheric loss at the Red Planet.

The ESCAPADE mission is funded by NASA’s Heliophysics Division and is part of the NASA Small Innovative Missions for Planetary Exploration program. The UC Berkeley’s Space Sciences Laboratory leads the mission with key partners Rocket Lab; NASA’s Goddard Space Flight Center in Greenbelt, Maryland; Embry-Riddle Aeronautical University; Advanced Space; and Blue Origin.

By Mara Johnson-Groh
NASA’s Goddard Space Flight Center, Greenbelt, Md.

The post NASA’s ESCAPADE Snaps Family Portrait of Earth, Moon appeared first on NASA Science.
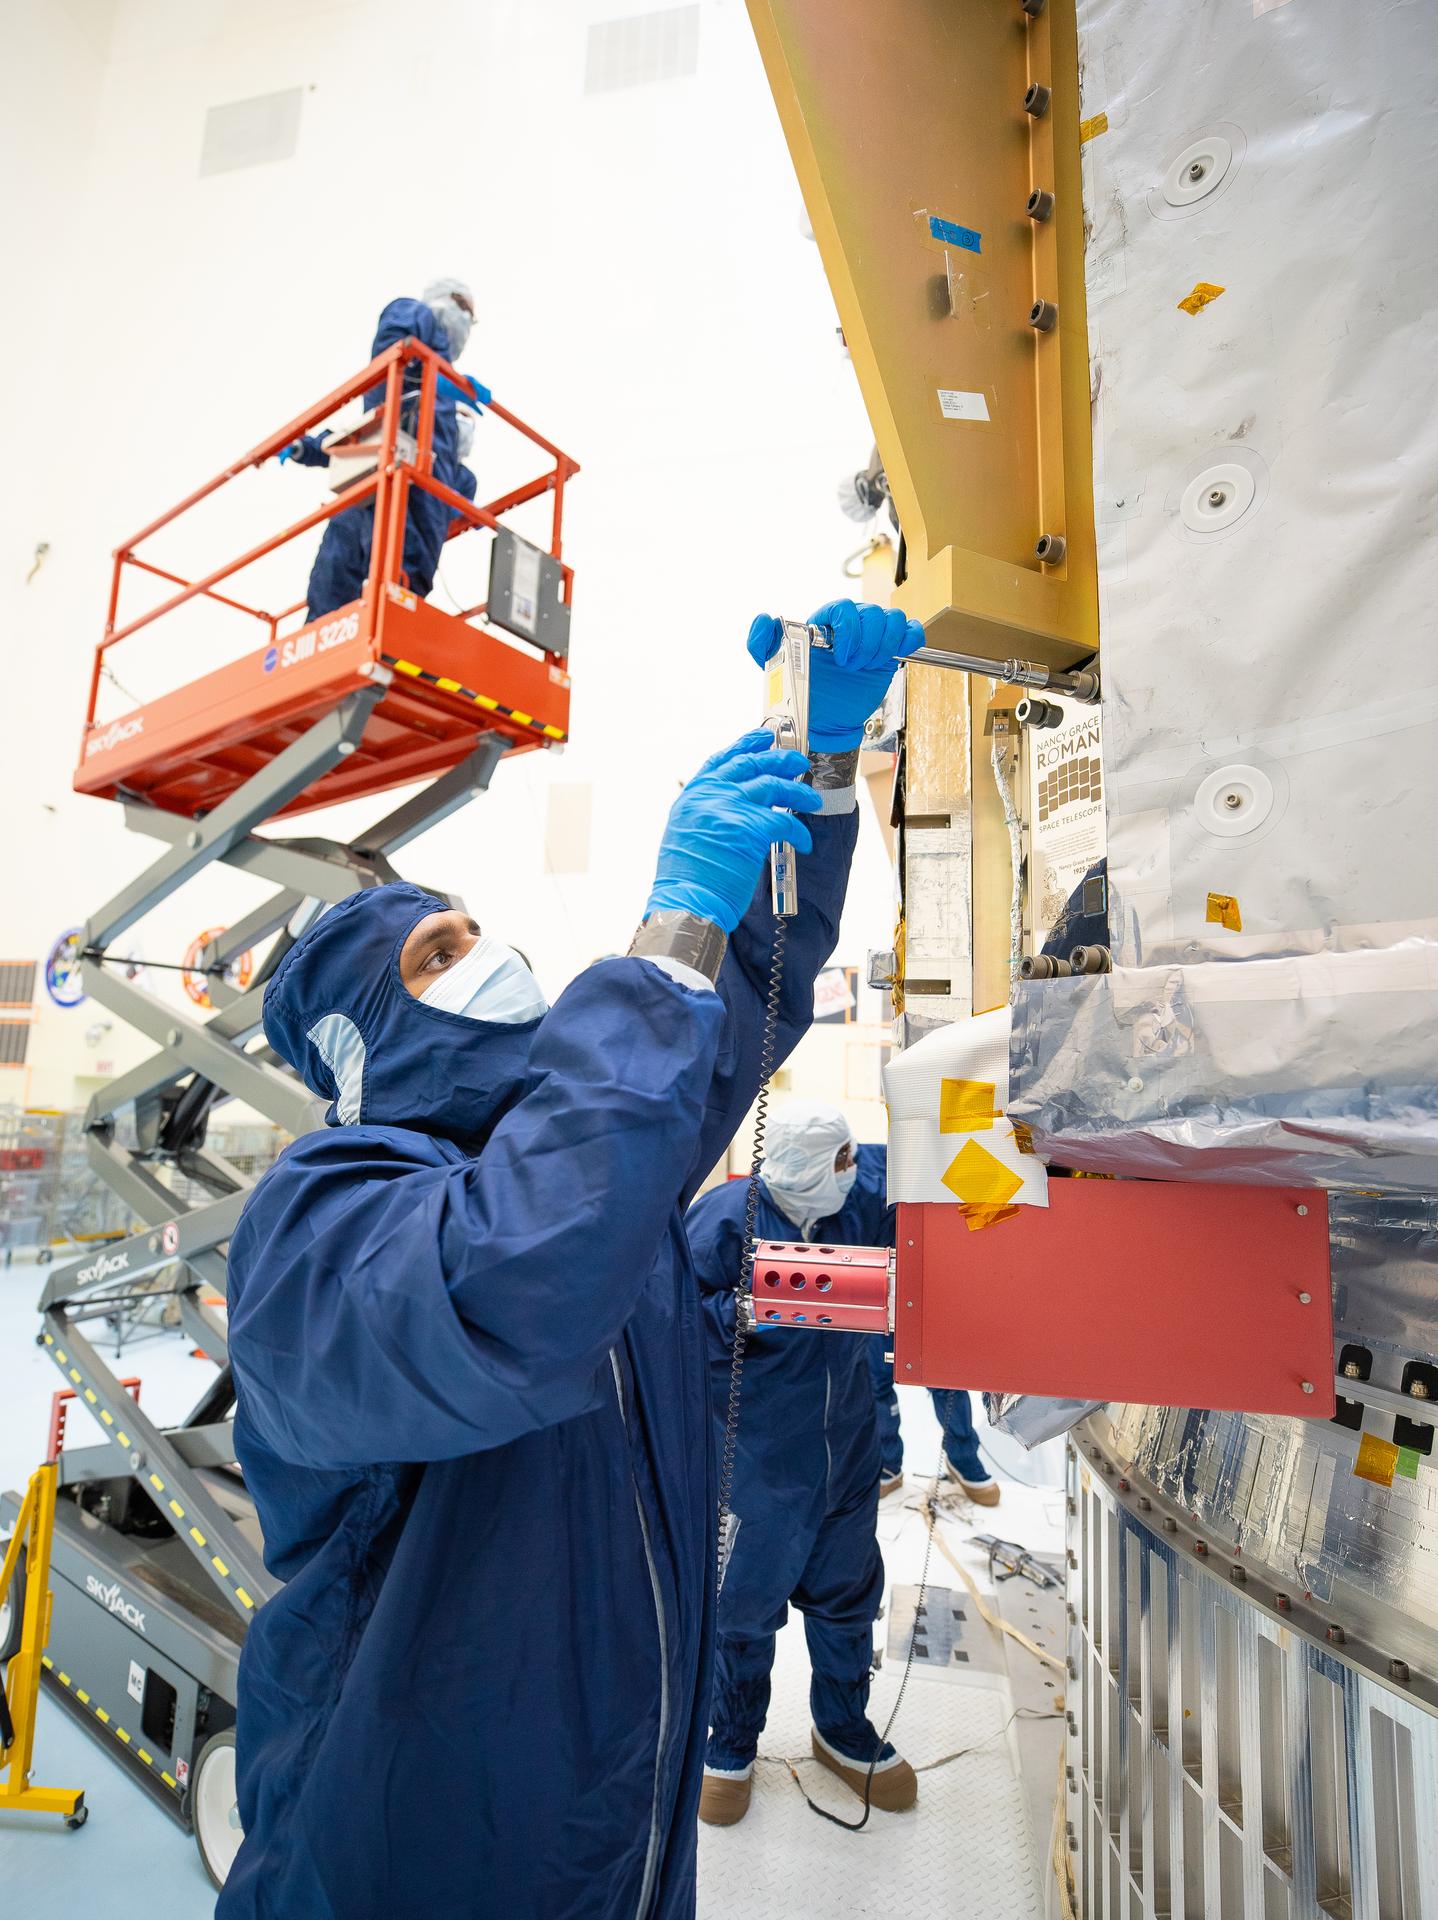
NASA’s ESCAPADE Snaps Family Portrait of Earth, Moon

24 July 2026 at 18:47

On July 3, one of NASA’s two Mars-destined ESCAPADE (Escape and Plasma Acceleration and Dynamics Explorers) spacecraft captured photos of Earth and the Moon in visible and thermal infrared light. At the time, the spacecraft was 363,250 miles (584,600 kilometers) from Earth and 115,600 miles (186,100 kilometers) from the Moon, making the Moon appear relatively large.

Taken with the Sun only partly illuminating Earth and the Moon, the visible light image shows the two bodies as crescents, with only around 8% of each face sunlit. Yet in the thermal infrared image, the shadowed hemisphere of Earth is illuminated by its own heat from both the atmosphere and surface, glowing at minus 10 to minus 44 degrees Fahrenheit (250 to 280 kelvins). Without the insulating blankets of oceans and atmospheres, the Moon’s far side remains at a much cooler minus 280 degrees Fahrenheit (100 kelvins).


visible light
thermal infrared light

A black background with a thin white crescent on the left representing the Earth, and a thin off-white crescent on the right represents the Moon.
Caption: In these images from NASA’s ESCAPADE mission, Earth (left) and Moon (right) can be seen. The image to the left of the slider shows visible light reflected by the Sun while the infrared image to the right shows the bodies’ emitted energy. White rings have been added in the thermal image to show the actual size of Earth and the Moon. Credit: NASA/UCB-SSL/NAU-Radiant/Lucint
NASA/UCB-SSL/NAU-Radiant/Lucint

On a pitch black background sits a bright circle on the left filled with yellow, orange, and red and surrounded by a faint halo of purple. On the right, is a circle outlined with a white line, filled with black and a thin purple crescent on the right side of the circle.
In these images from NASA’s ESCAPADE mission, Earth (left) and Moon (right) can be seen. The image to the left of the slider shows visible light reflected by the Sun while the infrared image to the right shows the bodies’ emitted energy. White rings have been added in the thermal image to show the actual size of Earth and the Moon.
NASA/UCB-SSL/NAU-Radiant/Lucint

A black background with a thin white crescent on the left representing the Earth, and a thin off-white crescent on the right represents the Moon.
Caption: In these images from NASA’s ESCAPADE mission, Earth (left) and Moon (right) can be seen. The image to the left of the slider shows visible light reflected by the Sun while the infrared image to the right shows the bodies’ emitted energy. White rings have been added in the thermal image to show the actual size of Earth and the Moon. Credit: NASA/UCB-SSL/NAU-Radiant/Lucint
NASA/UCB-SSL/NAU-Radiant/Lucint
On a pitch black background sits a bright circle on the left filled with yellow, orange, and red and surrounded by a faint halo of purple. On the right, is a circle outlined with a white line, filled with black and a thin purple crescent on the right side of the circle.
In these images from NASA’s ESCAPADE mission, Earth (left) and Moon (right) can be seen. The image to the left of the slider shows visible light reflected by the Sun while the infrared image to the right shows the bodies’ emitted energy. White rings have been added in the thermal image to show the actual size of Earth and the Moon.
NASA/UCB-SSL/NAU-Radiant/Lucint

visible light

thermal infrared light

ESCAPADE Photos of Earth and Moon

July 3, 2026


In these images from NASA’s ESCAPADE mission, Earth (left) and Moon (right) can be seen. The image to the left of the slider shows visible light reflected by the Sun while the infrared image to the right shows the bodies’ emitted energy. White rings have been added in the thermal image to show the actual size of Earth and the Moon. Credit: NASA/UCB-SSL/NAU-Radiant/Lucint

The ESCAPADE mission used its Visible and Infrared Observation System cameras, provided by Northern Arizona University in Flagstaff, to capture the images, which are more than just road trip photo album snaps.

“We are thrilled that ESCAPADE was able to accommodate these excellent space-qualified cameras which will search for visible Martian aurora and investigate thermal properties of the Martian surface and atmosphere,” said Rob Lillis, the mission’s principal investigator at the University of California, Berkeley. “Since Earth and the Moon are well-known targets, imaging them provides an important calibration check for ESCAPADE’s cameras.”

The ESCAPADE spacecraft, which were built by Rocket Lab, are currently in a “loiter” orbit around Lagrange point 2, a location in space about a million miles from Earth. In November 2026, the spacecraft will fly by Earth to use the planet’s gravity to slingshot their way to Mars. When the spacecraft arrive in September 2027, they will study how a million-mile-per-hour stream of material flowing from the Sun, known as solar wind, interacts with the Martian environment and how that drives atmospheric loss at the Red Planet.

The ESCAPADE mission is funded by NASA’s Heliophysics Division and is part of the NASA Small Innovative Missions for Planetary Exploration program. The UC Berkeley’s Space Sciences Laboratory leads the mission with key partners Rocket Lab; NASA’s Goddard Space Flight Center in Greenbelt, Maryland; Embry-Riddle Aeronautical University; Advanced Space; and Blue Origin.

By Mara Johnson-Groh
NASA’s Goddard Space Flight Center, Greenbelt, Md.

Hubble Spies One-Sided Spiral

24 July 2026 at 12:11

3 min read

Hubble Spies One-Sided Spiral

A spiral galaxy. It has a prominent spiral arm on one side (lower left) and a wide, glowing core. Dark brown filaments of dust swirl through its disk, while blue clusters of stars are visible mostly going out to its arm. On the opposite side of the arm (upper right), gas trails off from the disk, beyond the field of view in this image. A matching spiral arm is not visible on this side. The galaxy lies on a dark background.
This NASA/ESA Hubble Space Telescope image features the spiral galaxy NGC 4654, located 72 million light-years away in the constellation Virgo (the Maiden).
NASA, ESA/Hubble, D. Thilker, J. Lee, and the PHANGS-HST Team

The subject of this NASA/ESA Hubble Space Telescope image is a spiral galaxy struggling against titanic forces that appear on galactic scales in space. This is NGC 4654, an intermediate spiral galaxy in the constellation Virgo (the Maiden). It is classified as an “intermediate” because its overall shape lies between spiral galaxies that have a bar across their centers and those that don’t. NGC 4654 has a weak bar structure at its center and is located 72 million light-years from Earth in the Virgo Cluster, a particularly massive and populous galaxy cluster.

NGC 4654 is particularly asymmetric, with a rounded and clearly-defined edge on one side and a long tail of gas stretching out from the opposite side — outside the field of view captured in this image. This gaseous tail is the result of ram pressure stripping, a force that galaxies can experience as they plow through space. NGC 4654 moves with such high velocity that it sweeps up and rams through the hot, rarefied gas filling the space between the Virgo Cluster’s galaxies. This intracluster medium in turn exerts a “ram pressure” on the galaxy, compressing the galaxy’s leading edge and dragging its gas behind the galaxy, creating the elongated tail.

It’s not just the galaxy’s gas that is unevenly distributed: its stars are too, and this is more unusual for a spiral galaxy. While the spiral arm on its leading edge is rich with stars and gas, the opposite arm noticeably lacks stars, influencing the galaxy’s lopsided spiral shape. Astronomers think that ram pressure alone is unlikely to cause this effect. Rather, NGC 4654 was also subjected to the gravitational force of fellow Virgo Cluster galaxy NGC 4639. While the two galaxies are far apart now, it’s thought that a fly-by interaction between them around 500 million years ago ripped away NGC 4654’s gas along one side, limiting star formation there and creating the asymmetry in its shape.

Many galaxies that undergo ram pressure stripping suffer reduced star formation rates as the cold gas that collapses to form their stars is pulled away and lost. NGC 4654, however, is still forming nearly two Suns’ worth of stars every year, a rate comparable to other galaxies of similar size. The active star formation is visible in the latest Hubble data included in this image. The data picks up on a wavelength of red light emitted by the clouds of energized gas where newborn stars lurk. The bright pink bubbles that appear across NGC 4654 — from its forward spiral arm, to around its weak bar, and out to the edge of its disk — are areas where these newborn stars shine.

The data used in this image came from two observing programs (#15654, #17502) that aim to link the gas in galaxies with star formation. By observing many prominent galaxies in the vicinity of our own, researchers hope to better understand how gas moves in galaxies, where and when it collapses to form stars and star clusters, and what effect those new stars have on the gas around them.

Text Credit: ESA/Hubble

Media Contact:

Claire Andreoli
NASA’s Goddard Space Flight Center, Greenbelt, MD
claire.andreoli@nasa.gov

NASA’s MAVEN Illuminates New Understanding of Auroras at Mars

23 July 2026 at 16:19

This illustration depicts charged particles from a solar storm stripping away charged particles of Mars' atmosphere, one of the processes of Martian atmosphere loss studied by NASA's MAVEN mission, beginning in 2014.
This illustration depicts charged particles from a solar storm stripping away charged particles of Mars’ atmosphere, one of the processes of Martian atmosphere loss studied by NASA’s MAVEN mission.
NASA/GSFC

NASA MAVEN (Mars Atmosphere and Volatile Evolution) mission scientists have uncovered a key puzzle piece in understanding certain types of auroras on Mars, finding that they form in a similar way to Earth-based auroras.
 
Results published Thursday in Nature Communications show the same mechanism that circulates and catapults charged particles into Earth’s atmosphere is happening at Mars on much smaller scales because of differences in the two planets’ magnetic fields.
 
The MAVEN spacecraft, in orbit around Mars, experienced a loss of signal with ground stations on Earth on Dec. 6, 2025. On June 3, NASA declared the mission had concluded after finding the spacecraft to be unrecoverable. However, data from the mission is still being used to inform NASA science and future missions to Mars.
 
When the Sun’s magnetic field lines get close to Earth’s magnetosphere, the large magnetic bubble protecting the planet, they can reconnect and inject energy and mass throughout Earth’s magnetosphere and magnetotail, ultimately firing electrons back into the atmosphere to generate Earth’s auroras. This process, called the Dungey cycle, drives electrical currents, accelerates charged particles that create auroras, and controls the circulation of plasma in Earth’s magnetosphere and ionosphere.
 
This new study shows that a miniature version of the Dungey cycle is happening over Mars’ strong crustal magnetic fields, which gives scientists a better look into the physics of Martian auroras.
 
“We knew that magnetic reconnection was happening at Mars but did not expect it to be like the Dungey cycle,” said Shaosui Xu, lead author of the study and associate research physicist at the Space Sciences Laboratory at the University of California, Berkeley.
 
Mars does not have a global magnetic field like Earth. Earth’s magnetic field is created by our planet’s churning core, while Mars has numerous miniature magnetospheres that arise from intensely magnetized crust scattered around the planet.  These regions were formed around 4 billion years ago when lava cooled in the presence of Mars’ ancient global magnetic field, which has since disappeared due to intense solar wind stripping the planet’s atmosphere.
 
The MAVEN mission has observed highly localized auroras over these crustal fields, similar to Earth’s auroras at the poles, but it wasn’t until now that scientists could fully understand the physics of how they form. The study used several instruments aboard the MAVEN spacecraft to build up a picture of the Dungey-like behavior: the Magnetometer and Solar Wind Electron Analyzer instruments, which were used to determine the magnetic configuration and derive electrical currents, and the STATIC (Suprathermal and Thermal Ion Composition) instrument, which was used to measure plasma flows in the ionosphere.
 
“We really pushed the limit of STATIC to get the data we needed,” said Xu. “It was the final piece to the puzzle in understanding these localized auroras.”
 
The realization that a Dungey-like cycle was happening within these crustal magnetic fields answered the question of how the electrons were being energized to create the auroras. It also shows that a Dungey-like mechanism can happen on both large and small scales, giving more insight into where in the solar system this process could be taking place.
 
“This is a remarkable result that changes how we think of Martian auroras and is another important step toward understanding why Mars and Earth have evolved so differently despite being governed by the same underlying physics.” said Shannon Curry, MAVEN’s principal investigator and a research scientist at the Laboratory for Atmospheric and Space Physics at the University of Colorado Boulder. “I am incredibly proud of our team’s work on this discovery and excited to uncover new insights into the Red Planet and its evolution.”
 
By finding out more about this process, scientists also are gaining a better understanding of how the solar environment interacts with the Red Planet as a whole, which is essential for future robotic and crewed missions.
 
“I remember in graduate school discussing with my advisor how the cycling of crustal magnetic fields could work at Mars,” said Xu. “It’s incredible to be part of the team that found the answer to that question.”
 
The MAVEN mission is part of NASA’s Mars Exploration Program portfolio. The mission’s principal investigator is based at the Laboratory for Atmospheric and Space Physics at the University of Colorado Boulder, which also is responsible for managing science operations and public outreach and communications. NASA’s Goddard Space Flight Center in Greenbelt, Maryland, manages the MAVEN mission. Lockheed Martin Space built the spacecraft and is responsible for mission operations. NASA’s Jet Propulsion Laboratory in Southern California provides navigation and Deep Space Network support.
 
For more information on NASA’s MAVEN mission, visit:
 
https://science.nasa.gov/mission/maven/
 
Karen Fox / Alana Johnson
Headquarters, Washington
240-285-5155 / 202-672-4780
karen.c.fox@nasa.gov / alana.r.johnson@nasa.gov
 
Lonnie Shekhtman
NASA’s Goddard Space Flight Center, Greenbelt, Md.
lonnie.shekhtman@nasa.gov


❌