❌

Normal view

How 2 US, European Satellites Are Studying Hurricanes During El Niño
9 September 2026 at 17:00

5 min read

How 2 US, European Satellites Are Studying Hurricanes During El Niño

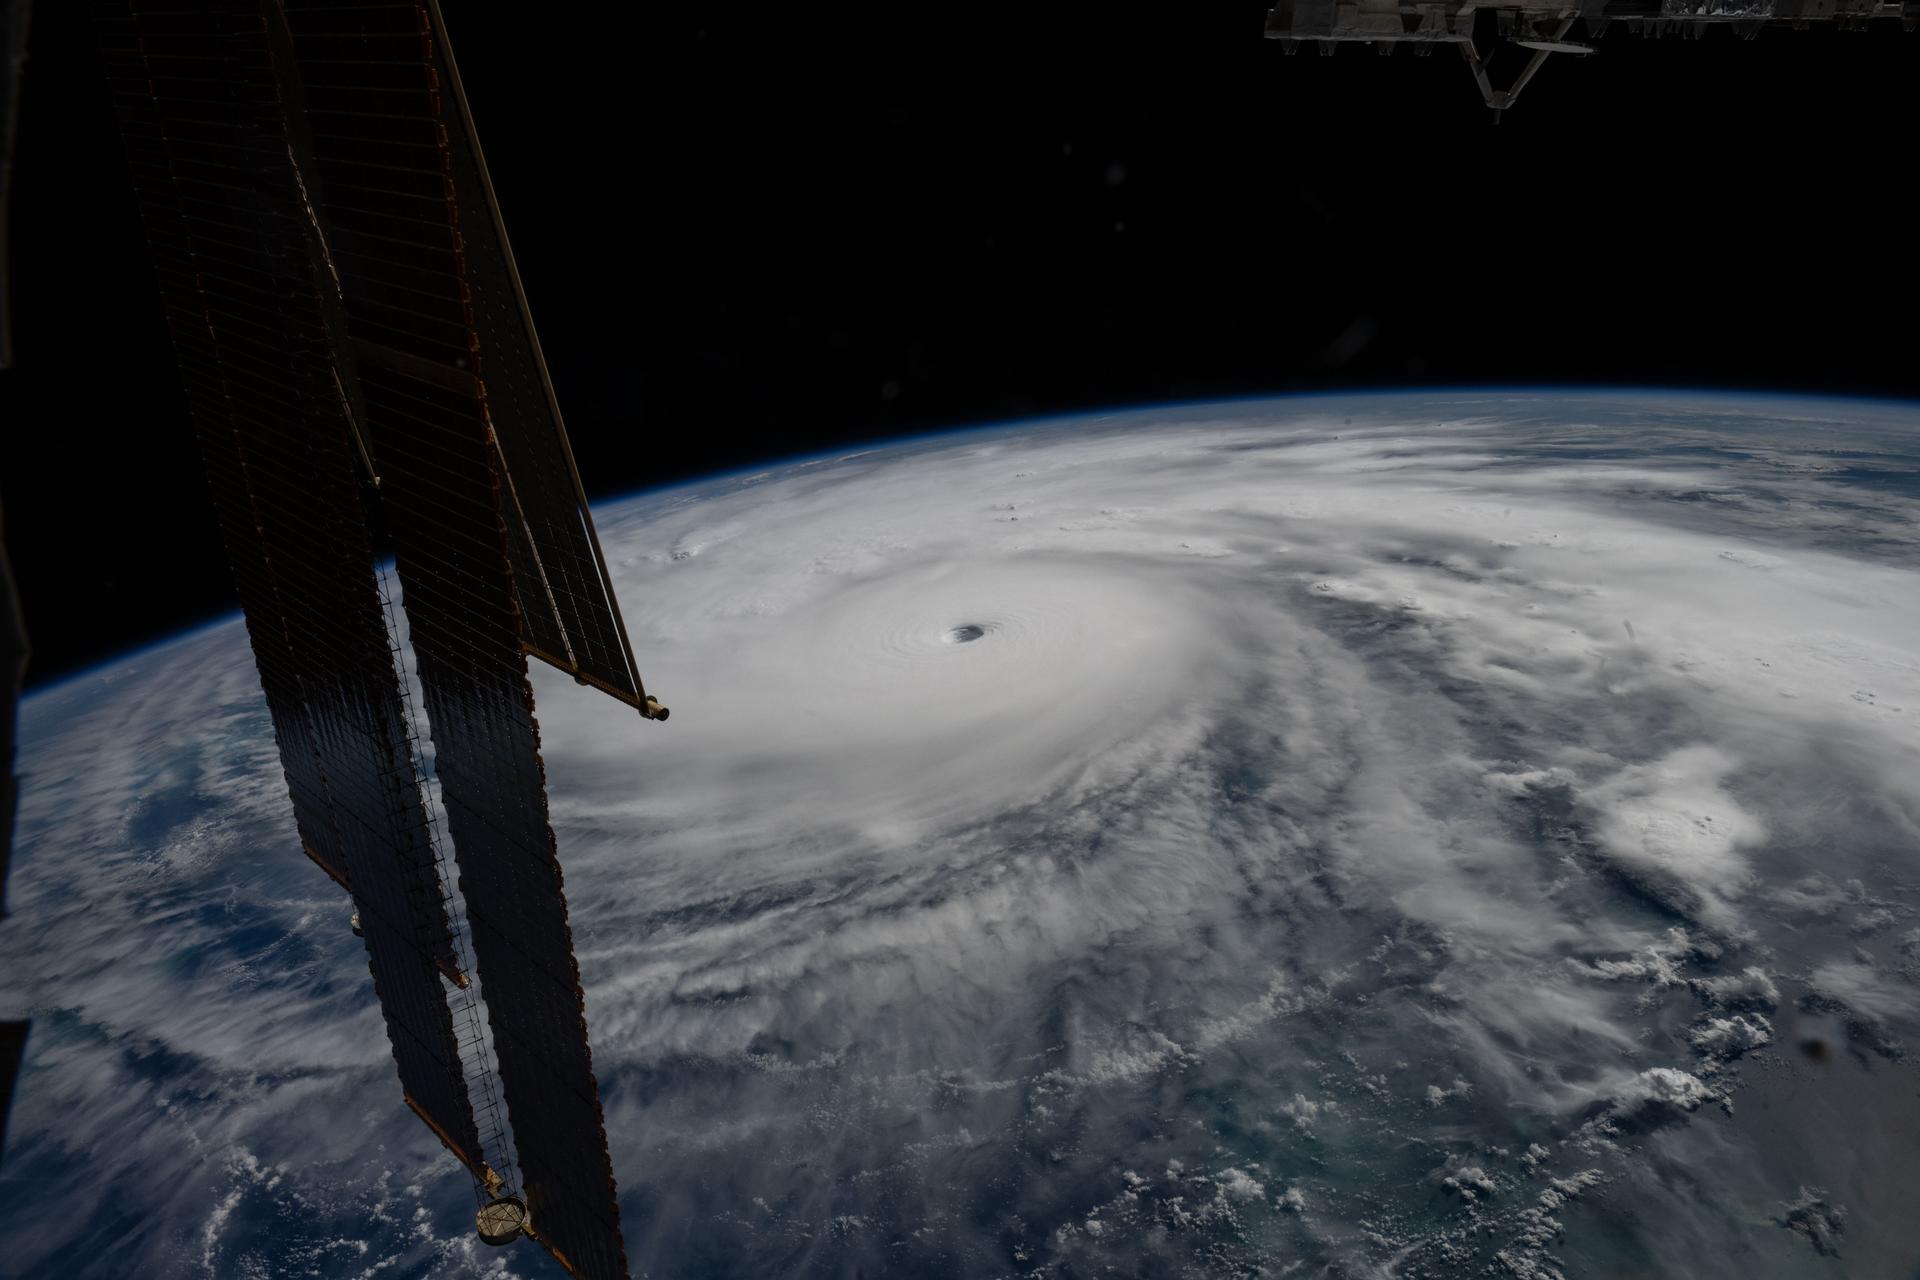
Category 5 Hurricane Melissa, one of the most powerful storms to strike the Caribbean in recent history, is pictured about 50 miles south of Jamaica in this photograph from the International Space Station as it orbited 262 miles above the Yucatan Peninsula.
Hurricane Melissa is seen 50 miles south of Jamaica in this photograph taken from the International Space Station on Oct. 28, 2025.
NASA

Last November, NASA and its European partners launched the Sentinel-6B satellite to improve hurricane forecasts, help protect infrastructure, and benefit commercial industries, including shipping. The satellite now is flying 30 seconds behind its predecessor, Sentinel-6 Michael Freilich. Both satellites are providing precise sea level height measurements during what oceanographers expect to be a historic El Niño, a naturally occurring oceanic phenomenon in which warmer-than-usual Pacific waters shift global weather patterns.

The two satellites make up the Copernicus Sentinel-6/Jason-CS (Continuity of Service) mission, the latest in a series of ocean-observing radar altimetry missions that have been monitoring Earth’s changing seas continuously since the early 1990s.

The data each satellite is collecting will not only allow scientists to better understand this year’s El Niño but will also help them create more accurate hurricane predictions.

“This El Niño was a late-bloomer,” said Josh Willis, Sentinel-6B’s project scientist at NASA’s Jet Propulsion Laboratory in Southern California. “It didn’t kick off until the middle of the year and is just now reaching a strength similar to what we’ve seen in the satellite record during significant El Niños in 1997 and 2015. We expect it to be big, and it’s already having big impacts.”

El Niños generally scramble weather patterns tied to rainfall and storms, including hurricanes. They also redistribute heat in the ocean, which affects sea level. Normally, Earth’s warmest ocean waters sit along the equator in the western Pacific. During El Niño, weakened winds, which usually blow westward along the equator, result in heat spreading east toward South America. The change in ocean heat shifts hurricane activity from the Atlantic to the Pacific Ocean.

Predicting hurricane strength

On July 15, Sentinel-6B began delivering low-latency data to scientists that could be used for weather predictions. That data will take some time to work its way into the research models on which meteorologists and climate scientists rely, but when it does, those improved models could save lives.

Data from Sentinel-6 satellite missions feeds into hurricane tracking algorithms used by federal and state agencies. Those predictions can activate disaster response efforts, mobilizing resources ranging from sandbag placement to National Guard activation. They also can lead to evacuation orders that require quick but well-informed decisions about logistics at a local level. More severe events may require engaging larger organizations, such as the Federal Emergency Management Agency.

A tropical storm can take a week or more to become a hurricane and make its way to a coastline, but a hurricane can rapidly intensify in the 48 hours prior to landfall, leaving planners little time to prepare.

“Hurricanes have been known to speed up quickly at the last moment, so the window in which to decide what to do is short,” said Deirdre Byrne, an oceanographer and altimetry expert with the National Oceanic and Atmospheric Administration (NOAA). “The goal is to forecast how much and how rapidly intensification will happen so that officials can make the right calls.”

Byrne oversees one of the country’s most crucial hurricane forecasting algorithms, NOAA’s Satellite Ocean Heat Content Suite, which has been operating since 2012.

Each Sentinel-6 satellite measures ocean height, as well as the size of waves and marine wind speed, using a radar altimeter, which bounces thousands of radar pulses a second off the crests and troughs of waves. Ocean height varies from place to place and provides insight into the ocean’s heat content, since warm water expands. That, in turn, helps forecast how fast hurricanes will grow.

The satellites each carry a second instrument, called the Global Navigation Satellite System – Radio Occultation (GNSS-RO), which measures atmospheric properties, such as humidity, pressure, and temperature.

Among the measurements Sentinel-6 is gathering, Byrne is most anticipating the ocean height data, which she plans to begin incorporating into the current Satellite Ocean Heat Content Suite algorithm by the end of the year.

“In terms of data quality, the Sentinel-6 missions are unparalleled,” Byrne said.

Together, the missions are also extending a precise dataset deep into its fourth decade. This record of sea level observations traces back to the TOPEX/Poseidon mission, which launched in 1992, and continues through to the present day with Sentinel-6 Michael Freilich. Sentinel-6B will take over for its predecessor as the reference satellite for global sea level measurements later this year.

“The key is consistency, measuring the same way, every time,” said Severine Fournier, Sentinel-6B deputy project scientist, JPL. “That’s what lets us predict hurricanes, and, in turn, protect coastal communities and infrastructure.”

More about Sentinel-6B

Sentinel-6 Michael Freilich, named after a former director of NASA’s Earth Science Division, is one of two satellites that compose the Copernicus Sentinel-6/Jason-CS mission.

Sentinel-6/Jason-CS, a part of the European Union’s Earth observation program called Copernicus, was jointly developed by ESA (European Space Agency), EUMETSAT (European Organisation for the Exploitation of Meteorological Satellites), NASA, and NOAA, with funding support from the European Commission and technical support on performance from the French space agency CNES (Centre National d’Études Spatiales). Spacecraft monitoring and control, as well as the processing of all the altimeter science data, is carried out by EUMETSAT on behalf of the European Union’s Copernicus Programme, with the support of all partner agencies.

NASA JPL, a division of Caltech in Pasadena, contributed three science instruments for each Sentinel-6 satellite: the Advanced Microwave Radiometer, the GNSS-RO, and the Laser Retroreflector Array. NASA also contributed launch services, ground systems supporting operation of the agency’s science instruments, the science data processors for two of these instruments, and support for the United States members of the international Ocean Surface Topography Science Team.

For more about Sentinel-6B, visit:

https://science.nasa.gov/mission/sentinel-6B

-end-

Media Contacts

Andrew Good / Andrew Wang
Jet Propulsion Laboratory, Pasadena, Calif.
818-393-2433 / 626-379-6874
andrew.c.good@jpl.nasa.gov / andrew.wang@jpl.nasa.gov

2026-060

The post How 2 US, European Satellites Are Studying Hurricanes During El Niño appeared first on NASA Science.
How 2 US, European Satellites Are Studying Hurricanes During El Niño

9 September 2026 at 17:00

5 min read

Preparations for Next Moonwalk Simulations Underway (and Underwater)

Category 5 Hurricane Melissa, one of the most powerful storms to strike the Caribbean in recent history, is pictured about 50 miles south of Jamaica in this photograph from the International Space Station as it orbited 262 miles above the Yucatan Peninsula.
Hurricane Melissa is seen 50 miles south of Jamaica in this photograph taken from the International Space Station on Oct. 28, 2025.
NASA

Last November, NASA and its European partners launched the Sentinel-6B satellite to improve hurricane forecasts, help protect infrastructure, and benefit commercial industries, including shipping. The satellite now is flying 30 seconds behind its predecessor, Sentinel-6 Michael Freilich. Both satellites are providing precise sea level height measurements during what oceanographers expect to be a historic El Niño, a naturally occurring oceanic phenomenon in which warmer-than-usual Pacific waters shift global weather patterns.

The two satellites make up the Copernicus Sentinel-6/Jason-CS (Continuity of Service) mission, the latest in a series of ocean-observing radar altimetry missions that have been monitoring Earth’s changing seas continuously since the early 1990s.

The data each satellite is collecting will not only allow scientists to better understand this year’s El Niño but will also help them create more accurate hurricane predictions.

“This El Niño was a late-bloomer,” said Josh Willis, Sentinel-6B’s project scientist at NASA’s Jet Propulsion Laboratory in Southern California. “It didn’t kick off until the middle of the year and is just now reaching a strength similar to what we’ve seen in the satellite record during significant El Niños in 1997 and 2015. We expect it to be big, and it’s already having big impacts.”

El Niños generally scramble weather patterns tied to rainfall and storms, including hurricanes. They also redistribute heat in the ocean, which affects sea level. Normally, Earth’s warmest ocean waters sit along the equator in the western Pacific. During El Niño, weakened winds, which usually blow westward along the equator, result in heat spreading east toward South America. The change in ocean heat shifts hurricane activity from the Atlantic to the Pacific Ocean.

Predicting hurricane strength

On July 15, Sentinel-6B began delivering low-latency data to scientists that could be used for weather predictions. That data will take some time to work its way into the research models on which meteorologists and climate scientists rely, but when it does, those improved models could save lives.

Data from Sentinel-6 satellite missions feeds into hurricane tracking algorithms used by federal and state agencies. Those predictions can activate disaster response efforts, mobilizing resources ranging from sandbag placement to National Guard activation. They also can lead to evacuation orders that require quick but well-informed decisions about logistics at a local level. More severe events may require engaging larger organizations, such as the Federal Emergency Management Agency.

A tropical storm can take a week or more to become a hurricane and make its way to a coastline, but a hurricane can rapidly intensify in the 48 hours prior to landfall, leaving planners little time to prepare.

“Hurricanes have been known to speed up quickly at the last moment, so the window in which to decide what to do is short,” said Deirdre Byrne, an oceanographer and altimetry expert with the National Oceanic and Atmospheric Administration (NOAA). “The goal is to forecast how much and how rapidly intensification will happen so that officials can make the right calls.”

Byrne oversees one of the country’s most crucial hurricane forecasting algorithms, NOAA’s Satellite Ocean Heat Content Suite, which has been operating since 2012.

Each Sentinel-6 satellite measures ocean height, as well as the size of waves and marine wind speed, using a radar altimeter, which bounces thousands of radar pulses a second off the crests and troughs of waves. Ocean height varies from place to place and provides insight into the ocean’s heat content, since warm water expands. That, in turn, helps forecast how fast hurricanes will grow.

The satellites each carry a second instrument, called the Global Navigation Satellite System – Radio Occultation (GNSS-RO), which measures atmospheric properties, such as humidity, pressure, and temperature.

Among the measurements Sentinel-6 is gathering, Byrne is most anticipating the ocean height data, which she plans to begin incorporating into the current Satellite Ocean Heat Content Suite algorithm by the end of the year.

“In terms of data quality, the Sentinel-6 missions are unparalleled,” Byrne said.

Together, the missions are also extending a precise dataset deep into its fourth decade. This record of sea level observations traces back to the TOPEX/Poseidon mission, which launched in 1992, and continues through to the present day with Sentinel-6 Michael Freilich. Sentinel-6B will take over for its predecessor as the reference satellite for global sea level measurements later this year.

“The key is consistency, measuring the same way, every time,” said Severine Fournier, Sentinel-6B deputy project scientist, JPL. “That’s what lets us predict hurricanes, and, in turn, protect coastal communities and infrastructure.”

More about Sentinel-6B

Sentinel-6 Michael Freilich, named after a former director of NASA’s Earth Science Division, is one of two satellites that compose the Copernicus Sentinel-6/Jason-CS mission.

Sentinel-6/Jason-CS, a part of the European Union’s Earth observation program called Copernicus, was jointly developed by ESA (European Space Agency), EUMETSAT (European Organisation for the Exploitation of Meteorological Satellites), NASA, and NOAA, with funding support from the European Commission and technical support on performance from the French space agency CNES (Centre National d’Études Spatiales). Spacecraft monitoring and control, as well as the processing of all the altimeter science data, is carried out by EUMETSAT on behalf of the European Union’s Copernicus Programme, with the support of all partner agencies.

NASA JPL, a division of Caltech in Pasadena, contributed three science instruments for each Sentinel-6 satellite: the Advanced Microwave Radiometer, the GNSS-RO, and the Laser Retroreflector Array. NASA also contributed launch services, ground systems supporting operation of the agency’s science instruments, the science data processors for two of these instruments, and support for the United States members of the international Ocean Surface Topography Science Team.

For more about Sentinel-6B, visit:

https://science.nasa.gov/mission/sentinel-6B

-end-

Media Contacts

Andrew Good / Andrew Wang
Jet Propulsion Laboratory, Pasadena, Calif.
818-393-2433 / 626-379-6874
andrew.c.good@jpl.nasa.gov / andrew.wang@jpl.nasa.gov

2026-060

Water Resources 

17 July 2026 at 19:12

Water Resources

A photograph taken from a rocky shoreline along the Iola Basin show mats of green growth coating the surface of the water.

The NASA Earth Action Water Resources program area advances the use of Earth science data to support sustainable and adaptable water resources management. Through collaboration with partners, the program area works to enhance water use efficiency, advance water quality monitoring and modeling, and strengthen water resilience. These efforts empower informed decision-making and address critical challenges in water resources.  

Program Manager: Erin Urquhart 

See examples of recent Water Resources grants. Example 1 & Example 2

The post Water Resources  appeared first on NASA Science.

Health and Air Quality 

17 July 2026 at 19:12

Health and Air Quality

Haze Sweeps Over the Mediterranean

The NASA Earth Action Health and Air Quality program area encourages the use of Earth observations in air quality management and public health, including environmental health and infectious diseases. The program area helps public health and air quality managers, policymakers, and the public manage health-related decisions and minimize disease risk. 

Program Manager: John Haynes 

Visit the Health and Air Quality Applied Sciences Team (HAQAST) page. 

The post Health and Air Quality  appeared first on NASA Science.
Energy and Infrastructure 

17 July 2026 at 19:12

Energy and Infrastructure 

American flag in the breeze over a blue steel bridge over a large river at sunset.

The Energy and Infrastructure program area provides solar, meteorological, and other types of Earth information to aid decision-making related to energy production and management, power systems planning, building energy efficiency and sustainability, and resilient infrastructure. Two major projects are: Prediction Of Worldwide Energy Resources (POWER), which curates satellite and modeling data in free web platforms, and Risk Analysis and Solutions Innovators (RASI), which tailors meteorological and other Earth information to support infrastructure resilience for U.S. communities, especially those surrounding NASA Centers.  

Program Manager: Shanna Combley 

Learn more about POWER and RASI. 

The post Energy and Infrastructure  appeared first on NASA Science.

Volunteer Measures Record Louisiana Rainfall 

15 July 2026 at 13:32

“I didn’t sign up to try to measure a new record or anything”, said Matt Carnicle, a volunteer for the NASA-sponsored Community Collaborative Rain, Hail, and Snow Network, or CoCoRaHS, project. Carnicle measured a whopping 29.06 inches of rainfall on June 18th, 2026, breaking an all-time 24-hour record for the state of Louisiana of 22.00 inches. “I’m just a regular guy who likes to track the weather, and I report what I get in my gauge whether it’s zero, two hundredths, or whatever is in there when I read it.” 

CoCoRaHS  (pronounced KO-ko-rozz) is a network of volunteer weather observers of all ages working together to measure and map rain, hail, and snow by measuring precipitation in their backyards. Together, these thousands of daily precipitation reports – openly available on the project website – are used by scientists and citizens for a wide variety of purposes, to include improving weather forecasting, informing water and land management, driving atmospheric models, and triggering flash flood and severe weather warnings. 

Matt joined through a storm-spotter class where he learned how CoCoRaHS is part of a NASA hail research project focused on Gulf States in the Southeast United States. CoCoRaHS reports (and photos) of hail are used for researching the “melt rate” between when the satellite estimates the stone sizes in the clouds and what volunteers measure on the ground. Matt took it a step further and purchased a standardized rain gauge in order to participate with CoCoRaHS by measuring rainfall.

Matt’s June 18, 2026 rain measurement shatters Louisiana’s 1962 state record of 22.00 inches of rain in 24-hours (Hawaii holds the national record with 49.69 inches in 24-hours). Even more remarkably, the 29.06 inches he measured fell in less than 12 hours! According to Louisiana State Climatologist Jay Grymes, who validated Matt’s measurement along with National Weather Service representatives, an event of this magnitude in this area is expected to happen less than once in a thousand years. A National Oceanic and Atmospheric Administration (NOAA) committee will convene in the coming months to verify and document the new record.

You can join Matt and other CoCoRaHS volunteers and submit official rainfall reports to the National Weather Service. They’re also on the lookout for hail in the southeast, where CoCoRaHS and NASA are doing research on how hail melts as it moves from the clouds to the ground. The only requirement for participation is that volunteers use the correct manual gauge, which is precise to the nearest 1/100th of an inch and is approved by the National Weather Service (measurements from automated rain gauges are not accepted). Sign up here, and you might measure the next record precipitation event: https://science.nasa.gov/citizen-science/community-collaborative-rain-hail-and-snow-network/

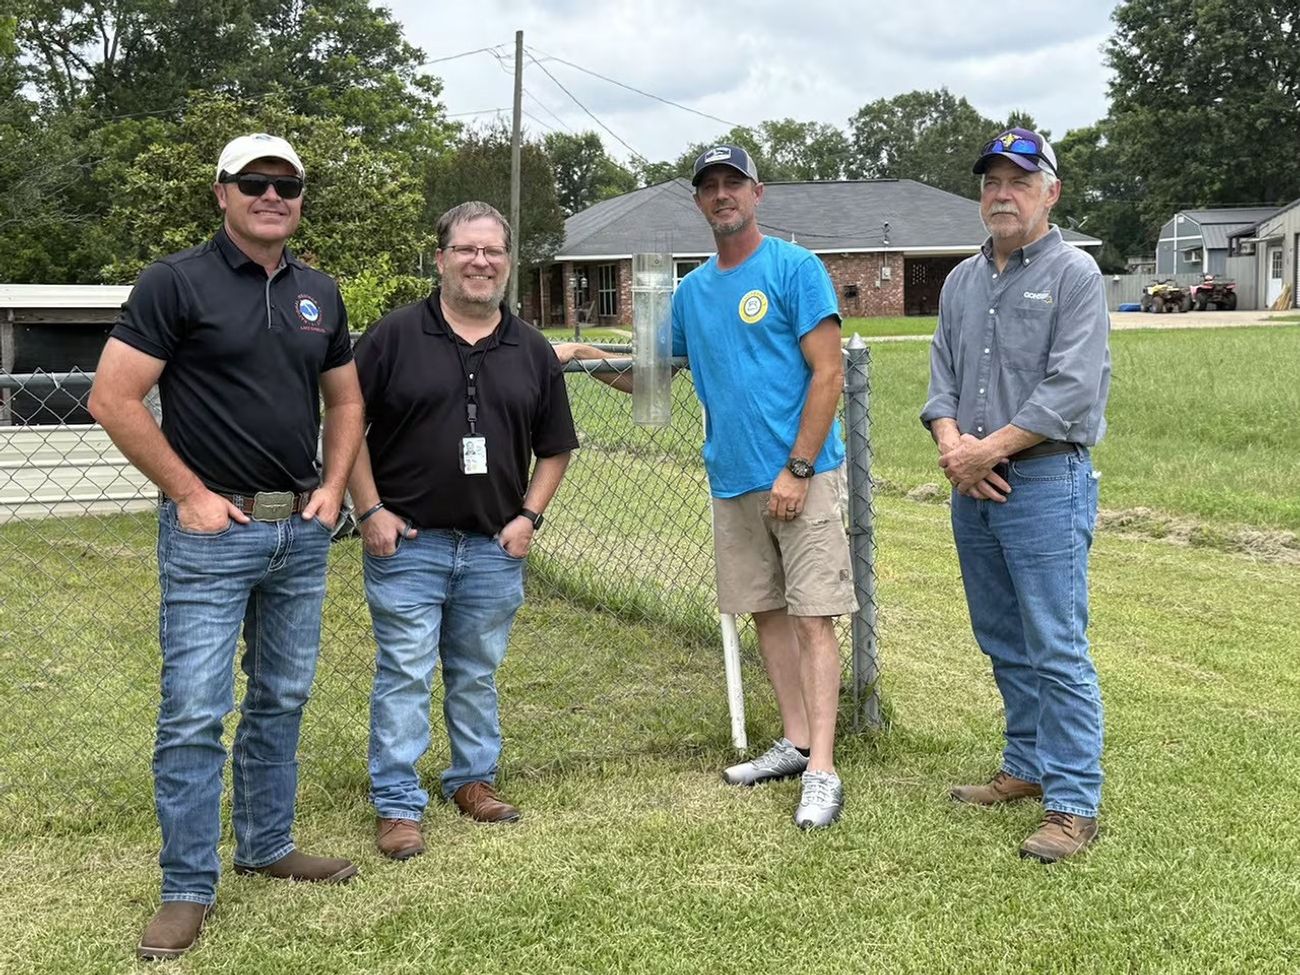
Four men standing outdoors on a grassy lawn in front of a chain-link fence. The man in the bright blue t-shirt is touching a clear, cylindrical tube—likely a rain gauge—mounted near the fence. The other three men are dressed in casual work attire, including jeans, polo shirts, and a button-down shirt. Residential houses and trees are visible in the background.
From left to right: National Weather Service Lake Charles Warning Coordination Meteorologist Doug Cramer, National Weather Service Lake Charles meteorologist Jonathan Brazzell, rain gauge owner/observer Matt Carnicle, and Louisiana State Climatologist Jay Grymes. Carnicle’s arm is around the CoCoRaHS rain gauge. https://www.cocorahs.org/
Image credit: Matt Carnicle.

Learn More and Get Involved

White CoCoRaHS logo on dark blue background

Community Collaborative Rain, Hail, and Snow Network (CoCoRaHS)

Join a national community of precipitation reporters providing critical data to improve scientific understanding and forecasts.

NASA Awards Contract for Commercial Satellite Data Acquisition

18 June 2026 at 21:13
NASA insignia.
Credit: NASA

NASA has selected eight new companies and will acquire new data products from six existing Commercial Satellite Data Acquisition contract holders to expand the range of commercial satellite data available to researchers, civil agencies, and decision-makers. Such measurements supplement NASA’s Earth satellites by contributing high-resolution and frequent observations to enhance the agency’s set of data.

Leveraging commercial data demonstrates NASA’s commitment to strong public-private partnerships, allowing the agency to expand scientific insight while reducing costs and accelerating the delivery of data to researchers and decision-makers.

Collectively, NASA and commercial Earth observations provide insight into our home planet – benefitting Americans, providing environmental intelligence, strengthening disaster response, and improving public safety.  

The Commercial Satellite Data Acquisition Program On-Ramp 2 Multiple Award contract is a firm-fixed-price, indefinite-delivery/indefinite-quantity multiple-award contract. The original maximum contract value was $476 million, with a performance period that began in 2023 and continues through Nov. 15, 2028.

Contract awardees are:

  • Airbus DS Geo Inc.
  • GHGSat Inc.
  • Hydrosat Inc.
  • ICEYE US Inc.
  • ImageSat International
  • Kuva US Inc.
  • Muon Space Inc.
  • Orbital Sidekick Inc.
  • OroraTech USA Inc.
  • Planet Labs Federal Inc.
  • Space Sciences and Engineering LLC, doing business as PlanetiQ
  • SATLANTIS US
  • Tomorrow Companies Inc., doing business as Tomorrow.io
  • Wyvern Inc.

The agency’s Commercial Satellite Data Acquisition mission works to execute a cost-effective way to augment and complement the suite of Earth observations captured by NASA and its partners by identifying, evaluating, and acquiring commercial satellite data.

For more information about NASA’s Commercial Satellite Acquisition program, visit:

https://science.nasa.gov/earth-science/csda

-end-

Liz Vlock
Headquarters, Washington
202-358-1600
elizabeth.a.vlock@nasa.gov

Share

Details

Last Updated
Jun 18, 2026
Editor
Jessica Taveau

The post NASA Awards Contract for Commercial Satellite Data Acquisition appeared first on NASA Science.

NASA Awards Contract for Commercial Satellite Data Acquisition

18 June 2026 at 21:13
NASA insignia.
Credit: NASA

NASA has selected eight new companies and will acquire new data products from six existing Commercial Satellite Data Acquisition contract holders to expand the range of commercial satellite data available to researchers, civil agencies, and decision-makers. Such measurements supplement NASA’s Earth satellites by contributing high-resolution and frequent observations to enhance the agency’s set of data.

Leveraging commercial data demonstrates NASA’s commitment to strong public-private partnerships, allowing the agency to expand scientific insight while reducing costs and accelerating the delivery of data to researchers and decision-makers.

Collectively, NASA and commercial Earth observations provide insight into our home planet – benefitting Americans, providing environmental intelligence, strengthening disaster response, and improving public safety.  

The Commercial Satellite Data Acquisition Program On-Ramp 2 Multiple Award contract is a firm-fixed-price, indefinite-delivery/indefinite-quantity multiple-award contract. The original maximum contract value was $476 million, with a performance period that began in 2023 and continues through Nov. 15, 2028.

Contract awardees are:

  • Airbus DS Geo Inc.
  • GHGSat Inc.
  • Hydrosat Inc.
  • ICEYE US Inc.
  • ImageSat International
  • Kuva US Inc.
  • Muon Space Inc.
  • Orbital Sidekick Inc.
  • OroraTech USA Inc.
  • Planet Labs Federal Inc.
  • Space Sciences and Engineering LLC, doing business as PlanetiQ
  • SATLANTIS US
  • Tomorrow Companies Inc., doing business as Tomorrow.io
  • Wyvern Inc.

The agency’s Commercial Satellite Data Acquisition mission works to execute a cost-effective way to augment and complement the suite of Earth observations captured by NASA and its partners by identifying, evaluating, and acquiring commercial satellite data.

For more information about NASA’s Commercial Satellite Acquisition program, visit:

https://science.nasa.gov/earth-science/csda

-end-

Liz Vlock
Headquarters, Washington
202-358-1600
elizabeth.a.vlock@nasa.gov

Share

Details

Last Updated
Jun 18, 2026
Editor
Jessica Taveau

NASA Uses Machine Learning to Enhance Flash Flood Warnings

16 June 2026 at 16:23

The Transient Artifact and Continuous Learning System (TACLS) leverages data from continuously operating satellite networks coupled with machine learning models to help meteorologists at the National Weather Service forecast flash floods more efficiently. This new software is the result of a collaboration between NASA’s Jet Propulsion Laboratory, the University of California, San Diego (UCSD), and the National Oceanic and Atmospheric Administration (NOAA) National Weather Service (NWS).

A visual analysis from a TACLS test prediction run using data from flash floods the week of Christmas, 2025. The image shows flash flood warning (FFW) probabilities generated by TACLS (in shades of red) and overlaid on areas that received flash flood warnings from the National Weather Service (in blue).
Credit: UCSD Scripps Institution of Oceanography

Created with support from NASA’s Earth Science Technology Office (ESTO), TACLS leverages machine learning to automatically locate evidence (unusual increases in atmospheric moisture) of impending flash flooding that meteorologists may otherwise miss as they analyze large amounts of data. TACLS flags that evidence, indicates where flash flooding could likely occur, and displays that information via a user-friendly visualization for human analysts to interpret. Those analysts can then decide whether to issue a flash flood warning or weather advisory.

This novel framework for tracking extreme weather events and predicting imminent flash floods operates in near real-time, producing forecasts in as little as fifteen minutes.

“That’s really what we wanted to do, to give meteorologists a tool to help decision making for flash flood warnings,” said Yehuda Bock, Distinguished Researcher at the UCSD Scripps Institution of Oceanography and principal investigator for TACLS.

In simulations testing, TACLS used data from diverse severe weather events—including atmospheric rivers, monsoonal convection, and tropical cyclone remnants—between 2017 and 2023 and successfully captured 93% of the issued flash-flood warnings. Meteorologists from the National Weather Service are currently working to incorporate TACLS into their existing systems for forecasting flash floods in Southern California.

A cyclone makes landfall across the California coast on November 19, 2024. TACLS will help give communities more time to prepare for impending severe weather.
Credit: NASA

This learning system has two main components. First, an analytic back-end software suite uses machine learning algorithms to process satellite data and determine areas at risk for flooding. Second, user-friendly visualization software highlights those areas for further analysis by humans.

The ACLS back-end software analyzes data from satellites in the Global Navigation Satellite System (GNSS), a constellation of satellite networks that drive navigation services around the world. Water vapor in the troposphere delays signals from these satellites as they travel to Earth. This signal delay can be analyzed to calculate the amount of water vapor in the atmosphere over a particular location on Earth.

The TACLS analytic back-end software suite features a machine learning model trained using more than 30 years of past GNSS data. This model is an anomaly detector that tracks unusual increases in atmospheric moisture. The model then carefully examines that atmospheric moisture data and determines whether it’s either an artifact (a false feature or distortion in the data) or a transient (a time-sensitive physical event, like heavy precipitation) that requires interpretation by human analysts.

If TACLS determines the data represents a transient, such as an extreme weather event that warrants a flash flood warning, it will forward that data to the TACLS visualization software (MGViz) for further evaluation by humans. The analysts use their judgement and experience to interpret these events and determine whether the flagged data indicates a flash flood is likely, and, if necessary, issue a flash flood warning.

Several past innovations developed at JPL are leveraged by TACLS to process GNSS data and present the results. The analytic back-end software suite incorporates elements from JPL’s Domain-agnostic Outlier Ranking Algorithms program and the Time-series Forecasting, Evaluation, and Deployment program. The TACLS visualizer is based on the Multi-Mission Geographic Information System, originally developed at JPL for NASA’s Mars missions.

The TACLS software binds all these components within a novel system that enhances existing methods to reduce the amount of time it takes for a human analyst to determine whether to issue a flash flood warning.

Both the TACLS software and the data used to train it will be open-source, allowing scientists to either tailor this model in response to their unique research needs or create their own model from scratch.

For additional details, see the entry for this project on NASA TechPort. 

Project Lead: Dr. Yehuda Bock, University of California, San Diego. 

Sponsoring Organization(s): NASA’s Earth Science Technology Office Advanced Information Systems Technology Program; JPL; NOAA; National Weather Service. 

The post NASA Uses Machine Learning to Enhance Flash Flood Warnings appeared first on NASA Science.

Private Sector Engagement

10 June 2026 at 20:41
A collage of the Earth with two rings filled with images related to multiple private sectors that use NASA data.

Private Sector Engagement


Transforming NASA’s trusted Earth science into powerful business intelligence

Earth Science Private Sector Engagement

NASA Earth science data, tools, and expertise drive economic innovation by providing industry with trusted insights to accurately forecast risk, optimize operations, and advance next-generation business solutions. By connecting, informing, and partnering with businesses, NASA’s Private Sector Engagement Office unlocks new opportunities to reinforce the use of Earth observations in existing markets and broaden adoption across emerging industry sectors, empowering organizations to build powerful and resilient solutions for the future.

Subscribe for Updates

Get the latest industry-relevant news and information direct to your inbox.

We will never share your email address.

Privacy Policy

Sign Up
A collage of the Earth with a newsletter signup icon overlaid with three rings around it including an ocean image, an engineering image, and a farmland image.

Propose for Innovation Funding

INNOVATE is NASA’s innovation funding program designed to accelerate the translation of Earth science into real-world applications. Selected teams receive access to NASA funding, data, and expertise to develop solutions that address commercial and societal challenges. This opportunity is open through August 31, 2026.

Real-Time Flood Inundation Forecasting & Impact Assessment

Investigators & Partners: NASA Goddard Space Flight Center; University of Wisconsin-Milwaukee; University of Colorado; University of Wisconsin-Madison; University of Connecticut; Swiss Re; Munich Re; Eversource

  • An AI-powered flood intelligence platform that combines NASA Earth observations with advanced modeling to deliver real-time flood forecasts and impact assessments, including Federal Emergency Management Agency and NOAA end users.
  • Designed with insurers and utilities to improve disaster response, risk management, and resilience.

Operational Risk Forecasting for AI Infrastructure

Investigators & Partners: NASA Goddard Space Flight Center; Universities Space Research Association; Meta; Uptime Institute; Open-IX

  • A first-of-its-kind system that uses NASA Earth observations to forecast operational risks to data centers, power systems, and water resources up to 14 days in advance.
  • Helps critical infrastructure operators anticipate disruptions before they occur.

Fire & Risk Modeling for Property Insurance

Investigators & Partners: National Science Foundation; National Center for Atmospheric Research; Mercury Insurance

  • A next-generation wildfire risk platform combining NASA Earth science, physics-based modeling, and AI to improve insurance underwriting and community resilience.
  • Developed with industry partners to better understand and manage growing wildfire risks.

Next-Generation Food Security Early Warning System

Investigators & Partners: Space Science Institute; Chapman University; World Food Program; Microinsurance Catastrophe Risk Organization

  • An advanced agricultural monitoring system that uses NASA Earth observations to detect food security risks months before traditional warning systems.
  • Supports insurers, humanitarian organizations, and agribusinesses with earlier, more actionable insights.

AI-Powered Wildfire Risk Intelligence for Utilities

Investigators & Partners: NASA Jet Propulsion Laboratory; OpalAI; Pacific Gas & Electric; Los Angeles Department of Water & Power

  • An AI-enabled wildfire intelligence platform that helps utilities identify asset-level wildfire risks and improve operational decision-making.
  • Designed to reduce outages, strengthen grid resilience, and protect communities.

Early Warning & Transparency for Forest Supply Chains

Investigators & Partners: NASA Goddard Space Flight Center; University of Maryland; Science Systems and Applications Inc.; Chainparency

  • A NASA-enabled monitoring and forecasting platform that helps forestry and wood-product industries track forest health, detect emerging risks, and improve supply chain transparency.
  • Supports more resilient and sustainable forest management at scale.

How NASA Helps Industry

How NASA supports agribusiness

Every day, farmers, food companies, and agricultural producers rely on timely, trusted information to manage their crops, land, water, and supply chains. NASA develops technology and missions to observe agricultural landscapes from space, informing optimal time and location for planting, monitoring of plant growth, best times for harvest, and market readiness assessments. U.S. and international partners use this information to support food security, stabilize markets, and strengthen productive farming.

From space, NASA tracks soil moisture, groundwater, crop condition, water use, heat stress, precipitation, and land change, while also supporting field-level tools and trusted partnerships with producers and agricultural organizations. By transforming satellite data into practical insights, NASA helps agribusiness to anticipate challenges, improve productivity, manage vital resources, and safeguard food systems.

On Aug. 23, 2025, NISAR imaged land adjacent to northeastern North Dakota's Forest River.
The NISAR (NASA-ISRO Synthetic Aperture Radar) satellite captured an image of northeastern North Dakota on Aug. 23, 2025. The darker agricultural plots are plowed and unplanted fields, while the lighter colors represent the presence of pasture or crops. Circular patterns indicate the use of center-pivot irrigation.
NASA JPL

FEbruary 2026

Industry Summit Report

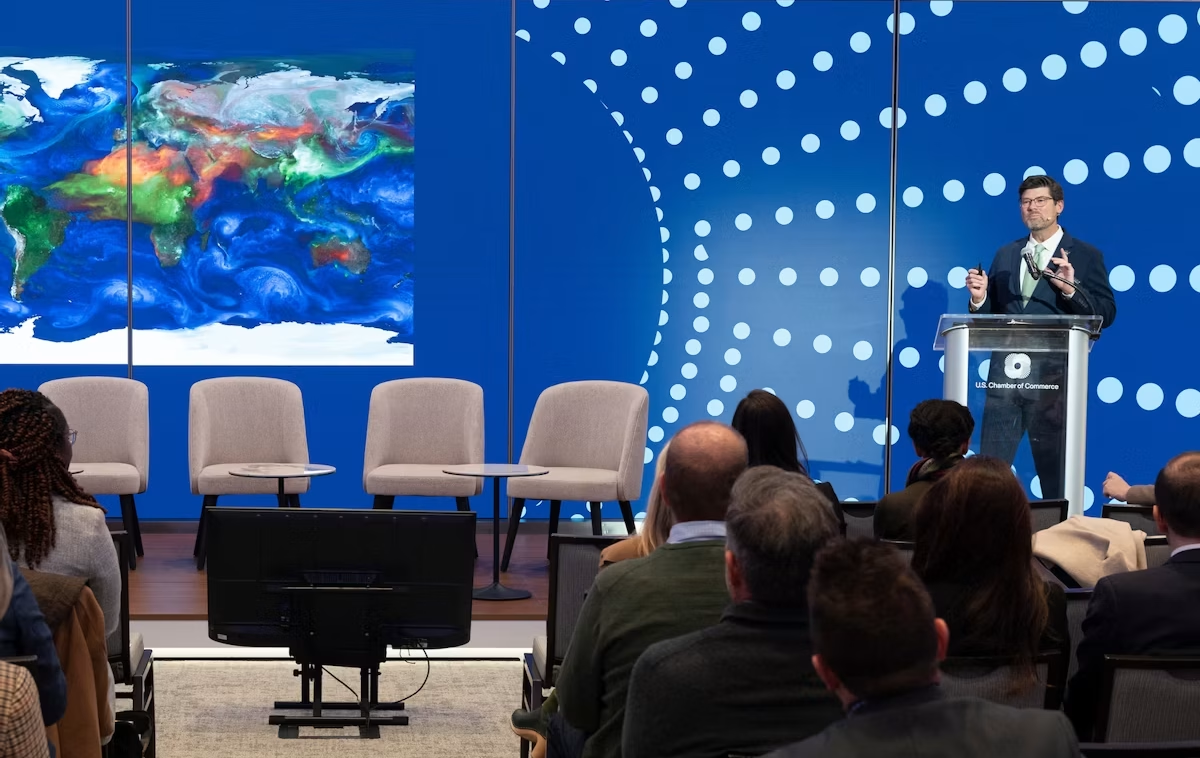
The NASA Earth Science Industry Summit, hosted by the U.S. Chamber of Commerce on February 2, 2026, served as a strategic forum to explore how NASA’s Earth Science enterprise contributes to the engines of the American economy and how public and private sectors can work together to unlock greater opportunities in Earth observation.

Explore the summary report for key reflections and takeaways, representing the perspectives of more than 180 participants across finance, insurance, agriculture, energy, utilities, and more.

Image Credit: U.S. Chamber of Commerce

View the Report

FEbruary 2026

Industry Summit Report

data catalog & resources

NASA Earthdata

Earthdata is your gateway to find, access, visualize, and download NASA Earth science data. Browse the data catalog, search by topic, discover learning resources including tutorials and trainings, and more.

Explore
NASA Earthdata Icon

Featured Trainings

NASA's Applied Remote Sensing Training Program (ARSET) teaches users how to use remote sensing data for a range of applications. ARSET trainings are available for all levels of experience at no cost, both in person and online.

Fundamentals of Remote Sensing

Earth Observations for Insurance and Finance Sector Decision-Making

NASA Earth Observations for Energy Management

Satellite Remote Sensing for Agricultural Applications

Data Product Highlights

Screenshot of the FIRMS interface

Active Fire Tracking

The Fire Information for Resource Management System (FIRMS) tracks active fires and hotspots worldwide to support response, risk monitoring, and operational awareness.

The very green landscape shows the Ohio River, Mississippi River and Black River. They are all breeching their banks. The spave between the Black (left) and Mississippi (center) Rivers is more blue than green with water. The lower right corner of the image appears a powder blue with blanket cloud cover.

Flood Water Monitoring

NASA’s Land, Atmosphere Near real-time Capability for Earth observation (LANCE) provides near real-time flood products, showing flooding and surface water changes to support exposure, claims, and resilience planning.

Economic & Human Activity

Night-time lights, visible with NASA’s Black Marble products, are used to monitor economic indicators, human activity, outages, infrastructure disruptions, and disaster recovery.

Heat & Temperature Insights

The ECOsystem Spaceborne Thermal Radiometer Experiment on Space Station (ECOSTRESS) instrument detects surface heat, crop water stress, urban heat, and thermal conditions affecting assets and operations.

Land Surface Change & Risk

The OPERA Surface Displacement (DISP) product suite identifies land surface movement from processes such as sinkholes, earthquakes, and landslides, supporting risk assessment for infrastructure and critical assets.

Long-Term Risk Projection

NASA Earth eXchange Global Daily Downscaled Projections (NEX-GDDP) provides historical baselines and future climate scenarios for asset, portfolio, and resilience planning.

Partnerships & Collaboration

NASA offers 60 years of experience in advanced engineering and testing capabilities, cutting edge research and technology development, as well as unique assets such as land, facilities and laboratories for use by commercial industries, academic institutions, U.S. government agencies and international entities.

The NASA Partnerships icon- a handshake surrounded by two circles.

Partnerships Front Door

Discover how NASA works with industry, academic, and non-profit partners to advance mutual goals through through strategic, non-procurement partnerships.

Hall Thruster

Technology Transfer Program

The NASA Technology Transfer program ensures that innovations developed for exploration and discovery are broadly available to the public.

Research Opportunities

NASA Solicitation and Proposal Integrated Review and Evaluation System (NSPIRES) is the official system to submit and manage research proposals.

Data Insignia

Eligible organizations that incorporate NASA data into their products, services, or research can gain significant value by displaying the NASA Data Insignia.

Private Sector Engagement Office

Nima PahlevanProgram Manager
Janelle Heslop Project Manager
Rachel VershelOperations Officer

The post Private Sector Engagement appeared first on NASA Science.

NASA’s CloudCube Pioneers Miniaturized Radar to Study Clouds, Precipitation

10 June 2026 at 13:00

A compact, multifrequency radar built by a team at NASA’s Jet Propulsion Laboratory will make it easier to collect information about dynamic cloud systems. Called CloudCube, this new instrument simultaneously probes the atmosphere with three radar signals, spanning 36 to 240 GHz, for optimized sensitivity to a wide range of water droplet and ice particle sizes. 

An outdoor scientific equipment setup on a gravel surface under a bright blue sky. The main structure is a white shipping container elevated on concrete blocks, with a large, white, drum-shaped dome mounted on its roof. Attached to the front of the container is a grey metal cabinet featuring the red Jet Propulsion Laboratory (JPL) logo and a small angled panel on top. Bright green tie-down straps anchor the front equipment securely to the ground. Another container with a metal ladder is partially visible on the left.
Figure 1: A prototype of CloudCube’s G-band channel was installed at Cape Grim, Tasmania, as a guest instrument for the Department of Energy’s Cloud and Precipitation Experiment at Kennaook (CAPE-K)
Credit: Raquel Rodriguez Monje / JPL

Built with funding from NASA’s Earth Science Technology Office Instrument Incubator Program, CloudCube transmits and receives Ka-, W-, and G-band signals, making it the first compact radar system capable of simultaneously probing meteorological targets at wavelengths spanning approximately one to ten millimeters. Researchers will be able to combine information from the three signals to learn more about the initiation and evolution of precipitation, as well as cloud microphysics and radiative properties.

“We’re making a low-power, low-mass instrument to facilitate new cost-efficient missions for atmospheric observations. Building a multi-frequency radar, especially at G-band, is very novel,” said Raquel Rodriguez Monje, a systems engineer at JPL and principal investigator for CloudCube.

Each of CloudCube’s three signals observes a different element of cloud physics. Ka-band radar signals are ideal for collecting precipitation profiles; W-band radar signals are preferred for measuring cloud particles that give rise to precipitation; and G-band radar signals, which have never been collected from a space-based instrument, are ideal for measuring ice and liquid water content inside very light clouds (a paper describing this measurement can be found here).

Probing the atmosphere simultaneously with three signals allows researchers to collect data on all these cloud features at once, which is valuable for improving weather forecasts and especially climate modeling. CloudCube leverages innovations in millimeter-wave hardware to pack three radar modules–one for each signal–within a single compact system.

A highly intricate piece of custom electronic, likely radio frequency or microwave, hardware sitting on a light blue surface. The assembly is made mostly of thick gold-plated and silver metal blocks fastened together with numerous screws. It features several curved, rigid gold waveguides with flanged connections, various coaxial ports, a multi-pin D-sub connector, and a small bundle of colored electrical wires. A silver block on top is labeled with
Figure 2. A photo of the radar electronics for CloudCube’s compact G-band radar. Producing G-band radar signals requires a large amount of energy, and CloudCube is one of the first instruments to produce those signals effectively from a compact platform.
Credit: Raquel Rodriguez Monje / NASA JPL

One CloudCube innovation concerns the specialized components required to transmit G-band power from a compact, low-power instrument. The detection of cloud signals requires high transmit power, which CloudCube achieves by combining the outputs of multiple high-efficiency frequency-multiplication devices that allow the instrument to generate hundreds of milliWatts at 240 GHz. Another innovation of CloudCube is that it was designed to use as few radio frequency components as possible to reduce its mass and power consumption, which could lower the cost of future Earth-observing orbital instruments.

Flying an instrument equipped with G-band radar in space will be a new capability and will allow researchers to achieve greater spatial resolution and sensitivity in the study of cloud microphysical processes.

“Basically, we’re weighing clouds using these combinations of frequencies in a way that we couldn’t do before we had the G-band,” said Matt Lebsock, a researcher at JPL and co-investigator for CloudCube.

The instrument has been tested in the field. A ground-based prototype of CloudCube’s G-band channel operated continuously for 11 months during the Department of Energy’s Cloud and Precipitation Experiment at Kennaook (CAPE-K) campaign. CloudCube also participated in the Eastern Pacific Cloud Aerosol Precipitation Experiment, a ground campaign sponsored by the Department of Energy. A paper describing the results of that experiment can be found here.

Most recently, CloudCube successfully operated all three frequency bands from NASA’s Gulfstream III aircraft and collected its first airborne observations of snowfall as part of the North American Upstream Feature-Resolving and Tropopause Uncertainty Reconnaissance Experiment campaign—a NASA-funded campaign designed to improve forecasts of high-impact winter weather. The CloudCube team is currently calibrating and processing the data for public release.

For additional details, see the entry for this project on NASA TechPort.

Project Lead: Dr. Raquel Rodriguez Monje, NASA’s Jet Propulsion Laboratory

Sponsoring Organization: NASA’s Earth Science Technology Office Instrument Incubation Program

GLOBE Mission Earth Educators Participate in Land Cover Community of Practice

10 June 2026 at 13:43

3 min read

GLOBE Mission Earth Educators Participate in Land Cover Community of Practice

During the 2025-2026 school year, educators from the NASA Science Activation Program’s GLOBE (Global Learning and Observation to Benefit the Environment) Mission Earth project participated in a specialized Community of Practice led by NASA Langley Research Center to refine how students interact with NASA’s land cover data (MODIS, Landsat, and Sentinel-2). Their collaboration focused on four key areas:

  • Data Collection: Improving the process of making and submitting land cover observations to NASA using the GLOBE Observer App.
  • Curriculum Integration: Identifying connections between land cover observations, satellite data, and classroom learning.
  • Student Research: Brainstorming potential land cover research topics/questions for students.
  • Validation: Providing expert feedback on the satellite comparison process.

Through GLOBE, communities can contribute meaningful environmental data to a long-term data record. When participants make observations of land cover via GLOBE Observer, the team at NASA Langley compares their observation with satellite data for a similar time and location and sends a satellite comparison email, which includes a data table that shows how their GLOBE observation and the corresponding satellite data compare. 

Key Community of Practice Findings:
The Community of Practice included a total of 14 educators, with six actively collecting land cover observations with their students using the GLOBE Observer app. These land cover observations were collocated to MODIS, Landsat, and Sentinel-2 data with educators receiving a satellite comparison email. 

Within the scope of this Community of Practice, 10 of the educators developed student research plans for the 2026-2027 school year focused on land cover data, addressing questions such as:

  • How does land cover affect surface temperature?
  • How has land use changed over time for our local area?
  • How does land cover differ for locations (such as other schools) at the same latitude but different longitudes?
  • How do different land covers impact flooding?

The educators were extremely excited to have the opportunity to interact and learn from each other as a community, as well as to connect with NASA subject matter experts. Based on lessons learned from the Community of Practice, the team has a better understanding of how NASA land cover data can be incorporated in the classroom, what types of research questions educators might present to their students, and resources that could be developed to assist educators in the implementation of their research plans. 

Within the scope of the Land Cover Community of Practice (COP), educators were asked to provide feedback for the GLOBE Mission Earth GLOBE Nature Notes Guide that was developed by the NASA Langley team, leveraging the Nature Note model created by the NASA Science Activation program’s Learning Ecosystems North East (LENE) project, which is led by the Gulf of Maine Research Institute. The GLOBE Nature Notes aligned with GLOBE protocols were developed to assist educators in integrating the Nature Notes process with their students’ GLOBE observations. One of the COP educators is currently developing an example of a land cover GLOBE Nature Note that will be shared with the GLOBE and NASA Science Activation community, once completed.

Educators can join the GLOBE Program and contribute observations of Land Cover and other environmental conditions by downloading the GLOBE Observer app and learning more about Land Cover.

Screenshot of a NASA GLOBE Observer satellite comparison table emailed to a participant after submitting a land cover observation. The report includes the observation date and time, geographic coordinates, and surface condition details such as dry ground, leaves present, muddy conditions, and weather observations. A row of six participant photos labeled North, East, South, West, Up, and Down shows the surrounding environment near a waterfront with buildings, pavement, sky, and water visible. Below the photos is a land cover classification section with a color-coded map comparing the participant’s observation area to MODIS satellite land cover data. A legend identifies categories including water bodies, forests, wetlands, croplands, urban and built-up lands, and barren areas. The classification for this observation is listed as “Urban and Built-up Lands.” At the bottom of the report, side-by-side satellite images from Landsat 8 & 9 and Sentinel-2A and 2B display the same geographic area from orbit. The document demonstrates how NASA Langley’s GLOBE Mission Earth Science Activation project compares community-submitted land cover observations with satellite imagery and land classification datasets.
Sample of a NASA GLOBE Observer satellite comparison table that gets emailed to a participant after submitting a land cover observation. (NASA Langley GLOBE Mission Earth Science Activation project team).
NASA GLOBE Observer

GLOBE Mission Earth is supported by NASA under cooperative agreement award number NNX16AC54A and is part of NASA’s Science Activation Portfolio. Learn more about how Science Activation connects NASA science experts, real content, and experiences with community leaders to do science in ways that activate minds and promote deeper understanding of our world and beyond: https://science.nasa.gov/learn/about-science-activation/.

Share

Details

Last Updated
Jun 10, 2026

The post GLOBE Mission Earth Educators Participate in Land Cover Community of Practice appeared first on NASA Science.

GLOBE Mission Earth Educators Participate in Land Cover Community of Practice

10 June 2026 at 13:43

3 min read

GLOBE Mission Earth Educators Participate in Land Cover Community of Practice

During the 2025-2026 school year, educators from the NASA Science Activation Program’s GLOBE (Global Learning and Observation to Benefit the Environment) Mission Earth project participated in a specialized Community of Practice led by NASA Langley Research Center to refine how students interact with NASA’s land cover data (MODIS, Landsat, and Sentinel-2). Their collaboration focused on four key areas:

  • Data Collection: Improving the process of making and submitting land cover observations to NASA using the GLOBE Observer App.
  • Curriculum Integration: Identifying connections between land cover observations, satellite data, and classroom learning.
  • Student Research: Brainstorming potential land cover research topics/questions for students.
  • Validation: Providing expert feedback on the satellite comparison process.

Through GLOBE, communities can contribute meaningful environmental data to a long-term data record. When participants make observations of land cover via GLOBE Observer, the team at NASA Langley compares their observation with satellite data for a similar time and location and sends a satellite comparison email, which includes a data table that shows how their GLOBE observation and the corresponding satellite data compare. 

Key Community of Practice Findings:
The Community of Practice included a total of 14 educators, with six actively collecting land cover observations with their students using the GLOBE Observer app. These land cover observations were collocated to MODIS, Landsat, and Sentinel-2 data with educators receiving a satellite comparison email. 

Within the scope of this Community of Practice, 10 of the educators developed student research plans for the 2026-2027 school year focused on land cover data, addressing questions such as:

  • How does land cover affect surface temperature?
  • How has land use changed over time for our local area?
  • How does land cover differ for locations (such as other schools) at the same latitude but different longitudes?
  • How do different land covers impact flooding?

The educators were extremely excited to have the opportunity to interact and learn from each other as a community, as well as to connect with NASA subject matter experts. Based on lessons learned from the Community of Practice, the team has a better understanding of how NASA land cover data can be incorporated in the classroom, what types of research questions educators might present to their students, and resources that could be developed to assist educators in the implementation of their research plans. 

Within the scope of the Land Cover Community of Practice (COP), educators were asked to provide feedback for the GLOBE Mission Earth GLOBE Nature Notes Guide that was developed by the NASA Langley team, leveraging the Nature Note model created by the NASA Science Activation program’s Learning Ecosystems North East (LENE) project, which is led by the Gulf of Maine Research Institute. The GLOBE Nature Notes aligned with GLOBE protocols were developed to assist educators in integrating the Nature Notes process with their students’ GLOBE observations. One of the COP educators is currently developing an example of a land cover GLOBE Nature Note that will be shared with the GLOBE and NASA Science Activation community, once completed.

Educators can join the GLOBE Program and contribute observations of Land Cover and other environmental conditions by downloading the GLOBE Observer app and learning more about Land Cover.

Screenshot of a NASA GLOBE Observer satellite comparison table emailed to a participant after submitting a land cover observation. The report includes the observation date and time, geographic coordinates, and surface condition details such as dry ground, leaves present, muddy conditions, and weather observations. A row of six participant photos labeled North, East, South, West, Up, and Down shows the surrounding environment near a waterfront with buildings, pavement, sky, and water visible. Below the photos is a land cover classification section with a color-coded map comparing the participant’s observation area to MODIS satellite land cover data. A legend identifies categories including water bodies, forests, wetlands, croplands, urban and built-up lands, and barren areas. The classification for this observation is listed as “Urban and Built-up Lands.” At the bottom of the report, side-by-side satellite images from Landsat 8 & 9 and Sentinel-2A and 2B display the same geographic area from orbit. The document demonstrates how NASA Langley’s GLOBE Mission Earth Science Activation project compares community-submitted land cover observations with satellite imagery and land classification datasets.
Sample of a NASA GLOBE Observer satellite comparison table that gets emailed to a participant after submitting a land cover observation. (NASA Langley GLOBE Mission Earth Science Activation project team).
NASA GLOBE Observer

GLOBE Mission Earth is supported by NASA under cooperative agreement award number NNX16AC54A and is part of NASA’s Science Activation Portfolio. Learn more about how Science Activation connects NASA science experts, real content, and experiences with community leaders to do science in ways that activate minds and promote deeper understanding of our world and beyond: https://science.nasa.gov/learn/about-science-activation/.

Share

Details

Last Updated
Jun 10, 2026

NASA’s CloudCube Pioneers Miniaturized Radar to Study Clouds, Precipitation

10 June 2026 at 13:00

A compact, multifrequency radar built by a team at NASA’s Jet Propulsion Laboratory will make it easier to collect information about dynamic cloud systems. Called CloudCube, this new instrument simultaneously probes the atmosphere with three radar signals, spanning 36 to 240 GHz, for optimized sensitivity to a wide range of water droplet and ice particle sizes. 

An outdoor scientific equipment setup on a gravel surface under a bright blue sky. The main structure is a white shipping container elevated on concrete blocks, with a large, white, drum-shaped dome mounted on its roof. Attached to the front of the container is a grey metal cabinet featuring the red Jet Propulsion Laboratory (JPL) logo and a small angled panel on top. Bright green tie-down straps anchor the front equipment securely to the ground. Another container with a metal ladder is partially visible on the left.
Figure 1: A prototype of CloudCube’s G-band channel was installed at Cape Grim, Tasmania, as a guest instrument for the Department of Energy’s Cloud and Precipitation Experiment at Kennaook (CAPE-K)
Credit: Raquel Rodriguez Monje / JPL

Built with funding from NASA’s Earth Science Technology Office Instrument Incubator Program, CloudCube transmits and receives Ka-, W-, and G-band signals, making it the first compact radar system capable of simultaneously probing meteorological targets at wavelengths spanning approximately one to ten millimeters. Researchers will be able to combine information from the three signals to learn more about the initiation and evolution of precipitation, as well as cloud microphysics and radiative properties.

“We’re making a low-power, low-mass instrument to facilitate new cost-efficient missions for atmospheric observations. Building a multi-frequency radar, especially at G-band, is very novel,” said Raquel Rodriguez Monje, a systems engineer at JPL and principal investigator for CloudCube.

Each of CloudCube’s three signals observes a different element of cloud physics. Ka-band radar signals are ideal for collecting precipitation profiles; W-band radar signals are preferred for measuring cloud particles that give rise to precipitation; and G-band radar signals, which have never been collected from a space-based instrument, are ideal for measuring ice and liquid water content inside very light clouds (a paper describing this measurement can be found here).

Probing the atmosphere simultaneously with three signals allows researchers to collect data on all these cloud features at once, which is valuable for improving weather forecasts and especially climate modeling. CloudCube leverages innovations in millimeter-wave hardware to pack three radar modules–one for each signal–within a single compact system.

A highly intricate piece of custom electronic, likely radio frequency or microwave, hardware sitting on a light blue surface. The assembly is made mostly of thick gold-plated and silver metal blocks fastened together with numerous screws. It features several curved, rigid gold waveguides with flanged connections, various coaxial ports, a multi-pin D-sub connector, and a small bundle of colored electrical wires. A silver block on top is labeled with "I" and "Q". A US quarter coin sits in the lower-left corner to indicate the scale of the device.
Figure 2. A photo of the radar electronics for CloudCube’s compact G-band radar. Producing G-band radar signals requires a large amount of energy, and CloudCube is one of the first instruments to produce those signals effectively from a compact platform.
Credit: Raquel Rodriguez Monje / NASA JPL

One CloudCube innovation concerns the specialized components required to transmit G-band power from a compact, low-power instrument. The detection of cloud signals requires high transmit power, which CloudCube achieves by combining the outputs of multiple high-efficiency frequency-multiplication devices that allow the instrument to generate hundreds of milliWatts at 240 GHz. Another innovation of CloudCube is that it was designed to use as few radio frequency components as possible to reduce its mass and power consumption, which could lower the cost of future Earth-observing orbital instruments.

Flying an instrument equipped with G-band radar in space will be a new capability and will allow researchers to achieve greater spatial resolution and sensitivity in the study of cloud microphysical processes.

“Basically, we’re weighing clouds using these combinations of frequencies in a way that we couldn’t do before we had the G-band,” said Matt Lebsock, a researcher at JPL and co-investigator for CloudCube.

The instrument has been tested in the field. A ground-based prototype of CloudCube’s G-band channel operated continuously for 11 months during the Department of Energy’s Cloud and Precipitation Experiment at Kennaook (CAPE-K) campaign. CloudCube also participated in the Eastern Pacific Cloud Aerosol Precipitation Experiment, a ground campaign sponsored by the Department of Energy. A paper describing the results of that experiment can be found here.

Most recently, CloudCube successfully operated all three frequency bands from NASA’s Gulfstream III aircraft and collected its first airborne observations of snowfall as part of the North American Upstream Feature-Resolving and Tropopause Uncertainty Reconnaissance Experiment campaign—a NASA-funded campaign designed to improve forecasts of high-impact winter weather. The CloudCube team is currently calibrating and processing the data for public release.

For additional details, see the entry for this project on NASA TechPort.

Project Lead: Dr. Raquel Rodriguez Monje, NASA’s Jet Propulsion Laboratory

Sponsoring Organization: NASA’s Earth Science Technology Office Instrument Incubation Program

The post NASA’s CloudCube Pioneers Miniaturized Radar to Study Clouds, Precipitation appeared first on NASA Science.

NASA’s INCUS Mission on Road to Launch, Study Storms From Space

5 June 2026 at 21:48
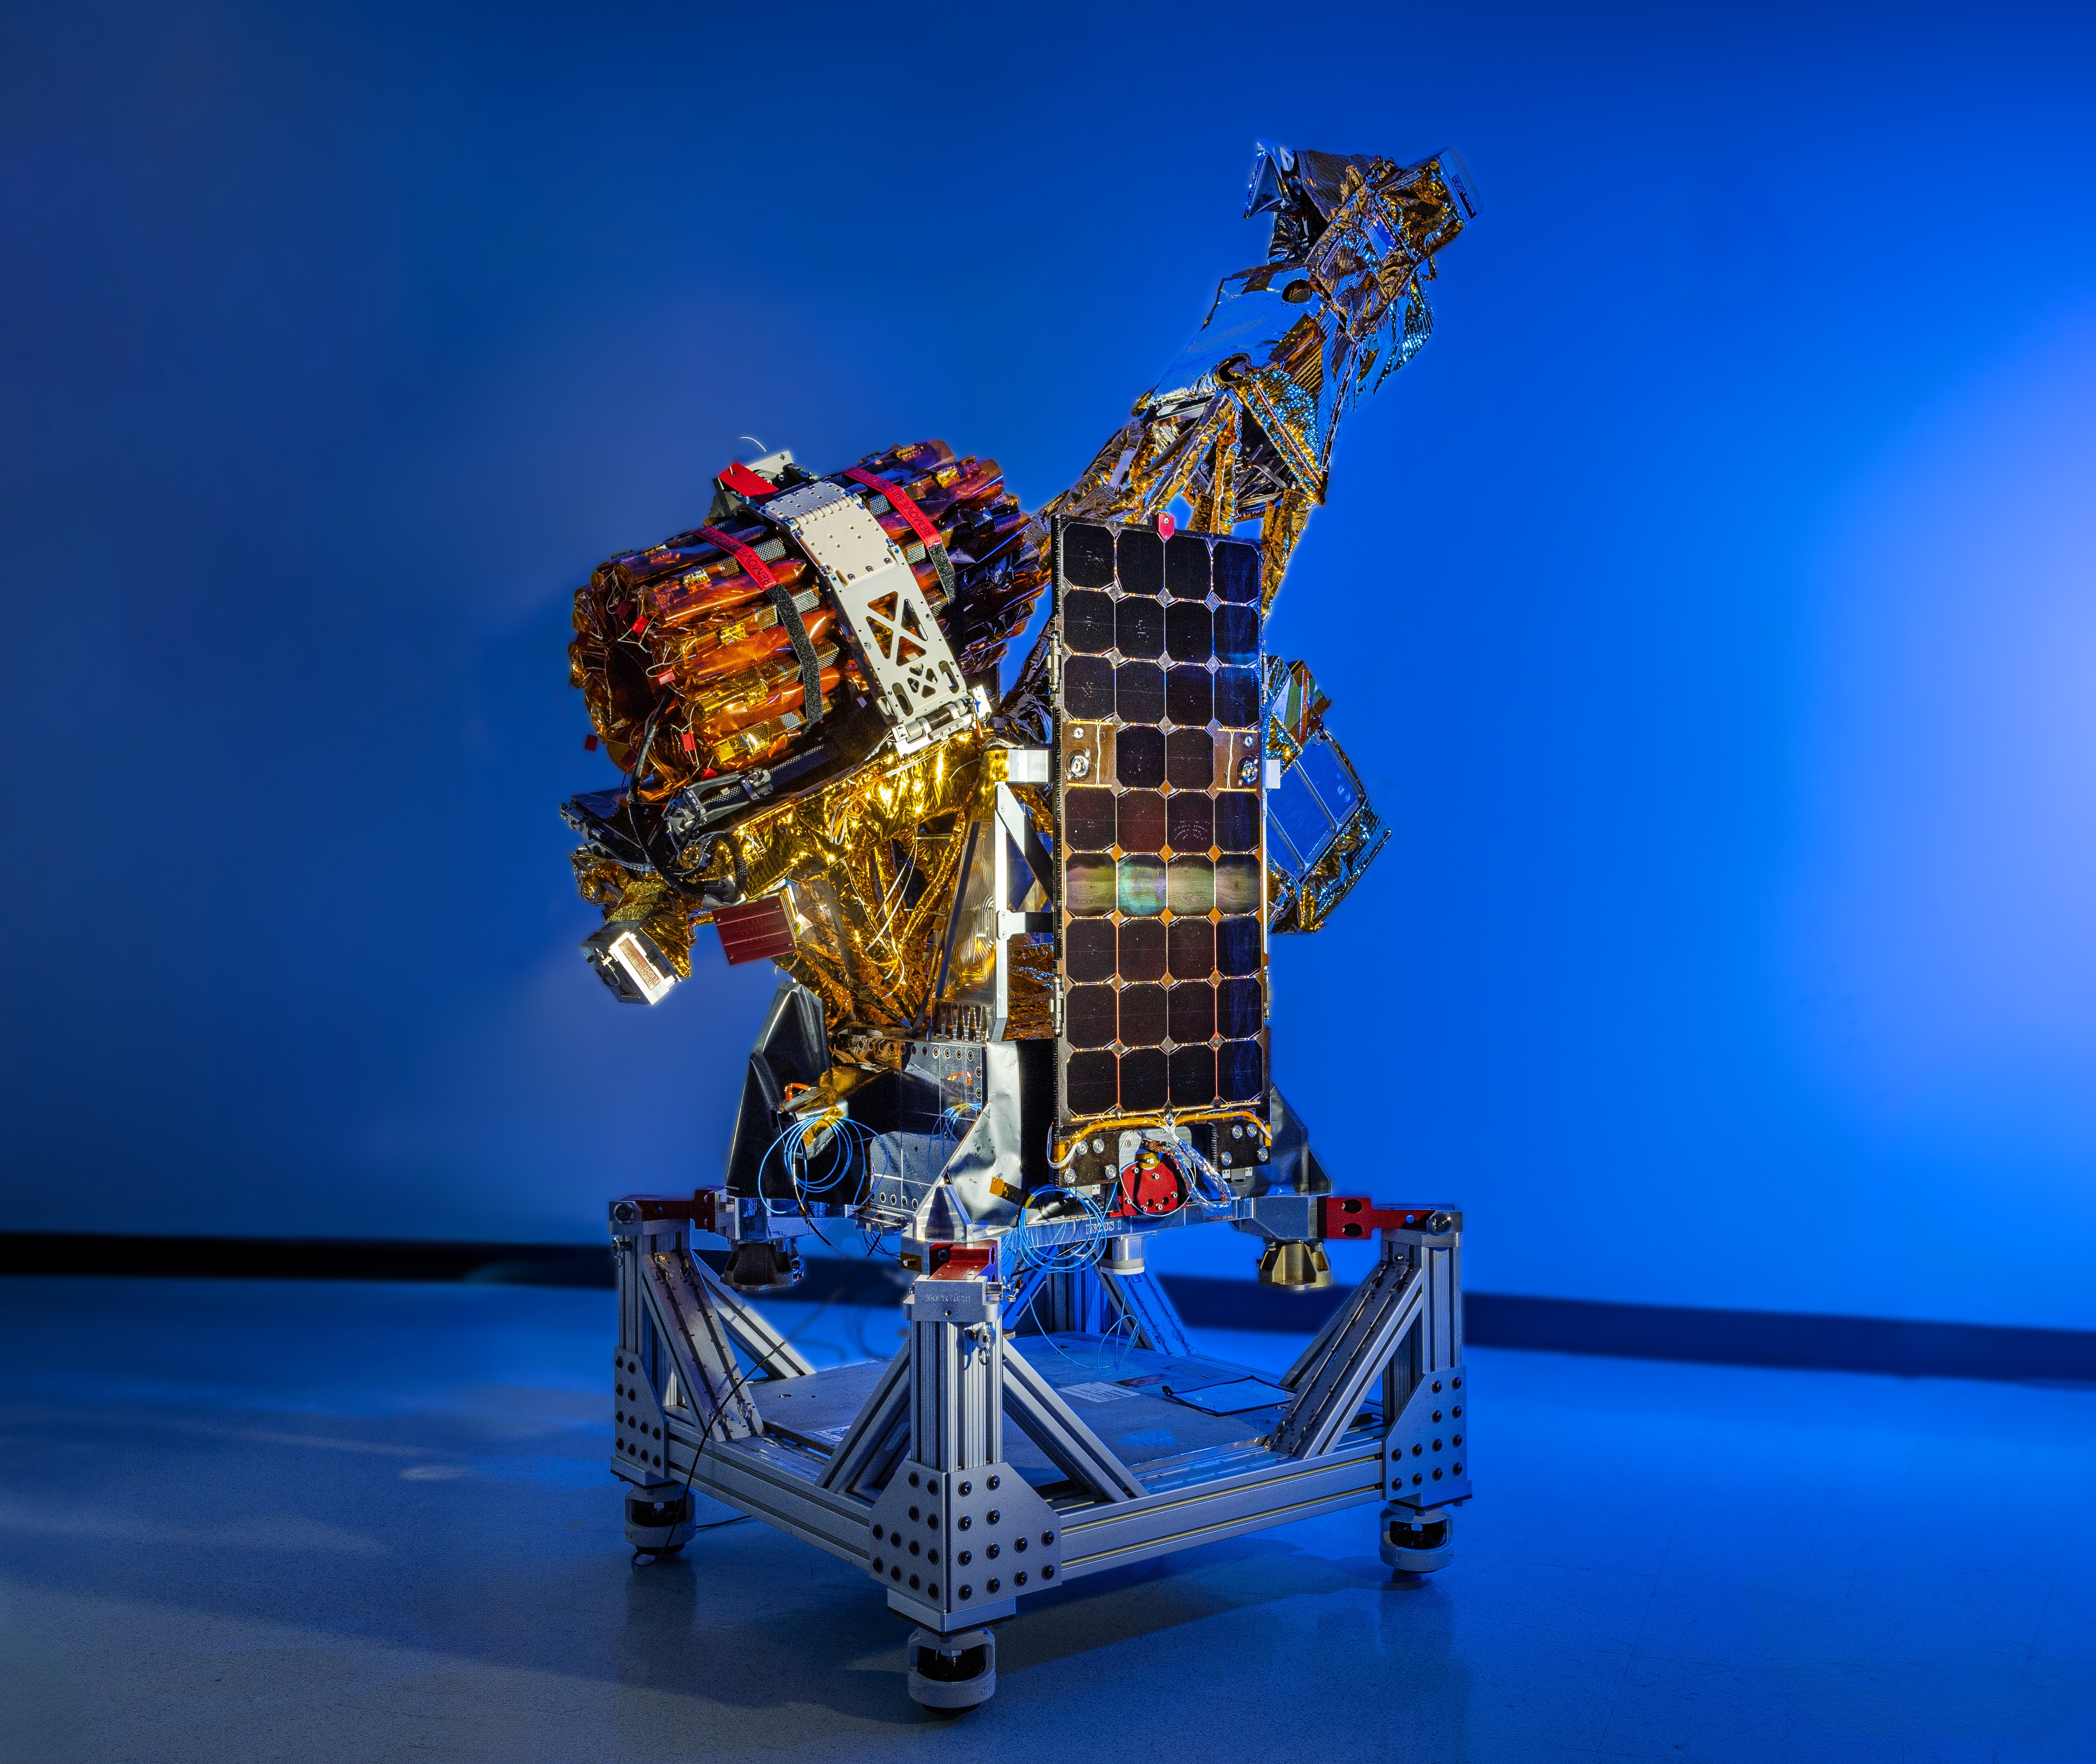
A complex spacecraft partially wrapped in gold-colored foil and featuring a large rectangular solar panel stands on a metallic support structure against a solid blue background.
Two of the three SmallSats for NASA’s INCUS mission, including the one shown here, have completed assembly and testing in preparation for shipment to NASA’s Wallops Flight Facility in Virginia for a 2027 launch. From low Earth orbit the satellites will observe the dynamics of tropical convective storms.
Blue Canyon Technologies

Teams working on NASA’s INCUS (Investigation of Convective Updrafts) mission, the first space-based survey of the dynamics of tropical convective storms, have completed assembly and tested two of the mission’s small satellites, or SmallSats. Testing continues on the third SmallSat and is scheduled for completion no earlier than September in advance of a 2027 launch.

The three satellites will fly in tight coordination in low Earth orbit, with the first and second satellites separated by 30 seconds and the second and third satellite by 90 seconds.

Characterized by the sudden and intense lifting of large amounts of air and water, tropical convective storms provide more than half of the world’s precipitation, a crucial source of life-supporting fresh water. But they also produce severe weather, which can increase risks to life and property. The INCUS mission will help improve understanding of where, when, and why convective storms form.

Led by principal investigator Sue van den Heever of Colorado State University in Fort Collins, INCUS will use spaceborne radar instruments developed at NASA’s Jet Propulsion Laboratory in Southern California to observe the vertical motion of air and water, known as convective mass flux, as storms develop and evolve. The mission will also explore how environmental factors such as air temperature, humidity, pressure, wind speed, and wind direction correlate with that movement.

These insights will improve storm forecasting, potentially mitigating loss of life and property damage in affected communities, by helping decision-makers plan for and respond to severe weather events and manage freshwater supplies. 

Teams at NASA JPL built each INCUS satellite’s radar, which were combined with a deployable mesh radar reflector made by Tendeg in Louisville, Colorado. The middle satellite also carries a microwave radiometer, also made at NASA JPL, that provides spatial context to the vertical precipitation profiles provided by the radars.

The three assemblies shipped in late 2025 and early 2026 to Blue Canyon Technologies in Lafayette, Colorado, where they were integrated with Blue Canyon’s spacecraft buses. The first two satellites, also called observatories, have successfully undergone vibration and thermal vacuum testing to ensure they will be able to withstand the jostling of launch and the extreme temperatures of space.

These two observatories also shipped to Tendeg, where teams successfully performed test deployments of the reflectors. Then they returned to Blue Canyon for additional testing. They’ll remain in storage before heading out next year to the launch site at NASA’s Wallops Flight Facility in Virginia.

Funded through the Earth Venture Mission-3 acquisition under NASA’s Earth System Science Pathfinder Program, INCUS is one of several missions fulfilling the clouds, convection, and precipitation requirements of NASA’s Earth System Observatory, a series of interconnected missions set to study our home planet’s dynamic natural systems and how they interact. The mission is also part of FALCON (Fleet for the Atmosphere Linking Commercial Observations with NASA), a fleet of atmosphere-observing satellites that will combine hardware contributions from NASA centers, universities, and commercial partners.

The post NASA’s INCUS Mission on Road to Launch, Study Storms From Space appeared first on NASA Science.

❌