❌

Normal view

How 2 US, European Satellites Are Studying Hurricanes During El Niño
9 September 2026 at 17:00

5 min read

How 2 US, European Satellites Are Studying Hurricanes During El Niño

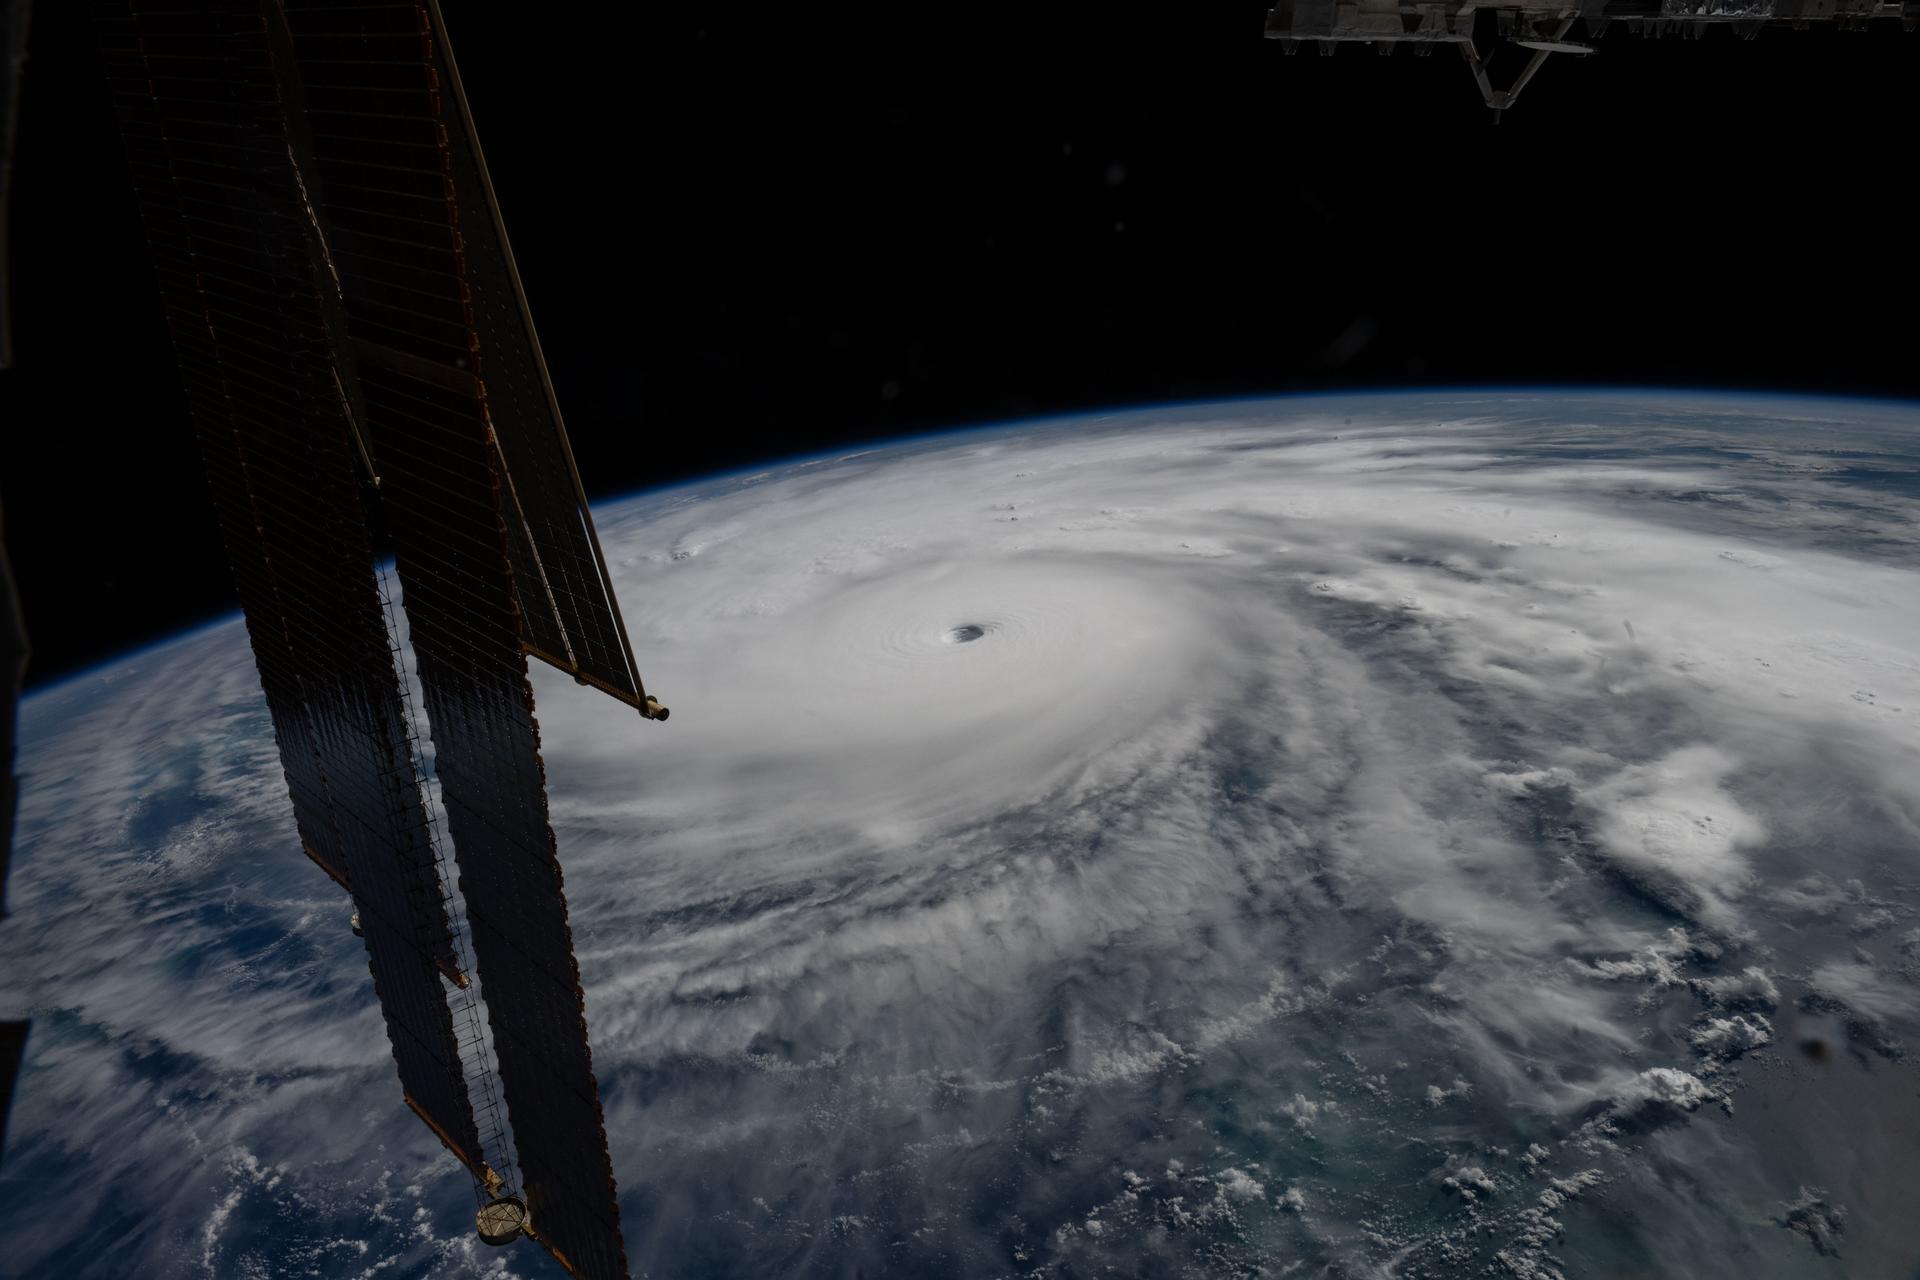
Category 5 Hurricane Melissa, one of the most powerful storms to strike the Caribbean in recent history, is pictured about 50 miles south of Jamaica in this photograph from the International Space Station as it orbited 262 miles above the Yucatan Peninsula.
Hurricane Melissa is seen 50 miles south of Jamaica in this photograph taken from the International Space Station on Oct. 28, 2025.
NASA

Last November, NASA and its European partners launched the Sentinel-6B satellite to improve hurricane forecasts, help protect infrastructure, and benefit commercial industries, including shipping. The satellite now is flying 30 seconds behind its predecessor, Sentinel-6 Michael Freilich. Both satellites are providing precise sea level height measurements during what oceanographers expect to be a historic El Niño, a naturally occurring oceanic phenomenon in which warmer-than-usual Pacific waters shift global weather patterns.

The two satellites make up the Copernicus Sentinel-6/Jason-CS (Continuity of Service) mission, the latest in a series of ocean-observing radar altimetry missions that have been monitoring Earth’s changing seas continuously since the early 1990s.

The data each satellite is collecting will not only allow scientists to better understand this year’s El Niño but will also help them create more accurate hurricane predictions.

“This El Niño was a late-bloomer,” said Josh Willis, Sentinel-6B’s project scientist at NASA’s Jet Propulsion Laboratory in Southern California. “It didn’t kick off until the middle of the year and is just now reaching a strength similar to what we’ve seen in the satellite record during significant El Niños in 1997 and 2015. We expect it to be big, and it’s already having big impacts.”

El Niños generally scramble weather patterns tied to rainfall and storms, including hurricanes. They also redistribute heat in the ocean, which affects sea level. Normally, Earth’s warmest ocean waters sit along the equator in the western Pacific. During El Niño, weakened winds, which usually blow westward along the equator, result in heat spreading east toward South America. The change in ocean heat shifts hurricane activity from the Atlantic to the Pacific Ocean.

Predicting hurricane strength

On July 15, Sentinel-6B began delivering low-latency data to scientists that could be used for weather predictions. That data will take some time to work its way into the research models on which meteorologists and climate scientists rely, but when it does, those improved models could save lives.

Data from Sentinel-6 satellite missions feeds into hurricane tracking algorithms used by federal and state agencies. Those predictions can activate disaster response efforts, mobilizing resources ranging from sandbag placement to National Guard activation. They also can lead to evacuation orders that require quick but well-informed decisions about logistics at a local level. More severe events may require engaging larger organizations, such as the Federal Emergency Management Agency.

A tropical storm can take a week or more to become a hurricane and make its way to a coastline, but a hurricane can rapidly intensify in the 48 hours prior to landfall, leaving planners little time to prepare.

“Hurricanes have been known to speed up quickly at the last moment, so the window in which to decide what to do is short,” said Deirdre Byrne, an oceanographer and altimetry expert with the National Oceanic and Atmospheric Administration (NOAA). “The goal is to forecast how much and how rapidly intensification will happen so that officials can make the right calls.”

Byrne oversees one of the country’s most crucial hurricane forecasting algorithms, NOAA’s Satellite Ocean Heat Content Suite, which has been operating since 2012.

Each Sentinel-6 satellite measures ocean height, as well as the size of waves and marine wind speed, using a radar altimeter, which bounces thousands of radar pulses a second off the crests and troughs of waves. Ocean height varies from place to place and provides insight into the ocean’s heat content, since warm water expands. That, in turn, helps forecast how fast hurricanes will grow.

The satellites each carry a second instrument, called the Global Navigation Satellite System – Radio Occultation (GNSS-RO), which measures atmospheric properties, such as humidity, pressure, and temperature.

Among the measurements Sentinel-6 is gathering, Byrne is most anticipating the ocean height data, which she plans to begin incorporating into the current Satellite Ocean Heat Content Suite algorithm by the end of the year.

“In terms of data quality, the Sentinel-6 missions are unparalleled,” Byrne said.

Together, the missions are also extending a precise dataset deep into its fourth decade. This record of sea level observations traces back to the TOPEX/Poseidon mission, which launched in 1992, and continues through to the present day with Sentinel-6 Michael Freilich. Sentinel-6B will take over for its predecessor as the reference satellite for global sea level measurements later this year.

“The key is consistency, measuring the same way, every time,” said Severine Fournier, Sentinel-6B deputy project scientist, JPL. “That’s what lets us predict hurricanes, and, in turn, protect coastal communities and infrastructure.”

More about Sentinel-6B

Sentinel-6 Michael Freilich, named after a former director of NASA’s Earth Science Division, is one of two satellites that compose the Copernicus Sentinel-6/Jason-CS mission.

Sentinel-6/Jason-CS, a part of the European Union’s Earth observation program called Copernicus, was jointly developed by ESA (European Space Agency), EUMETSAT (European Organisation for the Exploitation of Meteorological Satellites), NASA, and NOAA, with funding support from the European Commission and technical support on performance from the French space agency CNES (Centre National d’Études Spatiales). Spacecraft monitoring and control, as well as the processing of all the altimeter science data, is carried out by EUMETSAT on behalf of the European Union’s Copernicus Programme, with the support of all partner agencies.

NASA JPL, a division of Caltech in Pasadena, contributed three science instruments for each Sentinel-6 satellite: the Advanced Microwave Radiometer, the GNSS-RO, and the Laser Retroreflector Array. NASA also contributed launch services, ground systems supporting operation of the agency’s science instruments, the science data processors for two of these instruments, and support for the United States members of the international Ocean Surface Topography Science Team.

For more about Sentinel-6B, visit:

https://science.nasa.gov/mission/sentinel-6B

-end-

Media Contacts

Andrew Good / Andrew Wang
Jet Propulsion Laboratory, Pasadena, Calif.
818-393-2433 / 626-379-6874
andrew.c.good@jpl.nasa.gov / andrew.wang@jpl.nasa.gov

2026-060

The post How 2 US, European Satellites Are Studying Hurricanes During El Niño appeared first on NASA Science.

How 2 US, European Satellites Are Studying Hurricanes During El Niño

9 September 2026 at 17:00

5 min read

Preparations for Next Moonwalk Simulations Underway (and Underwater)

Category 5 Hurricane Melissa, one of the most powerful storms to strike the Caribbean in recent history, is pictured about 50 miles south of Jamaica in this photograph from the International Space Station as it orbited 262 miles above the Yucatan Peninsula.
Hurricane Melissa is seen 50 miles south of Jamaica in this photograph taken from the International Space Station on Oct. 28, 2025.
NASA

Last November, NASA and its European partners launched the Sentinel-6B satellite to improve hurricane forecasts, help protect infrastructure, and benefit commercial industries, including shipping. The satellite now is flying 30 seconds behind its predecessor, Sentinel-6 Michael Freilich. Both satellites are providing precise sea level height measurements during what oceanographers expect to be a historic El Niño, a naturally occurring oceanic phenomenon in which warmer-than-usual Pacific waters shift global weather patterns.

The two satellites make up the Copernicus Sentinel-6/Jason-CS (Continuity of Service) mission, the latest in a series of ocean-observing radar altimetry missions that have been monitoring Earth’s changing seas continuously since the early 1990s.

The data each satellite is collecting will not only allow scientists to better understand this year’s El Niño but will also help them create more accurate hurricane predictions.

“This El Niño was a late-bloomer,” said Josh Willis, Sentinel-6B’s project scientist at NASA’s Jet Propulsion Laboratory in Southern California. “It didn’t kick off until the middle of the year and is just now reaching a strength similar to what we’ve seen in the satellite record during significant El Niños in 1997 and 2015. We expect it to be big, and it’s already having big impacts.”

El Niños generally scramble weather patterns tied to rainfall and storms, including hurricanes. They also redistribute heat in the ocean, which affects sea level. Normally, Earth’s warmest ocean waters sit along the equator in the western Pacific. During El Niño, weakened winds, which usually blow westward along the equator, result in heat spreading east toward South America. The change in ocean heat shifts hurricane activity from the Atlantic to the Pacific Ocean.

Predicting hurricane strength

On July 15, Sentinel-6B began delivering low-latency data to scientists that could be used for weather predictions. That data will take some time to work its way into the research models on which meteorologists and climate scientists rely, but when it does, those improved models could save lives.

Data from Sentinel-6 satellite missions feeds into hurricane tracking algorithms used by federal and state agencies. Those predictions can activate disaster response efforts, mobilizing resources ranging from sandbag placement to National Guard activation. They also can lead to evacuation orders that require quick but well-informed decisions about logistics at a local level. More severe events may require engaging larger organizations, such as the Federal Emergency Management Agency.

A tropical storm can take a week or more to become a hurricane and make its way to a coastline, but a hurricane can rapidly intensify in the 48 hours prior to landfall, leaving planners little time to prepare.

“Hurricanes have been known to speed up quickly at the last moment, so the window in which to decide what to do is short,” said Deirdre Byrne, an oceanographer and altimetry expert with the National Oceanic and Atmospheric Administration (NOAA). “The goal is to forecast how much and how rapidly intensification will happen so that officials can make the right calls.”

Byrne oversees one of the country’s most crucial hurricane forecasting algorithms, NOAA’s Satellite Ocean Heat Content Suite, which has been operating since 2012.

Each Sentinel-6 satellite measures ocean height, as well as the size of waves and marine wind speed, using a radar altimeter, which bounces thousands of radar pulses a second off the crests and troughs of waves. Ocean height varies from place to place and provides insight into the ocean’s heat content, since warm water expands. That, in turn, helps forecast how fast hurricanes will grow.

The satellites each carry a second instrument, called the Global Navigation Satellite System – Radio Occultation (GNSS-RO), which measures atmospheric properties, such as humidity, pressure, and temperature.

Among the measurements Sentinel-6 is gathering, Byrne is most anticipating the ocean height data, which she plans to begin incorporating into the current Satellite Ocean Heat Content Suite algorithm by the end of the year.

“In terms of data quality, the Sentinel-6 missions are unparalleled,” Byrne said.

Together, the missions are also extending a precise dataset deep into its fourth decade. This record of sea level observations traces back to the TOPEX/Poseidon mission, which launched in 1992, and continues through to the present day with Sentinel-6 Michael Freilich. Sentinel-6B will take over for its predecessor as the reference satellite for global sea level measurements later this year.

“The key is consistency, measuring the same way, every time,” said Severine Fournier, Sentinel-6B deputy project scientist, JPL. “That’s what lets us predict hurricanes, and, in turn, protect coastal communities and infrastructure.”

More about Sentinel-6B

Sentinel-6 Michael Freilich, named after a former director of NASA’s Earth Science Division, is one of two satellites that compose the Copernicus Sentinel-6/Jason-CS mission.

Sentinel-6/Jason-CS, a part of the European Union’s Earth observation program called Copernicus, was jointly developed by ESA (European Space Agency), EUMETSAT (European Organisation for the Exploitation of Meteorological Satellites), NASA, and NOAA, with funding support from the European Commission and technical support on performance from the French space agency CNES (Centre National d’Études Spatiales). Spacecraft monitoring and control, as well as the processing of all the altimeter science data, is carried out by EUMETSAT on behalf of the European Union’s Copernicus Programme, with the support of all partner agencies.

NASA JPL, a division of Caltech in Pasadena, contributed three science instruments for each Sentinel-6 satellite: the Advanced Microwave Radiometer, the GNSS-RO, and the Laser Retroreflector Array. NASA also contributed launch services, ground systems supporting operation of the agency’s science instruments, the science data processors for two of these instruments, and support for the United States members of the international Ocean Surface Topography Science Team.

For more about Sentinel-6B, visit:

https://science.nasa.gov/mission/sentinel-6B

-end-

Media Contacts

Andrew Good / Andrew Wang
Jet Propulsion Laboratory, Pasadena, Calif.
818-393-2433 / 626-379-6874
andrew.c.good@jpl.nasa.gov / andrew.wang@jpl.nasa.gov

2026-060

Tropical Storm Arthur

19 June 2026 at 05:00
Natural color
brightness temperature
Tropical Storm Arthur’s white storm clouds cover the waters off the U.S. Gulf Coast. Some clouds extend inland over parts of Texas and Louisiana.
NASA Earth Observatory/Michala Garrison
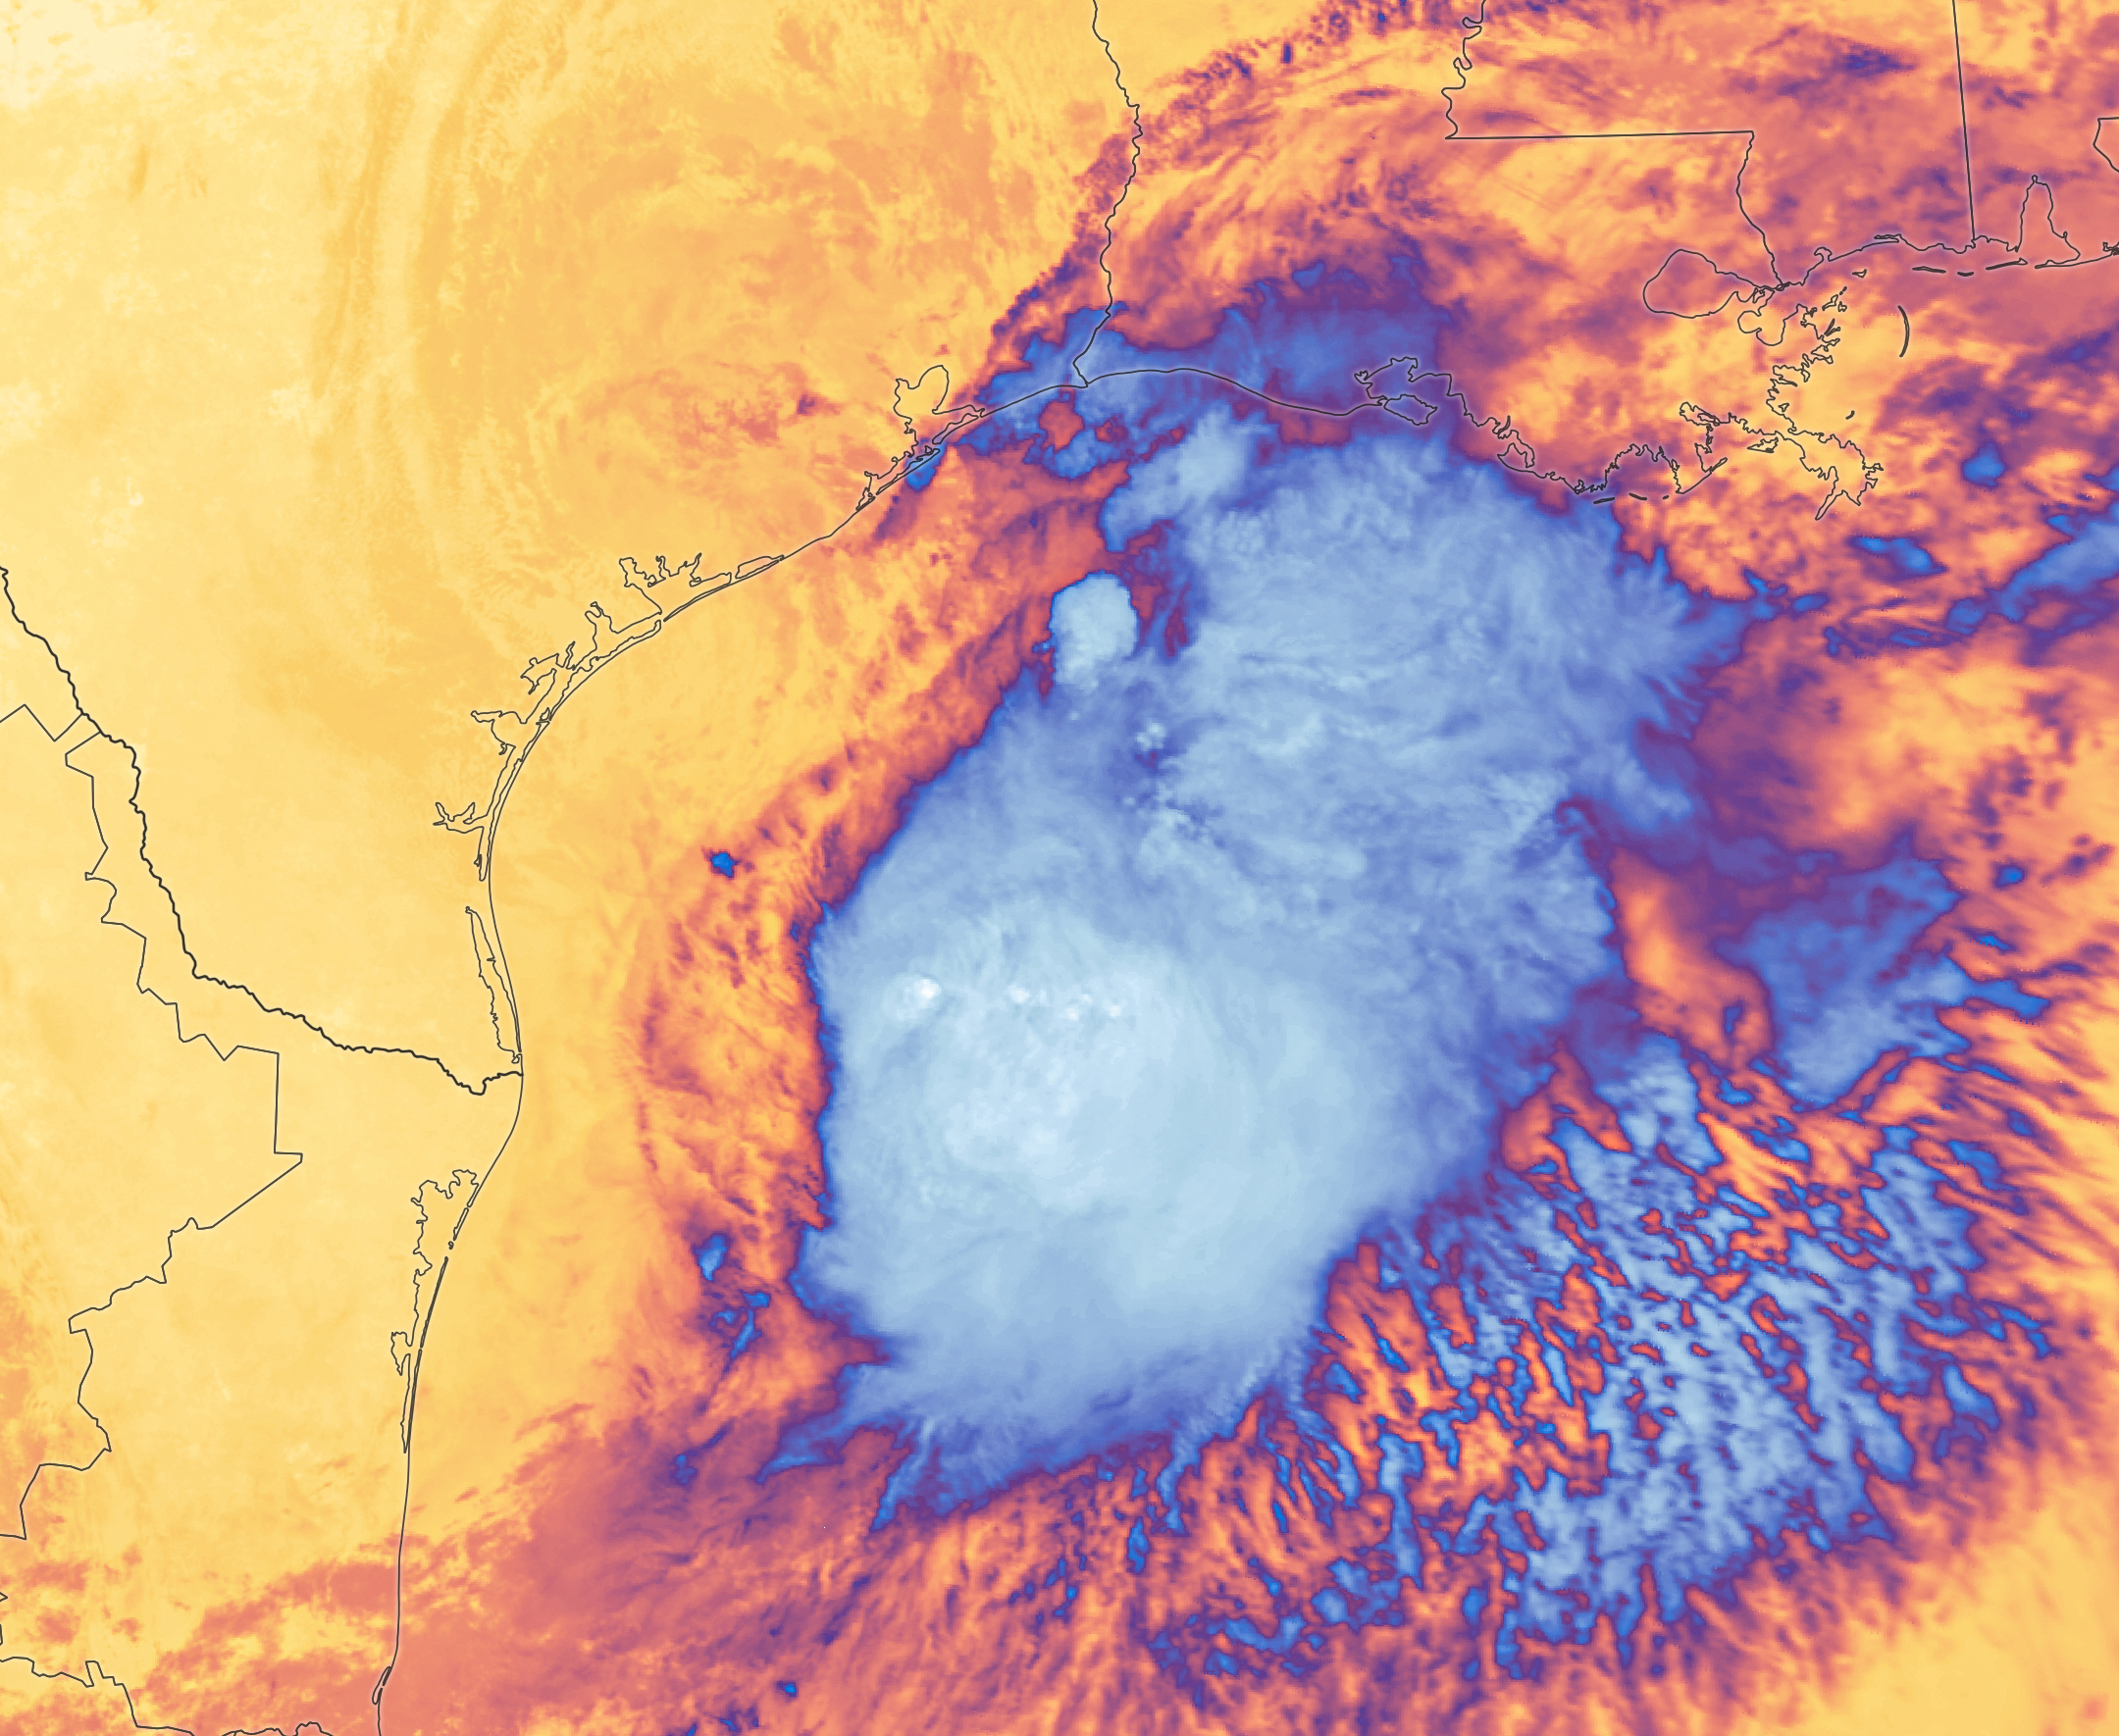
White and purple areas of cloud off the Gulf Coast indicate the cooler areas of cloud tops associated with Tropical Storm Arthur.
NASA Earth Observatory/Michala Garrison
Natural color
brightness temperature
Images from the MODIS (Moderate Resolution Imaging Spectroradiometer) on NASA’s Terra satellite show Tropical Storm Arthur on the morning of June 17, 2026. The left image is natural color; the right shows infrared signals known as brightness temperature. NASA Earth Observatory images by Michala Garrison.

Tropical Storm Arthur, the first named storm of the 2026 Atlantic hurricane season, brought high winds and heavy rain to the U.S. Gulf Coast in mid-June.

NASA’s Terra satellite captured this natural-color image (left) at 10:30 a.m. Central Time (15:30 Universal Time) on June 17. The second image (right) depicts infrared signals known as brightness temperature, which help distinguish cooler cloud tops (white and purple) from the warmer surface below (yellow and orange). Around the time these images were acquired, the system had just recently been designated a tropical storm, according to the National Hurricane Center (NHC).

Though Arthur stayed below hurricane strength, it still delivered strong winds to parts of the Gulf Coast as it tracked northeast. The storm had maximum sustained winds of 40 miles (65 kilometers) per hour around the time these images were captured. Tropical-storm-force winds extended 175 miles (280 kilometers) from the storm’s center, the NHC reported. Measurements at Galveston, Texas, for instance, showed a gust of 48 miles per hour.

The storm also produced heavy rainfall that the National Weather Service warned could lead to life-threatening flash flooding. Estimates from IMERG (the Integrated Multi-Satellite Retrievals for GPM), a product of the GPM (Global Precipitation Measurement) mission, showed high rainfall rates over Gulf waters and extending inland on June 17.

As Arthur weakened and became less organized, it continued to bring abundant moisture to central Gulf Coast states on June 18. The National Weather Service reported rainfall rates of 3 inches (7.6 centimeters) per hour in southeastern Louisiana. Forecasts indicated that storm-total rainfall amounts could exceed 12 inches (30 centimeters) in areas, with some locations seeing totals approaching 20 inches (51 centimeters).

NASA Earth Observatory images by Michala Garrison, using MODIS data from NASA EOSDIS LANCE and GIBS/Worldview. Story by Kathryn Hansen.

Downloads

Tropical Storm Arthur’s white storm clouds cover the waters off the U.S. Gulf Coast. Some clouds extend inland over parts of Texas and Louisiana.

June 17, 2026: Natural color

JPEG (2.94 MB)

White and purple areas of cloud off the Gulf Coast indicate the cooler areas of cloud tops associated with Tropical Storm Arthur.

June 17, 2026: Brightness temperature

JPEG (2.51 MB)

References & Resources

You may also be interested in:

Stay up-to-date with the latest content from NASA as we explore the universe and discover more about our home planet.

Typhoon Jangmi
2 min read

The sprawling storm promised to deliver torrential rain across a wide swath of southern Japan.

Article
Tropical Cyclone Narelle Crosses Australia
3 min read

The powerful storm lashed the northern edge of the continent with damaging winds and drenching rain as it made landfall…

Article
Super Typhoon Sinlaku
3 min read

The violent storm aimed at the U.S. Northern Mariana Islands and Guam in mid-April 2026.

Article

The post Tropical Storm Arthur appeared first on NASA Science.

Inequality Amplifies Climate Disaster Risks Globally

17 June 2026 at 11:40

As the frequency and intensity of climate-related disasters escalate on a global scale, a groundbreaking study sheds new light on a critical and often overlooked dimension of risk: the profound impact of inequality in human development. In research published in Nature Communications, an international team of scientists led by Teber, K., Sippel, S., and Krause, M. reveals that disparities in human development significantly amplify the vulnerability of populations to climate-induced hazards, complicating disaster preparedness and response efforts worldwide.

While the physical manifestations of climate change—rising temperatures, extreme weather events, and sea-level rise—have been extensively documented, the interplay between socioeconomic factors and disaster risk has not been fully elucidated until now. This study meticulously integrates human development metrics with environmental exposure data to quantify how inequalities exacerbate the consequences of climate disasters. By doing so, it provides new insights into risk assessment models that have traditionally prioritized hazard exposure over social vulnerability.

Central to the researchers’ approach is the utilization of the Human Development Index (HDI), which incorporates income, education, and health dimensions, to evaluate disparities both within and across countries. The team employed advanced geospatial analyses to map the confluence of low human development and high climate hazard exposure, uncovering hotspots where disaster risk is magnified by social inequities. These findings underscore that vulnerability extends beyond mere exposure to danger, deeply rooted in systemic inequalities that limit adaptive capacities.

The study reveals a stark pattern: regions with lower human development indices experience disproportionately higher disaster impacts, even when faced with similar climatic hazards compared to more developed areas. This disparity is attributed to factors such as inadequate infrastructure, limited access to healthcare, poor education, and economic constraints that together impair communities’ ability to prepare for, respond to, and recover from disasters.

Technically, the authors introduced novel risk amplification indices that integrate HDI components with hazard intensity and frequency data. This composite metric quantifies how social factors amplify baseline risk, offering a more nuanced predictive framework that can inform targeted interventions. Their methodology leverages machine learning algorithms to analyze large-scale data sets, including remote sensing inputs, socioeconomic surveys, and historical disaster records.

Perhaps most strikingly, the analysis highlights that even incremental improvements in human development metrics can substantially mitigate disaster risks. For example, enhancements in education and healthcare access foster resilience by equipping individuals and communities with knowledge, resources, and capacities essential for effective disaster management. Conversely, deep inequalities create feedback loops that not only increase immediate disaster impacts but also prolong recovery processes, entrenching vulnerability across generations.

The implications of this research are far-reaching for policymakers, disaster risk managers, and international development agencies. It challenges the prevailing paradigm that treats climate risk primarily as a function of environmental exposure, advocating instead for integrated strategies that explicitly address human development inequalities. This approach aligns with the principles of sustainable development and climate justice, calling for equitable investments in social infrastructure alongside climate adaptation measures.

Moreover, the study engages with the broader discourse on resilience by illuminating how socio-economic determinants influence adaptive capacity. It resonates with existing frameworks such as the Sendai Framework for Disaster Risk Reduction, which emphasize reducing underlying risk drivers. By providing empirical evidence linking human development disparities directly to heightened disaster risk, it strengthens the case for multidimensional risk reduction policies.

The authors also caution against simplistic or reactive disaster management approaches that neglect the complex socio-economic landscape. Investments solely focused on physical infrastructure or early warning systems, while vital, are insufficient if communities remain socially and economically fragile. Instead, a holistic paradigm embracing human development as a core component of disaster risk reduction can lead to more sustainable and equitable outcomes.

From a technical perspective, the research outlines future avenues for refining integrated risk models by incorporating real-time socioeconomic data and enhancing the granularity of development indices. Such dynamism is crucial in capturing evolving vulnerabilities amid rapid urbanization, demographic shifts, and climate variability. This adaptability can improve predictive accuracy, helping anticipate disaster hotspots and allocate resources more efficiently.

The study’s findings also invite critical reflection on the intersections of climate change, inequality, and governance. They suggest that mitigating climate disaster risks requires not only technological innovations but also profound socio-political transformations that address systemic inequities. Strengthening governance frameworks that promote inclusive participation and equitable resource distribution is key to achieving the dual goals of human development and climate resilience.

Importantly, this research situates human development inequality not as a peripheral issue but as a central amplifier of disaster risk with cascading social, economic, and environmental consequences. By integrating interdisciplinary methods spanning environmental science, social research, and data analytics, it exemplifies the complexity of the climate risk challenge and the necessity of multifaceted solutions.

This study arrives at a crucial moment when global climate policies are increasingly recognizing the imperative to embed equity considerations within adaptation and mitigation frameworks. It provides robust data-driven evidence that such equity is not merely a moral imperative but a practical necessity for reducing disaster risk and safeguarding vulnerable populations worldwide.

In sum, the work by Teber and colleagues marks a pivotal advancement in climate risk science, offering a transformative lens through which to view the vulnerabilities that shape disaster outcomes. It redefines risk not as an isolated environmental phenomenon but as a socially embedded condition influenced profoundly by human development disparities. Emerging from this new understanding is a clarion call to reimagine disaster risk reduction through the prism of equity, justice, and sustainable development.

As climate change continues to intensify, the urgency of addressing human development inequalities in disaster risk assessment and management could determine the resilience of entire communities and nations. This integrative, data-informed framework has the potential to guide future policies aimed at building a safer, more equitable world capable of withstanding the increasing challenges posed by a changing climate.

Subject of Research:
Climate-related disaster risk amplification due to inequality in human development

Article Title:
Inequality in human development amplifies climate-related disaster risk

Article References:
Teber, K., Sippel, S., Krause, M. et al. Inequality in human development amplifies climate-related disaster risk. Nat Commun 17, 5067 (2026). https://doi.org/10.1038/s41467-026-73873-9

Image Credits:
AI Generated

DOI:
https://doi.org/10.1038/s41467-026-73873-9

❌