❌

Normal view

NASA Watches Earth’s Weight, Finds Center of Mass

16 September 2026 at 17:08

5 min read

Preparations for Next Moonwalk Simulations Underway (and Underwater)
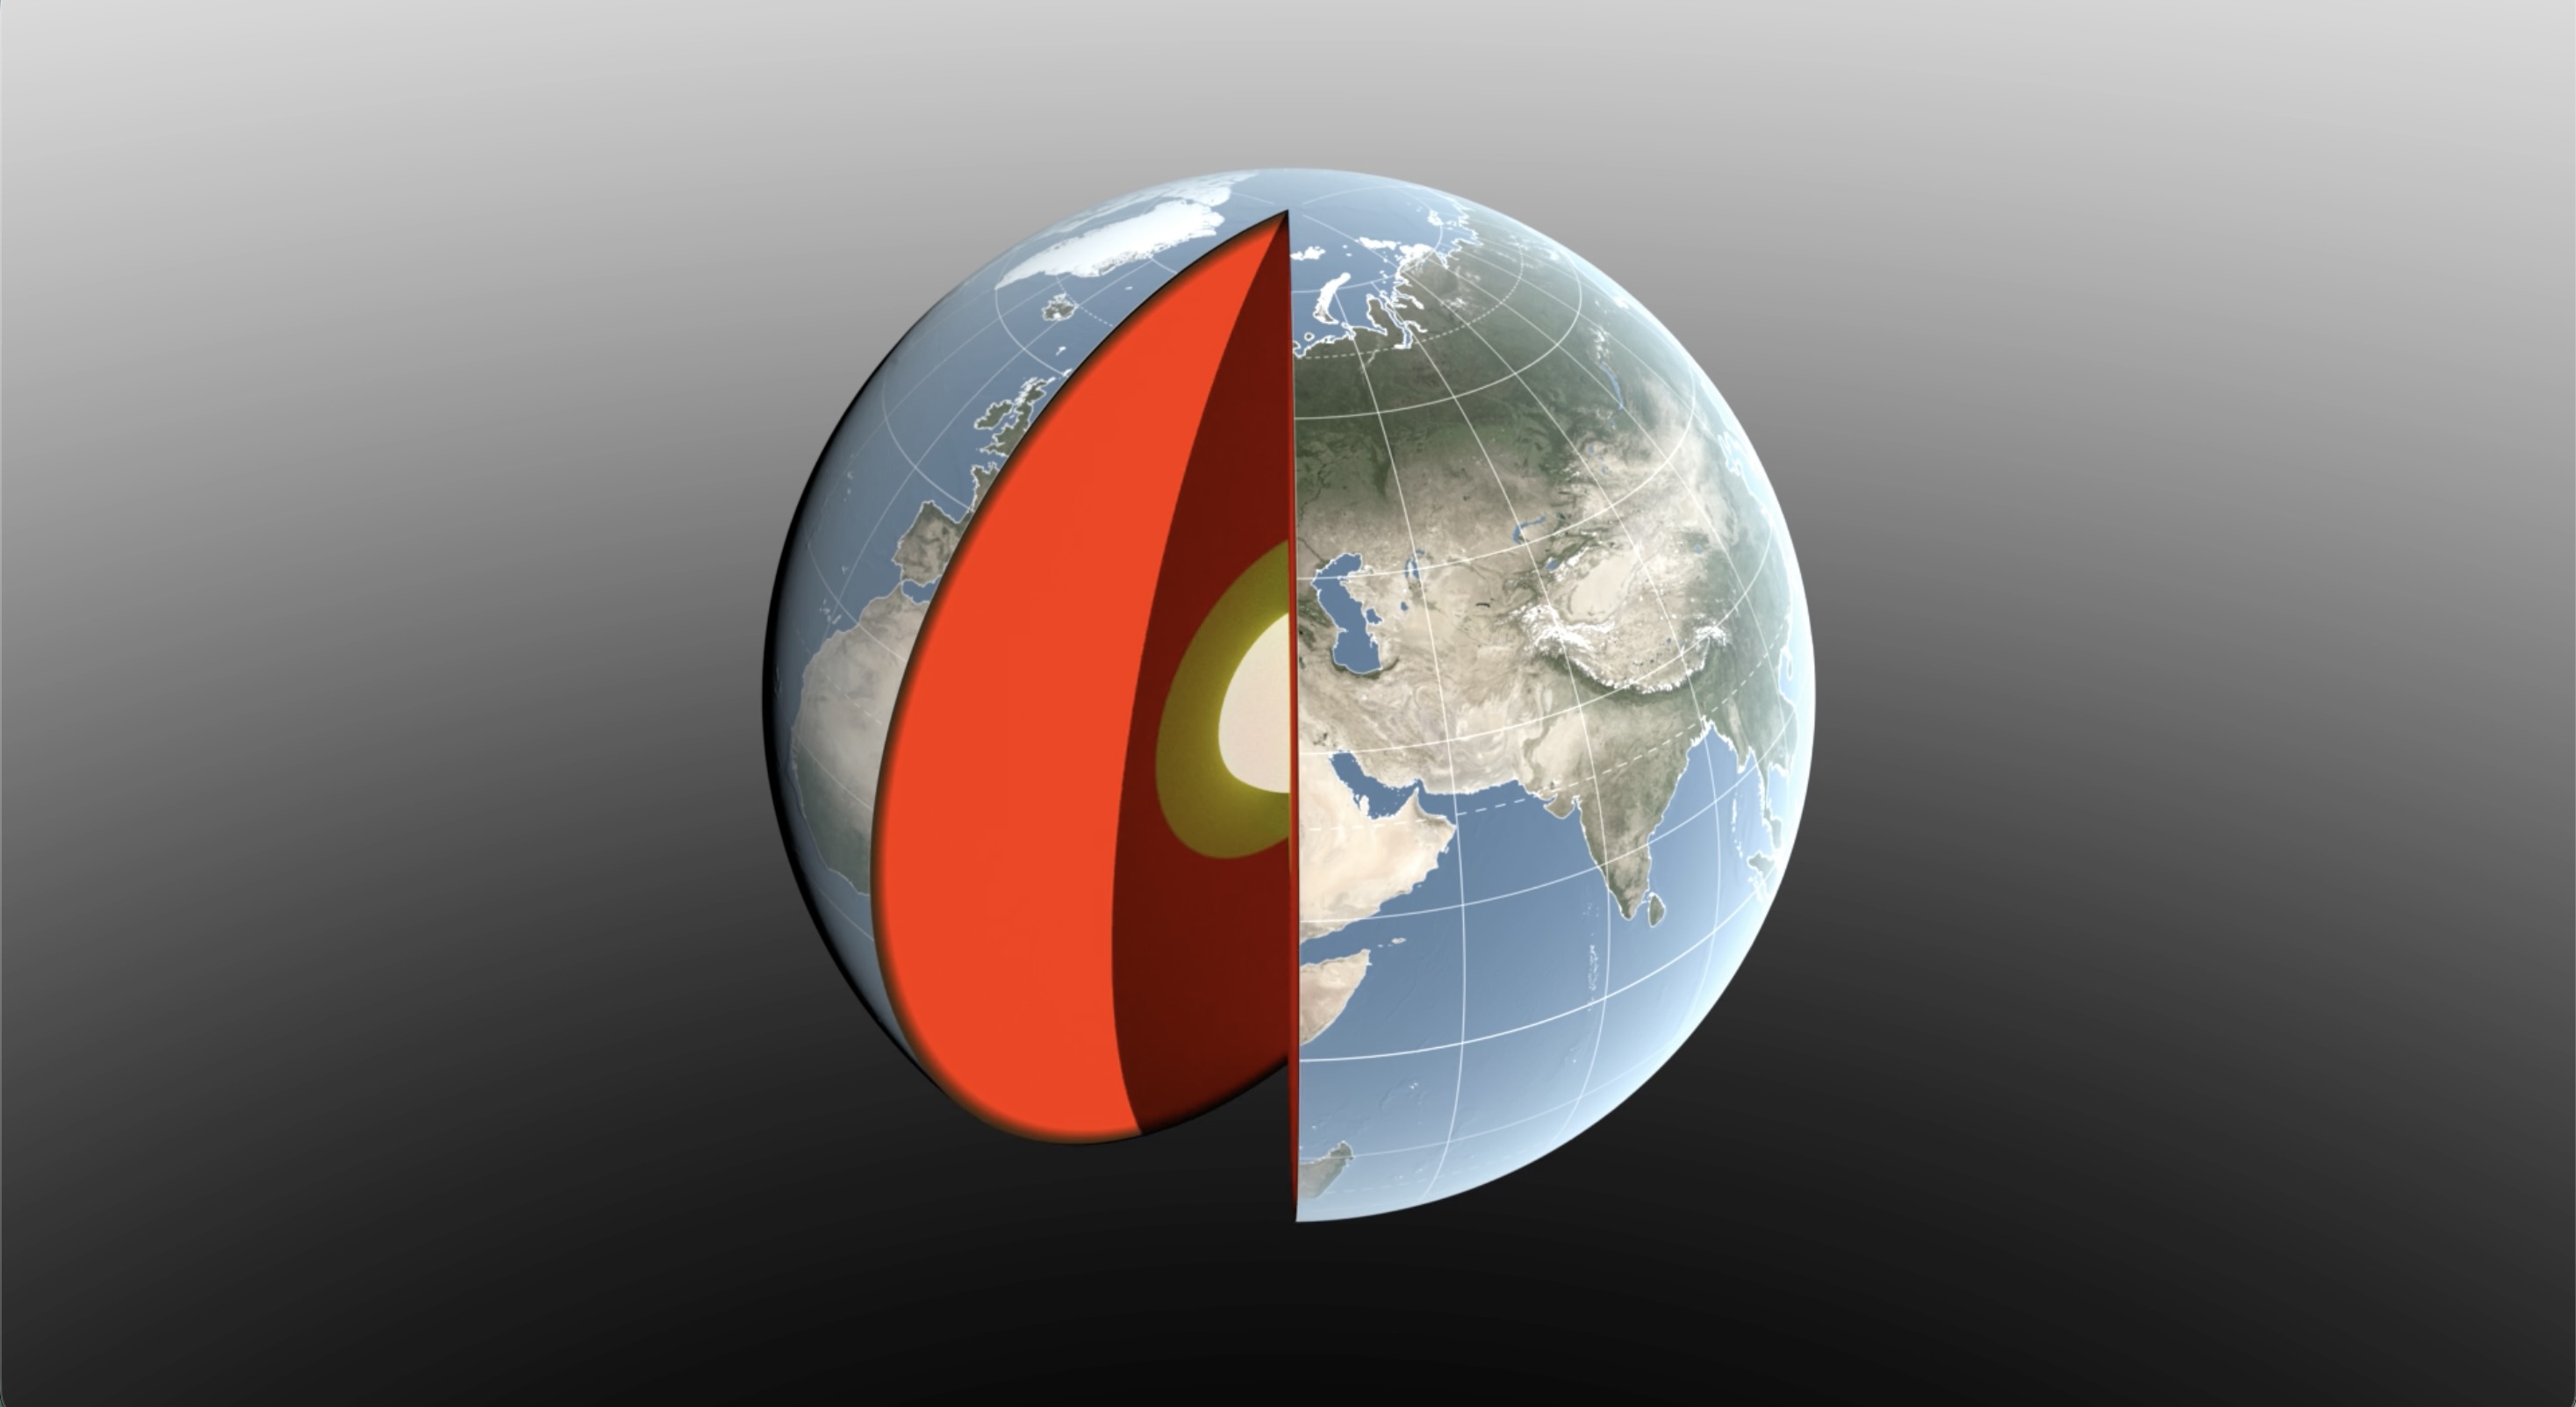
A 3D digital illustration of Earth with a slice cut away to reveal its internal layers. The exterior shows a realistic view of the globe, focusing on Europe, Asia, and Africa with visible geographic features and grid lines.
Water sloshing between the land and oceans shifts Earth’s center of mass relative to its geometric center. NASA scientists have developed a new technique using ultraprecise satellite tracking to estimate the displacement to within fractions of inches.
NASA’s Scientific Visualization Studio

Seasonal changes redistribute enough water around Earth to shift the planet’s center of mass back and forth by fractions of an inch relative to its geometric center. NASA scientists are on the case, tracking the oscillations because Earth’s center of mass is a crucial reference point for satellite navigation and elevation measurements.

A team, led by NASA’s Jet Propulsion Laboratory in Southern California, has proposed a way to calculate the seasonal swings with extreme precision. The technique and findings are detailed in a new study published in Geophysical Journal International. The authors paint a vivid picture of springtime thaws, churning oceans, and dense winter air shifting massive surface loads from season to season.

The study isn’t the first attempt to pin down Earth’s center of mass. Scientists over the decades have pioneered several space-based techniques to define and locate it. But it’s a moving goalpost. If Earth were a hard blue marble, its center of mass would simply overlap its geometric center. In reality, the planet is sloshing and sagging under the weight of water, ice, and air. Because of this, Earth’s center of mass continually swivels around its geometric center by as much as several millimeters.

NASA’s Space Geodesy Project currently uses a variety of space- and land-based techniques to track Earth’s center of mass (also called the geocenter) moving up and down and side to side. This animation traces the millimeter-scale motion from 1993 to 2017.
NASA’s Scientific Visualization Studio

How accurate are existing methods to measure the size of the swivel? The last two international estimates, made in 2017 and 2023, differ by 0.27 inches (7 millimeters), about the height of three stacked nickels. The difference is almost as large as the motion itself.

To reduce uncertainty, JPL geoscientist Donald Argus led the development of a new technique based on ultraprecise satellite tracking.

Driven by gravity, satellites naturally orbit Earth’s center of mass, as if bound by invisible tethers. Tiny changes in the distance between satellites and ground stations reflect Earth’s shifting center of mass.

Using satellites to locate Earth’s center of mass is not a new idea. In fact, dense metal satellites, launched in 1976 and 1992, are dedicated exclusively to this purpose. Resembling 900-pound (408-kilogram) disco balls, both Laser Geodynamics Satellites (LAGEOS 1 and 2) are studded with reflective prisms and tracked with laser precision via ground stations globally distributed across more than 20 countries.

However, one limitation of satellite laser ranging is the uneven distribution of ground stations around Earth. The new technique improves accuracy in two ways: It adds GPS tracking into the mix along with orbital data from several satellites in low Earth orbit to provide a diverse array of targets. And it considers how the weight of water and ice deforms Earth’s crust, taking ground stations along for the ride.

The technique was developed by Argus along with researchers from JPL’s satellite orbit determination team, the University of Nevada, University of Montana, and the Helmholtz Centre for Geosciences in Germany.

“We’re now estimating the size of the movement of Earth’s mass center back and forth each year to be about half of what we believed it to be eight years ago,” said Argus. “Our findings suggest that the mass of Earth’s water and air moving between the hemisphere is smaller than previously thought.”

Felix Landerer, one of the study’s coauthors at JPL, noted that “while these movements might appear tiny, our modern world relies on extremely accurate positioning measurements. By unraveling and understanding the mechanisms that change reference systems, we can build better reference systems that ultimately benefit mapping and navigation — from global shipping logistics to precision agriculture.”

What they found

The study authors tracked Earth’s center of mass oscillating seasonally and attributed the cause to three categories: oceans, atmosphere, and continental water (made up of land ice, snow, lake and river water, soil moisture, and groundwater).

They found that snow accumulation in North America and Eurasia reaches a maximum in March and shifts Earth’s center of mass about 3 millimeters toward the North Pole. A month later, in April, rainwater in the Amazon River basin peaks at 2,400 gigatons, swinging Earth’s center of mass 2.2 millimeters toward South America. Monsoon water in southeast Asia attains a maximum of 600 gigatons six months later in November, adding slightly to the annual oscillation.

Between August and October, the oceans swell with meltwater and rain, and Earth’s center of mass shifts toward the South Pacific Ocean. The Pacific Ocean is so large that mass changes there overshadow the loss or gain in other oceans, though seasonal dynamics in the Mediterranean, Red, North, Baltic, and Barents seas all help shift Earth’s center of mass in their own small way.

The researchers used a model developed by the European Centre for Medium-Range Weather Forecasts to estimate how atmospheric changes affect Earth’s center of mass throughout the seasons. They found that cold, dense, winter air helps tip the scales over Arabia, Asia, and northern Africa around Dec. 21 each year, and over South America and South Africa around June 21.

The mass calculations in the study are consistent with observations made by the Gravity Recovery and Climate Experiment Follow-On (GRACE-FO) mission. Launched in 2018, the mission is made up of twin satellites that map monthly fluctuations in Earth’s gravitational pull due primarily to the mass movement of water above and below ground. The two satellites fly in precise formation, and when the lead satellite passes over a dense body, like a swollen river basin, the extra gravitational tug changes the distance between its twin by a small but measurable amount.

The GRACE-FO mission is a joint partnership between NASA and the German Research Centre for Geosciences (GFZ). The next-generation GRACE-Continuity (GRACE-C) mission is targeting a launch in late 2028 to extend the nearly 25-year GRACE-series data record.

-end-

Written by Sally Younger

2026-061

How 2 US, European Satellites Are Studying Hurricanes During El Niño

9 September 2026 at 17:00

5 min read

How 2 US, European Satellites Are Studying Hurricanes During El Niño

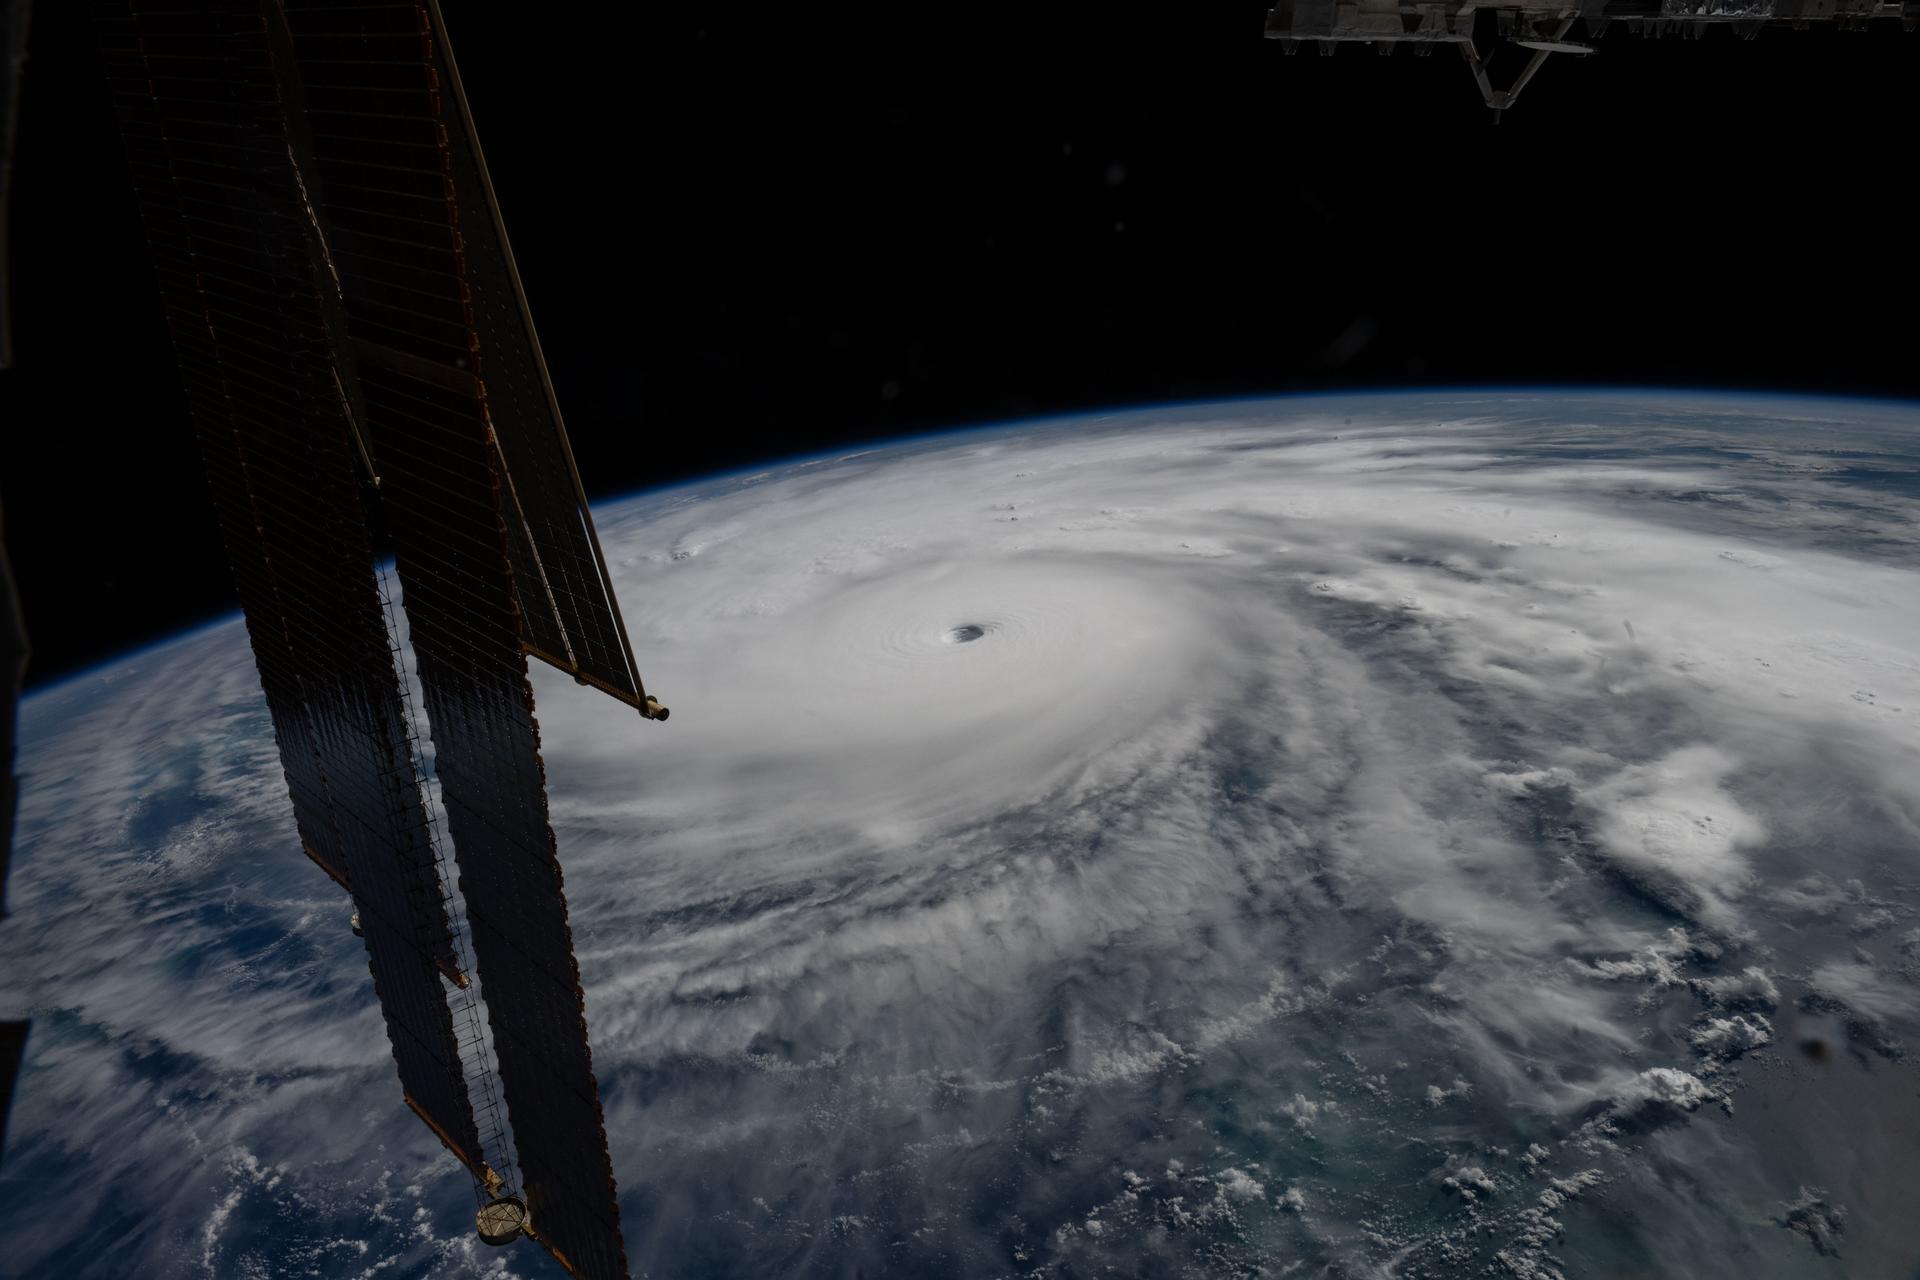
Category 5 Hurricane Melissa, one of the most powerful storms to strike the Caribbean in recent history, is pictured about 50 miles south of Jamaica in this photograph from the International Space Station as it orbited 262 miles above the Yucatan Peninsula.
Hurricane Melissa is seen 50 miles south of Jamaica in this photograph taken from the International Space Station on Oct. 28, 2025.
NASA

Last November, NASA and its European partners launched the Sentinel-6B satellite to improve hurricane forecasts, help protect infrastructure, and benefit commercial industries, including shipping. The satellite now is flying 30 seconds behind its predecessor, Sentinel-6 Michael Freilich. Both satellites are providing precise sea level height measurements during what oceanographers expect to be a historic El Niño, a naturally occurring oceanic phenomenon in which warmer-than-usual Pacific waters shift global weather patterns.

The two satellites make up the Copernicus Sentinel-6/Jason-CS (Continuity of Service) mission, the latest in a series of ocean-observing radar altimetry missions that have been monitoring Earth’s changing seas continuously since the early 1990s.

The data each satellite is collecting will not only allow scientists to better understand this year’s El Niño but will also help them create more accurate hurricane predictions.

“This El Niño was a late-bloomer,” said Josh Willis, Sentinel-6B’s project scientist at NASA’s Jet Propulsion Laboratory in Southern California. “It didn’t kick off until the middle of the year and is just now reaching a strength similar to what we’ve seen in the satellite record during significant El Niños in 1997 and 2015. We expect it to be big, and it’s already having big impacts.”

El Niños generally scramble weather patterns tied to rainfall and storms, including hurricanes. They also redistribute heat in the ocean, which affects sea level. Normally, Earth’s warmest ocean waters sit along the equator in the western Pacific. During El Niño, weakened winds, which usually blow westward along the equator, result in heat spreading east toward South America. The change in ocean heat shifts hurricane activity from the Atlantic to the Pacific Ocean.

Predicting hurricane strength

On July 15, Sentinel-6B began delivering low-latency data to scientists that could be used for weather predictions. That data will take some time to work its way into the research models on which meteorologists and climate scientists rely, but when it does, those improved models could save lives.

Data from Sentinel-6 satellite missions feeds into hurricane tracking algorithms used by federal and state agencies. Those predictions can activate disaster response efforts, mobilizing resources ranging from sandbag placement to National Guard activation. They also can lead to evacuation orders that require quick but well-informed decisions about logistics at a local level. More severe events may require engaging larger organizations, such as the Federal Emergency Management Agency.

A tropical storm can take a week or more to become a hurricane and make its way to a coastline, but a hurricane can rapidly intensify in the 48 hours prior to landfall, leaving planners little time to prepare.

“Hurricanes have been known to speed up quickly at the last moment, so the window in which to decide what to do is short,” said Deirdre Byrne, an oceanographer and altimetry expert with the National Oceanic and Atmospheric Administration (NOAA). “The goal is to forecast how much and how rapidly intensification will happen so that officials can make the right calls.”

Byrne oversees one of the country’s most crucial hurricane forecasting algorithms, NOAA’s Satellite Ocean Heat Content Suite, which has been operating since 2012.

Each Sentinel-6 satellite measures ocean height, as well as the size of waves and marine wind speed, using a radar altimeter, which bounces thousands of radar pulses a second off the crests and troughs of waves. Ocean height varies from place to place and provides insight into the ocean’s heat content, since warm water expands. That, in turn, helps forecast how fast hurricanes will grow.

The satellites each carry a second instrument, called the Global Navigation Satellite System – Radio Occultation (GNSS-RO), which measures atmospheric properties, such as humidity, pressure, and temperature.

Among the measurements Sentinel-6 is gathering, Byrne is most anticipating the ocean height data, which she plans to begin incorporating into the current Satellite Ocean Heat Content Suite algorithm by the end of the year.

“In terms of data quality, the Sentinel-6 missions are unparalleled,” Byrne said.

Together, the missions are also extending a precise dataset deep into its fourth decade. This record of sea level observations traces back to the TOPEX/Poseidon mission, which launched in 1992, and continues through to the present day with Sentinel-6 Michael Freilich. Sentinel-6B will take over for its predecessor as the reference satellite for global sea level measurements later this year.

“The key is consistency, measuring the same way, every time,” said Severine Fournier, Sentinel-6B deputy project scientist, JPL. “That’s what lets us predict hurricanes, and, in turn, protect coastal communities and infrastructure.”

More about Sentinel-6B

Sentinel-6 Michael Freilich, named after a former director of NASA’s Earth Science Division, is one of two satellites that compose the Copernicus Sentinel-6/Jason-CS mission.

Sentinel-6/Jason-CS, a part of the European Union’s Earth observation program called Copernicus, was jointly developed by ESA (European Space Agency), EUMETSAT (European Organisation for the Exploitation of Meteorological Satellites), NASA, and NOAA, with funding support from the European Commission and technical support on performance from the French space agency CNES (Centre National d’Études Spatiales). Spacecraft monitoring and control, as well as the processing of all the altimeter science data, is carried out by EUMETSAT on behalf of the European Union’s Copernicus Programme, with the support of all partner agencies.

NASA JPL, a division of Caltech in Pasadena, contributed three science instruments for each Sentinel-6 satellite: the Advanced Microwave Radiometer, the GNSS-RO, and the Laser Retroreflector Array. NASA also contributed launch services, ground systems supporting operation of the agency’s science instruments, the science data processors for two of these instruments, and support for the United States members of the international Ocean Surface Topography Science Team.

For more about Sentinel-6B, visit:

https://science.nasa.gov/mission/sentinel-6B

-end-

Media Contacts

Andrew Good / Andrew Wang
Jet Propulsion Laboratory, Pasadena, Calif.
818-393-2433 / 626-379-6874
andrew.c.good@jpl.nasa.gov / andrew.wang@jpl.nasa.gov

2026-060

The post How 2 US, European Satellites Are Studying Hurricanes During El Niño appeared first on NASA Science.

How 2 US, European Satellites Are Studying Hurricanes During El Niño

9 September 2026 at 17:00

5 min read

Preparations for Next Moonwalk Simulations Underway (and Underwater)

Category 5 Hurricane Melissa, one of the most powerful storms to strike the Caribbean in recent history, is pictured about 50 miles south of Jamaica in this photograph from the International Space Station as it orbited 262 miles above the Yucatan Peninsula.
Hurricane Melissa is seen 50 miles south of Jamaica in this photograph taken from the International Space Station on Oct. 28, 2025.
NASA

Last November, NASA and its European partners launched the Sentinel-6B satellite to improve hurricane forecasts, help protect infrastructure, and benefit commercial industries, including shipping. The satellite now is flying 30 seconds behind its predecessor, Sentinel-6 Michael Freilich. Both satellites are providing precise sea level height measurements during what oceanographers expect to be a historic El Niño, a naturally occurring oceanic phenomenon in which warmer-than-usual Pacific waters shift global weather patterns.

The two satellites make up the Copernicus Sentinel-6/Jason-CS (Continuity of Service) mission, the latest in a series of ocean-observing radar altimetry missions that have been monitoring Earth’s changing seas continuously since the early 1990s.

The data each satellite is collecting will not only allow scientists to better understand this year’s El Niño but will also help them create more accurate hurricane predictions.

“This El Niño was a late-bloomer,” said Josh Willis, Sentinel-6B’s project scientist at NASA’s Jet Propulsion Laboratory in Southern California. “It didn’t kick off until the middle of the year and is just now reaching a strength similar to what we’ve seen in the satellite record during significant El Niños in 1997 and 2015. We expect it to be big, and it’s already having big impacts.”

El Niños generally scramble weather patterns tied to rainfall and storms, including hurricanes. They also redistribute heat in the ocean, which affects sea level. Normally, Earth’s warmest ocean waters sit along the equator in the western Pacific. During El Niño, weakened winds, which usually blow westward along the equator, result in heat spreading east toward South America. The change in ocean heat shifts hurricane activity from the Atlantic to the Pacific Ocean.

Predicting hurricane strength

On July 15, Sentinel-6B began delivering low-latency data to scientists that could be used for weather predictions. That data will take some time to work its way into the research models on which meteorologists and climate scientists rely, but when it does, those improved models could save lives.

Data from Sentinel-6 satellite missions feeds into hurricane tracking algorithms used by federal and state agencies. Those predictions can activate disaster response efforts, mobilizing resources ranging from sandbag placement to National Guard activation. They also can lead to evacuation orders that require quick but well-informed decisions about logistics at a local level. More severe events may require engaging larger organizations, such as the Federal Emergency Management Agency.

A tropical storm can take a week or more to become a hurricane and make its way to a coastline, but a hurricane can rapidly intensify in the 48 hours prior to landfall, leaving planners little time to prepare.

“Hurricanes have been known to speed up quickly at the last moment, so the window in which to decide what to do is short,” said Deirdre Byrne, an oceanographer and altimetry expert with the National Oceanic and Atmospheric Administration (NOAA). “The goal is to forecast how much and how rapidly intensification will happen so that officials can make the right calls.”

Byrne oversees one of the country’s most crucial hurricane forecasting algorithms, NOAA’s Satellite Ocean Heat Content Suite, which has been operating since 2012.

Each Sentinel-6 satellite measures ocean height, as well as the size of waves and marine wind speed, using a radar altimeter, which bounces thousands of radar pulses a second off the crests and troughs of waves. Ocean height varies from place to place and provides insight into the ocean’s heat content, since warm water expands. That, in turn, helps forecast how fast hurricanes will grow.

The satellites each carry a second instrument, called the Global Navigation Satellite System – Radio Occultation (GNSS-RO), which measures atmospheric properties, such as humidity, pressure, and temperature.

Among the measurements Sentinel-6 is gathering, Byrne is most anticipating the ocean height data, which she plans to begin incorporating into the current Satellite Ocean Heat Content Suite algorithm by the end of the year.

“In terms of data quality, the Sentinel-6 missions are unparalleled,” Byrne said.

Together, the missions are also extending a precise dataset deep into its fourth decade. This record of sea level observations traces back to the TOPEX/Poseidon mission, which launched in 1992, and continues through to the present day with Sentinel-6 Michael Freilich. Sentinel-6B will take over for its predecessor as the reference satellite for global sea level measurements later this year.

“The key is consistency, measuring the same way, every time,” said Severine Fournier, Sentinel-6B deputy project scientist, JPL. “That’s what lets us predict hurricanes, and, in turn, protect coastal communities and infrastructure.”

More about Sentinel-6B

Sentinel-6 Michael Freilich, named after a former director of NASA’s Earth Science Division, is one of two satellites that compose the Copernicus Sentinel-6/Jason-CS mission.

Sentinel-6/Jason-CS, a part of the European Union’s Earth observation program called Copernicus, was jointly developed by ESA (European Space Agency), EUMETSAT (European Organisation for the Exploitation of Meteorological Satellites), NASA, and NOAA, with funding support from the European Commission and technical support on performance from the French space agency CNES (Centre National d’Études Spatiales). Spacecraft monitoring and control, as well as the processing of all the altimeter science data, is carried out by EUMETSAT on behalf of the European Union’s Copernicus Programme, with the support of all partner agencies.

NASA JPL, a division of Caltech in Pasadena, contributed three science instruments for each Sentinel-6 satellite: the Advanced Microwave Radiometer, the GNSS-RO, and the Laser Retroreflector Array. NASA also contributed launch services, ground systems supporting operation of the agency’s science instruments, the science data processors for two of these instruments, and support for the United States members of the international Ocean Surface Topography Science Team.

For more about Sentinel-6B, visit:

https://science.nasa.gov/mission/sentinel-6B

-end-

Media Contacts

Andrew Good / Andrew Wang
Jet Propulsion Laboratory, Pasadena, Calif.
818-393-2433 / 626-379-6874
andrew.c.good@jpl.nasa.gov / andrew.wang@jpl.nasa.gov

2026-060

Low Water at San Carlos Reservoir

17 June 2026 at 05:01
June 7, 2023
May 22, 2026
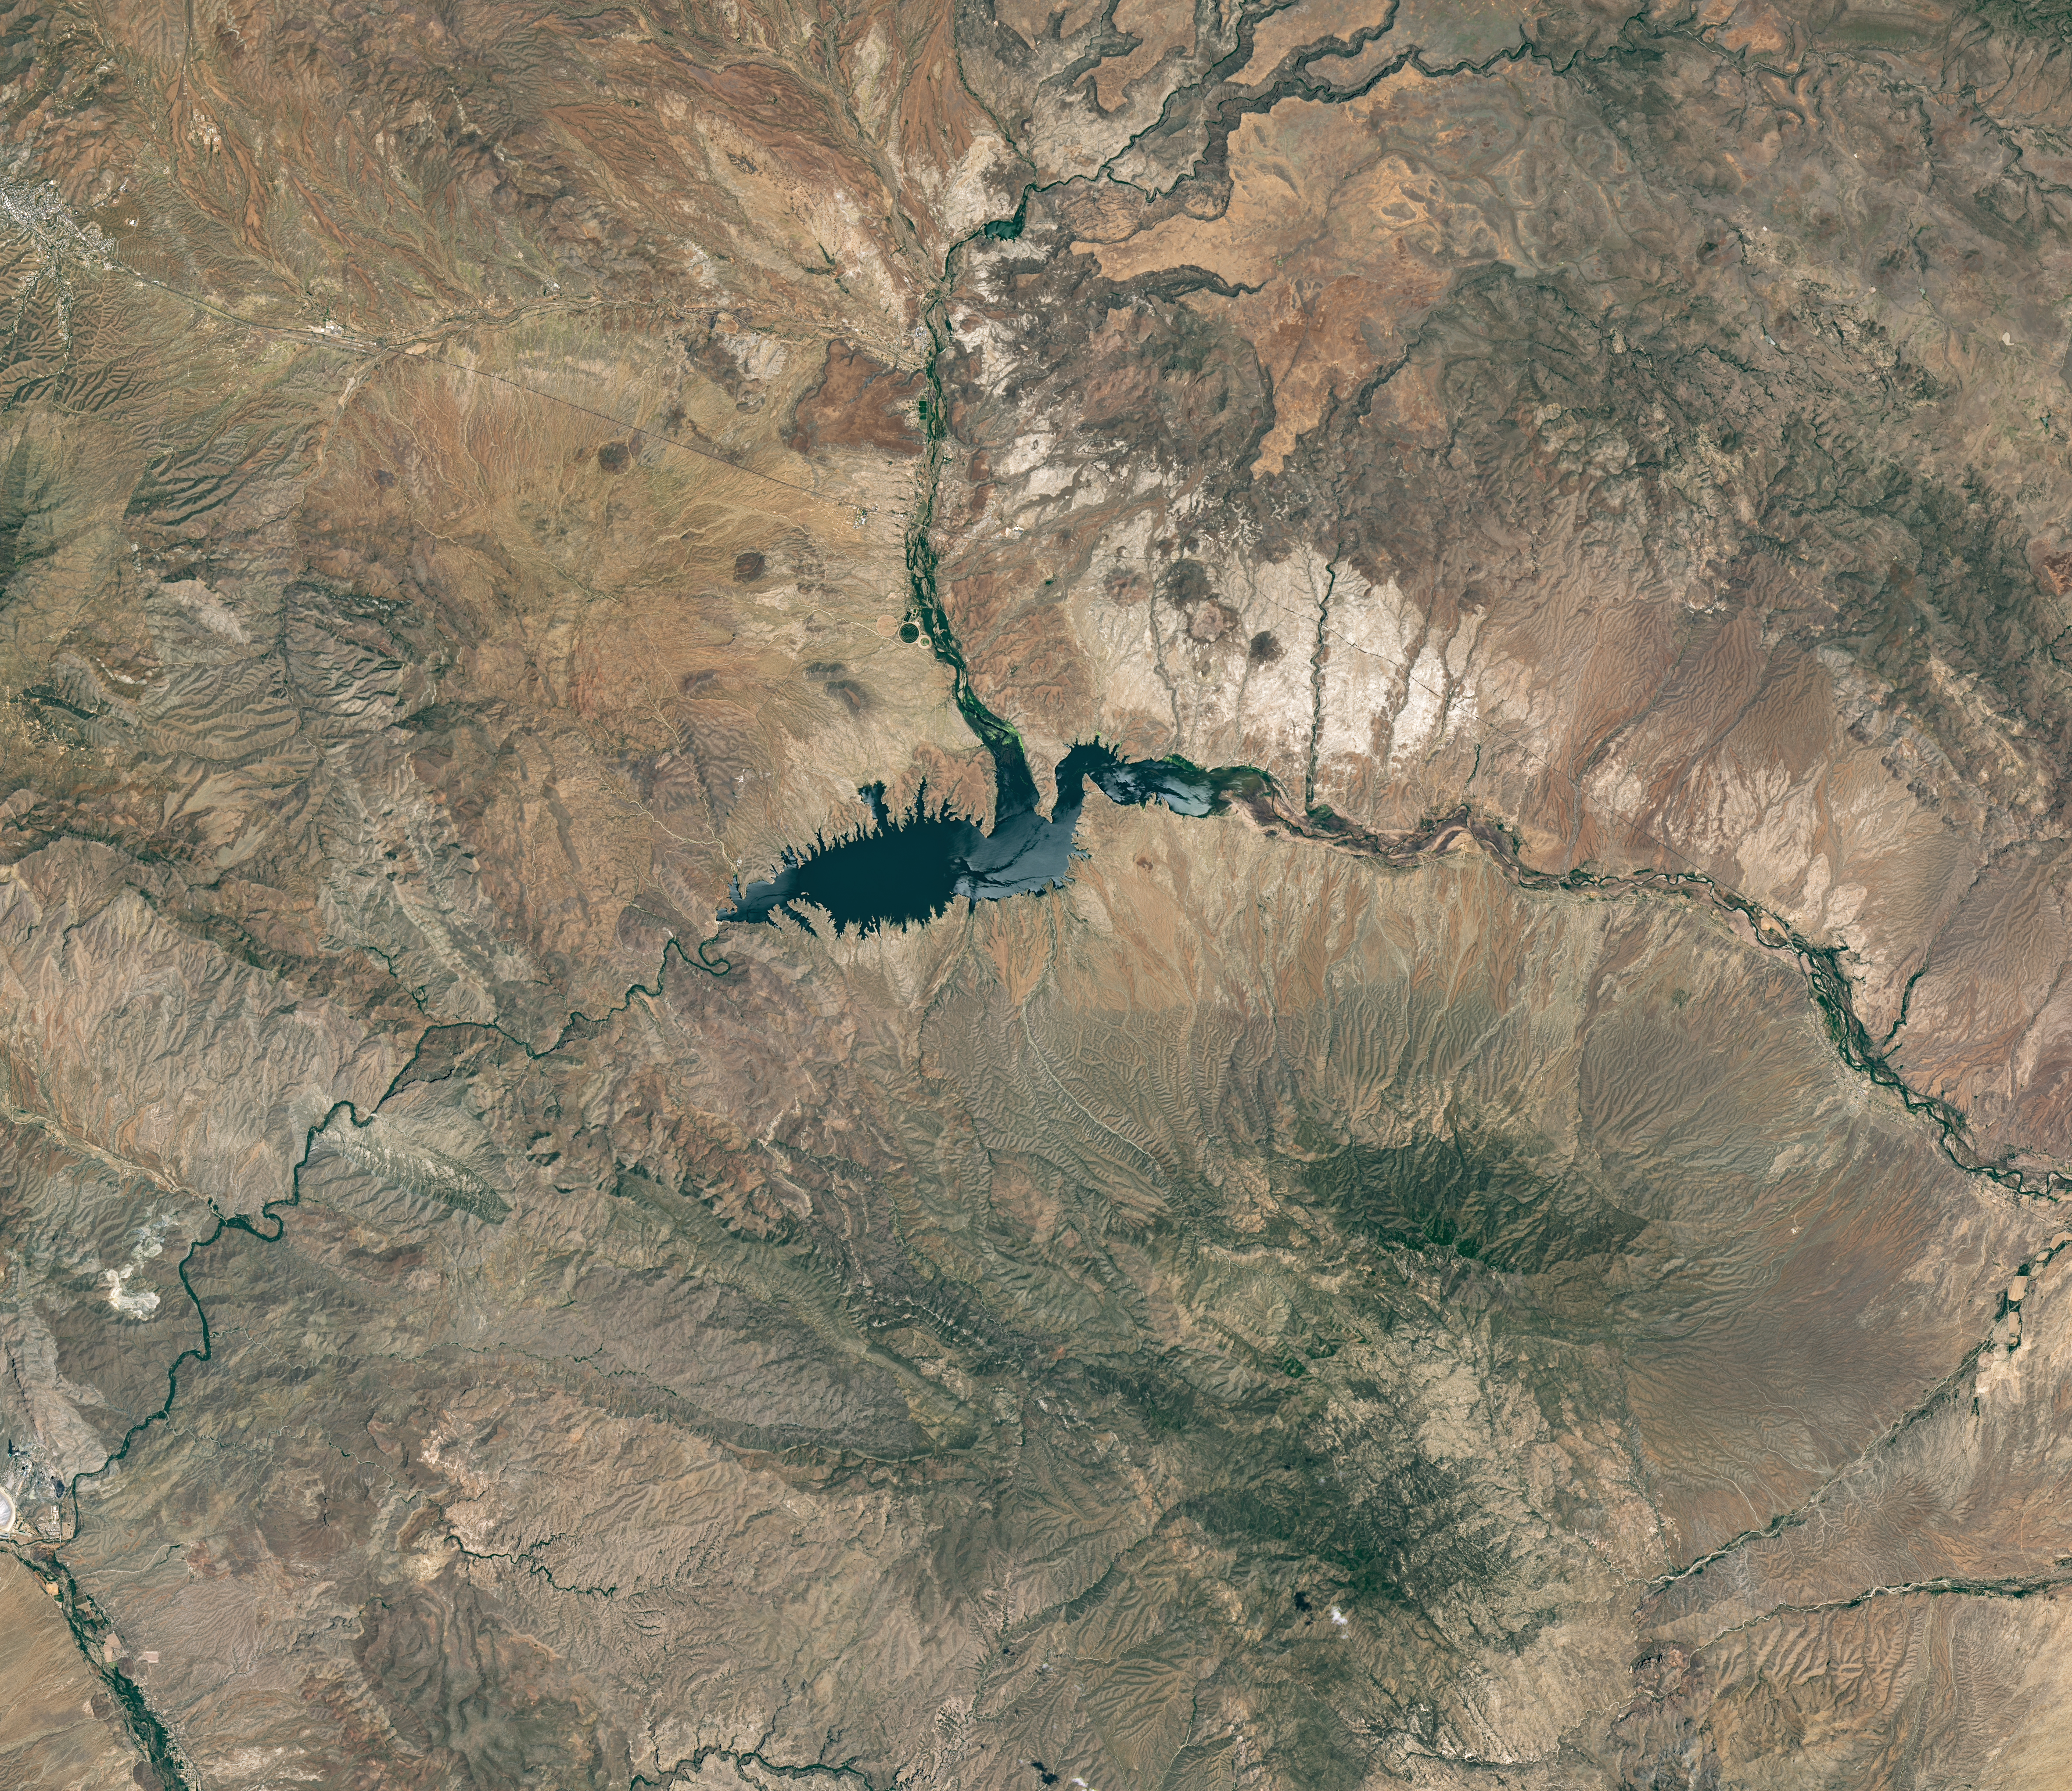
The reservoir appears lake-like and expansive in an image acquired in June 2023.
NASA Earth Observatory/Michala Garrison
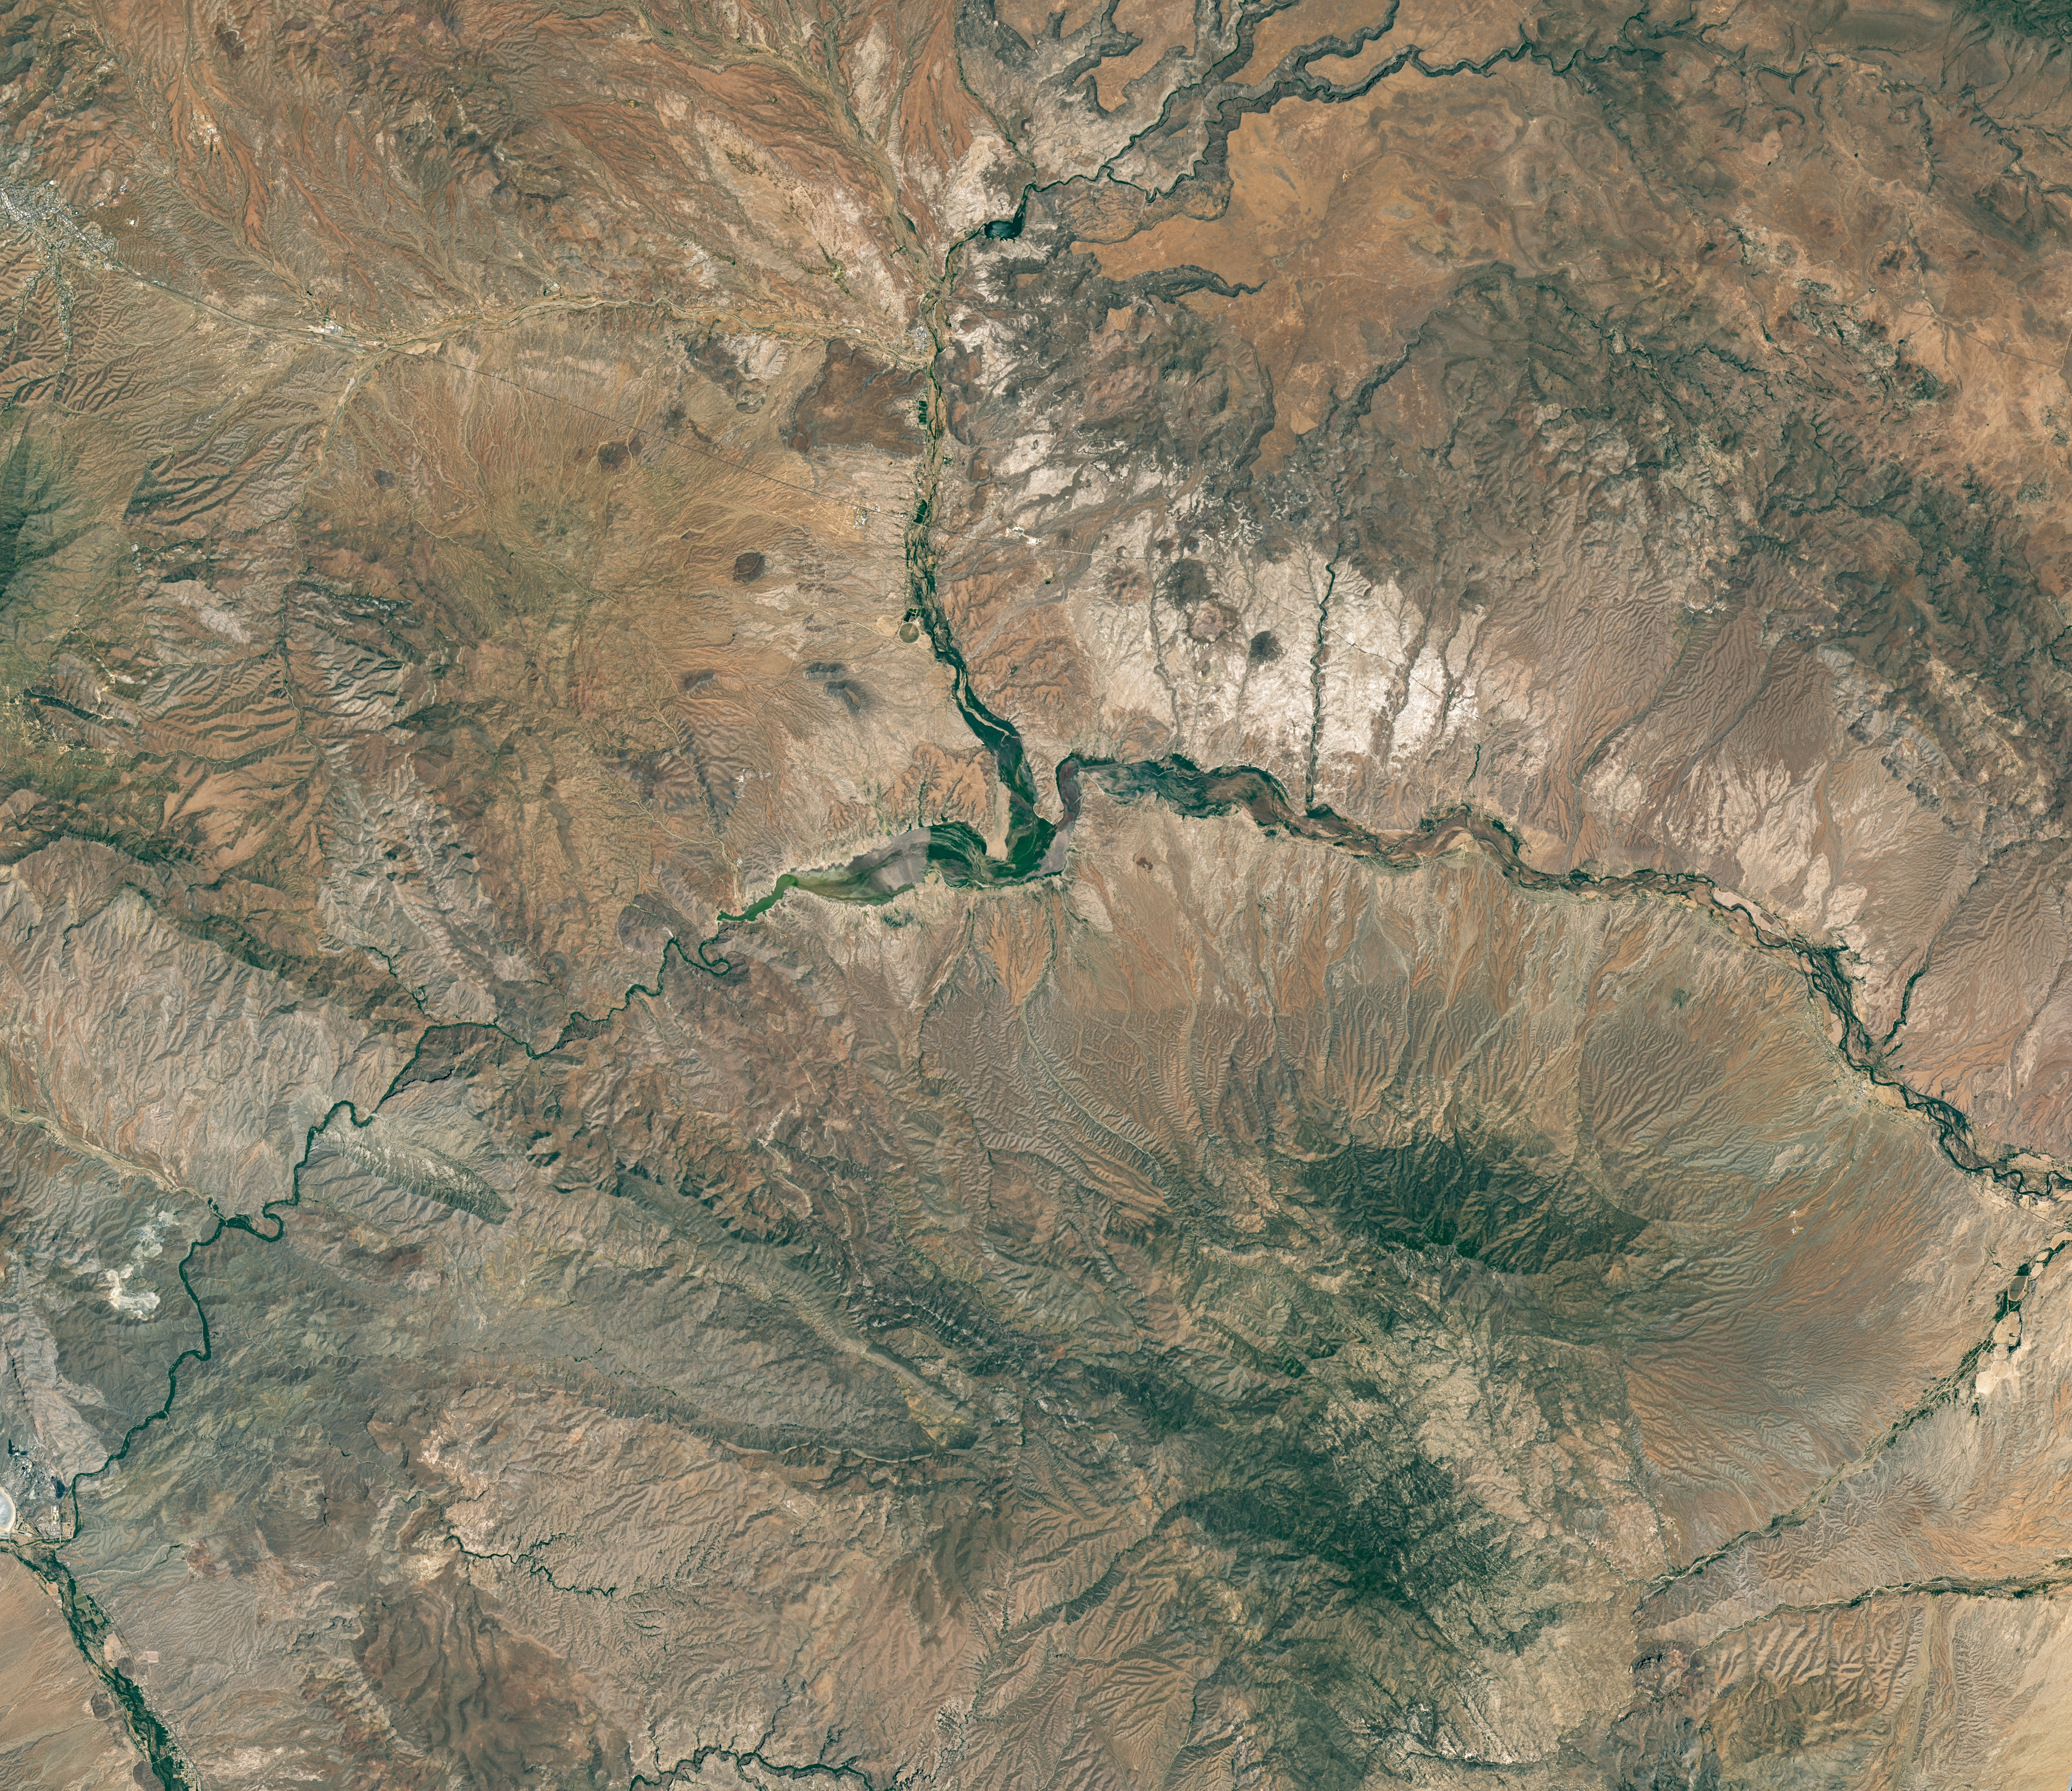
The reservoir is nearly empty by May 2026. The Gila River's natural channel is now visible and flanked with green vegetation in what had been the bottom of the reservoir.
The reservoir is nearly empty by May 2026. The Gila River’s natural channel is now visible and flanked with green vegetation in what had been the bottom of the reservoir.
NASA Earth Observatory/Michala Garrison
June 7, 2023
May 22, 2026
Little water remains in the San Carlos Reservoir in May 2026 (right) compared to fuller conditions in June 2023 (left). Images were captured by the OLI (Operational Land Imager) on the Landsat 9 and 8 satellites, respectively. NASA Earth Observatory images by Michala Garrison.

The Gila River is among the Southwest’s most important rivers, delivering water for people, farms, and wildlife while linking the snow-fed mountains of southwestern New Mexico to the desert lowlands of southwestern Arizona.

In wetter years, seasonal snowfall on the Mogollon Mountains and Black Range provides much of the river’s spring flow and helps refill San Carlos Reservoir, which is formed by the Coolidge Dam. When filled to capacity, the reservoir is one of Arizona’s largest bodies of water.

However, in 2026, lackluster snowfall left the mountain snowpack in the Gila River watershed at 2 percent of the 1991-2020 March median. The limited snowpack pushed April streamflow to 39 percent of normal. By June, after mandatory water releases for downstream agriculture, the reservoir held less than 400 acre-feet of water.

The Landsat image above (right) shows the near-empty reservoir on May 22, 2026, when it stored 389 acre-feet of water—less than 1 percent full; the other image (left) shows the same area in June 2023, when it was about 60 percent full. The green vegetation growing along the river channel and reservoir edge includes a mixture of tamarisk, willow, cottonwood, sedges, and grasses.

Officials closed the reservoir indefinitely on June 5, 2026, after the declining water levels contributed to low oxygen levels—hypoxia—that killed virtually all of its fish. Species living in the reservoir included largemouth bass, black crappie, bluegill, channel catfish, flathead catfish, and several stocked species, including brown trout and rainbow trout. The decomposing fish may pose health risks to people attempting to boat or fish, the San Carlos Recreation and Wildlife Department warned.

The reservoir has hit similarly low water levels in the past, running out of water at least 20 times since it was filled in 1930, according to news reports. Even when the dam and reservoir were first dedicated, there was enough grass growing on the dried reservoir bottom that humorist Will Rogers famously quipped to President Calvin Coolidge: “If that was my lake, I’d mow it.”

Other years with major fish kills include 1976 and 2018. After more than 5 million fish died during a similar event in 1976, the Gila Herald reported that it took five years for the lake’s ecosystem to rebound.

The region is currently in the midst of a multi-year dry period that has left much of the Gila River’s headwaters in New Mexico in a state of severe drought, according to data from the U.S. Drought Monitor.

However, the river’s flow is highly variable, and heavy rains during the coming wet season could help the reservoir recover. A seasonal monsoon outlook released by NOAA in May 2026 projected a 33 to 50 percent chance that an above-average amount of rain would fall in the region that summer. El Niño in the central and eastern equatorial Pacific, which was strengthening in late spring 2026, can make heavy rains in the U.S. Southwest more likely.

NASA Earth Observatory images by Michala Garrison, using Landsat data from the U.S. Geological Survey. Story by Adam Voiland.

Downloads

The reservoir appears lake-like and expansive in an image acquired in June 2023.

June 7, 2023

JPEG (16.60 MB)

The reservoir is nearly empty by May 2026. The Gila River's natural channel is now visible and flanked with green vegetation in what had been the bottom of the reservoir.

May 22, 2026

JPEG (16.85 MB)

References & Resources

You may also be interested in:

Stay up-to-date with the latest content from NASA as we explore the universe and discover more about our home planet.

Drought Parches Florida
4 min read

The state was unusually dry for much of 2025, but the intensity of the drought has ratcheted up since January…

Article
Snow Is Scarce in the Upper Colorado Basin
5 min read

The mountains of Utah and Colorado are among the areas of the western U.S. that are low on snow and…

Article
Spring Rains Saturate Michigan
3 min read

Above-normal precipitation has swollen rivers and damaged infrastructure statewide.

Article

The post Low Water at San Carlos Reservoir appeared first on NASA Science.

Low Water at San Carlos Reservoir

17 June 2026 at 05:01


June 7, 2023
May 22, 2026

The reservoir appears lake-like and expansive in an image acquired in June 2023.
NASA Earth Observatory/Michala Garrison

The reservoir is nearly empty by May 2026. The Gila River's natural channel is now visible and flanked with green vegetation in what had been the bottom of the reservoir.
The reservoir is nearly empty by May 2026. The Gila River’s natural channel is now visible and flanked with green vegetation in what had been the bottom of the reservoir.
NASA Earth Observatory/Michala Garrison

The reservoir appears lake-like and expansive in an image acquired in June 2023.
NASA Earth Observatory/Michala Garrison
The reservoir is nearly empty by May 2026. The Gila River's natural channel is now visible and flanked with green vegetation in what had been the bottom of the reservoir.
The reservoir is nearly empty by May 2026. The Gila River’s natural channel is now visible and flanked with green vegetation in what had been the bottom of the reservoir.
NASA Earth Observatory/Michala Garrison

June 7, 2023

May 22, 2026


Little water remains in the San Carlos Reservoir in May 2026 (right) compared to fuller conditions in June 2023 (left). Images were captured by the OLI (Operational Land Imager) on the Landsat 9 and 8 satellites, respectively. NASA Earth Observatory images by Michala Garrison.

The Gila River is among the Southwest’s most important rivers, delivering water for people, farms, and wildlife while linking the snow-fed mountains of southwestern New Mexico to the desert lowlands of southwestern Arizona.

In wetter years, seasonal snowfall on the Mogollon Mountains and Black Range provides much of the river’s spring flow and helps refill San Carlos Reservoir, which is formed by the Coolidge Dam. When filled to capacity, the reservoir is one of Arizona’s largest bodies of water.

However, in 2026, lackluster snowfall left the mountain snowpack in the Gila River watershed at 2 percent of the 1991-2020 March median. The limited snowpack pushed April streamflow to 39 percent of normal. By June, after mandatory water releases for downstream agriculture, the reservoir held less than 400 acre-feet of water.

The Landsat image above (right) shows the near-empty reservoir on May 22, 2026, when it stored 389 acre-feet of water—less than 1 percent full; the other image (left) shows the same area in June 2023, when it was about 60 percent full. The green vegetation growing along the river channel and reservoir edge includes a mixture of tamarisk, willow, cottonwood, sedges, and grasses.

Officials closed the reservoir indefinitely on June 5, 2026, after the declining water levels contributed to low oxygen levels—hypoxia—that killed virtually all of its fish. Species living in the reservoir included largemouth bass, black crappie, bluegill, channel catfish, flathead catfish, and several stocked species, including brown trout and rainbow trout. The decomposing fish may pose health risks to people attempting to boat or fish, the San Carlos Recreation and Wildlife Department warned.

The reservoir has hit similarly low water levels in the past, running out of water at least 20 times since it was filled in 1930, according to news reports. Even when the dam and reservoir were first dedicated, there was enough grass growing on the dried reservoir bottom that humorist Will Rogers famously quipped to President Calvin Coolidge: “If that was my lake, I’d mow it.”

Other years with major fish kills include 1976 and 2018. After more than 5 million fish died during a similar event in 1976, the Gila Herald reported that it took five years for the lake’s ecosystem to rebound.

The region is currently in the midst of a multi-year dry period that has left much of the Gila River’s headwaters in New Mexico in a state of severe drought, according to data from the U.S. Drought Monitor.

However, the river’s flow is highly variable, and heavy rains during the coming wet season could help the reservoir recover. A seasonal monsoon outlook released by NOAA in May 2026 projected a 33 to 50 percent chance that an above-average amount of rain would fall in the region that summer. El Niño in the central and eastern equatorial Pacific, which was strengthening in late spring 2026, can make heavy rains in the U.S. Southwest more likely.

NASA Earth Observatory images by Michala Garrison, using Landsat data from the U.S. Geological Survey. Story by Adam Voiland.

Downloads

The reservoir appears lake-like and expansive in an image acquired in June 2023.

June 7, 2023

JPEG (16.60 MB)

The reservoir is nearly empty by May 2026. The Gila River's natural channel is now visible and flanked with green vegetation in what had been the bottom of the reservoir.

May 22, 2026

JPEG (16.85 MB)

References & Resources

You may also be interested in:

Stay up-to-date with the latest content from NASA as we explore the universe and discover more about our home planet.

Drought Parches Florida

4 min read

The state was unusually dry for much of 2025, but the intensity of the drought has ratcheted up since January…

Article

Snow Is Scarce in the Upper Colorado Basin

5 min read

The mountains of Utah and Colorado are among the areas of the western U.S. that are low on snow and…

Article

Spring Rains Saturate Michigan

3 min read

Above-normal precipitation has swollen rivers and damaged infrastructure statewide.

Article
❌