 Login
A.I. Boom Ignites Asian Chip Companies
16 June 2026 at 10:00
They make much of the gear that goes into giant data centers. Demand for their products is shifting the balance of tech power.



NASA’s Parker Solar Probe completed its 28th close approach to the Sun on June 8, again matching its record distance of 3.8 million miles from the solar surface. The flyby allowed the spacecraft to continue its measurements of the solar wind and solar activity at their source, while adding to our understanding of how the Sun’s atmosphere changes throughout the solar cycle.
The spacecraft checked in with flight controllers at the Johns Hopkins Applied Physics Laboratory (APL) in Laurel, Maryland — where Parker Solar Probe was designed and built — on Thursday, transmitting a beacon tone that indicated its systems were operating normally. Zooming around the Sun on a trajectory that limited communications with Earth, Parker had been out of contact and operating autonomously for nine days around its closest approach, as planned.
During this solar encounter, which started June 3 and ends Saturday, June 13, Parker’s four scientific instrument packages gathered data from inside the Sun’s atmosphere, or corona. Parker will begin returning detailed spacecraft telemetry on June 14, with science data transmission set to run from Wednesday, June 17 to Tuesday, June 30.
Parker’s observations of the solar wind and solar events, such as coronal mass ejections and the aftermaths of flares, are critical to advancing humanity’s understanding of the Sun and the phenomena that drive high-energy space weather events that pose risks to astronauts, satellites, air travel, and even power grids on Earth. Understanding the fundamental physics of space weather enables more reliable prediction of astronaut safety during future deep-space missions to the Moon and Mars.
Parker also equaled its record-setting speed of 430,000 mph — a mark that, like Parker’s distance to the Sun, was set during a close approach on Dec. 24, 2024, and matched during five flybys since, most recently on March 11. Parker will continue matching these speed and distance records during future flybys.
Through all six close approaches, mission leads say, the spacecraft has remained in excellent condition. While Parker doesn’t have a temperature sensor on the front of its heat shield — known as the Thermal Protection System, or TPS — the team can estimate through models that the heat shield reaches temperatures of about 1,700 degrees Fahrenheit at closest approach.
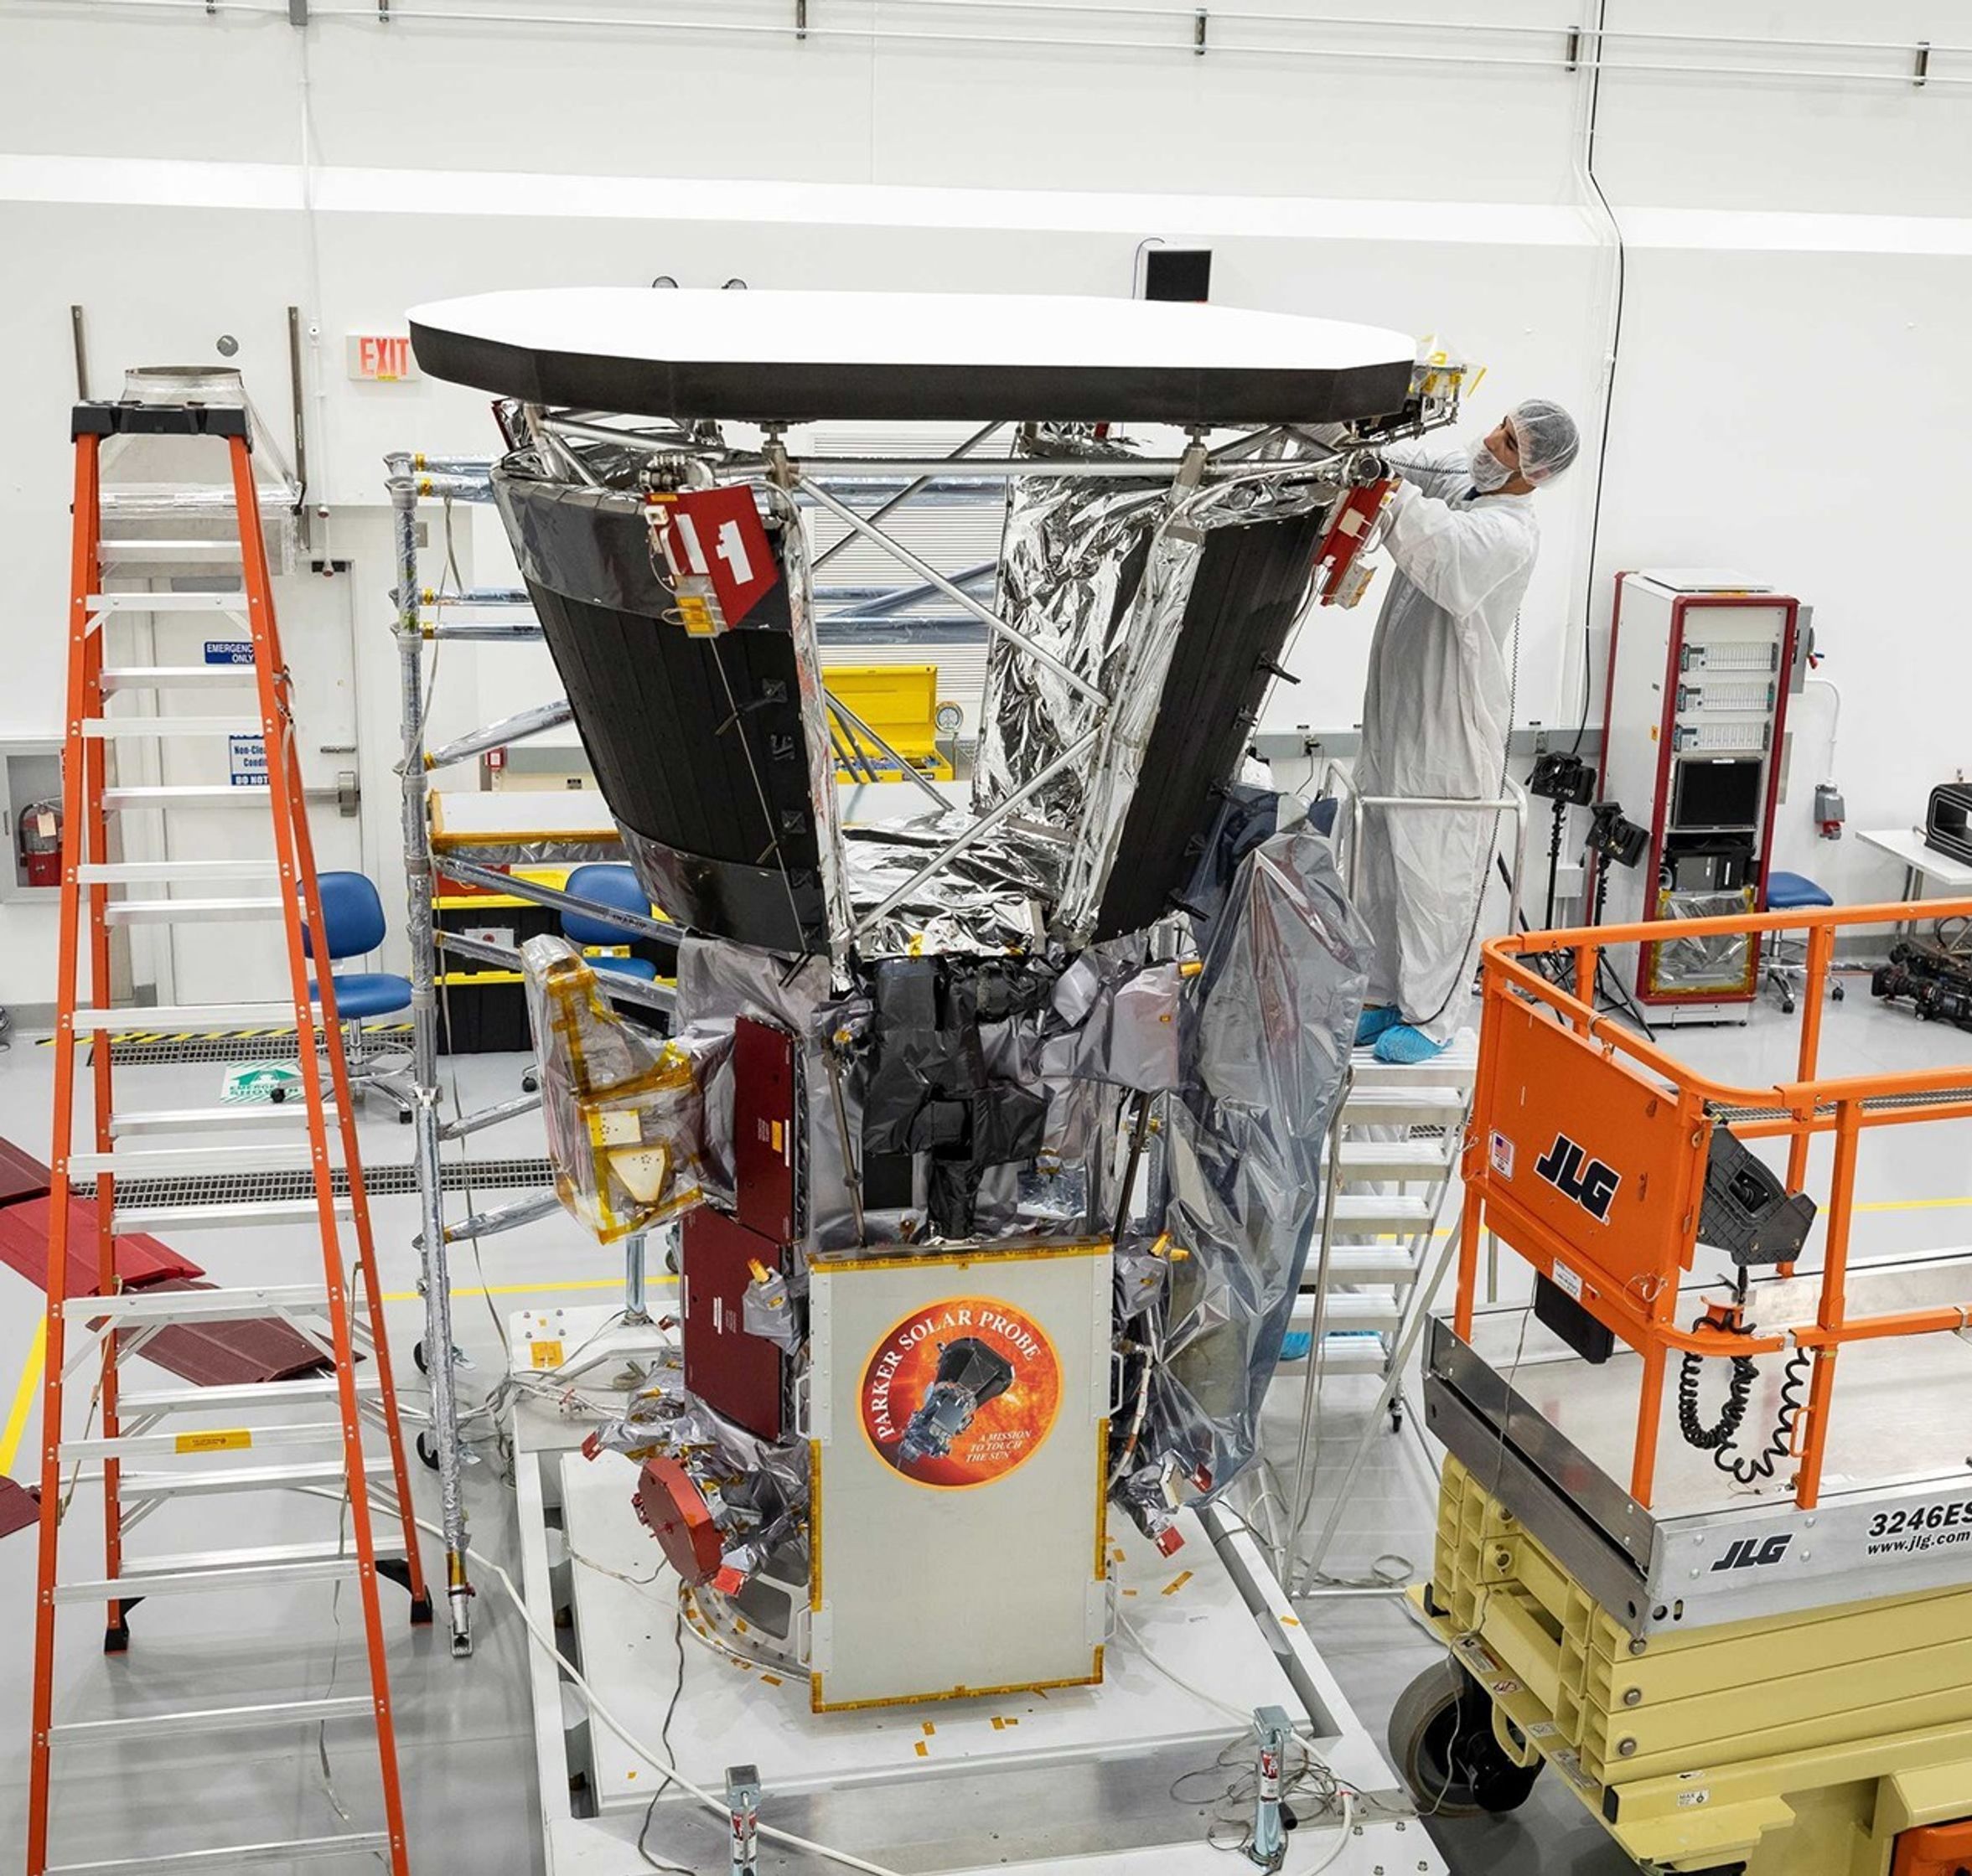
“The heat shield material is incredibly light and fragile, but the thermal design, as well as the software that keeps the spacecraft pointing the TPS toward the Sun, have been outstanding,” said John Wirzburger, Parker Solar Probe mission systems engineer at APL. “It’s a real tribute to the team that designed, built, and operates Parker Solar Probe.”
Meanwhile, the team can measure the temperature of the barrier blanketing below the heat shield, and the actual spacecraft temperature has remained consistent on each pass.
“That temperature consistency is a major indicator of spacecraft health,” said Wirzburger. “It tells us the heat shield isn’t degrading. If it were cracking or weakening, we’d see temperatures drift upward as more heat leaked through.”
Parker launched in August 2018. At the time, the Sun was near the minimum of its 11-year activity cycle. In 2024, representatives from NASA, the National Oceanic and Atmospheric Administration (NOAA), and the international Solar Cycle Prediction Panel announced that the Sun had reached its solar maximum period. Parker’s 28 encounters with the Sun reflect this change over time, sampling the Sun’s atmosphere from quiet to very active periods. Parker Solar Probe will remain in this orbit around the Sun and continue making observations into the declining phase of solar activity.
The next steps for the mission in late 2026 and beyond are under NASA review.
Parker Solar Probe was developed as a part of NASA’s Living With a Star (LWS) program to explore aspects of the Sun-Earth system that directly affect life and society. The LWS program is managed by the agency’s Goddard Space Flight Center in Greenbelt, Maryland, for NASA’s Science Mission Directorate in Washington. Johns Hopkins APL manages Parker Solar Probe for NASA and designed, built, and now operates the mission.
Mike Buckley, Johns Hopkins Applied Physics Laboratory
The post Parker Solar Probe Makes 28th Close Pass of Sun appeared first on NASA Science.
Eugene Parker, pioneer of theoretical solar and plasma astrophysics, was born June 10, 1927. Parker revolutionized the field of heliophysics, notably by first proposing the existence of the solar wind — a stream of charged particles ejected from the Sun — in 1958. His theory was confirmed by Mariner II in 1962. Among many otherContinue reading "June 10, 1927: The birth of Eugene Parker"
The post June 10, 1927: The birth of Eugene Parker appeared first on Astronomy Magazine.
The Sun’s activity history, the sources of tiny jets, and how magnetic fields might impact space weather forecasts: today’s Monthly Roundup introduces a trio of recent research articles from the Astrophysical Journal that tackle hot topics in solar physics.
Since the 1970s, regular monitoring of the Sun’s magnetic field has allowed researchers to decipher the Sun’s behavior as it cycles through periods of low and high activity. But what resources exist for studying the Sun’s past behavior? To investigate the long-term behavior of the Sun, researchers reach for historical records of sunspots, which stretch back to the 1700s.
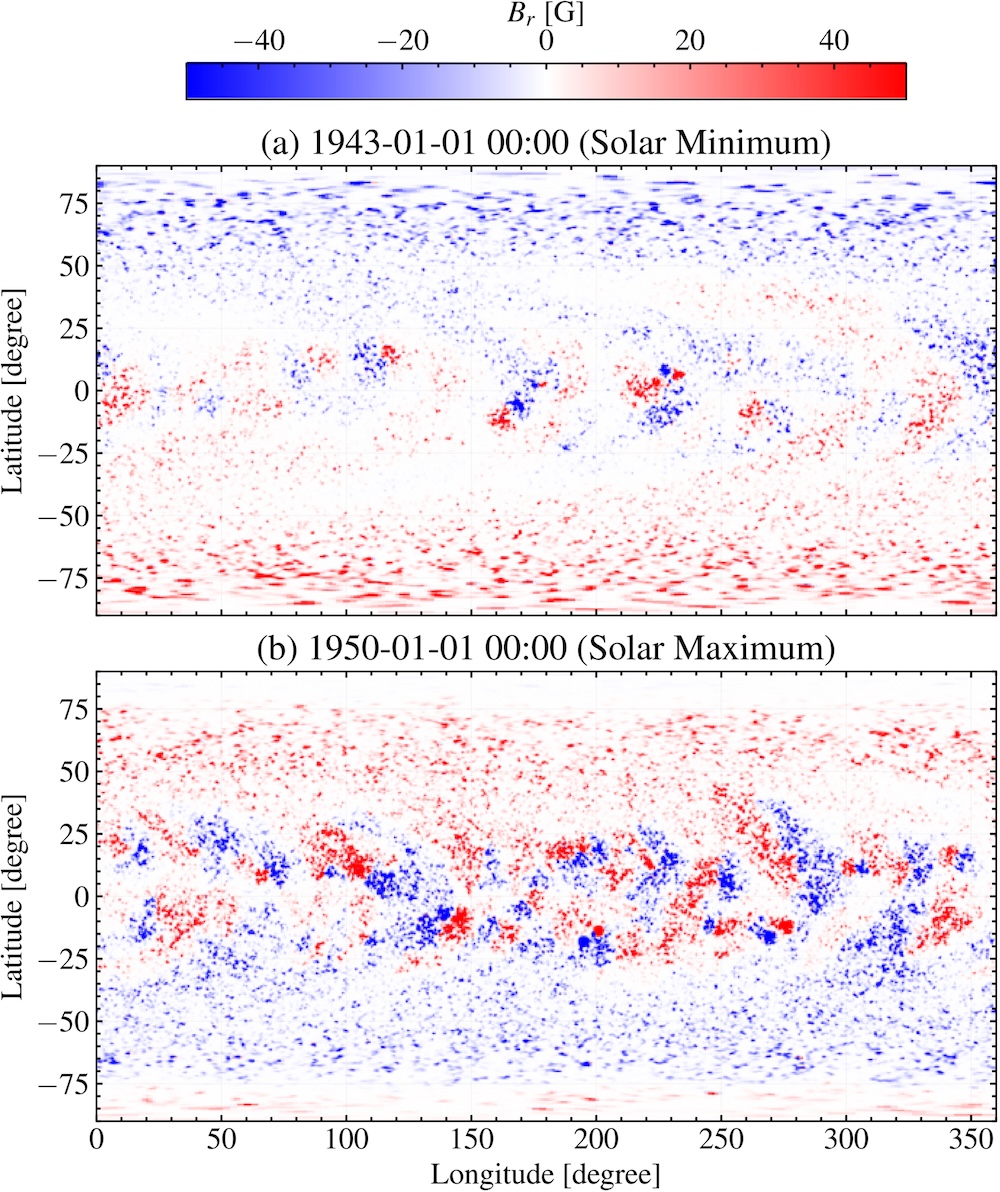
Example maps of the simulated photospheric radial magnetic field during a period of low (top) and high (bottom) solar activity. Click to enlarge. [Jha et al. 2026]
Jha and coauthors found that this method successfully reproduced the expected large-scale behavior of the Sun’s magnetic field across multiple solar cycles, such as the reversal of the polarity of the solar magnetic field near the peak of the activity cycle. While this work highlights the impressive results obtained from combining historical sunspot records with modern sunspot statistics, the team pointed out that this method cannot accurately reproduce all quantities because of the nonlinear nature of the underlying physics. Future work will refine the model further, and in the meantime, the team’s simulated historical magnetic field maps will be made publicly available.
The Sun’s atmosphere is filled with an ever-shifting maze of magnetic field lines, which reconfigure and release pent-up magnetic energy in a process called magnetic reconnection. Magnetic reconnection can launch particles and heat plasma, and it’s thought to be responsible for driving jets on a variety of scales in the Sun’s tenuous outer atmosphere, or corona. Annu Bura (Indian Institute of Astrophysics; Pondicherry University) and coauthors investigated the physical origins of the smallest of these reconnection driven jets, picoflare jets, using data from the Extreme Ultraviolet Imager on board Solar Orbiter. Solar Orbiter has ventured within 0.3 au of the Sun, and its Extreme Ultraviolet Imager has returned exceptionally precise high-energy images of our home star.
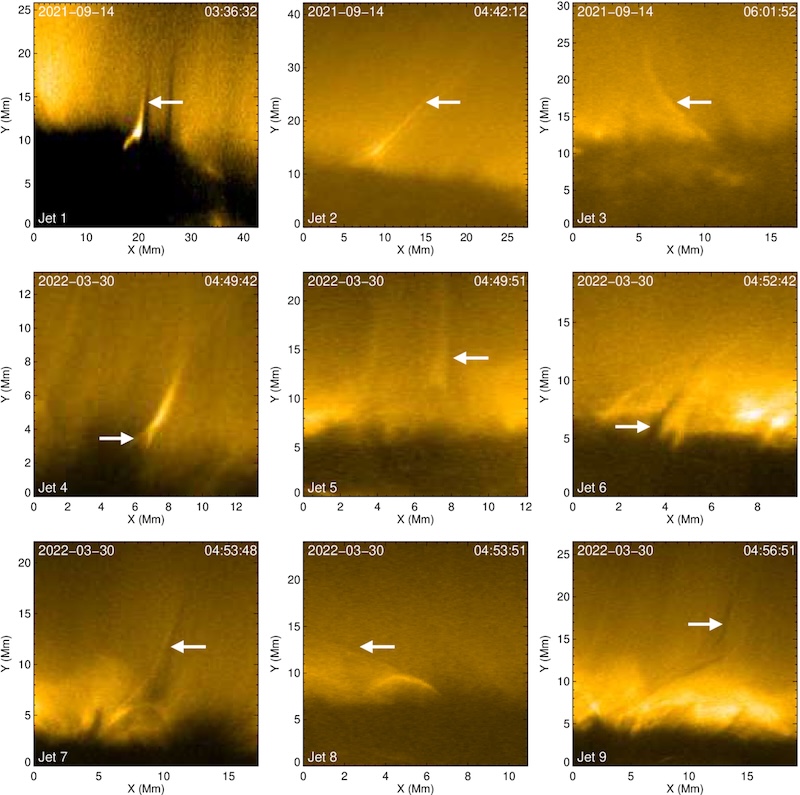
Examples of jets identified in this study. You can see an animation of this figure. [Bura et al. 2026]
Using radiation magnetohydrodynamics simulations, the team explored the origins of their sample of jets. The simulations suggested that the bright features arose from hot, tenuous coronal plasma, while the accompanying dark features were due to cooler, denser plasma venturing upward from deeper in the Sun’s atmosphere, in the chromosphere. Overall, the simulations and observations support a picture in which picoflare-scale jets are driven by magnetic reconnection after magnetic flux emerges through the Sun’s surface. This echoes the formation route of larger coronal jets, suggesting that this process may apply to a wide range of physical scales.
The vast majority of our observations of the Sun have come from within a few degrees of the ecliptic plane, either from telescopes situated on Earth’s surface or from spacecraft that stuck close to the plane of our solar system. With rare but notable exceptions — the Ulysses spacecraft, which measured the Sun’s magnetic field and plasma environment from a near-polar orbit, and Solar Orbiter, which took the first-ever image of the Sun’s poles in November 2025 — the Sun’s poles have remained hidden from our instruments.
Our limited knowledge of the Sun’s polar magnetic field has consequences for our ability to model space weather events like coronal mass ejections. A team led by Xiao Zhang (Chinese Academy of Sciences; University of Chinese Academy of Sciences) has used numerical simulations to investigate how solar polar magnetic field conditions influence the propagation of a coronal mass ejection (CME) through the solar system.
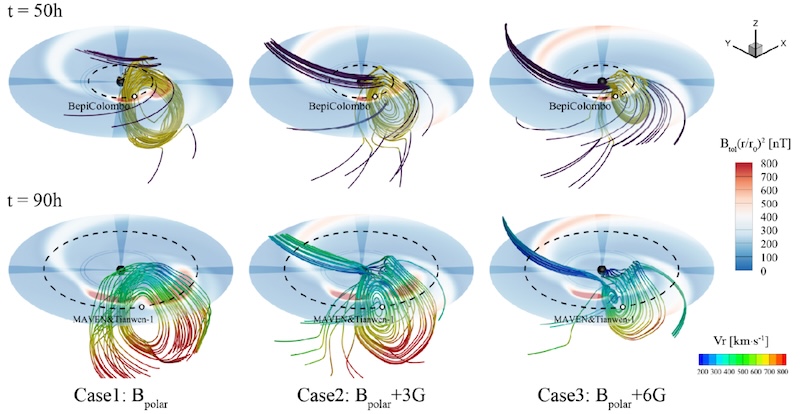
Simulation results showing how the propagation and expansion of a CME are affected by the polar magnetic field strength. Click to enlarge. [Zhang et al. 2026]
“Historical Reconstruction of Solar Surface Magnetism from Cycles 1–24 Using the Synthetic Active Region Generator and the Advective Flux Transport Model,” Bibhuti Kumar Jha et al 2026 ApJ 997 279. doi:10.3847/1538-4357/ae279a
“On the Origin of Coronal Picoflare Jets,” Annu Bura et al 2026 ApJ 1000 94. doi:10.3847/1538-4357/ae48e6
“Influence of Solar Polar Magnetic Fields on the Propagation of Coronal Mass Ejections,” Xiao Zhang et al 2026 ApJ 1000 200. doi:10.3847/1538-4357/ae4c54
The post Monthly Roundup: Science of the Sun appeared first on AAS Nova.
Revealed in high resolution, researchers have spotted complex twisting and braiding motions in fine threads of plasma suspended above a sunspot. The flow of material that followed this braiding provides evidence for magnetic reconnection.
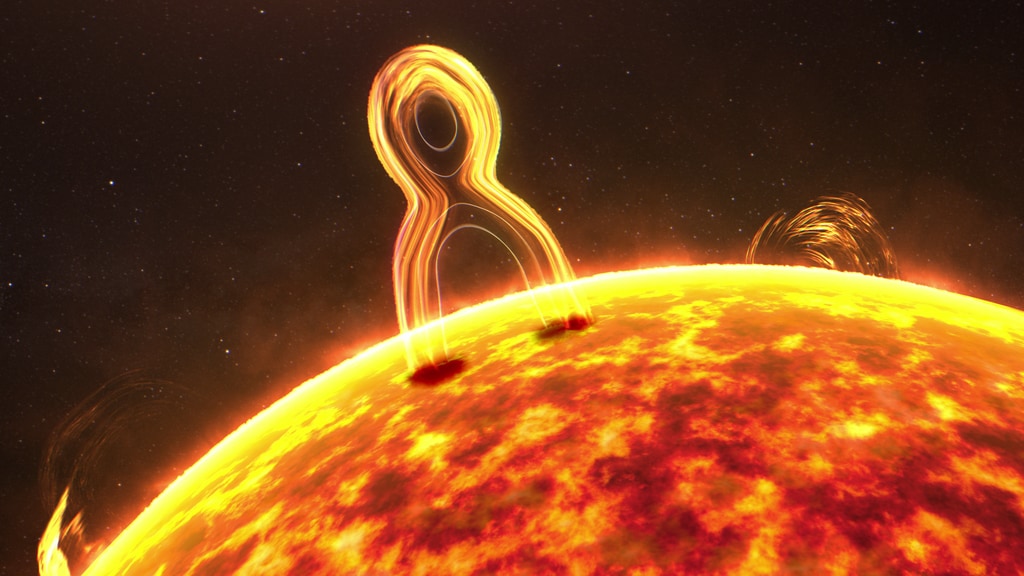
Magnetic reconnection is common throughout the universe, from Earth’s magnetic field to the jets of supermassive black holes. This illustration shows magnetic reconnection happening on the Sun. [NASA’s Conceptual Image Laboratory]
One way for magnetic reconnection to heat the corona is along magnetic fields that loop up into the corona and are anchored to the solar photosphere. The footprints of these field lines — the spots where they land in the photosphere — wiggle around in random ways. As this happens, the arcing magnetic field lines become braided together, and the twisted magnetic field can then undergo magnetic reconnection, heating the corona.
This process has been explored theoretically, but it’s been challenging to observe directly. As increasingly capable Sun-studying instruments have come online, though, researchers have been able to attain the high resolution needed to see this process at work.
Recently, Hechao Chen (Yunnan University; Peking University; Yunnan Key Laboratory of Solar Physics and Space Science) used data from the New Vacuum Solar Telescope, the Interface Region Imaging Spectrograph, and the Solar Dynamics Observatory to study the braiding and unbraiding of fine magnetic structures above a sunspot.
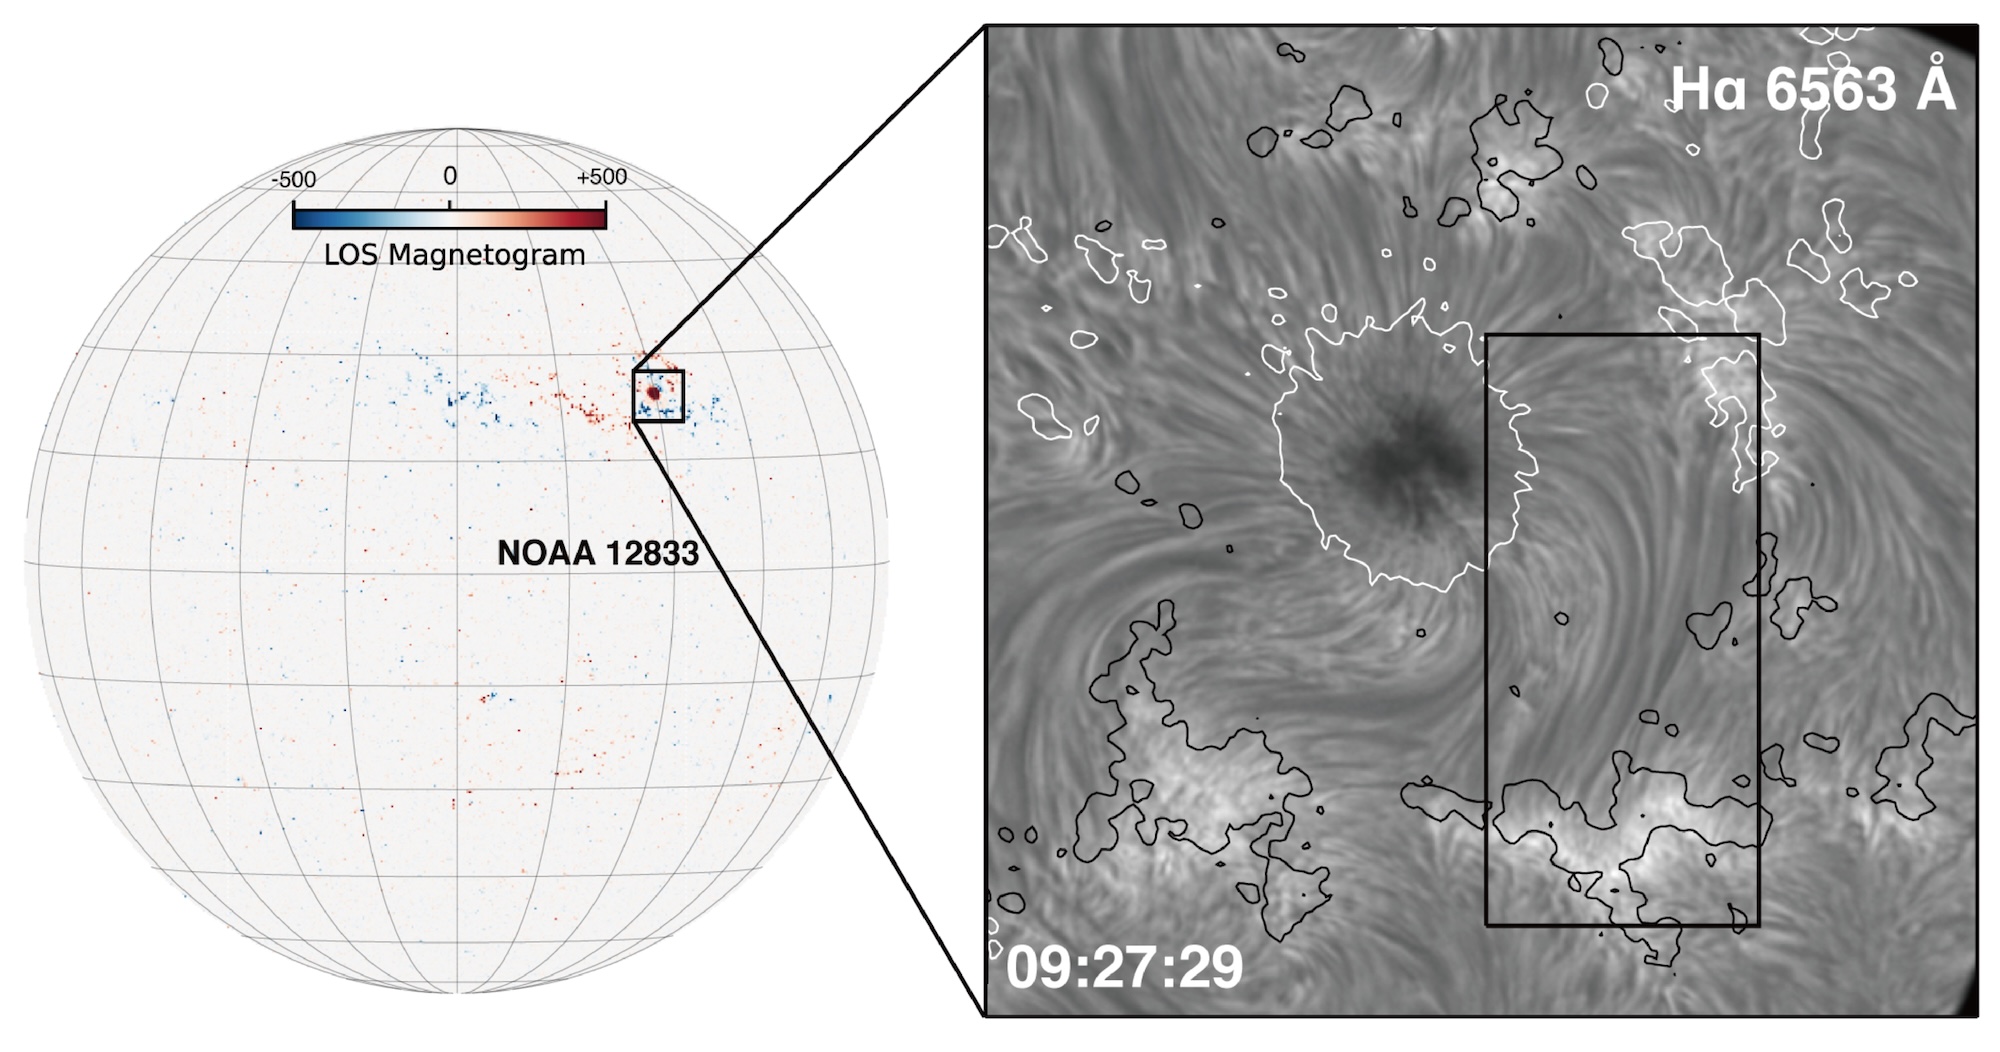
Location of the sunspot featured in this study, plus a closeup of the strands of plasma around the sunspot. Click to enlarge. [Adapted from Chen et al. 2025]
The plasma threads appear to lie nearly parallel to one another at the beginning of the observation. Images from all three facilities showed the plasma threads intertwining, providing evidence for the twisting of magnetic field lines predicted to happen when their footprints move around. (As further evidence for this footprint motion, the team also observed complicated flow patterns near one of the footprints.) This intertwining was followed by a sudden brightening where the threads were most tightly knotted, creating two bright “blobs” that traveled outward toward the footprints. Afterward, the threads resumed their nearly parallel state.
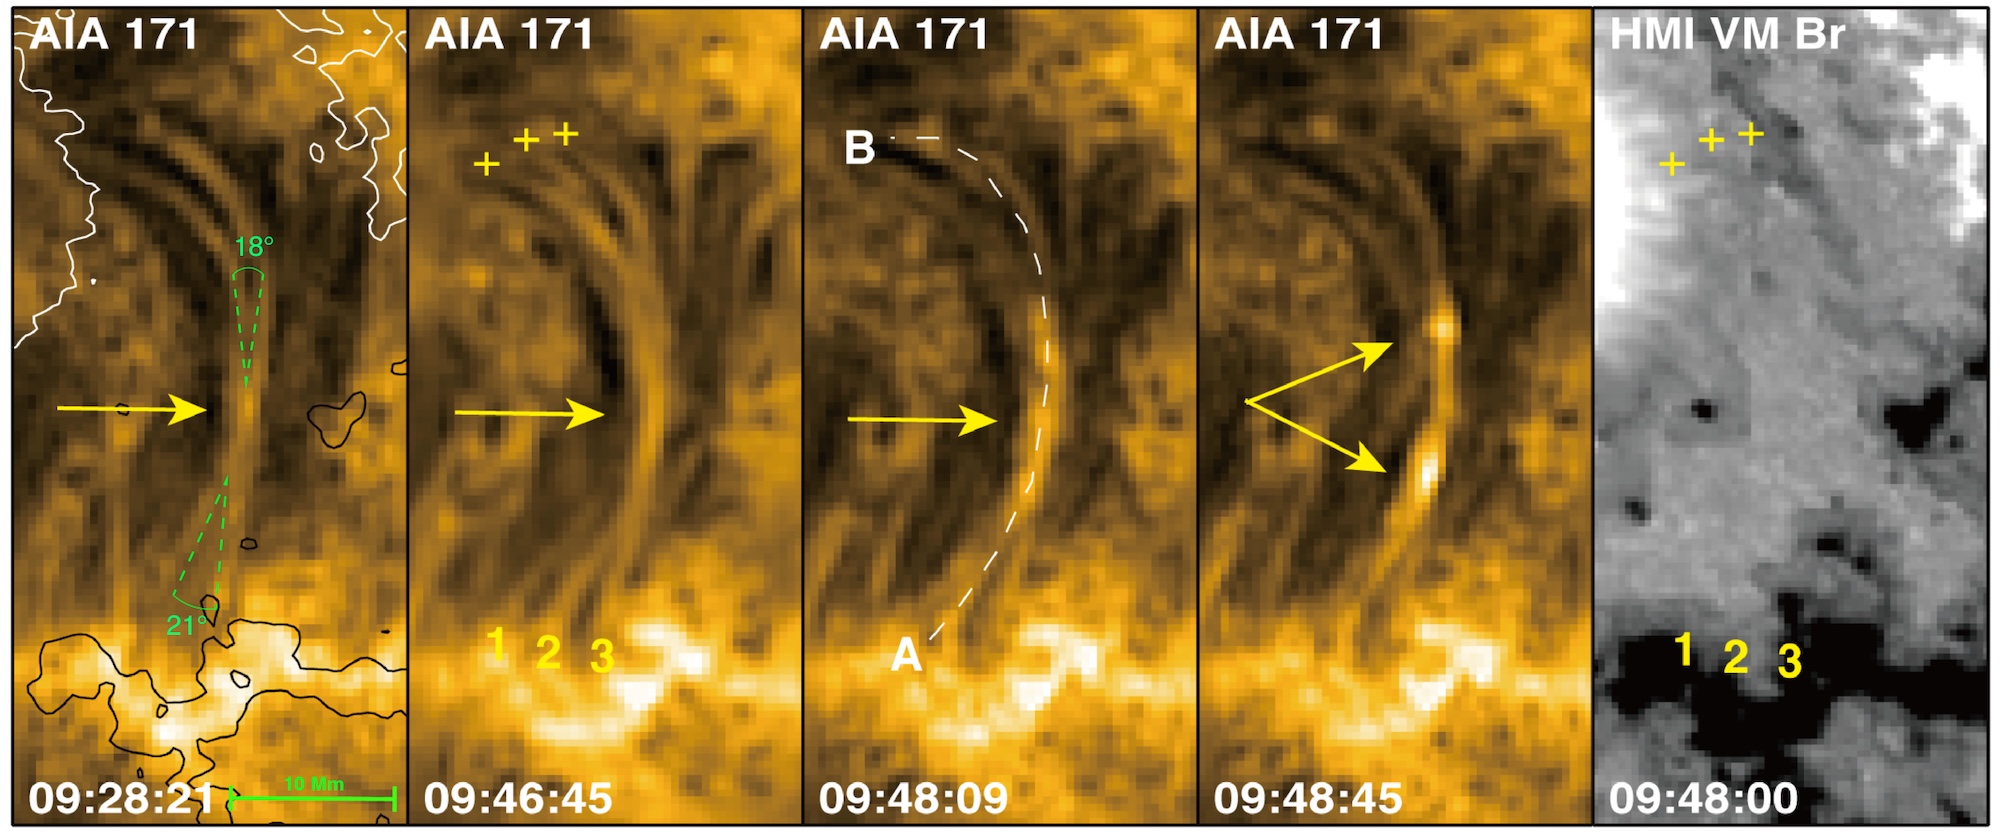
Images from Solar Dynamics Observatory. The first four images show the Sun at a wavelength of 17.1 nanometers, and the final image shows the radial magnetic field. The arrows indicate the location of the magnetic field braiding and the plasma “blobs.” Click to enlarge. [Adapted from Chen et al. 2025]
This work beautifully illustrates the process of magnetic reconnection on the Sun, showing how random motions can set the stage for the buildup of magnetic tension. The heating and acceleration of plasma that follows demonstrates how small-scale reconnection events like the ones shown here can provide the energy needed to heat the solar corona.
“Witnessing Magnetic Reconnection in Tangled Superpenumbral Fibrils Around a Sunspot,” Hechao Chen et al 2025 ApJ 995 94. doi:10.3847/1538-4357/ae12e9
The post Astronomers See Braided Magnetic Fields Above a Sunspot appeared first on AAS Nova.
What happens when pileups of solar wind plasma collide with Earth’s protective magnetosphere? New work uses machine learning to examine how strongly these events affect our planet’s magnetic field.
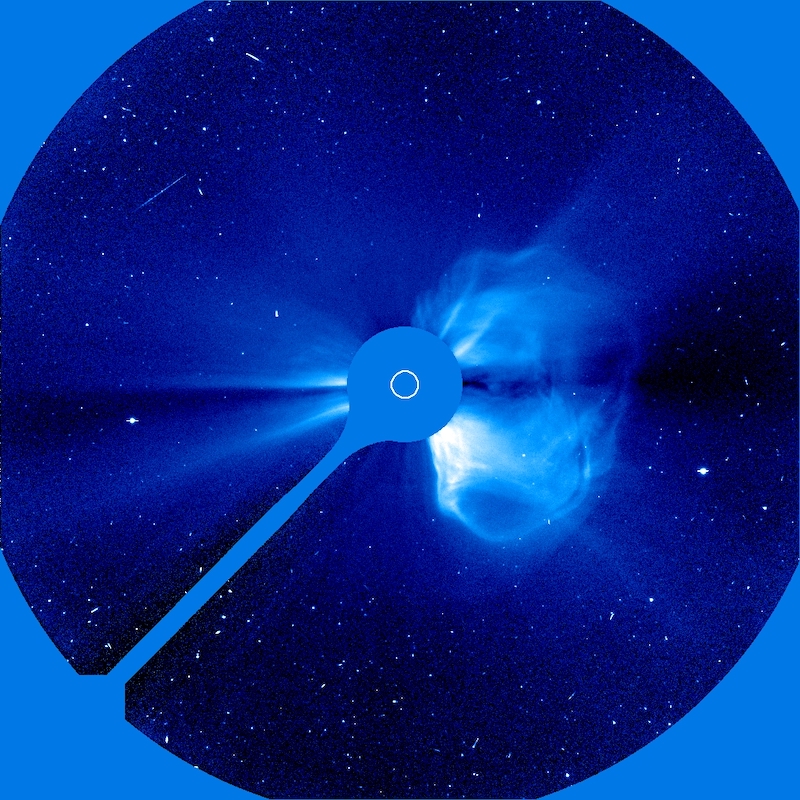
The Solar & Heliospheric Observatory (SOHO) took this coronagraphic image of a coronal mass ejection on 20 April 1998. [SOHO (ESA & NASA)]
Stream interaction regions arise when slow-moving solar wind is struck from behind by faster-moving solar wind emitted later. The collision of the two solar wind streams creates a tangle of compressed plasma and strong magnetic fields capable of peeling back Earth’s protective magnetosphere and dumping in high-energy charged particles, with beautiful yet harmful results.
Though stream interaction regions are less disruptive than coronal mass ejections, they’re far more common; they frequently needle Earth’s magnetosphere, especially during the calmer years of the Sun’s activity cycle. Predicting how strongly a stream interaction region will influence Earth’s magnetosphere — in other words, how geoeffective it is — is challenging, however. When two streams of solar wind collide, their properties combine in complex and nonlinear ways that traditional statistical investigations have struggled to pin down.
Now, Ye and collaborators have used machine learning to study the properties and impact of stream interaction regions in a physically meaningful way. They performed their study on a sample of 879 stream interaction events for which there is abundant information, such as temperature, magnetic field strength and direction, and solar wind conditions before and after the event.
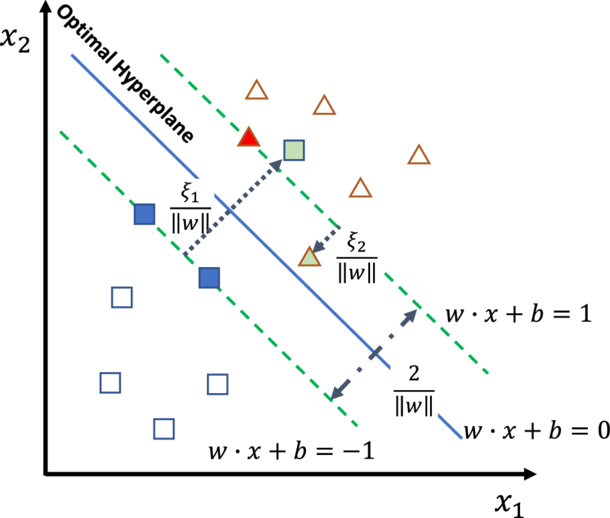
Illustration of the authors’ support vector machine framework. The optimal hyperplane is the boundary that best divides the data by maximizing the distance between the boundary and the data points nearest to it; these points are called support vectors. Square and triangle symbols represent two classes of data. Click to enlarge. [Ye et al. 2025]
The team first reined in the model’s complexity by identifying the most important features in the dataset. They then determined which features or combination of features had the largest contribution to the output — in other words, which physical parameters most strongly determined the geoeffectiveness of the event.
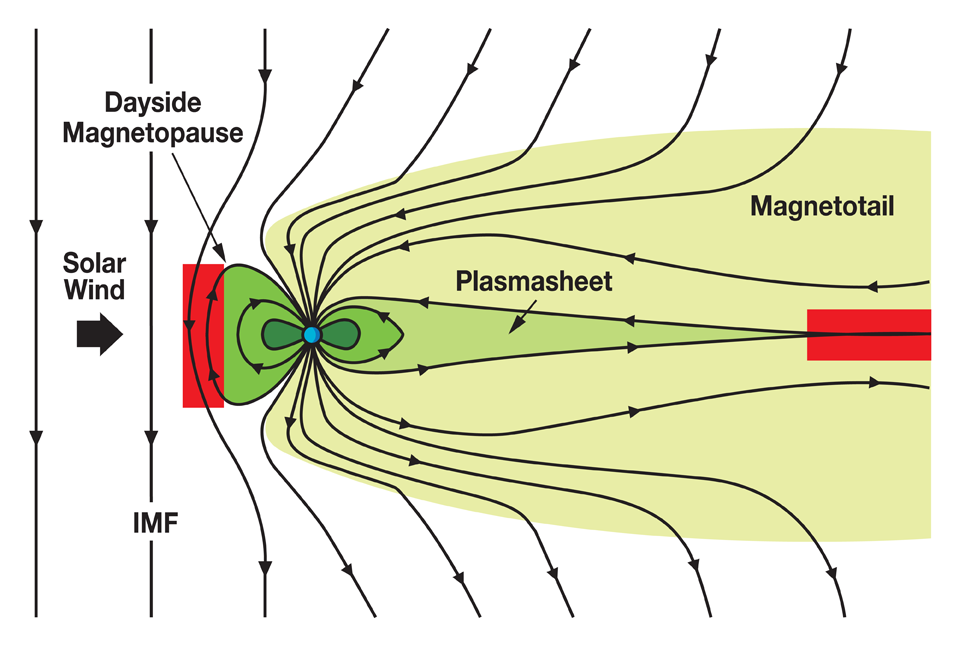
Illustration of how the interplanetary magnetic field (IMF) interacts with Earth’s magnetosphere. When the IMF points southward, as it does in this diagram, the impact on Earth’s magnetosphere is increased, with magnetic reconnection occurring in the red areas. Click to enlarge. [NASA]
“Assessing the Geoeffectiveness of Stream Interaction Regions Through Physically Interpretable Machine Learning,” Yudong Ye et al 2025 ApJ 993 10. doi:10.3847/1538-4357/ae0454
The post When Winds Collide: Predicting the Effects of Stream Interaction Regions appeared first on AAS Nova.
Editor’s Note: For the remainder of 2025, we’ll be looking at a few selections that we haven’t yet discussed on AAS Nova from among the most-downloaded articles published in AAS journals this year. The usual posting schedule will resume January 2nd.
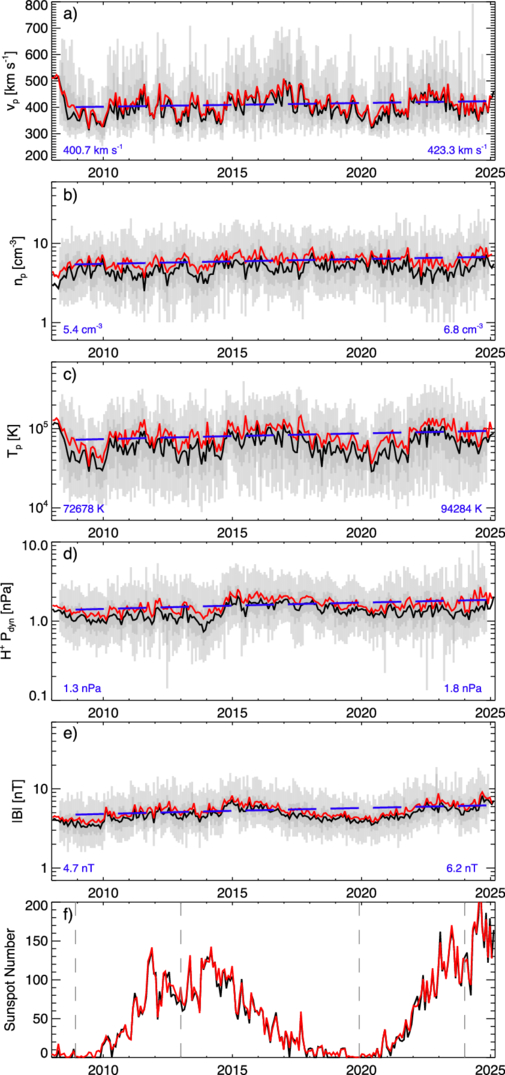
Various solar wind parameters measured at Earth’s orbital distance from 2008 to 2025. [Jasinski and Velli 2025]
The Sun undergoes an 11-year activity cycle that is driven by a change in its internal magnetic field structure. As the Sun’s magnetic activity changes, the number of sunspots, the frequency of solar flares and coronal mass ejections, and the intensity of the solar wind vary as well. Atop these mostly regular 11-year changes are longer-term variations. A recent example of this longer-term behavior began in the 1980s, when an overall weakening trend was stamped upon the usual 11-year cycle. This decline led to an exceptionally deep solar minimum in 2008, leading researchers to suspect that the Sun’s activity level might remain low for decades.
Though the Sun reversed its weakening activity trend in 2008, a prolonged period with little solar activity wouldn’t have been unprecedented. Astronomers have monitored and counted sunspots for centuries, allowing modern-day researchers to investigate the Sun’s behavior long before spacecraft began to study our home star. In the historical record, there are two instances of weak solar activity spanning multiple decades: the Maunder minimum in 1645–1715 and the Dalton minimum in 1790–1830. Compared to the 11-year solar cycle, these longer-term behaviors are more difficult to predict, and their causes are uncertain.
Jamie M. Jasinski and Marco Velli 2025 ApJL 990 L55. doi:10.3847/2041-8213/adf3a6
The post Selections from 2025: The Sun Changed Course in 2008 appeared first on AAS Nova.
Forecasting solar flares is one of the major challenges facing solar physicists today. New research finds that non-thermal emission can precede a solar flare by more than an hour, and this early emission may signal whether the flare will be accompanied by an explosion of plasma.
The Solar & Heliospheric Observatory (SOHO) took this coronagraphic image of a coronal mass ejection on 20 April 1998. [SOHO (ESA & NASA)]
Both solar flares and coronal mass ejections can disrupt everyday life on Earth, with flares knocking out radio communications and coronal mass ejections threatening spacecraft electronics and power grids. Given these real-life risks, as well as the potential for probing the physics behind the activity on the Sun and other stars, it’s critical to be able to identify signs of upcoming flares.
Luckily, there’s growing evidence that the Sun sends out subtle signals that a flare is soon to happen. One early sign of an impending flare is an increase in the non-thermal velocity of the plasma at the flare’s location. This phenomenon has been spotted in individual flares, but it hasn’t been studied and characterized for a large sample of flares — until now.
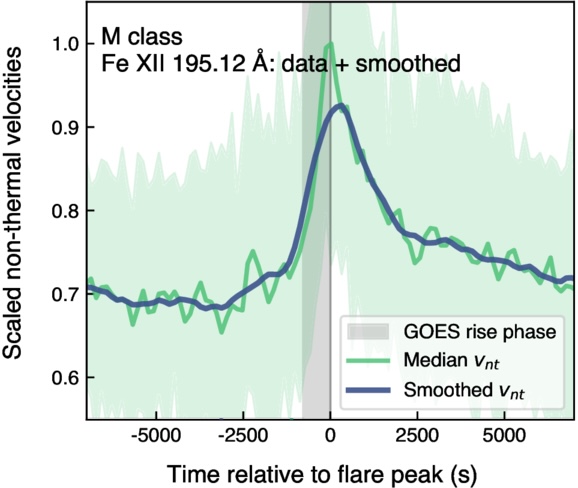
Demonstration of the increase in non-thermal velocity seen in an M-class flare compared to the onset and rise time of the soft X-ray flux (gray shaded area). [Adapted from To et al. 2025]
Of the flares in the sample, 83% were moderately powerful C-class flares, 18% were stronger M-class flares, and 1% were the most powerful X-class flares. To’s team identified a clear trend across all types of flares: the non-thermal velocity increases 4–25 minutes before the flare’s X-ray emission begins to rise, peaks when the X-ray emission peaks, and decays as the flare decays. The team found some evidence that for smaller flares, the velocity increase begins in spectral lines that trace cooler plasma before spreading to lines probing hotter plasma, but more work is needed to confirm this trend.
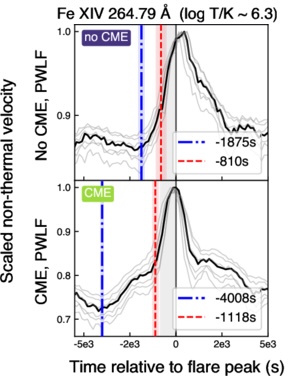
Examples of flares with and without coronal mass ejections. [Adapted from To et al. 2025]
These results suggest that changes in the non-thermal velocity of solar plasma can not only signal when and where a flare is likely to arise, but also whether the flare will be accompanied by a potentially destructive coronal mass ejection. Upcoming missions like the Multi-slit Solar Explorer and SOLAR-C will give an even better view of the early stages of solar flares, helping to illuminate the physics behind them and enhancing our ability to forecast them.
“Systematic Nonthermal Velocity Increase Preceding Soft X-Ray Flare Onset: A Large-Scale Hinode/EIS Study,” Andy S. H. To et al 2025 ApJ 993 102. doi:10.3847/1538-4357/ae07de
The post How Solar Flares Hint That They’re About to Happen appeared first on AAS Nova.
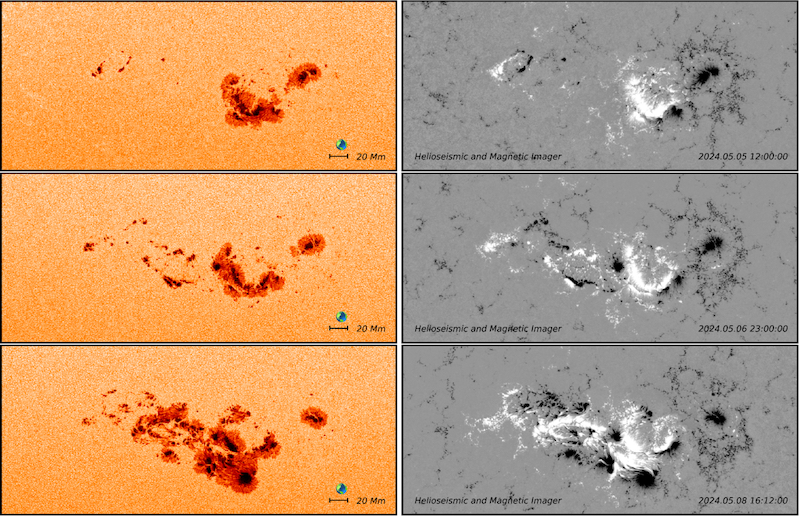
Evolution of a cluster of active regions as seen in continuum emission (left column) and radial magnetic field (right column). Click to enlarge. [Dikpati et al. 2025]
“Mother’s Day Superstorms: Pre- and Post-Storm Evolutionary Patterns of ARs 13664/8,” Mausumi Dikpati et al 2025 ApJ 988 108. doi:10.3847/1538-4357/addd09
The post Featured Image: Mother’s Day Superstorms appeared first on AAS Nova.
Spacecraft scattered throughout the solar system keep tabs on the solar wind, but the measurements are dotted with data gaps. How can scientists prevent these gaps from biasing their studies of the solar wind?
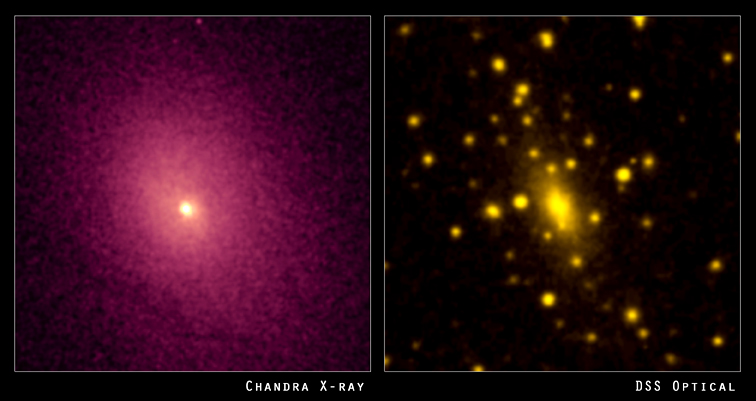
Left: the distribution of hot gas between the galaxies in the cluster Abell 2029. Right: the visible light from the galaxies in the cluster. [X-ray: NASA/CXC/UCI/A.Lewis et al. Optical: Pal.Obs. DSS]
Luckily, there are many spacecraft that sample the solar wind from various locations within our solar system. Unluckily, many of these spacecraft do not continuously monitor the solar wind. For example, when a spacecraft orbiting a planet dips into the planet’s atmosphere, this detour creates an hours-long gap in solar wind monitoring.
How do these data gaps affect studies of the solar wind? In a recent research article, Daniel Wrench and Tulasi Parashar (Victoria University of Wellington) approached this question in terms of how gaps affect the structure function: a mathematical description of how the solar wind fluctuates over different length or time scales.
Wrench and Parashar introduced random artificial gaps into data from the Parker Solar Probe, which monitors the solar wind continuously, and compared the structure functions calculated from the continuous and interrupted data sets. They used the difference between the true structure function — calculated from the continuous data set — and the structure functions from the artificially gapped data sets to develop a correction factor.
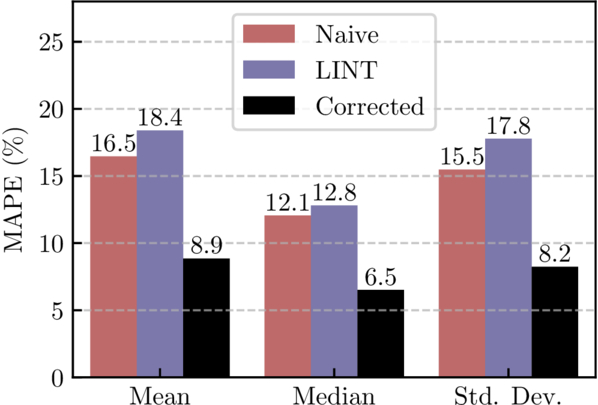
Performance of the correction factor method (black) compared to the uncorrected, gapped data (red) or gaps filled using linear interpolation (blue). MAPE is the mean absolute percentage error. [Wrench & Parashar 2025]
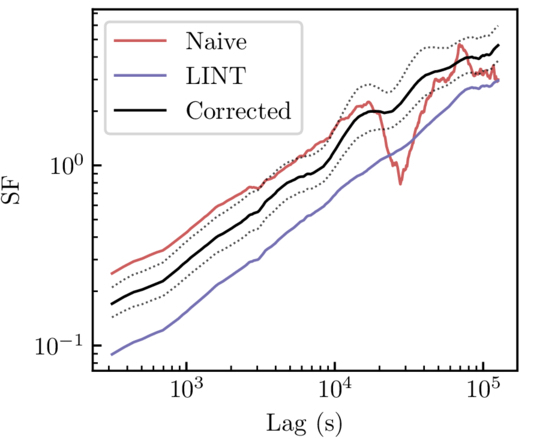
Structure function calculated from uncorrected Voyager 1 data (red), linearly interpolated data (blue), and corrected data (black). Both the linear interpolation method and the correction factor method remove the artifact around a lag of 3×10⁴ seconds, but the correction factor method does not suppress the signal like the linear interpolation method does. [Adapted from Wrench & Parashar 2025]
Finally, the authors applied their validated method to data from Voyager 1. Data from the two Voyager spacecraft are extremely scientifically valuable — no other spacecraft have ventured as far from the Sun and can measure the solar wind at such large distances. The data are also extremely sparse; one segment used in this work was missing 85% of the data. This means that an effective method of correcting these data has potentially huge scientific significance.
Wrench and Parashar applied their correction factor to the Voyager 1 data, showing that this method handily removes artifacts while avoiding the underestimation introduced by linear interpolation. While the authors saved the interpretation of the newly corrected Voyager 1 data for future research, this study makes it clear that even large data gaps needn’t hinder studies of the solar wind.
“Debiasing Structure Function Estimates from Sparse Time Series of the Solar Wind: A Data-Driven Approach,” Daniel Wrench and Tulasi N. Parashar 2025 ApJ 987 28. doi:10.3847/1538-4357/addc6a
The post Minding the Gaps in Solar Wind Data appeared first on AAS Nova.
The giant planet’s bow shock isn’t just deflecting the solar wind, it’s acting as a powerful particle accelerator, firing electrons to relativistic energies of at least 1 MeV, according to a new analysis of data from NASA’s Juno spacecraft.
The post Jupiter Accelerates Electrons to Near-Light Speed, Offering Clues to Cosmic Ray Origins appeared first on Sci.News: Breaking Science News.
Tudo o que de melhor se faz no Algarve em termos de turismo, imobiliário, gastronomia, saúde, golfe e serviços premium estão reunidos numa única plataforma, no South Portugal. E apresenta-se com uma concierge digital chamada Maria.
The post South Portugal: a montra digital do que o Algarve tem de melhor para oferecer appeared first on Tek Notícias.
