❌

Normal view

Monthly Roundup: Science of the Sun

27 April 2026 at 17:00

three images of the Sun

The Sun’s activity history, the sources of tiny jets, and how magnetic fields might impact space weather forecasts: today’s Monthly Roundup introduces a trio of recent research articles from the Astrophysical Journal that tackle hot topics in solar physics.

From 1755 to 2020: Reconstructing Centuries of Solar Activity

Since the 1970s, regular monitoring of the Sun’s magnetic field has allowed researchers to decipher the Sun’s behavior as it cycles through periods of low and high activity. But what resources exist for studying the Sun’s past behavior? To investigate the long-term behavior of the Sun, researchers reach for historical records of sunspots, which stretch back to the 1700s.
maps of simulated photospheric magnetic fields

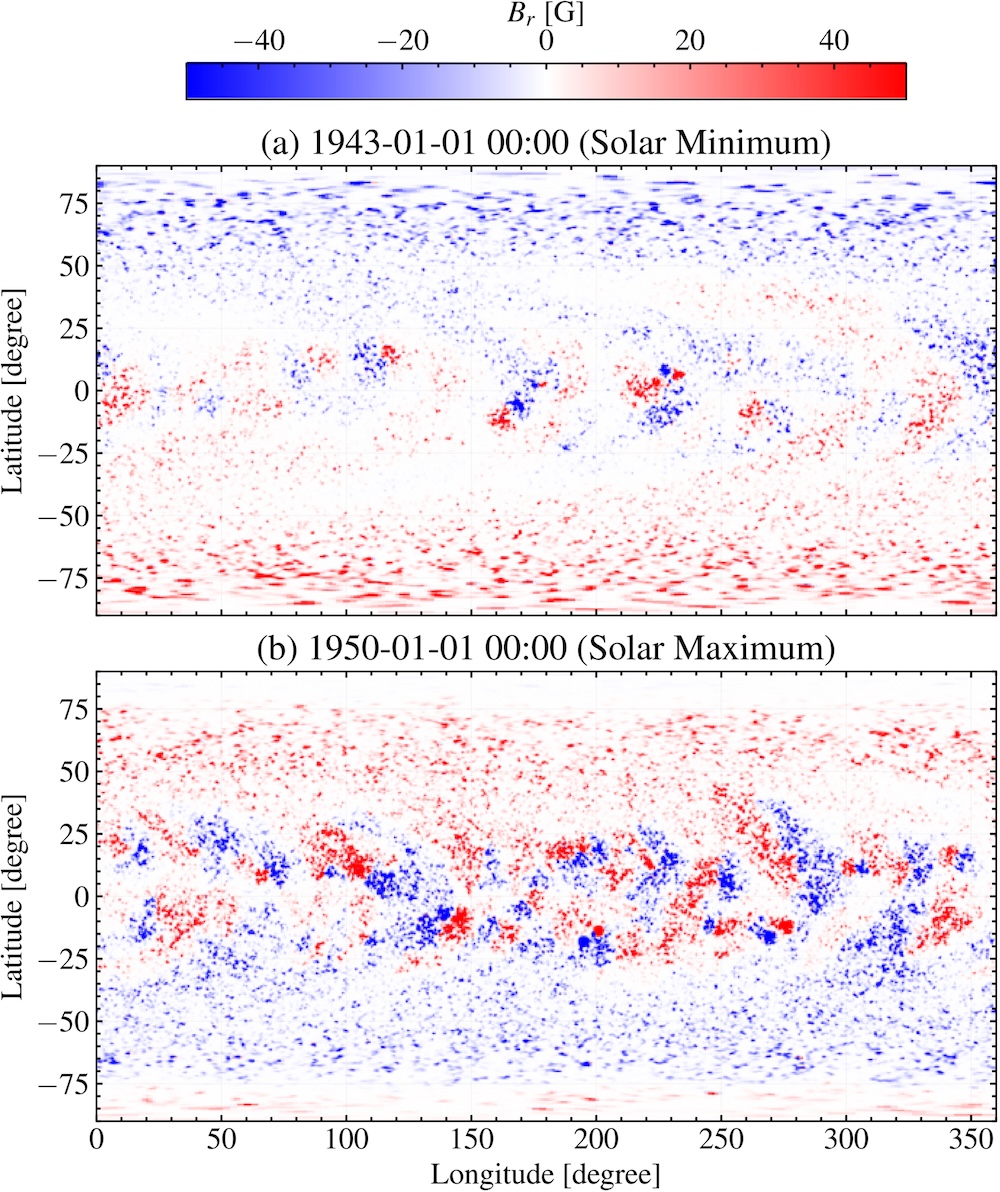
Example maps of the simulated photospheric radial magnetic field during a period of low (top) and high (bottom) solar activity. Click to enlarge. [Jha et al. 2026]

Bibhuti Kumar Jha (Southwest Research Institute) and collaborators explored whether historical records and modern statistics could be used to reconstruct the behavior of the solar magnetic field centuries into the past. Jha’s team used recorded sunspot numbers from 1755 to 2020 as an input for their newly developed Synthetic Active Region Generator, which generates synthetic solar active regions based on known statistics of these regions. This catalog of active regions becomes the input for the Advective Flux Transport model, which simulates the active regions as they emerge and evolve, allowing for an estimation of the magnetic field across the Sun’s disk.

Jha and coauthors found that this method successfully reproduced the expected large-scale behavior of the Sun’s magnetic field across multiple solar cycles, such as the reversal of the polarity of the solar magnetic field near the peak of the activity cycle. While this work highlights the impressive results obtained from combining historical sunspot records with modern sunspot statistics, the team pointed out that this method cannot accurately reproduce all quantities because of the nonlinear nature of the underlying physics. Future work will refine the model further, and in the meantime, the team’s simulated historical magnetic field maps will be made publicly available.

Where Do the Tiniest Coronal Jets Come From?

The Sun’s atmosphere is filled with an ever-shifting maze of magnetic field lines, which reconfigure and release pent-up magnetic energy in a process called magnetic reconnection. Magnetic reconnection can launch particles and heat plasma, and it’s thought to be responsible for driving jets on a variety of scales in the Sun’s tenuous outer atmosphere, or corona. Annu Bura (Indian Institute of Astrophysics; Pondicherry University) and coauthors investigated the physical origins of the smallest of these reconnection driven jets, picoflare jets, using data from the Extreme Ultraviolet Imager on board Solar Orbiter. Solar Orbiter has ventured within 0.3 au of the Sun, and its Extreme Ultraviolet Imager has returned exceptionally precise high-energy images of our home star.
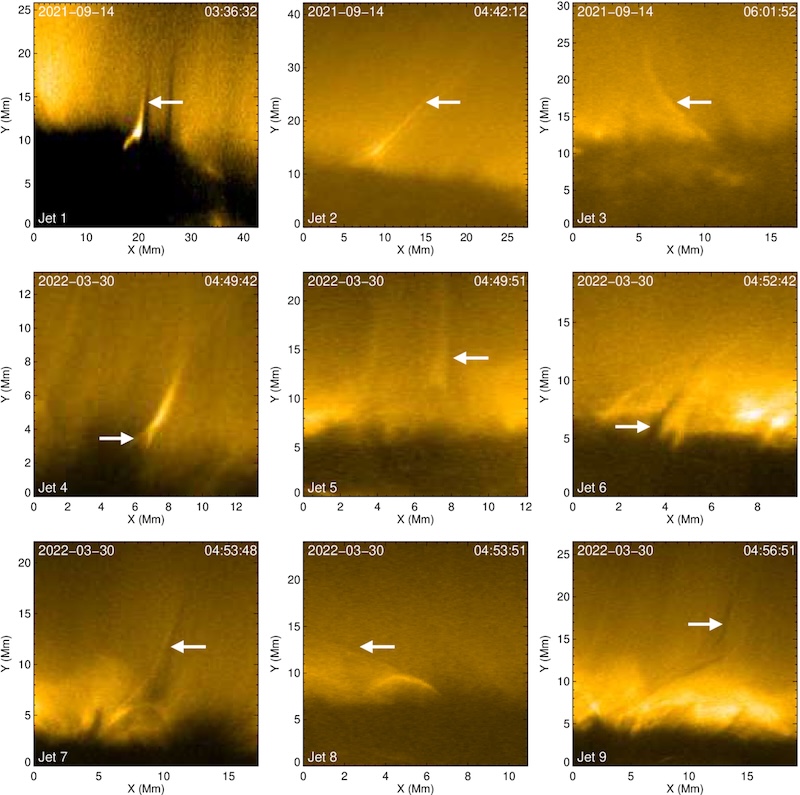
Examples of coronal jetlets

Examples of jets identified in this study. You can see an animation of this figure. [Bura et al. 2026]

Bura and collaborators identified picoflare jets by the presence of a hot, bright spire coupled with a cool, dark streak, forming a structure shaped like the letter “Y” upside down. They found that the bright and dark features were on average 650 and 490 kilometers wide, respectively, with a typical jet length of 16,900 kilometers. They also found that the bright features moved more quickly than the dark features, and the jets tended to last about 6 minutes. Overall, these measurements place the jets in between the scales expected for picoflare jets and slightly larger features called jetlets, though the energies are consistent with expectations for picoflare jets.

Using radiation magnetohydrodynamics simulations, the team explored the origins of their sample of jets. The simulations suggested that the bright features arose from hot, tenuous coronal plasma, while the accompanying dark features were due to cooler, denser plasma venturing upward from deeper in the Sun’s atmosphere, in the chromosphere. Overall, the simulations and observations support a picture in which picoflare-scale jets are driven by magnetic reconnection after magnetic flux emerges through the Sun’s surface. This echoes the formation route of larger coronal jets, suggesting that this process may apply to a wide range of physical scales.

Investigating the Influence of the Solar Polar Magnetic Field

The vast majority of our observations of the Sun have come from within a few degrees of the ecliptic plane, either from telescopes situated on Earth’s surface or from spacecraft that stuck close to the plane of our solar system. With rare but notable exceptions — the Ulysses spacecraft, which measured the Sun’s magnetic field and plasma environment from a near-polar orbit, and Solar Orbiter, which took the first-ever image of the Sun’s poles in November 2025 — the Sun’s poles have remained hidden from our instruments.

Our limited knowledge of the Sun’s polar magnetic field has consequences for our ability to model space weather events like coronal mass ejections. A team led by Xiao Zhang (Chinese Academy of Sciences; University of Chinese Academy of Sciences) has used numerical simulations to investigate how solar polar magnetic field conditions influence the propagation of a coronal mass ejection (CME) through the solar system.
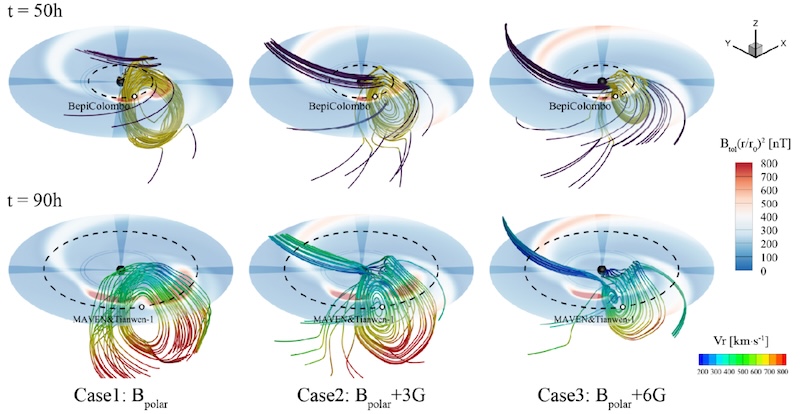
Simulation results showing the propagation and expansion of a coronal mass ejection

Simulation results showing how the propagation and expansion of a CME are affected by the polar magnetic field strength. Click to enlarge. [Zhang et al. 2026]

The team simulated a CME from 4 December 2021, which was observed by the BepiColombo spacecraft at Mercury and Tianwen-1 and MAVEN at Mars. The simulations showed that as the polar magnetic field strength increases, the CME’s movement through the solar system becomes slower. CMEs typically expand as they billow outward from the solar corona and sweep past the planets; increasing the polar magnetic field strength slowed the CME’s expansion as well. A stronger polar magnetic field also alters the background solar wind, making it slower and denser. Overall, these results demonstrate that the strength of the Sun’s poorly constrained polar magnetic field can have a significant impact on the movement and evolution of a CME. In future work, Zhang’s team plans to expand their investigation to a larger sample of CMEs.

Citation

“Historical Reconstruction of Solar Surface Magnetism from Cycles 1–24 Using the Synthetic Active Region Generator and the Advective Flux Transport Model,” Bibhuti Kumar Jha et al 2026 ApJ 997 279. doi:10.3847/1538-4357/ae279a

“On the Origin of Coronal Picoflare Jets,” Annu Bura et al 2026 ApJ 1000 94. doi:10.3847/1538-4357/ae48e6

“Influence of Solar Polar Magnetic Fields on the Propagation of Coronal Mass Ejections,” Xiao Zhang et al 2026 ApJ 1000 200. doi:10.3847/1538-4357/ae4c54

The post Monthly Roundup: Science of the Sun appeared first on AAS Nova.
Astronomers See Braided Magnetic Fields Above a Sunspot

11 March 2026 at 16:00

sunspot

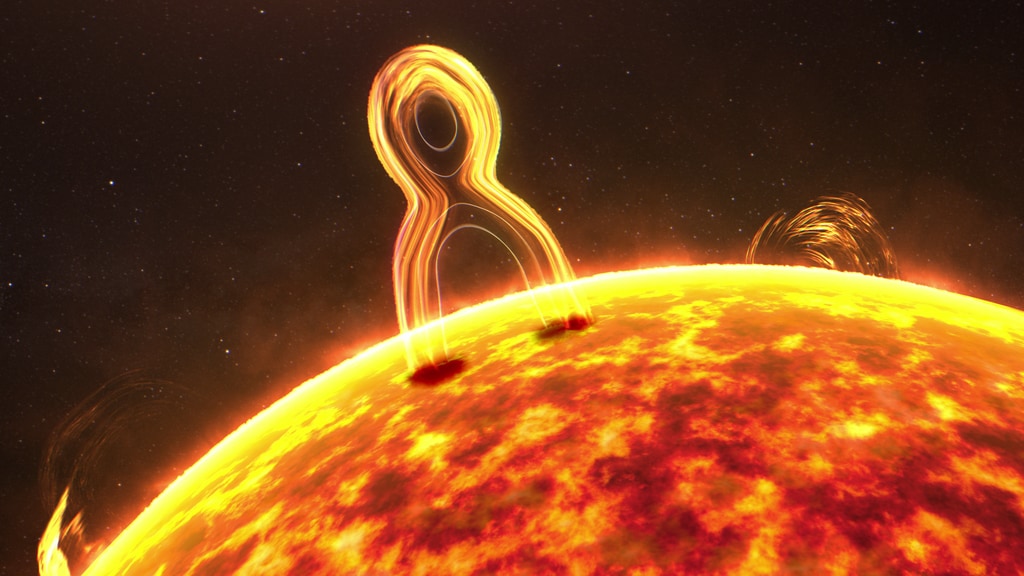
Revealed in high resolution, researchers have spotted complex twisting and braiding motions in fine threads of plasma suspended above a sunspot. The flow of material that followed this braiding provides evidence for magnetic reconnection.

Heating Up the Corona

illustration of magnetic reconnection on the Sun

Magnetic reconnection is common throughout the universe, from Earth’s magnetic field to the jets of supermassive black holes. This illustration shows magnetic reconnection happening on the Sun. [NASA’s Conceptual Image Laboratory]

One of the leading challenges for the field of solar physics is explaining how the temperature of the Sun skyrockets from roughly 6000K at its surface, or photosphere, to more than 106K in its wispy corona. The top candidates for the resolution to this mystery are magnetohydrodynamic waves and magnetic reconnection, in which nearby field lines reorganize into a lower-energy configuration and release magnetic energy.

One way for magnetic reconnection to heat the corona is along magnetic fields that loop up into the corona and are anchored to the solar photosphere. The footprints of these field lines — the spots where they land in the photosphere — wiggle around in random ways. As this happens, the arcing magnetic field lines become braided together, and the twisted magnetic field can then undergo magnetic reconnection, heating the corona.

Braiding and Unbraiding

This process has been explored theoretically, but it’s been challenging to observe directly. As increasingly capable Sun-studying instruments have come online, though, researchers have been able to attain the high resolution needed to see this process at work.

Recently, Hechao Chen (Yunnan University; Peking University; Yunnan Key Laboratory of Solar Physics and Space Science) used data from the New Vacuum Solar Telescope, the Interface Region Imaging Spectrograph, and the Solar Dynamics Observatory to study the braiding and unbraiding of fine magnetic structures above a sunspot.

plasma threads around a sunspot

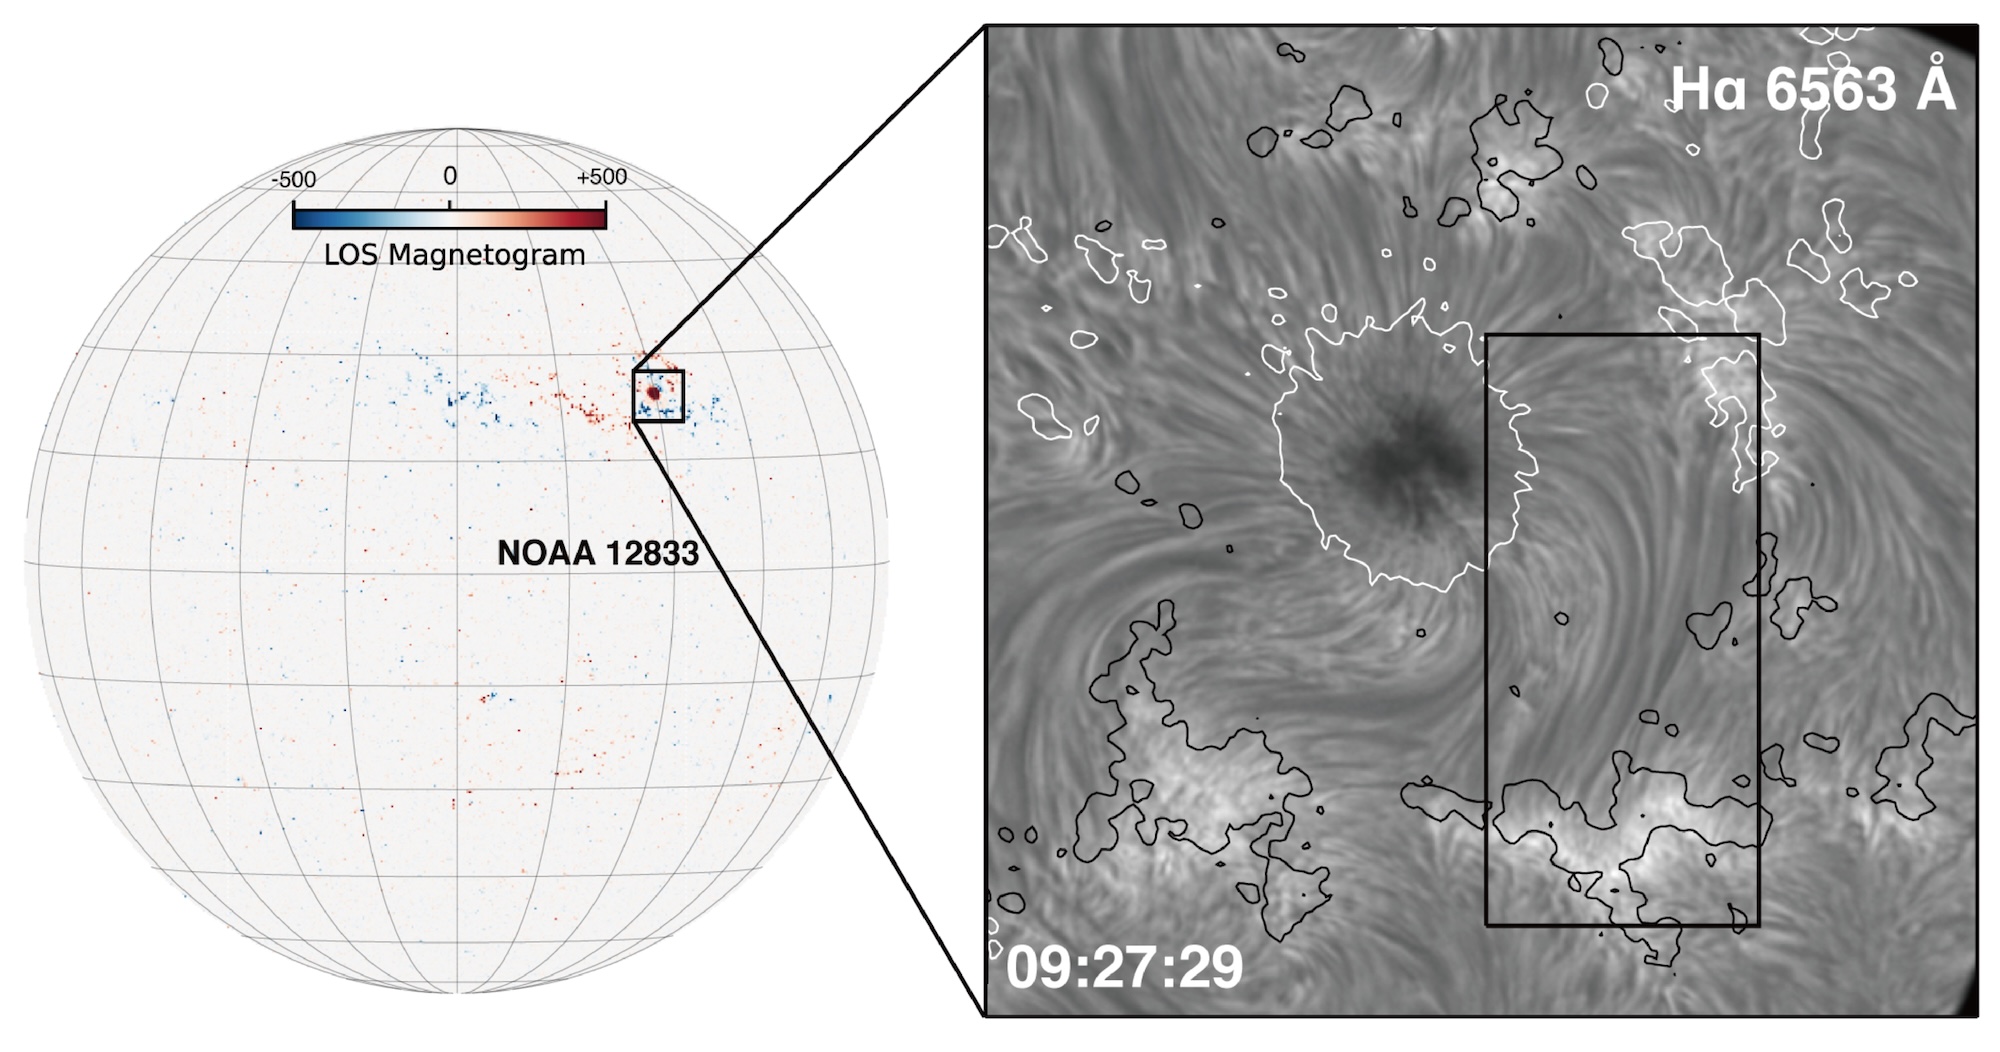
Location of the sunspot featured in this study, plus a closeup of the strands of plasma around the sunspot. Click to enlarge. [Adapted from Chen et al. 2025]

The images show a bundle of narrow strands of plasma stretching about 17,000–22,000 miles (28,000–36,000 kilometers). These plasma threads trace magnetic field lines as they emerge from the sunspot before diving down again in a network region, where the magnetic field is slightly enhanced at the border of a giant convective cell.

Driven by Reconnection

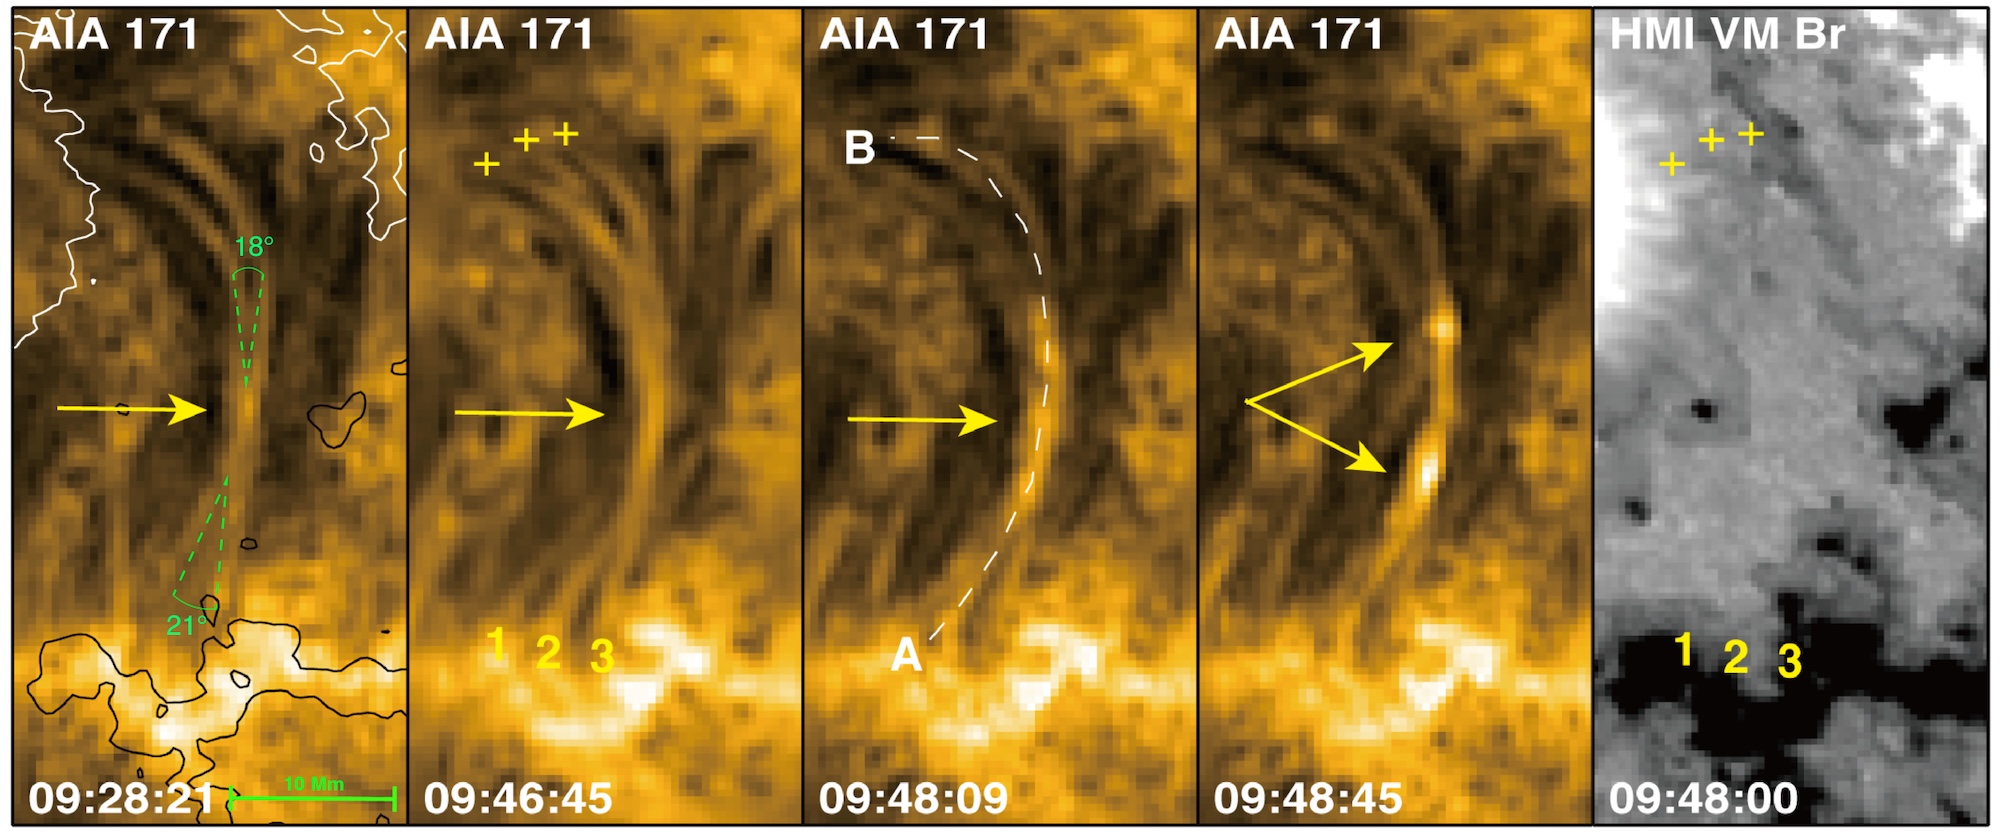
The plasma threads appear to lie nearly parallel to one another at the beginning of the observation. Images from all three facilities showed the plasma threads intertwining, providing evidence for the twisting of magnetic field lines predicted to happen when their footprints move around. (As further evidence for this footprint motion, the team also observed complicated flow patterns near one of the footprints.) This intertwining was followed by a sudden brightening where the threads were most tightly knotted, creating two bright “blobs” that traveled outward toward the footprints. Afterward, the threads resumed their nearly parallel state.

braiding magnetic field structures on the Sun

Images from Solar Dynamics Observatory. The first four images show the Sun at a wavelength of 17.1 nanometers, and the final image shows the radial magnetic field. The arrows indicate the location of the magnetic field braiding and the plasma “blobs.” Click to enlarge. [Adapted from Chen et al. 2025]

The team witnessed these bright points form and travel outward repeatedly, moving with projected velocities of 20–230 km/s. They posited that the motion and heating of these blobs of plasma was driven by the release of magnetic tension, and that the threads returned to a parallel configuration once reconnection was complete. They estimated that each of these events produced 1017 Joules, roughly the energy expected for small-scale reconnection events.

This work beautifully illustrates the process of magnetic reconnection on the Sun, showing how random motions can set the stage for the buildup of magnetic tension. The heating and acceleration of plasma that follows demonstrates how small-scale reconnection events like the ones shown here can provide the energy needed to heat the solar corona.

Citation

“Witnessing Magnetic Reconnection in Tangled Superpenumbral Fibrils Around a Sunspot,” Hechao Chen et al 2025 ApJ 995 94. doi:10.3847/1538-4357/ae12e9

The post Astronomers See Braided Magnetic Fields Above a Sunspot appeared first on AAS Nova.

Featured Image: Mother’s Day Superstorms

28 July 2025 at 17:00

closeup of a solar active region

solar active regions

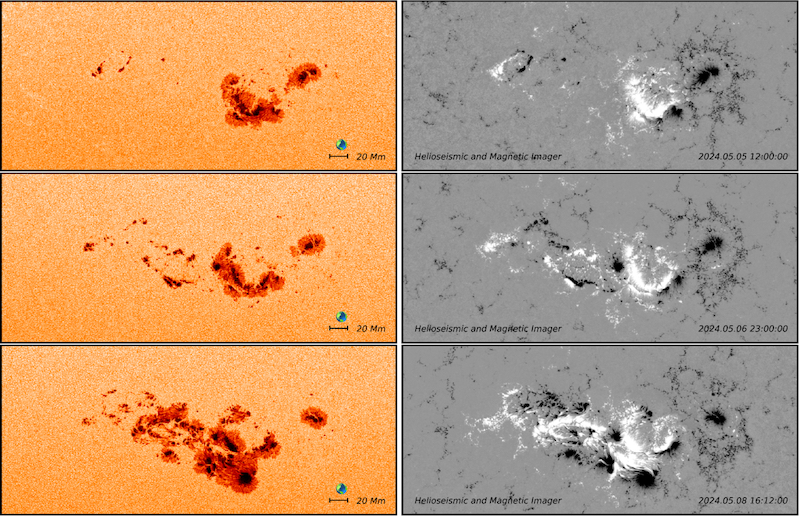
Evolution of a cluster of active regions as seen in continuum emission (left column) and radial magnetic field (right column). Click to enlarge. [Dikpati et al. 2025]

Around Mother’s Day (12 May) last year, the Sun put on a spectacular display of solar activity. A clash between solar active regions incited 14 coronal mass ejections, launched multiple high-energy X-class solar flares, and sent shimmering aurorae as far south as Florida. The images above and to the right show the source of all this excitement: the active regions AR 13664 and AR 13668. In a recent research article, Mausumi Dikpati (High Altitude Observatory) and coauthors examined the origins of this cluster of active regions and why they were such a powerful source of solar storms. Their investigation showed that there are certain regions on the Sun where solar storms are more likely to arise. These regions occur where the Sun’s undulating bands of magnetic activity draw farthest apart, preventing oppositely directed magnetic fields from canceling one another out. In the case of the Mother’s Day superstorms, active regions 13664 and 13668 developed on the heels of a decaying active region, further contributing to their magnetic complexity. Ultimately, this analysis suggested that it may be possible to forecast damaging solar activity weeks in advance by predicting the locations of magnetically complex active regions and following their evolution. To learn more about the active regions that gave rise to the Mother’s Day superstorms, be sure to check out the full article linked below.

Citation

“Mother’s Day Superstorms: Pre- and Post-Storm Evolutionary Patterns of ARs 13664/8,” Mausumi Dikpati et al 2025 ApJ 988 108. doi:10.3847/1538-4357/addd09

The post Featured Image: Mother’s Day Superstorms appeared first on AAS Nova.

❌