❌

Reading view

NASA’s Chandra Discovers Possible Supernova Remnant in Galactic Center

5 Min Read

NASA’s Chandra Discovers Possible Supernova Remnant in Galactic Center

Astronomers may have uncovered a new supernova remnant in a star-forming region near the center of the Milky Way galaxy using data from Chandra and XMM-Newton. If confirmed, this would be one of the closest supernova remnants to the supermassive black hole in the Galactic Center. This image shows the region where the evidence was found, which contains X-rays from Chandra and XMM-Newton, radio data from the MeerKAT telescope in South Africa, and an optical image from the Pan-STARRS telescopes in Hawaii.

Using data from NASA’s Chandra X-ray Observatory, astronomers may have found a supernova remnant in an intriguing neighborhood in the middle of our galaxy. A paper describing these new findings published in The Astrophysical Journal.

Supernova remnants are the expanding remains of exploded stars and provide elements – like iron, oxygen, and silicon – that are critical for the formation of planets and for life as we know it to form and flourish.

This new supernova remnant, if confirmed, would be one of the closest ever discovered to the supermassive black hole at the central region of the Milky Way galaxy, an exotic region crammed with massive stars, long threads of magnetic fields and dense clouds of gas orbiting rapidly around the Galactic Center.

Astronomers may have uncovered a new supernova remnant in a star-forming region near the center of the Milky Way galaxy using data from Chandra and XMM-Newton. If confirmed, this would be one of the closest supernova remnants to the supermassive black hole in the Galactic Center. This image shows the region where the evidence was found, which contains X-rays from Chandra and XMM-Newton, radio data from the MeerKAT telescope in South Africa, and an optical image from the Pan-STARRS telescopes in Hawaii.

A new composite image of this region contains X-rays from Chandra and ESA’s (European Space Agency’s) XMM-Newton mission (shown in blue) as well as radio data from the MeerKAT telescope (shown in red) in South Africa. These have been combined with an optical image from the Pan-STARRS telescopes in Hawaii (red, green, and blue). The plane of the galaxy runs horizontally from left to right in the image, and the central black hole is off to the left of the image.

The evidence for the new supernova remnant, located about 26,000 light-years from Earth, comes from X-ray data from Chandra and XMM-Newton. The X-ray data reveals a “blob” of X-ray emission that may come from the remains of a massive star that self-destructed as a supernova, buried within the larger cloud of expanding gas.

The location of this suspected supernova remnant in the image is labeled with a circle.

It is in a bubble of gas that has had electrons stripped away from hydrogen – called an “H II region” – surrounding a massive, young star. This bubble is a bright source of radio emission called Sagittarius C.

If this is indeed a supernova remnant, then it is expanding at about two million miles per hour and is at least about 1,700 years old. Previously, observations with NASA’s now-retired SOFIA (Stratospheric Observatory for Infrared Astronomy) mission had shown evidence for an expanding shell of gas surrounding Sagittarius C. This gave astronomers a hint that a stellar explosion had occurred in the same spot.

The long filaments seen in the radio image are caused by energetic particles travelling along magnetic fields that are mostly directed perpendicular to the plane of the galaxy.

The nuclear fusion engines of stars create elements from hydrogen and helium that were abundant at the beginning of the universe. When stars explode at the end of their lives as supernovae, they send these newly synthesized elements into interstellar space and provide material for the next generation of stars and planets.

The team of astronomers searched the X-ray data for signs of increased amounts of key elements in the remnant, which would have been caused by the stellar explosion blasting them into space. While they did not see an enhancement, this could imply that the stellar debris has already mixed with the surrounding gas.

An alternative explanation for the X-ray blob is that the hot gas comes from a collection of massive stars in the region. The authors of the recent study don’t think this explanation is likely, because the X-ray emission from the blob is more than ten times brighter than the X-ray emission of large, known stellar clusters with bright, massive stars.

An additional image shows data from NASA’s James Webb Space Telescope added to the X-ray and radio data. The light blue color represents infrared light from gas in the H II region, and the darker blue depicts X-rays from the supernova remnant candidate, on the right side of the image. X-rays near the center of the image are associated with the H II region, possibly caused by material blown away by massive stars that has heated gas to millions of degrees, producing X-rays.

Sagittarius C, close-up image adding NASA’s James Webb Space Telescope data to the X-ray and radio data.

The study’s authors are Zhenlin Zhu and Mark Morris of the University of California, Los Angeles; Gabriele Ponti of Italy’s National Institute for Astrophysics; and Ping Zhou of Nanjing University in China.

NASA’s Marshall Space Flight Center in Huntsville, Alabama, manages the Chandra program. The Smithsonian Astrophysical Observatory’s Chandra X-ray Center controls science operations from Cambridge, Massachusetts, and flight operations from Burlington, Massachusetts.

Visual Description

This release features a composite image of colorful, overlapping clouds, which suggests to astronomers that a supernova remnant may be buried in gas near the center of our Milky Way galaxy.

Set against a backdrop packed with distant stars and other specks of light are two distinct, overlapping clouds. The larger, visually dominant cloud, is red and multifaceted. It has an irregular shape, and features patches of different textures, including pockets that resemble wispy smoke, tangles of faint red veins, and clear streaking lines. This large cloud of expanding gas represents radio data from the MeerKAT telescope in South Africa.

Overlapping with that red cloud is a cloudy blue blob representing X-ray data from NASA’s Chandra X-ray Observatory and ESA’s XMM-Newton. Astronomers suggest that this blue blob of X-ray emissions is the remains of a massive star destroyed by a supernova.

Read more from NASA’s Chandra X-ray Observatory

To learn more about NASA’s Chandra mission, visit:

https://science.nasa.gov/chandra

https://chandra.si.edu

News Media Contact

Megan Watzke
Chandra X-ray Center
Cambridge, Mass.
617-496-7998
mwatzke@cfa.harvard.edu

Joel Wallace
Marshall Space Flight Center, Huntsville, Alabama
256-544-0034
joel.w.wallace@nasa.gov

About the Author

Lee Mohon

The post NASA’s Chandra Discovers Possible Supernova Remnant in Galactic Center appeared first on NASA Science.

  •  

NASA’s Chandra Discovers Possible Supernova Remnant in Galactic Center

5 Min Read

NASA’s Chandra Discovers Possible Supernova Remnant in Galactic Center

Astronomers may have uncovered a new supernova remnant in a star-forming region near the center of the Milky Way galaxy using data from Chandra and XMM-Newton. If confirmed, this would be one of the closest supernova remnants to the supermassive black hole in the Galactic Center. This image shows the region where the evidence was found, which contains X-rays from Chandra and XMM-Newton, radio data from the MeerKAT telescope in South Africa, and an optical image from the Pan-STARRS telescopes in Hawaii.

Using data from NASA’s Chandra X-ray Observatory, astronomers may have found a supernova remnant in an intriguing neighborhood in the middle of our galaxy. A paper describing these new findings published in The Astrophysical Journal.

Supernova remnants are the expanding remains of exploded stars and provide elements – like iron, oxygen, and silicon – that are critical for the formation of planets and for life as we know it to form and flourish.

This new supernova remnant, if confirmed, would be one of the closest ever discovered to the supermassive black hole at the central region of the Milky Way galaxy, an exotic region crammed with massive stars, long threads of magnetic fields and dense clouds of gas orbiting rapidly around the Galactic Center.

Astronomers may have uncovered a new supernova remnant in a star-forming region near the center of the Milky Way galaxy using data from Chandra and XMM-Newton. If confirmed, this would be one of the closest supernova remnants to the supermassive black hole in the Galactic Center. This image shows the region where the evidence was found, which contains X-rays from Chandra and XMM-Newton, radio data from the MeerKAT telescope in South Africa, and an optical image from the Pan-STARRS telescopes in Hawaii.
X-ray: NASA/CXC/UCLA/Z. Zhu et al.; ESA/XMM-Newton; Optical: PanSTARRS; Radio: MeerKAT; Infrared (JWST): NASA/ESA/CSA/STScI; Image Processing: NASA/CXC/SAO/L. Frattare and P. Edmonds

A new composite image of this region contains X-rays from Chandra and ESA’s (European Space Agency’s) XMM-Newton mission (shown in blue) as well as radio data from the MeerKAT telescope (shown in red) in South Africa. These have been combined with an optical image from the Pan-STARRS telescopes in Hawaii (red, green, and blue). The plane of the galaxy runs horizontally from left to right in the image, and the central black hole is off to the left of the image.

The evidence for the new supernova remnant, located about 26,000 light-years from Earth, comes from X-ray data from Chandra and XMM-Newton. The X-ray data reveals a “blob” of X-ray emission that may come from the remains of a massive star that self-destructed as a supernova, buried within the larger cloud of expanding gas.

The location of this suspected supernova remnant in the image is labeled with a circle.

It is in a bubble of gas that has had electrons stripped away from hydrogen – called an “H II region” – surrounding a massive, young star. This bubble is a bright source of radio emission called Sagittarius C.

If this is indeed a supernova remnant, then it is expanding at about two million miles per hour and is at least about 1,700 years old. Previously, observations with NASA’s now-retired SOFIA (Stratospheric Observatory for Infrared Astronomy) mission had shown evidence for an expanding shell of gas surrounding Sagittarius C. This gave astronomers a hint that a stellar explosion had occurred in the same spot.

The long filaments seen in the radio image are caused by energetic particles travelling along magnetic fields that are mostly directed perpendicular to the plane of the galaxy.

The nuclear fusion engines of stars create elements from hydrogen and helium that were abundant at the beginning of the universe. When stars explode at the end of their lives as supernovae, they send these newly synthesized elements into interstellar space and provide material for the next generation of stars and planets.

The team of astronomers searched the X-ray data for signs of increased amounts of key elements in the remnant, which would have been caused by the stellar explosion blasting them into space. While they did not see an enhancement, this could imply that the stellar debris has already mixed with the surrounding gas.

An alternative explanation for the X-ray blob is that the hot gas comes from a collection of massive stars in the region. The authors of the recent study don’t think this explanation is likely, because the X-ray emission from the blob is more than ten times brighter than the X-ray emission of large, known stellar clusters with bright, massive stars.

An additional image shows data from NASA’s James Webb Space Telescope added to the X-ray and radio data. The light blue color represents infrared light from gas in the H II region, and the darker blue depicts X-rays from the supernova remnant candidate, on the right side of the image. X-rays near the center of the image are associated with the H II region, possibly caused by material blown away by massive stars that has heated gas to millions of degrees, producing X-rays.

Sagittarius C, close-up image adding NASA’s James Webb Space Telescope data to the X-ray and radio data.

The study’s authors are Zhenlin Zhu and Mark Morris of the University of California, Los Angeles; Gabriele Ponti of Italy’s National Institute for Astrophysics; and Ping Zhou of Nanjing University in China.

NASA’s Marshall Space Flight Center in Huntsville, Alabama, manages the Chandra program. The Smithsonian Astrophysical Observatory’s Chandra X-ray Center controls science operations from Cambridge, Massachusetts, and flight operations from Burlington, Massachusetts.

Visual Description

This release features a composite image of colorful, overlapping clouds, which suggests to astronomers that a supernova remnant may be buried in gas near the center of our Milky Way galaxy.

Set against a backdrop packed with distant stars and other specks of light are two distinct, overlapping clouds. The larger, visually dominant cloud, is red and multifaceted. It has an irregular shape, and features patches of different textures, including pockets that resemble wispy smoke, tangles of faint red veins, and clear streaking lines. This large cloud of expanding gas represents radio data from the MeerKAT telescope in South Africa.

Overlapping with that red cloud is a cloudy blue blob representing X-ray data from NASA’s Chandra X-ray Observatory and ESA’s XMM-Newton. Astronomers suggest that this blue blob of X-ray emissions is the remains of a massive star destroyed by a supernova.

Read more from NASA’s Chandra X-ray Observatory

To learn more about NASA’s Chandra mission, visit:

https://science.nasa.gov/chandra

https://chandra.si.edu

News Media Contact

Megan Watzke
Chandra X-ray Center
Cambridge, Mass.
617-496-7998
mwatzke@cfa.harvard.edu

Joel Wallace
Marshall Space Flight Center, Huntsville, Alabama
256-544-0034
joel.w.wallace@nasa.gov

About the Author

Lee Mohon

Share

Details

Last Updated
Jun 12, 2026
Editor
Lee Mohon
Contact
Joel Wallace
Location
Marshall Space Flight Center
  •  

NASA Robotic Tech Demo Will Advance Prototype Gamma-Ray Detectors

4 min read

NASA Robotic Tech Demo Will Advance Prototype Gamma-Ray Detectors

A new type of gamma-ray sensor developed by NASA, called AstroPix, will take part in a robotic arm demonstration on the agency’s upcoming Fly Foundational Robots mission, set to launch in late 2027.

Gamma rays are the highest-energy form of light. Scientists observe them coming from events like lightning in Earth’s atmosphere, powerful solar flares from our Sun, and cosmic collisions in distant galaxies. The sensors on the AstroPix technology demonstration are designed to measure gamma rays between 20,000 and 700,000 electron volts. For comparison, visible light’s energy falls between 2 and 3 electron volts.

Current NASA missions, including the Fermi Gamma-ray Space Telescope and Neil Gehrels Swift Observatory, also observe gamma rays, including those with even higher energies.

But for energies between 500,000 to 1 million electron volts, existing detectors are less sensitive. This range is where many powerful explosions called gamma-ray bursts shine the brightest. It’s also where astronomers expect to see the strongest glow from the most massive and distant active galaxies powered by black holes. By stacking AstroPix detectors in future missions, scientists could bridge this gap and improve observations of these cosmic objects to better understand the processes that create and drive them.

“The Fly Foundational Robots spacecraft is also a technology demonstration, so the projects were a good fit for each other,” said Dan Violette, an AstroPix team member and post-doctoral fellow at NASA’s Goddard Space Flight Center in Greenbelt, Maryland. “We need to thoroughly test AstroPix’s performance before we can use the sensors in future science missions. We’ve flown comparable technologies on a scientific balloon mission, and the current prototype eventually will be part of a sounding rocket payload. Many of those flight opportunities only reach near space, though. It’s not often that technology demonstrations like ours can find a ride into orbit.”

A gloved hand holds a detector square
Each AstroPix chip has four silicon pixel gamma-ray detectors. Each of these detectors incorporates 1,225 pixels. AstroPix detectors, which are developed by NASA’s Goddard Space Flight Center in Greenbelt, Md., function similarly to the sensors in cellphone cameras except they are sensitive to gamma-ray light.
Image courtesy of Argonne National Laboratory

Each AstroPix chip contains four silicon pixel gamma-ray detectors, and each detector incorporates 1,225 pixels. The chips function similarly to the sensors in cell phone cameras.

The AstroPix Satellite Technology dEmonstration Payload, also known as A-STEP, will be hosted within the Fly Foundational Robots mission’s Orbital Replacement Unit, a movable module built by Rocket Lab Robotics. Rocket Lab Robotics also will provide a robotic arm that will pick up and reposition the unit during flight and perform in-orbit operations as part of a robotic servicing demonstration. The A-STEP payload will collect its data following the repositioning. Astro Digital will provide the spacecraft.

The Orbital Replacement Unit was designed to support power and data interfaces for a payload, but the original plan called for the robotic arm to reposition the module without one. As mission development progressed, however, the Fly Foundational Robots team identified an opportunity to further maximize the mission’s value by integrating an additional technology demonstration that could fit within the 11.8-inch (30-centimeter) cube.

“The unit already had the volume, power, and data needed to support the AstroPix team’s design,” said Bo Naasz, senior technical lead, In-space Servicing, Assembly, and Manufacturing in the Space Technology Mission Directorate at NASA Headquarters in Washington. “One of our major goals with Fly Foundational Robots is to demonstrate robotic changeout of payloads in orbit, enabling upgrades or improvements to satellites and space instruments at a fraction of the cost of a full mission. Allowing AstroPix to complete its own technology demonstration in orbit is a bonus.”

A satellite in space with Earth in the background
NASA’s Fly Foundational Robots mission will be hosted aboard a spacecraft provided by Astro Digital of Littleton, Colo., as shown in this artist’s concept. The robotic arm, provided by Motiv Space Systems in Pasadena, Calif., will perform a technology demonstration in orbit, including picking up and moving a small box containing the agency’s AstroPix gamma-ray sensors.
Rocket Lab Robotics

The AstroPix team is working to deliver their hardware this September, and it will be integrated into the Fly Foundational Robots payload before final integration onto the spacecraft. The Orbital Replacement Unit will hold the chips and all the associated electronics needed to provide power, and collect and transmit data during flight.

NASA’s Fly Foundational Robots mission is funded through the Space Technology Mission Directorate’s ISAM portfolio, managed at NASA Goddard. Rocket Lab Robotics will supply the mission’s robotic arm system through a NASA Small Business Innovation Research Phase III award. Astro Digital will host the orbital flight test of the arm through NASA’s Flight Opportunities program, managed at NASA’s Armstrong Flight Research Center in Edwards, California. The development of AstroPix was supported by NASA’s Astrophysics Division in the Science Mission Directorate at NASA Headquarters, through the agency’s Astrophysics Research and Analysis Program, and funded through the Nancy Grace Roman Technology Fellowship.

To learn more, visit:

https://go.nasa.gov/3R28tWE

By Jeanette Kazmierczak
Goddard Space Flight Center, Greenbelt, Md.

The post NASA Robotic Tech Demo Will Advance Prototype Gamma-Ray Detectors appeared first on NASA Science.
  •  

NASA Robotic Tech Demo Will Advance Prototype Gamma-Ray Detectors

4 min read

NASA Robotic Tech Demo Will Advance Prototype Gamma-Ray Detectors

A new type of gamma-ray sensor developed by NASA, called AstroPix, will take part in a robotic arm demonstration on the agency’s upcoming Fly Foundational Robots mission, set to launch in late 2027.

Gamma rays are the highest-energy form of light. Scientists observe them coming from events like lightning in Earth’s atmosphere, powerful solar flares from our Sun, and cosmic collisions in distant galaxies. The sensors on the AstroPix technology demonstration are designed to measure gamma rays between 20,000 and 700,000 electron volts. For comparison, visible light’s energy falls between 2 and 3 electron volts.

Current NASA missions, including the Fermi Gamma-ray Space Telescope and Neil Gehrels Swift Observatory, also observe gamma rays, including those with even higher energies.

But for energies between 500,000 to 1 million electron volts, existing detectors are less sensitive. This range is where many powerful explosions called gamma-ray bursts shine the brightest. It’s also where astronomers expect to see the strongest glow from the most massive and distant active galaxies powered by black holes. By stacking AstroPix detectors in future missions, scientists could bridge this gap and improve observations of these cosmic objects to better understand the processes that create and drive them.

“The Fly Foundational Robots spacecraft is also a technology demonstration, so the projects were a good fit for each other,” said Dan Violette, an AstroPix team member and post-doctoral fellow at NASA’s Goddard Space Flight Center in Greenbelt, Maryland. “We need to thoroughly test AstroPix’s performance before we can use the sensors in future science missions. We’ve flown comparable technologies on a scientific balloon mission, and the current prototype eventually will be part of a sounding rocket payload. Many of those flight opportunities only reach near space, though. It’s not often that technology demonstrations like ours can find a ride into orbit.”

A gloved hand holds a detector square
Each AstroPix chip has four silicon pixel gamma-ray detectors. Each of these detectors incorporates 1,225 pixels. AstroPix detectors, which are developed by NASA’s Goddard Space Flight Center in Greenbelt, Md., function similarly to the sensors in cellphone cameras except they are sensitive to gamma-ray light.
Image courtesy of Argonne National Laboratory

Each AstroPix chip contains four silicon pixel gamma-ray detectors, and each detector incorporates 1,225 pixels. The chips function similarly to the sensors in cell phone cameras.

The AstroPix Satellite Technology dEmonstration Payload, also known as A-STEP, will be hosted within the Fly Foundational Robots mission’s Orbital Replacement Unit, a movable module built by Rocket Lab Robotics. Rocket Lab Robotics also will provide a robotic arm that will pick up and reposition the unit during flight and perform in-orbit operations as part of a robotic servicing demonstration. The A-STEP payload will collect its data following the repositioning. Astro Digital will provide the spacecraft.

The Orbital Replacement Unit was designed to support power and data interfaces for a payload, but the original plan called for the robotic arm to reposition the module without one. As mission development progressed, however, the Fly Foundational Robots team identified an opportunity to further maximize the mission’s value by integrating an additional technology demonstration that could fit within the 11.8-inch (30-centimeter) cube.

“The unit already had the volume, power, and data needed to support the AstroPix team’s design,” said Bo Naasz, senior technical lead, In-space Servicing, Assembly, and Manufacturing in the Space Technology Mission Directorate at NASA Headquarters in Washington. “One of our major goals with Fly Foundational Robots is to demonstrate robotic changeout of payloads in orbit, enabling upgrades or improvements to satellites and space instruments at a fraction of the cost of a full mission. Allowing AstroPix to complete its own technology demonstration in orbit is a bonus.”

A satellite in space with Earth in the background
NASA’s Fly Foundational Robots mission will be hosted aboard a spacecraft provided by Astro Digital of Littleton, Colo., as shown in this artist’s concept. The robotic arm, provided by Motiv Space Systems in Pasadena, Calif., will perform a technology demonstration in orbit, including picking up and moving a small box containing the agency’s AstroPix gamma-ray sensors.
Rocket Lab Robotics

The AstroPix team is working to deliver their hardware this September, and it will be integrated into the Fly Foundational Robots payload before final integration onto the spacecraft. The Orbital Replacement Unit will hold the chips and all the associated electronics needed to provide power, and collect and transmit data during flight.

NASA’s Fly Foundational Robots mission is funded through the Space Technology Mission Directorate’s ISAM portfolio, managed at NASA Goddard. Rocket Lab Robotics will supply the mission’s robotic arm system through a NASA Small Business Innovation Research Phase III award. Astro Digital will host the orbital flight test of the arm through NASA’s Flight Opportunities program, managed at NASA’s Armstrong Flight Research Center in Edwards, California. The development of AstroPix was supported by NASA’s Astrophysics Division in the Science Mission Directorate at NASA Headquarters, through the agency’s Astrophysics Research and Analysis Program, and funded through the Nancy Grace Roman Technology Fellowship.

To learn more, visit:

https://go.nasa.gov/3R28tWE

By Jeanette Kazmierczak
Goddard Space Flight Center, Greenbelt, Md.

  •  

New Analysis Confirms the Universe is Still Expanding, Refuting Controversial 2025 Claims and Prompting Immediate Response


A new study has taken a fresh look at a late 2025 Yonsei University study claiming the universe’s expansion is stalling out and instead has found that the universe is still expanding as previously believed.

Led by researchers from the University of Southampton, the team behind the new analysis acknowledged the scientific value of the 2025 team’s work, noting that their calculations were not wrong but lacked the additional data needed to confirm the universe’s expansion rather than refute it.

The lead author of the 2025 study, Dr. Chul Chung, told The Debrief that he and his colleagues “have already submitted our response to Wiseman, Riess et al. 2026 on May 14,” adding that the paper, “Still accelerating: age bias correction in supernova cosmology is robust to host-progenitor age mapping,” has also been posted on arXiv.

“The abstract summarizes the two main issues we identify in Wiseman et al., so I think it provides a concise overview of our position,” Chung told The Debrief.

Challenging Universal Expansion

According to a statement announcing the findings, scientists first confirmed the universe’s expansion was accelerating in 2011, a discovery that won astrophysicists Professor Adam Riess and Professor Brian Schmidt the Nobel Prize in Physics. Since that discovery, cosmological models have incorporated this accelerating expansion, with experiments on dark matter and dark energy attempting to explain it.

Then last year, a separate team of astronomers announced that a new analysis of stellar phenomena indicated that the universe was no longer expanding. Adding to the controversy was the team’s claim that dark energy may not exist, citing the lack of concrete evidence for a universe undergoing accelerating expansion.

According to the Southampton-led team behind the new study, the 2025 study suggested that previous methods used to measure the universe’s expansion, such as measuring supernovae, “were fundamentally flawed.”

“This points to a time-varying dark energy and a universe that is no longer accelerating, representing a potential paradigm shift in cosmology if confirmed,” explained Professor Chul Chung, co-lead author on the study, in a 2025 email to The Debrief.

The claims sent shockwaves through the scientific community, a result that the researchers note could have dismantled the Nobel Prize-winning team’s historic findings, and “nearly three decades of astronomical progress.”

When discussing the 2025 team’s work, the lead author of the new study, Dr Phil Wiseman, said the team’s findings and the resulting debate were not necessarily incorrect. Instead, the Southampton researcher said it was primarily a result of a scientific understanding.

“The previous and well-accepted measurements were, in fact, fine and our current understanding of the fate of the universe remains robust.”

Recalculating Galaxy Masses and White Dwarf Star Ages Reestablishes Expansion

In their reanalysis, the Southampton-led team recalibrated the original data to account for variables not in the original study. According to Wiseman, these included “different host environments and populations.”

For example, the research team looked at Type 1a supernovae, which are violet, extremely bright explosions of white dwarf stars. The authors of the 2025 study claimed that this class of supernova had “different maximum brightness,” which had tricked astronomers into thinking the cosmos was accelerating, when their analysis said it was actually slowing down.

When they took a fresh look at the data, the Southampton team found that they had incorrectly estimated the age of these stars. The new study also says the 2025 team didn’t account for the mass of the galaxies hosting these cosmological phenomena, which they described as “a standard correction used in modern cosmology to prove accuracy.”

When his team factored those data points in, Wiseman said the evidence for a stalling expansion was not supported. Instead, the researcher observed that “the evidence for cosmic acceleration remains remarkably consistent.”

In their reply on ArXiv, the Yonsei University team said the new research failed to factor in two variables of their own, adding that “when these two effects are consistently combined in computing the redshift-dependent magnitude correction, the final correction, and hence the resulting cosmological impact, remain largely unchanged,” from the original 2025 calculations.

“Extraordinary Claims Require Especially Careful Testing”

When discussing the new study’s findings, Southampton Professor Mark Sullivan highlighted the benefits of scientific review, noting that “this is how progress is made.”

“Although this idea did not turn out correct, it has opened up new ways of thinking about how supernovae explode and how we can measure dark energy more accurately,” the researcher added.

Paper co-author, Dr Brodie Popovic agreed, noting that the 2025 study provided astronomers a good opportunity to “go back over all of our assumptions,” adding that “it turns out, yes, we do understand this stuff, and we’re accounting for it in our cosmology measurement.”

In a salute to the Sagan Standard established by astronomer Carl Sagan, which says “extraordinary claims require extraordinary evidence,” Reiss seemed to celebrate the new findings that reestablish his original work by quipping that “extraordinary claims require especially careful testing.”

With the accelerating expansion of the universe seemingly reestablished, at least for now, Dr Wiseman said: “we can get back to trying to understand what dark energy actually is, rather than wondering if it exists at all.”

“Thankfully we have averted this crisis, but the mystery about why the universe is still accelerating in size remains,” he added. 

The study “Still Accelerating: Type Ia supernova cosmology is robust to host galaxy age evolution” was published in Monthly Notices of the Royal Astronomical Society.

Christopher Plain is a Science Fiction and Fantasy novelist and Head Science Writer at The Debrief. Follow and connect with him on X, learn about his books at plainfiction.com, or email him directly at christopher@thedebrief.org.

  •  

Rocket Integration Complete for Katalyst-NASA Swift Boost

LINK attached to the front of the Pegasus XL
Katalyst Space’s LINK robotic servicing satellite awaits encapsulation inside a Northrop Grumman Pegasus XL on June 8, 2026, at NASA’s Wallops Flight Facility in Virginia. The rocket will carry LINK to space for an attempted orbital boost of NASA’s Neil Gehrels Swift Observatory.
NASA/Ron Beard

Engineers completed installation of Katalyst Space’s LINK robotic servicing spacecraft into a Northrop Grumman Pegasus XL rocket on Tuesday, June 9, at NASA’s Wallops Flight Facility in Virginia. Launch is anticipated later this month.

NASA contracted Katalyst to build and launch LINK to raise the altitude of the agency’s Neil Gehrels Swift Observatory.

Our planet’s atmosphere creates drag for spacecraft in low Earth orbit, gradually reducing their altitudes if they don’t have propulsion systems to counteract the effect.

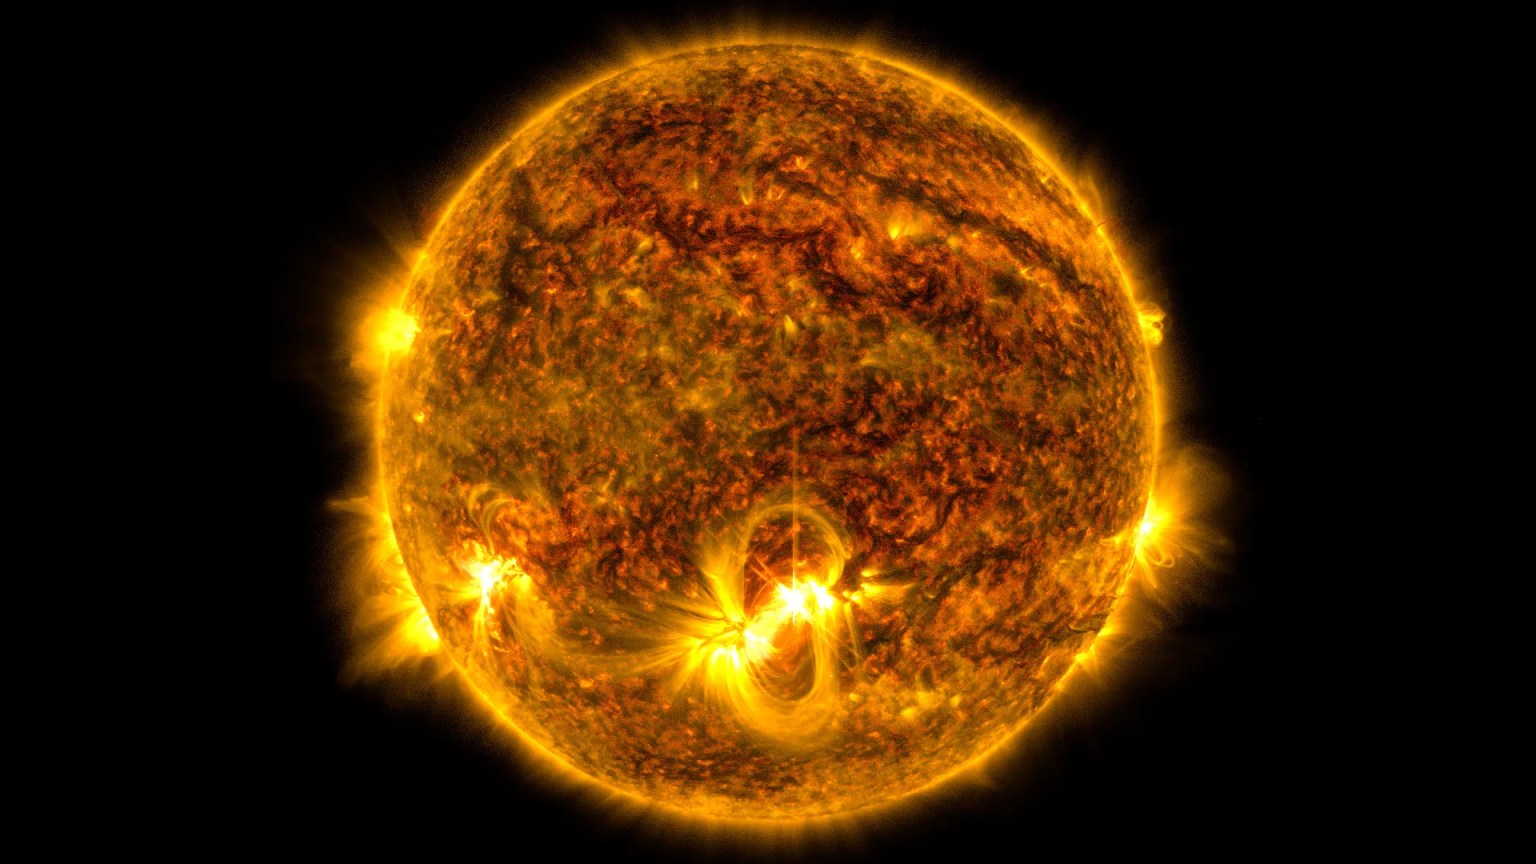
Recent solar activity magnified this effect on Swift, and its orbit decayed faster than anticipated.

An engineer works on a small spacecraft
Katalyst’s Hunter Robertson prepares LINK ahead of it being attached to the Pegasus XL inside the Horizontal Integration Facility at NASA Wallops on June 6, 2026.
NASA/Ron Beard

Based on the orbital and programmatic needs of the mission, Katalyst selected the air-launched Pegasus XL as the best means of reaching the observatory in time to perform the boost maneuver.

Northrop Grumman will launch the rocket using Stargazer, its modified L-1011 aircraft.

NASA has previously used similar versions of this launch vehicle to deploy its ICON (Ionospheric Connection Explorer) and NuSTAR (Nuclear Spectroscopic Telescope Array) spacecraft.

Next, Northrop Grumman engineers will attach Pegasus XL to Stargazer, which will carry it from NASA Wallops to Kwajalein Atoll, part of the Republic of the Marshall Islands in the South Pacific Ocean, for launch.

Learn more about the Swift boost at:

https://science.nasa.gov/mission/swift/swift-boost-mission/

By Jeanette Kazmierczak
Goddard Space Flight Center, Greenbelt, Md.

The post Rocket Integration Complete for Katalyst-NASA Swift Boost appeared first on NASA Science.

  •  

NASA Webb Finds Strongest Evidence Yet for ‘Black Hole Stars’

 
7 Min Read

NASA Webb Finds Strongest Evidence Yet for ‘Black Hole Stars’

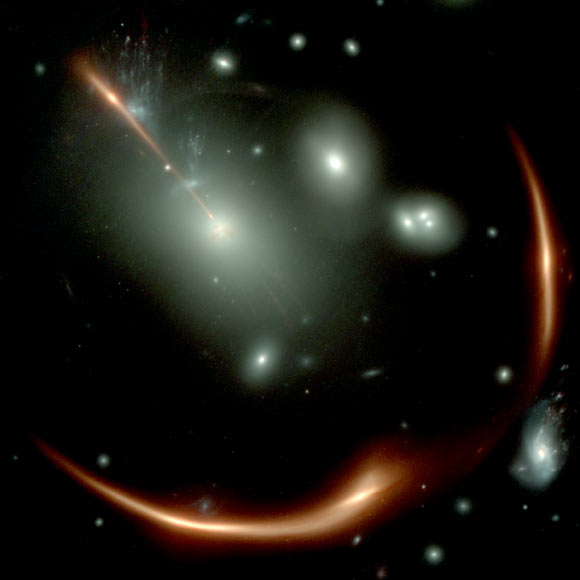
A field of galaxies against the black background of space. In the center is a bright-white elliptical galaxy that is the core of the Abell S1063 galaxy cluster. Around the core are short, curved red lines, which are distant background galaxies magnified and warped by gravitational lensing. A couple of foreground stars appear large and bright with Webb’s signature eight-point diffraction spike pattern. Toward the very bottom, slightly off center toward the right, is a small red dot that is highlighted by an orange square outline. A larger orange square in the top right corner shows the object in more detail. The object, labeled “GLIMPSE-17775” looks like a fuzzy red dot with a yellow core.
While the primary purpose of NASA’s James Webb Space Telescope’s observations of galaxy cluster Abell S1063 was to look for a certain population of stars, scientists obtained a detailed spectrum of GLIMPSE-17775 from the dataset. This little red dot is located behind Abell S1063.
Credits:
Image: NASA, ESA, CSA, Vasily Kokorev (UT Austin); Image Processing: Alyssa Pagan (STScI)

The complex puzzle known as little red dots has become more complete since their initial discovery by NASA’s James Webb Space Telescope in 2022. Now a particular little red dot’s spectrum is helping connect many of the pieces.

A team of astronomers led by Vasily Kokorev at the University of Texas at Austin identified the lucky dot in question: GLIMPSE-17775. By carefully analyzing the dot’s spectrum captured by Webb — the deepest spectrum to date of a little red dot — the research team has identified multiple lines of evidence, all of which support the interpretation that GLIMPSE-17775 is a supermassive black hole enveloped in a dense cocoon of partially ionized gas, a model referred to as the BH* (black hole star) scenario. A paper describing the results was published today in The Astrophysical Journal.

“I think part of the scientific community is converging on a singular picture — that little red dots can be explained by black hole star models. But none of the previous little red dots have all of the pieces of evidence in the same place,” said Kokorev, lead author of the study. “With GLIMPSE-17775 we can test these models because of how deep and amazing this source’s spectrum is.”

Image: Abell S1063 with Pullout of GLIMPSE-17775 (NIRCam Image)

A field of galaxies against the black background of space. In the center is a bright-white elliptical galaxy that is the core of the Abell S1063 galaxy cluster. Around the core are short, curved red lines, which are distant background galaxies magnified and warped by gravitational lensing. A couple of foreground stars appear large and bright with Webbu2019s signature eight-point diffraction spike pattern. Toward the very bottom, slightly off center toward the right, is a small red dot that is highlighted by an orange square outline. A larger orange square in the top right corner shows the object in more detail. The object, labeled u201cGLIMPSE-17775u201d looks like a fuzzy red dot with a yellow core.
While the primary purpose of NASA’s James Webb Space Telescope’s observations of galaxy cluster Abell S1063 was to look for a certain population of stars, scientists obtained a detailed spectrum of GLIMPSE-17775 from the dataset. This little red dot is located behind Abell S1063.
Image: NASA, ESA, CSA, Vasily Kokorev (UT Austin); Image Processing: Alyssa Pagan (STScI)

Connecting puzzle pieces

Soon after Webb first began science operations, it discovered a new, mysterious type of object in the very early universe – abundant red objects that emerged about 600 million years after the big bang. Scientists have explored multiple explanations for these little red dots, including the black hole star scenario.

A set of fortunate circumstances brought about this new, elaborate spectrum of a little red dot. The little red dot that would come to be known as GLIMPSE-17775 was fortunately included in Webb’s imaging and spectroscopy efforts for a project that sought to look for Population III stars and faint galaxies in galaxy cluster Abell S1063. This little red dot is more distant than the galaxy cluster and magnified by gravitational lensing. (GLIMPSE-17775 has a cosmological redshift of 3.5, meaning it existed about 1.8 billion years after the big bang.)

While Webb provided a 30-hour spectrum of the little red dot, the effect of gravitational lensing made it equivalent to 80 hours of telescope time. This combination of Webb’s infrared sensitivity and nature’s own “magnifying glass” amplified the amount of detail that could be gleaned from GLIMPSE-17775. The result was more than 40 spectral lines from this small, red source, which is the most detailed little red dot spectrum to date.

“When we saw the spectrum for the first time, it was like having all the pieces of a puzzle scattered on the floor,” said Kokorev. “We picked up each piece of the puzzle, measured the lines, and started combining the different pieces into a mosaic. Maybe a few pieces looked like nothing at first, but then a couple of them came together, and we realized that there was something there.”

The spectroscopic data collected by Webb contains multiple lines of evidence that support the interpretation that little red dot GLIMPSE-17775 is a black hole star: a rapidly accreting, or growing, black hole enveloped in a dense gas cocoon, which is reprocessing the light emitted from near the black hole and producing the features seen in the spectrum.

Image: Evidence of a ‘Black Hole Star’

Graphic titled “GLIMPSE-17775, Evidence of a ‘Black Hole Star, NIRSpec, Multi-Object Spectroscopy’” shows a graph of amount of light blocked on the y-axis versus wavelength of light, microns. The bottom of the y-axis is labeled “fainter,” and the top is labeled “brighter.” The x-axis starts with 2.80 microns at left and continues in increments of five, ending with 3.05 microns at right. A key at top left has a white line labeled “Data” and a small blue square labeled “Model of light scattered through hot dense gas.” The white data line is stepped with a large bell-like curve that peaks at 2.95 microns. It is labeled “hydrogen” and highlighted by a semi-transparent purple. The data also forms small peaks highlighted with different colors: around 2.84 microns, oxygen, green; 3.0 microns, helium, red; and 3.02 microns, sulfur, orange. The blue filling, representing the model, approximately fills the bell-like curve that marks hydrogen. A smaller peak of blue also approximately fills the data’s peak of helium.
NASA’s James Webb Space Telescope captured the deepest spectrum to date of a little red dot. More than 40 spectral lines have been discerned from the data, many of which independently support the theory that GLIMPSE-17775 is a black hole enshrouded by a hot, dense gas cocoon.
Illustration: NASA, ESA, CSA, Vasily Kokorev (UT Austin); Designer: Leah Hustak (STScI)

Lines of evidence

Among the 40-plus lines that the team detected in GLIMPSE-17775’s spectrum were various independent indicators that all align with the BH* scenario. For example, the team found that many of the spectral lines, such as hydrogen, oxygen, and helium, do not fit a simple model of a rotating gas cloud. Instead, the best fit model includes a broadening effect known as electron scattering, a telltale sign that a dense, layered gas cocoon is enshrouding this source. 

The strength and ratios of certain lines to each other, most notably the 16 iron lines that compose what the team has dubbed an “iron forest” and certain oxygen lines, require a high-energy source to produce them, like a rapidly accreting black hole. Additionally, astronomers noted the fluorescence and absorption of helium in the spectrum, both of which individually suggest that there is a dense medium enveloping a powerful source.

The BH* scenario not only fits GLIMPSE-17775; it also accounts for why most little red dots are faint in X-rays, since any such emission is likely absorbed by the dense gas cocoon.

One missing element of the GLIMPSE-17775 puzzle piece is the part of the spectrum that would reveal what’s known as a Balmer break, or a strong dip in the emitted light that’s a signature characteristic of little red dots. To build a more comprehensive understanding of this little red dot, the team incorporated ancillary data from two observing programs that used NASA’s Hubble Space Telescope: the Frontier Fields and BUFFALO (Beyond Ultra-deep Frontier Fields And Legacy Observations) programs.

The Webb and Hubble data together help explain why the Balmer break is weaker than what typically is found in other little red dots: A giant host galaxy is surrounding GLIMPSE-17775. Although a little red dot’s host galaxy is not something that has been usually seen at such scale before, it isn’t inconsistent with the dense gas cocoon model. The black hole star model of little red dots attributes excess blue light to stars in the host galaxy.

When Webb first discovered little red dots, some researchers thought these objects had “broken cosmology,” unsure how galaxies could have grown so big so quickly in the early universe to account for all this light coming from their stars. However, the team believes the GLIMPSE-17775 puzzle piece fits nicely in the existing framework of the universe’s evolutionary history, because black hole masses don’t need to be as high in order to explain the broad emission lines.

“Everything fits, nothing is broken, and I think that makes the puzzle that is our universe even better,” said Kokorev. “Looking ahead, I’m eager to dive deeper and learn about what is powering the central engines of little red dots. While we think it’s a black hole, there are some other interesting theories being proposed, which is exciting. Maybe in a year or two, we’ll have the final answer to what powers these sources.” 

The James Webb Space Telescope is the world’s premier space science observatory. Webb is solving mysteries in our solar system, looking beyond to distant worlds around other stars, and probing the mysterious structures and origins of our universe and our place in it. Webb is an international program led by NASA with its partners, ESA (European Space Agency) and CSA (Canadian Space Agency).

To learn more about Webb, visit:

https://science.nasa.gov/webb

Downloads & Related Information

The following sections contain links to download this article’s images and videos in all available resolutions followed by related information links, media contacts, and if available, research paper and Spanish translation links.

Related Images & Videos

A field of galaxies against the black background of space. In the center is a bright-white elliptical galaxy that is the core of the Abell S1063 galaxy cluster. Around the core are short, curved red lines, which are distant background galaxies magnified and warped by gravitational lensing. A couple of foreground stars appear large and bright with Webbu2019s signature eight-point diffraction spike pattern. Toward the very bottom, slightly off center toward the right, is a small red dot that is highlighted by an orange square outline. A larger orange square in the top right corner shows the object in more detail. The object, labeled u201cGLIMPSE-17775u201d looks like a fuzzy red dot with a yellow core.

Abell S1063 with Pullout of GLIMPSE-17775 (NIRCam Image)

While the primary purpose of NASA’s James Webb Space Telescope’s observations of galaxy cluster Abell S1063 was to look for a certain population of stars, scientists obtained a detailed spectrum of GLIMPSE-17775 from the dataset. This little red dot is located behind Abell S1063.

Graphic titled u201cGLIMPSE-17775, Evidence of a u2018Black Hole Star, NIRSpec, Multi-Object Spectroscopyu2019u201d shows a graph of amount of light blocked on the y-axis versus wavelength of light, microns. The bottom of the y-axis is labeled u201cfainter,u201d and the top is labeled u201cbrighter.u201d The x-axis starts with 2.80 microns at left and continues in increments of five, ending with 3.05 microns at right. A key at top left has a white line labeled u201cDatau201d and a small blue square labeled u201cModel of light scattered through hot dense gas.u201d The white data line is stepped with a large bell-like curve that peaks at 2.95 microns. It is labeled u201chydrogenu201d and highlighted by a semi-transparent purple. The data also forms small peaks highlighted with different colors: around 2.84 microns, oxygen, green; 3.0 microns, helium, red; and 3.02 microns, sulfur, orange. The blue filling, representing the model, approximately fills the bell-like curve that marks hydrogen. A smaller peak of blue also approximately fills the datau2019s peak of helium.

Evidence of a ‘Black Hole Star’

NASA’s James Webb Space Telescope captured the deepest spectrum to date of a little red dot. More than 40 spectral lines have been discerned from the data, many of which independently support the theory that GLIMPSE-17775 is a black hole enshrouded by a hot, dense gas cocoon.

Related Links

Read more: Black Hole Basics

Explore more: ViewSpace | Black Holes: Searching for the unseen

Watch: NASA Black Hole Visualization Takes Viewers Beyond the Brink

Watch: What Webb Learns from Light

Explore more: NASA’s Universe of Learning: Black Hole Resources

Read more: NASA Connects Little Red Dots with Chandra, Webb

More Webb News

More Webb Images

Webb Science Themes

Webb Mission Page


Share

Details

Last Updated
Jun 11, 2026

Contact
Media

Laura Betz
NASA’s Goddard Space Flight Center
Greenbelt, Maryland
laura.e.betz@nasa.gov

Abigail Major
Space Telescope Science Institute
Baltimore, Maryland

Christine Pulliam
Space Telescope Science Institute
Baltimore, Maryland

  •  

NASA Webb Finds Strongest Evidence Yet for ‘Black Hole Stars’

 
7 Min Read

NASA Webb Finds Strongest Evidence Yet for ‘Black Hole Stars’

A field of galaxies against the black background of space. In the center is a bright-white elliptical galaxy that is the core of the Abell S1063 galaxy cluster. Around the core are short, curved red lines, which are distant background galaxies magnified and warped by gravitational lensing. A couple of foreground stars appear large and bright with Webb’s signature eight-point diffraction spike pattern. Toward the very bottom, slightly off center toward the right, is a small red dot that is highlighted by an orange square outline. A larger orange square in the top right corner shows the object in more detail. The object, labeled “GLIMPSE-17775” looks like a fuzzy red dot with a yellow core.
While the primary purpose of NASA’s James Webb Space Telescope’s observations of galaxy cluster Abell S1063 was to look for a certain population of stars, scientists obtained a detailed spectrum of GLIMPSE-17775 from the dataset. This little red dot is located behind Abell S1063.
Credits: Image: NASA, ESA, CSA, Vasily Kokorev (UT Austin); Image Processing: Alyssa Pagan (STScI)

The complex puzzle known as little red dots has become more complete since their initial discovery by NASA’s James Webb Space Telescope in 2022. Now a particular little red dot’s spectrum is helping connect many of the pieces.

A team of astronomers led by Vasily Kokorev at the University of Texas at Austin identified the lucky dot in question: GLIMPSE-17775. By carefully analyzing the dot’s spectrum captured by Webb — the deepest spectrum to date of a little red dot — the research team has identified multiple lines of evidence, all of which support the interpretation that GLIMPSE-17775 is a supermassive black hole enveloped in a dense cocoon of partially ionized gas, a model referred to as the BH* (black hole star) scenario. A paper describing the results was published today in The Astrophysical Journal.

“I think part of the scientific community is converging on a singular picture — that little red dots can be explained by black hole star models. But none of the previous little red dots have all of the pieces of evidence in the same place,” said Kokorev, lead author of the study. “With GLIMPSE-17775 we can test these models because of how deep and amazing this source’s spectrum is.”

Image: Abell S1063 with Pullout of GLIMPSE-17775 (NIRCam Image)

A field of galaxies against the black background of space. In the center is a bright-white elliptical galaxy that is the core of the Abell S1063 galaxy cluster. Around the core are short, curved red lines, which are distant background galaxies magnified and warped by gravitational lensing. A couple of foreground stars appear large and bright with Webbu2019s signature eight-point diffraction spike pattern. Toward the very bottom, slightly off center toward the right, is a small red dot that is highlighted by an orange square outline. A larger orange square in the top right corner shows the object in more detail. The object, labeled u201cGLIMPSE-17775u201d looks like a fuzzy red dot with a yellow core.
While the primary purpose of NASA’s James Webb Space Telescope’s observations of galaxy cluster Abell S1063 was to look for a certain population of stars, scientists obtained a detailed spectrum of GLIMPSE-17775 from the dataset. This little red dot is located behind Abell S1063.
Image: NASA, ESA, CSA, Vasily Kokorev (UT Austin); Image Processing: Alyssa Pagan (STScI)

Connecting puzzle pieces

Soon after Webb first began science operations, it discovered a new, mysterious type of object in the very early universe – abundant red objects that emerged about 600 million years after the big bang. Scientists have explored multiple explanations for these little red dots, including the black hole star scenario.

A set of fortunate circumstances brought about this new, elaborate spectrum of a little red dot. The little red dot that would come to be known as GLIMPSE-17775 was fortunately included in Webb’s imaging and spectroscopy efforts for a project that sought to look for Population III stars and faint galaxies in galaxy cluster Abell S1063. This little red dot is more distant than the galaxy cluster and magnified by gravitational lensing. (GLIMPSE-17775 has a cosmological redshift of 3.5, meaning it existed about 1.8 billion years after the big bang.)

While Webb provided a 30-hour spectrum of the little red dot, the effect of gravitational lensing made it equivalent to 80 hours of telescope time. This combination of Webb’s infrared sensitivity and nature’s own “magnifying glass” amplified the amount of detail that could be gleaned from GLIMPSE-17775. The result was more than 40 spectral lines from this small, red source, which is the most detailed little red dot spectrum to date.

“When we saw the spectrum for the first time, it was like having all the pieces of a puzzle scattered on the floor,” said Kokorev. “We picked up each piece of the puzzle, measured the lines, and started combining the different pieces into a mosaic. Maybe a few pieces looked like nothing at first, but then a couple of them came together, and we realized that there was something there.”

The spectroscopic data collected by Webb contains multiple lines of evidence that support the interpretation that little red dot GLIMPSE-17775 is a black hole star: a rapidly accreting, or growing, black hole enveloped in a dense gas cocoon, which is reprocessing the light emitted from near the black hole and producing the features seen in the spectrum.

Image: Evidence of a ‘Black Hole Star’

Graphic titled “GLIMPSE-17775, Evidence of a ‘Black Hole Star, NIRSpec, Multi-Object Spectroscopy’” shows a graph of amount of light blocked on the y-axis versus wavelength of light, microns. The bottom of the y-axis is labeled “fainter,” and the top is labeled “brighter.” The x-axis starts with 2.80 microns at left and continues in increments of five, ending with 3.05 microns at right. A key at top left has a white line labeled “Data” and a small blue square labeled “Model of light scattered through hot dense gas.” The white data line is stepped with a large bell-like curve that peaks at 2.95 microns. It is labeled “hydrogen” and highlighted by a semi-transparent purple. The data also forms small peaks highlighted with different colors: around 2.84 microns, oxygen, green; 3.0 microns, helium, red; and 3.02 microns, sulfur, orange. The blue filling, representing the model, approximately fills the bell-like curve that marks hydrogen. A smaller peak of blue also approximately fills the data’s peak of helium.
NASA’s James Webb Space Telescope captured the deepest spectrum to date of a little red dot. More than 40 spectral lines have been discerned from the data, many of which independently support the theory that GLIMPSE-17775 is a black hole enshrouded by a hot, dense gas cocoon.
Illustration: NASA, ESA, CSA, Vasily Kokorev (UT Austin); Designer: Leah Hustak (STScI)

Lines of evidence

Among the 40-plus lines that the team detected in GLIMPSE-17775’s spectrum were various independent indicators that all align with the BH* scenario. For example, the team found that many of the spectral lines, such as hydrogen, oxygen, and helium, do not fit a simple model of a rotating gas cloud. Instead, the best fit model includes a broadening effect known as electron scattering, a telltale sign that a dense, layered gas cocoon is enshrouding this source. 

The strength and ratios of certain lines to each other, most notably the 16 iron lines that compose what the team has dubbed an “iron forest” and certain oxygen lines, require a high-energy source to produce them, like a rapidly accreting black hole. Additionally, astronomers noted the fluorescence and absorption of helium in the spectrum, both of which individually suggest that there is a dense medium enveloping a powerful source.

The BH* scenario not only fits GLIMPSE-17775; it also accounts for why most little red dots are faint in X-rays, since any such emission is likely absorbed by the dense gas cocoon.

One missing element of the GLIMPSE-17775 puzzle piece is the part of the spectrum that would reveal what’s known as a Balmer break, or a strong dip in the emitted light that’s a signature characteristic of little red dots. To build a more comprehensive understanding of this little red dot, the team incorporated ancillary data from two observing programs that used NASA’s Hubble Space Telescope: the Frontier Fields and BUFFALO (Beyond Ultra-deep Frontier Fields And Legacy Observations) programs.

The Webb and Hubble data together help explain why the Balmer break is weaker than what typically is found in other little red dots: A giant host galaxy is surrounding GLIMPSE-17775. Although a little red dot’s host galaxy is not something that has been usually seen at such scale before, it isn’t inconsistent with the dense gas cocoon model. The black hole star model of little red dots attributes excess blue light to stars in the host galaxy.

When Webb first discovered little red dots, some researchers thought these objects had “broken cosmology,” unsure how galaxies could have grown so big so quickly in the early universe to account for all this light coming from their stars. However, the team believes the GLIMPSE-17775 puzzle piece fits nicely in the existing framework of the universe’s evolutionary history, because black hole masses don’t need to be as high in order to explain the broad emission lines.

“Everything fits, nothing is broken, and I think that makes the puzzle that is our universe even better,” said Kokorev. “Looking ahead, I’m eager to dive deeper and learn about what is powering the central engines of little red dots. While we think it’s a black hole, there are some other interesting theories being proposed, which is exciting. Maybe in a year or two, we’ll have the final answer to what powers these sources.” 

The James Webb Space Telescope is the world’s premier space science observatory. Webb is solving mysteries in our solar system, looking beyond to distant worlds around other stars, and probing the mysterious structures and origins of our universe and our place in it. Webb is an international program led by NASA with its partners, ESA (European Space Agency) and CSA (Canadian Space Agency).

To learn more about Webb, visit:

https://science.nasa.gov/webb

Downloads & Related Information

The following sections contain links to download this article’s images and videos in all available resolutions followed by related information links, media contacts, and if available, research paper and Spanish translation links.

Related Images & Videos

A field of galaxies against the black background of space. In the center is a bright-white elliptical galaxy that is the core of the Abell S1063 galaxy cluster. Around the core are short, curved red lines, which are distant background galaxies magnified and warped by gravitational lensing. A couple of foreground stars appear large and bright with Webbu2019s signature eight-point diffraction spike pattern. Toward the very bottom, slightly off center toward the right, is a small red dot that is highlighted by an orange square outline. A larger orange square in the top right corner shows the object in more detail. The object, labeled u201cGLIMPSE-17775u201d looks like a fuzzy red dot with a yellow core.

Abell S1063 with Pullout of GLIMPSE-17775 (NIRCam Image)

While the primary purpose of NASA’s James Webb Space Telescope’s observations of galaxy cluster Abell S1063 was to look for a certain population of stars, scientists obtained a detailed spectrum of GLIMPSE-17775 from the dataset. This little red dot is located behind Abell S1063.

Graphic titled u201cGLIMPSE-17775, Evidence of a u2018Black Hole Star, NIRSpec, Multi-Object Spectroscopyu2019u201d shows a graph of amount of light blocked on the y-axis versus wavelength of light, microns. The bottom of the y-axis is labeled u201cfainter,u201d and the top is labeled u201cbrighter.u201d The x-axis starts with 2.80 microns at left and continues in increments of five, ending with 3.05 microns at right. A key at top left has a white line labeled u201cDatau201d and a small blue square labeled u201cModel of light scattered through hot dense gas.u201d The white data line is stepped with a large bell-like curve that peaks at 2.95 microns. It is labeled u201chydrogenu201d and highlighted by a semi-transparent purple. The data also forms small peaks highlighted with different colors: around 2.84 microns, oxygen, green; 3.0 microns, helium, red; and 3.02 microns, sulfur, orange. The blue filling, representing the model, approximately fills the bell-like curve that marks hydrogen. A smaller peak of blue also approximately fills the datau2019s peak of helium.

Evidence of a ‘Black Hole Star’

NASA’s James Webb Space Telescope captured the deepest spectrum to date of a little red dot. More than 40 spectral lines have been discerned from the data, many of which independently support the theory that GLIMPSE-17775 is a black hole enshrouded by a hot, dense gas cocoon.

Related Links

Read more: Black Hole Basics

Explore more: ViewSpace | Black Holes: Searching for the unseen

Watch: NASA Black Hole Visualization Takes Viewers Beyond the Brink

Watch: What Webb Learns from Light

Explore more: NASA’s Universe of Learning: Black Hole Resources

More Webb News

More Webb Images

Webb Science Themes

Webb Mission Page

Share

Details

Last Updated
Jun 10, 2026
Contact
Media

Laura Betz
NASA’s Goddard Space Flight Center
Greenbelt, Maryland
laura.e.betz@nasa.gov

Abigail Major
Space Telescope Science Institute
Baltimore, Maryland

Christine Pulliam
Space Telescope Science Institute
Baltimore, Maryland

The post NASA Webb Finds Strongest Evidence Yet for ‘Black Hole Stars’ appeared first on NASA Science.

  •  

The Oldest Starlight

illustration of stars in the early universe

Editor’s Note: Astrobites is a graduate-student-run organization that digests astrophysical literature for undergraduate students. As part of the partnership between the AAS and astrobites, we occasionally repost astrobites content here at AAS Nova. We hope you enjoy this post from astrobites; the original can be viewed at astrobites.org.

Title: Hunting for the First Explosions at the High-Redshift Frontier
Authors: Junehyoung Jeon et al.
First Author’s Institution: The University of Texas at Austin
Status: Published in ApJ

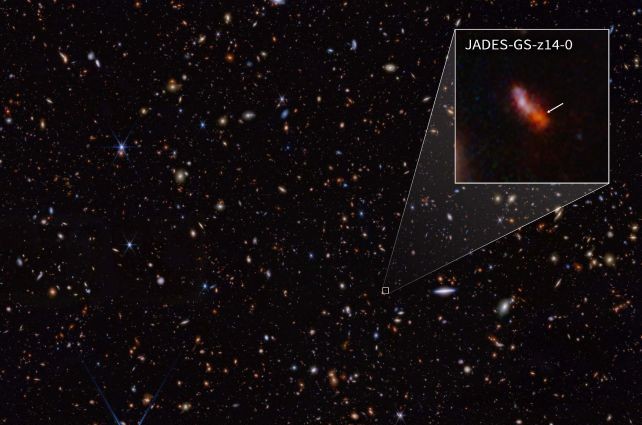
Back in the 1920s, astronomers discovered that we live within just one of many, many galaxies in the big, wide universe. Since then, we’ve been racing to search for the most distant galaxy that can be observed — in other words, searching for the oldest starlight we can see, since the light from these distant sources has been travelling towards us for most of the age of the universe. (Remember: more distant = higher redshift = longer lookback time.)

This race to the redshift frontier has had a pretty eventful history (see a great overview video here), which became even more eventful with the launch of JWST. JWST rapidly smashed the previous redshift (z) record of z = 10.6 by discovering a galaxy at z = 13.2, and then it broke its own record twice more. The current title holder sits at z = 14.4, observed less than 300 million years after the Big Bang.

Several galaxy candidates (to date unconfirmed) have now even been proposed at z ~ 25–32 (e.g., Capotauro), only 100 million years after the Big Bang! If real, these sources would pose a serious challenge to our understanding of the formation of the first galaxies, as galaxies shouldn’t really be observable at such early times. In today’s article, the authors put forward an intriguing alternative: what if some of these ultra-high-redshift candidates aren’t galaxies at all, but transient explosions from the universe’s first stars?

The First Stars and Their Explosive Endings

The earliest generation of stars (Population III; see my previous bite on these here) formed from pristine hydrogen and helium gas. Without metals to cool the gas efficiently, theory predicts that these stars were extremely massive, often exceeding 100 solar masses. While such stars would be short-lived, their deaths could be spectacular.

Population III stars of sufficient mass are predicted to end their lives as hyper-energetic pair-instability supernovae (PISNe). This is a long-winded name for a rapid, intensely hot explosion that leaves no remnant behind — not even a trace of the pre-existing star. Whilst nothing would remain of the star, the light emitted in that explosion could be bright enough to masquerade as a high-redshift galaxy candidate in current JWST surveys, but only if three key conditions are met:

  1. JWST must observe a sufficiently overdense region, where lots of Population III stars can form very early.
  2. A PISN must occur while JWST is “watching.”
  3. The explosion must be bright enough to rise above JWST’s detection limits.

Simulating a (Biased) Universe

To address the likelihood of these conditions having already been met by existing JWST observations, the authors turn to cosmological simulations. Rather than simulating an “average” patch of the universe, they focus on an extremely overdense region (Fig. 1). This creates a rare but important environment where structures collapse earlier than usual. These regions are exactly where large numbers of Population III stars are expected to form at the highest redshifts.

projection of the gas density in the simulated overdense region at z = 30.4

Figure 1: A projection of the gas density in the simulated overdense region at z = 30.4. The densest structures stand out clearly, tracing the locations where the first stars are able to form. Black dots mark newly formed groups of stars, while the most massive dark matter halo in the region is highlighted with an orange circle. The figure illustrates that in such an unusually dense patch of the early universe, star formation can already be underway just 100 million years after the Big Bang, creating the conditions needed for early Population III stars and their explosive deaths. [Adapted from Jeon et al. 2026]

In their simulations, star formation begins as early as z ~ 30–40 (within the first hundred million years after the Big Bang), producing Population III stars and, by extension, potential PISNe very shortly afterwards. While such overdense regions are rare, the authors show that the total area already surveyed by JWST (including large surveys such as CEERS, JADES, PRIMER, and COSMOS-Web) is large enough that it is plausible JWST has already observed at least one such region.

Catching a Cosmic Explosion in the Act

So, we can tick off condition #1: it’s possible that a sufficiently overdense region has already been observed by JWST. Next up, how lucky do we have to be to catch an explosion in the act (condition #2), so to speak? For this condition, cosmic time dilation actually works in our favour. A PISN explosion at z > 20 that lasts only months in its own rest frame can last for decades in the observed frame. (This whole time-being-relative thing sounds wacky because it is — please join me, Neil deGrasse Tyson, and countless others in struggling to imagine this.)

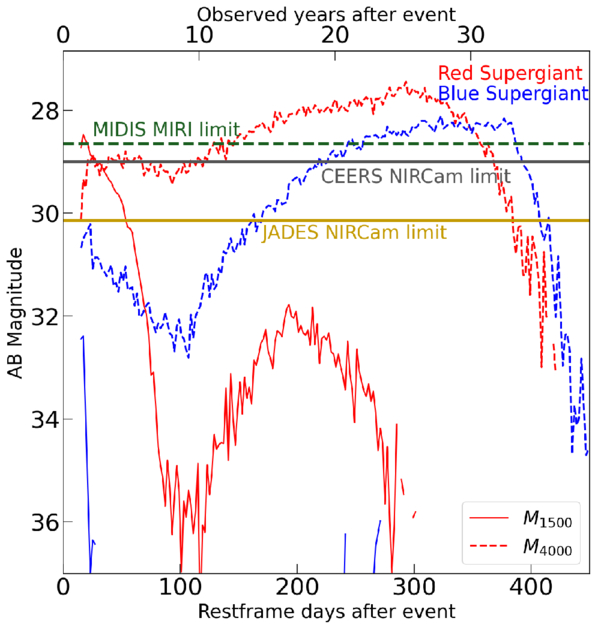
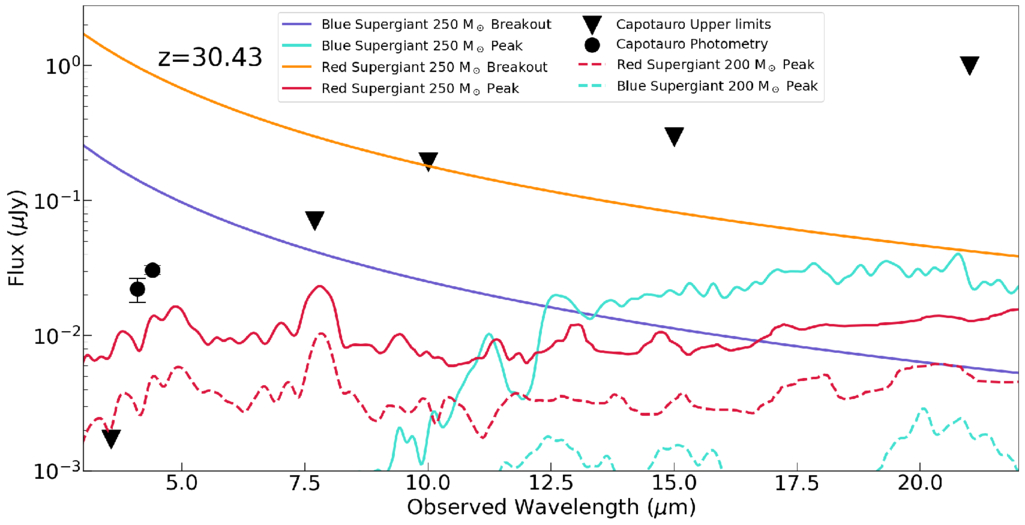
But would any such explosion be bright enough (condition #3)? Using theoretical PISN spectra, the authors show that these explosions could reach observed magnitudes of ~28–29 at z ~ 30 — right at the depth of current JWST deep surveys (Fig. 2). In fact, the predicted brightness and colours are somewhat comparable to those of some proposed z ~ 30 candidates (Fig. 3), raising the possibility that these objects could be PISNe rather than galaxies.

plot of predicted PISN brightness

Figure 2: This plot compares the predicted brightness of PISNe originating from different types of extremely massive stars to the depth reached by existing JWST surveys, showing that these explosions could remain detectable for ~20 years at peak brightness in the observed frame. [Jeon et al. 2026]

Theoretical PISNe spectra compared to a proposed z = 32 source

Figure 3: A comparison of theoretical PISNe spectra with the observed photometry of one proposed z ≈ 32 source (Capotauro). The coloured curves show model spectra for PISNe originating from extremely massive stars, at different stages of the explosion, while the data points represent the observed brightness of the high-redshift candidate across multiple JWST filters. [Jeon et al. 2026]

So… Are We Seeing the First Stars Die?

It’s not time to throw a party just yet. The authors note there are several caveats and uncertainties. The nature of Population III stars is still highly uncertain, JWST does not continuously monitor the same patch of sky, and identifying a PISN at such high redshift would be extremely challenging. Thanks to time dilation, these explosions would fade very slowly, making them hard to distinguish from steady sources using photometry alone. Alternatively, there are other plausible explanations for these ultra-high-redshift candidates: lower-redshift interlopers (a rather infamous example is CEERS-93316), local brown dwarfs, or even nearby exoplanets.

Still, the idea is exciting. If JWST were to detect a genuine PISN at z > 20, it would represent a direct glimpse of the very first stars, pushing observational astronomy into truly uncharted territory. For now, the most distant explosions in the universe may already be hiding in JWST images; we just have to learn how to recognise them.

Original astrobite edited by Nathalie Korhonen Cuestas.

About the author, Lucie Rowland:

I’m a fourth (and final!) year PhD student at Leiden Observatory in the Netherlands, studying massive, star forming galaxies in the early universe with ALMA and JWST. It’s a really exciting time to be interested in astronomy, so I hope to make groundbreaking new research more accessible!

The post The Oldest Starlight appeared first on AAS Nova.

  •  

Too Much Nitrogen Pops Open the Search for the Universe’s First Stars

Star formation in the early universe.

Astronomers have long sought evidence of the universe’s first generation of stars, and as more distant galaxies come into view, it seems these stars may finally be within reach.

JWST deep field

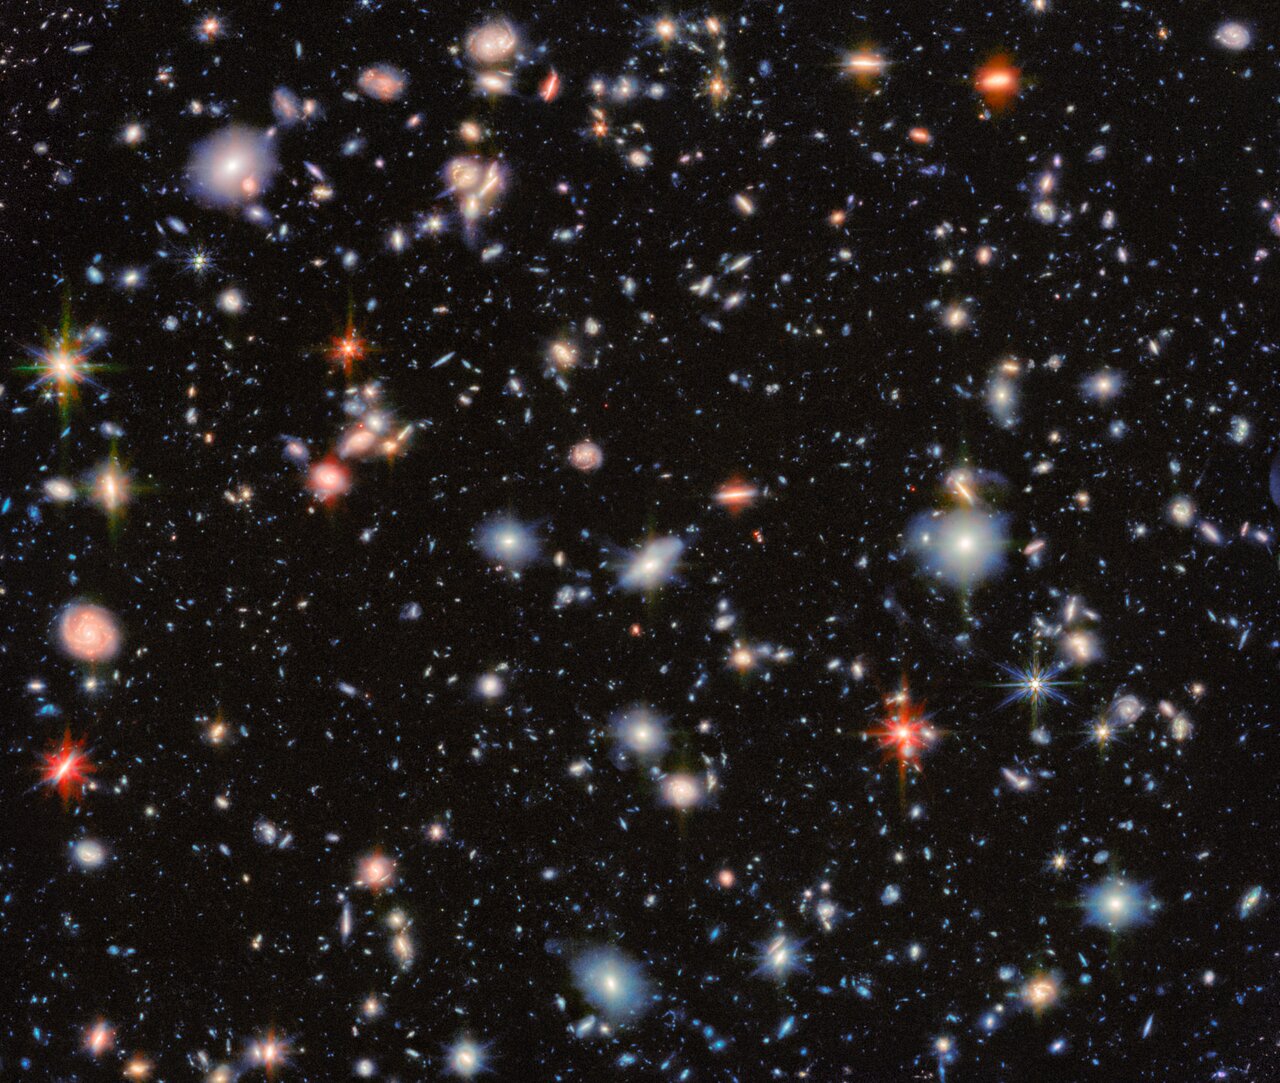
JWST spies thousands of distant galaxies in the classic Hubble Deep Field — many galaxies being uncovered for the first time with the space telescope’s powerful instruments. [ESA/Webb, NASA & CSA, G. Östlin, P. G. Perez-Gonzalez, J. Melinder, the JADES Collaboration, the MIDIS collaboration, M. Zamani (ESA/Webb); CC BY 4.0]

Excess Metals Popping Up

Since its 2021 launch, JWST has given astronomers eyes to peer into the distant past, discovering many galaxies whose light reveals the universe’s early stages of star and galaxy formation. Within the population of newly discovered galaxies are a few with bizarre chemical properties that, upon first pass, seem to be too enriched to exist so early in the universe. These hard-to-reconcile abundances may be a sign of the universe’s first stars. 

Known as Population III (Pop III) stars, the first stars in the universe were born out of giant clouds of pristine gas (hydrogen, helium, and a little lithium) and were able to form at masses hundreds to thousands of times the mass of our Sun. Though they burned bright, they did not burn for very long, ending their lives in violent supernovae and chucking their newly enriched guts back into their surroundings. While these stars are long dead, the chemical imprints they left on their host galaxies can persist  — and understanding how Pop III stars create and distribute metals could clue us in to the odd chemical signatures recently found with JWST.

Too Much Nitrogen in GS 3073

Researchers have identified a few galaxies exhibiting high nitrogen-to-oxygen (N/O) ratios that cannot be explained by stars similar to those in the universe today. A couple of these galaxies could be explained through multiple stellar populations, rapidly rotating stars, massive explosions, or the early stages of globular cluster formation. However, GS 3073, a galaxy with a redshift of z = 5.55 (about one billion years after the Big Bang), has an N/O excess so high that is has, so far, defied explanation.

Aiming to make sense of this bizarre phenomenon, Devesh Nandal (University of Virginia; Center for Astrophysics | Harvard & Smithsonian) and collaborators used stellar evolution models to see if Pop III stars could be the culprit. Modeling stars with masses 1,000–10,000 times the mass of our Sun, the authors traced the elemental yields of these supermassive stars as they go through the various stages of nuclear burning. The analysis takes into account mixing within the stars, mass loss throughout their lifetimes, and how the eventual supernova ejecta mixes within the interstellar medium.

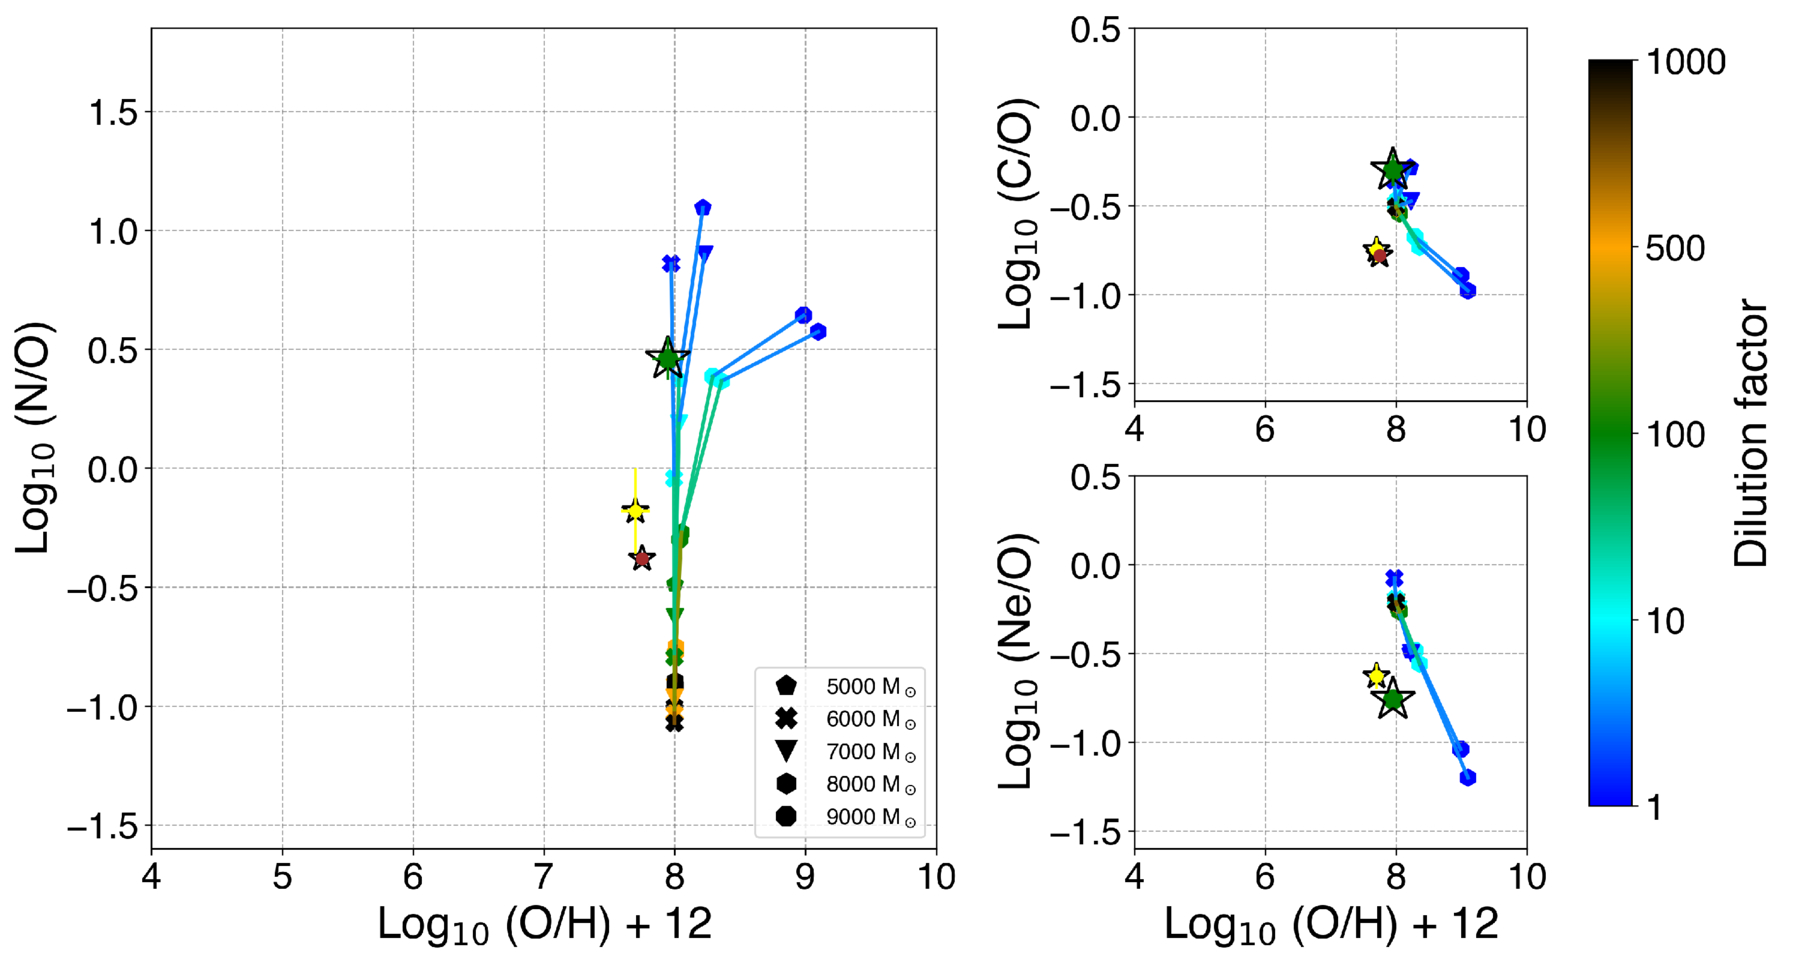
N/O, C/O, and Ne/O abundance ratios of five modeled supermassive Pop III stars taking into account the contribution from other stars in the galaxy and the Pop III star losing 10% of its mass over its lifetime. The green star indicates the observed ratios of GS 3073. Click to enlarge. [Nandal et al 2025]

From this modeling, the authors found that massive Pop III stars between 1,000 and 10,000 solar masses can produce the observed elemental abundances measured for GS 3073. Stars less massive do not produce high enough N/O ratios, and stars more massive have much lower oxygen-to-hydrogen ratios — strongly suggesting upper and lower mass limits to the possible supermassive stars that could have produced GS 3073’s chemical composition.

Finally Evidence of Pop III Stars?

This study of GS 3073 is the first of its kind to confirm the chemical imprints of Pop III stars on their host galaxy at this redshift. The unique nitrogen abundance can only be produced through the evolutionary phases of Pop III stars that burn quickly enough to produce and release an excess amount of nitrogen while other elements stay consistent. From their modeling, the authors suggest that galaxies with even higher nitrogen excess could exist, and further observations with JWST may just find them. 

The search for Pop III stars is booming — another recent study (Visbal et al 2025) examines the galaxy LAP1-B. While GS 3073 shows evidence of Pop III stars through chemical abundances, the study of LAP1-B finds that the galaxy matches theoretical predictions for the formation environments and mass distributions of Pop III stars. Both of these recent research works are laying the groundwork for the wealth of discovery possible with JWST, and the universe’s first stars are no longer out of reach.

Citation

“1000–10,000 M⊙ Primordial Stars Created the Nitrogen Excess in GS 3073 at z = 5.55,” Devesh Nandal et al 2025 ApJL 994 L11. doi:10.3847/2041-8213/ae1a63

The post Too Much Nitrogen Pops Open the Search for the Universe’s First Stars appeared first on AAS Nova.

  •  

Do X-Rays Help or Hurt Massive Black Hole Formation?

Illustration of a supermassive black hole enveloped in gas

Editor’s Note: Astrobites is a graduate-student-run organization that digests astrophysical literature for undergraduate students. As part of the partnership between the AAS and astrobites, we occasionally repost astrobites content here at AAS Nova. We hope you enjoy this post from astrobites; the original can be viewed at astrobites.org.

Title: Massive Black Hole Seed Formation in Strong X-Ray Environments at High Redshift
Authors: Kazutaka Kimura, Kohei Inayoshi, and Kazuyuki Omukai
First Author’s Institution: Tohoku University
Status: Published in ApJ

Environments of Massive Black Holes

Astronomers have found that nearly every observable galaxy hosts a central supermassive black hole (SMBH) — a black hole more than a million times more massive than the Sun. Using JWST, they have peered back into the early universe to observe some of the earliest galaxies, and these early galaxies also contain SMBHs. In fact, many of these galaxies seem to contain SMBHs that are more massive than we expected them to be this early in the universe.

We believe that most black holes form at the ends of the lives of massive stars, which collapse under their own gravity when they run out of fuel. We expect that this happened to the first stars too, forming “light” (as in “lightweight”) seeds of SMBHs with masses up to about 100 solar masses. Astronomers also think that the right conditions in the early universe could lead to the formation of a “heavy” seed with a mass on the order of 104 solar masses or more; this kind of black hole is called a direct-collapse black hole (DCBH).

In order to form a DCBH, a gas cloud needs to collapse without fragmenting to form star clusters and stars — if stars form, there won’t be enough mass funneled to the center of the cloud to form the DCBH. One important criterion for this to happen is the absence of coolants, like metals and molecular hydrogen (H2), which cause fragmentation. One way to eliminate H2 is with a particular type of ultraviolet light called Lyman-Werner radiation, which can destroy H2 molecules. However, recent results from the Hydrogen Epoch of Reionization Array (HERA) suggest that early galaxies emitted more X-rays than expected, which would increase the amount of H2 and make it less likely for DCBHs to occur. Today’s authors investigate the feasibility of forming DCBHs in these X-ray-bright environments.

Modeling Black Hole Formation

Today’s authors model the collapse of gas in dark-matter halos that have a nearby neighboring halo. This neighboring halo emits radiation like ultraviolet light and X-rays that impact the formation of molecules like H2, which affects the gas chemistry. This radiation is typically emitted by hot gas in star-forming regions. The authors also track quantities like the gas density and temperature as the gas collapses. Once the gas collapses enough, a star forms at the center and continues to accrete surrounding material. Once this star evolves and reaches the end of its life, it becomes a black hole.

The authors considered different intensities of X-ray radiation relative to a critical value of Lyman-Werner radiation believed to destroy enough H2 to form a DCBH, which is called J21. They explore values of the X-ray intensity Jx relative to J21, considering ratios of 0, 10-6, 10-5, and 10-4.

Another important consideration was the baryonic streaming velocity. This is the relative bulk velocity between baryonic (i.e., “normal”) matter and dark matter in the early universe. Higher streaming velocities can delay the collapse of gas in dark-matter halos, which affect gas properties like density, temperature, and chemistry. The streaming velocity depends on the redshift, z, which is given by σbsm = 30 km/s (1+z)/(1+z0), where z0 = 1,100. This “standard” relationship has been calibrated with measurements from observations. The authors consider two cases for the streaming velocity: vbsm = 0 and vbsm = 1σbsm, which are denoted in the figures below.

X-Rays and Seed Suppression

The first main results are shown in Figure 1. The authors find that a large number of intermediate-mass seeds form from H2 cooling, shown in blue, regardless of the X-ray intensity. A smaller number of higher-mass seeds form from H–H2 and H–H cooling, but these cooling processes become suppressed as the X-ray intensity increases. This is because the increased X-ray intensity converts more H to H2. Interestingly, accounting for the streaming velocity all but wipes out black hole formation via H2 cooling except at very high X-ray intensities.

histograms of seed black hole mass

Figure 1: Mass distributions of seed black holes. The top row uses a baryonic streaming velocity of 0 and the bottom row uses the standard streaming velocity. Columns represent increasing X-ray intensities (left to right). Colors represent the dominant cooling mechanisms: H2 (blue), atomic hydrogen H transitioning to H2 (orange), and solely H (green). [Kimura et al. 2025]

Another main set of results are the black hole mass functions (that is, the number density of black holes for a given black hole mass), shown in Figure 2. Note that this differs from Figure 1 because we are now accounting for the number density of black holes, not just the number, and we are no longer categorizing black holes based on their cooling mechanism. As before, we see that most massive black holes are eliminated with a high X-ray intensity and no streaming velocity, but a higher streaming velocity tends to produce more massive black holes regardless of the X-ray intensity. These black hole mass functions provide a useful comparison to observational results from telescopes like JWST.
histograms of seed black hole number density

Figure 2: Seed black hole mass functions for low and high X-ray intensities (left and right columns, respectively). Rows are the same as in Figure 1. [Kimura et al. 2025]

In summary, today’s authors find that a high X-ray intensity leads to less-massive black holes due to the increased amount of H2, but accounting for the baryonic streaming velocity can produce massive black holes even with a large amount of X-rays. The number densities of these black holes appear to agree with observations from JWST, meaning that this could be a promising formation mechanism for the observed SMBHs in the early universe.

Original astrobite edited by Sparrow Roch.

About the author, Brandon Pries:

I am a graduate student in physics at Georgia Institute of Technology (Georgia Tech). I do research in computational astrophysics with John Wise, using machine learning to study the formation and evolution of supermassive black holes in the early universe. I’ve also done extensive research with the IceCube Collaboration as an undergraduate at Michigan State University, studying applications of neural networks to event reconstructions and searching for signals of neutrinos from dark matter annihilation.

The post Do X-Rays Help or Hurt Massive Black Hole Formation? appeared first on AAS Nova.

  •  

A GLIMPSE of the First Galaxies?

Abell S1063

Editor’s Note: Astrobites is a graduate-student-run organization that digests astrophysical literature for undergraduate students. As part of the partnership between the AAS and astrobites, we occasionally repost astrobites content here at AAS Nova. We hope you enjoy this post from astrobites; the original can be viewed at astrobites.org.

Title: A Glimpse of the New Redshift Frontier Through Abell S1063
Authors: Vasily Kokorev et al.
First Author’s Institution: The University of Texas at Austin
Status: Published in ApJL

JWST has opened up a new era of early universe astronomy. Of particular interest is the hunt for the first galaxies, which are thought to have formed just a couple hundred million years after the Big Bang. But finding these early galaxies has proved to be somewhat of a challenge. While there have been many bright galaxies discovered by JWST at a redshift (z) greater than 10, no galaxies at z > 15 have been confirmed to date. Today’s article goes hunting for these very high-redshift galaxies in the GLIMPSE field, which is home to the strong lensing cluster Abell S1063, shown in Figure 1.

JWST image of Abell S1063

Figure 1: JWST image of the field used for this study. [Kokorev et al. 2025]

The process of identifying galaxies at high redshifts is not exactly a simple one. In this article, all the sources in the field are slowly winnowed down through a series of steps with the ultimate goal of finding extremely high-redshift galaxies.

Step 1: Cut Galaxies by Color

Cutting galaxies by color involves finding the Lyman break. High-energy light is absorbed by neutral hydrogen in the galaxy and in the space between the galaxy and us. Thus, when you look at a galaxy’s spectral energy distribution, there is a drop-off at short wavelengths called a “break.” For distant galaxies, the location of this drop-off gets redshifted, allowing for an estimation of a galaxy’s distance. By comparing how bright sources are between two filters that are adjacent in wavelength, we can look for steep drop-offs that are caused by the Lyman break. Figure 2 shows a color–color plot (showing the difference in brightness between different filters), where the dashed line shows the region galaxies must be in to be considered Lyman-break galaxies at these high redshifts. In the whole field, the authors detect 38 objects in this region.

Color-color plot showing the selection criteria for high redshift galaxies due to Lyman break

Figure 2: Color–color plot showing the selection criteria for high-redshift galaxies due to Lyman break. The upper-left region enclosed by the black dashed line represents the region that satisfies the high-redshift criteria. The various lines show properties of different populations. Solid are potential tracks for starburst galaxies at z = 16, dashed are lower-redshift quiescent galaxies, and dotted are cool stars and brown dwarfs, which can look like high-redshift galaxies in some situations. The two red diamonds show the final two high-redshift candidates in this work. [Kokorev et al. 2025]

Step 2: Calculate Redshift

However, this isn’t the end of the story. Color isn’t the only way to estimate distances to galaxies, as we can also use photometric fitting codes. These codes compare observations to templates of what we would expect galaxies to look like at different redshifts and see which templates fit best. This allows for an estimation of the redshift of each source identified in the field. All sources that the photometric fitting codes thought were at z > 16 were cross-referenced against the 38 color-identified objects, which narrowed the list to eight high-redshift candidates.

Step 3: Hunt for Imposters

But wait, there’s more! Both of these methods (looking at colors and calculating redshift photometrically) are susceptible to false positives. Lower-redshift galaxies, particularly star-forming dusty galaxies, can look just like high-redshift sources. This is apparent in Figure 2, where z ~ 4.5–5.5 dusty galaxies can also be found in the color-selected Lyman-break region. Thus, we need to explore the possibility that the sources might not be at high redshift at all. In this article, the authors do this by fitting their eight sources with a lower-redshift dusty starburst template, finding only five galaxies that match the high-redshift template better than the starburst template.

Step 4: Keep Significant Detections

The authors make one final cut to the last five sources, only keeping those that aren’t at the edges of the observation and thus have strong signals, where they can be confident we’re actually detecting something and it’s not just a hot pixel or noise. So, after all of that, they are left with only two z > 16 candidates in this field.

Figure 3 shows the images and spectral energy distributions of each of these candidates, given the wonderfully poetic names of 70467 and 72839. While there is still a lot to learn about these candidates, with the JWST data presented in this article we can uncover some things about the galaxy properties. Both sources appear to be compact, but still resolved, with effective radii of roughly 650 light-years. These observations can also tell us about the ultraviolet brightness of the two candidates, finding that they are most likely dominated by extended stellar emission, as opposed to active galactic nucleus activity. In general, these galaxy candidates are not very ultraviolet-bright, which is somewhat surprising, as JWST has found many bright galaxies at z ~ 12–14. However, it is not out of the question that galaxies at this slightly earlier epoch are just fainter than we expected, and then formed stars and increased in brightness relatively quickly.

Cutouts and spectral energy distributions for two high-redshift galaxy candidates

Figure 3: Cutouts and spectral energy distributions for the two high-redshift candidates in this work. Squares show images in nine JWST filters, as well as an image of several filters combined, with a cutout width of 1.5″. Spectral energy distribution plots show different template galaxies for high-redshift (orange and red) and low-redshift dusty star-forming galaxy interlopers (blue and green). You can see how these sources are only strongly detected in a few filters, with many detections being just upper limits. [Kokorev et al. 2025]

Overall, these results mark the finding of potentially some of the first galaxies in the universe. But for now, they remain candidates. The photometric data have served their purpose, allowing us to find these candidates and get some information about their properties, but now we need targeted spectroscopic observations to get a more accurate determination of their redshift.

Original astrobite edited by Bill Smith.

About the author, Skylar Grayson:

Skylar Grayson is an Astrophysics PhD Candidate and NSF Graduate Research Fellow at Arizona State University. Her primary research focuses on AGN feedback processes in cosmological simulations. She also works in astronomy education research, studying online learners in both undergraduate and free-choice environments. In her free time, Skylar keeps herself busy doing science communication on social media, playing drums and guitar, and crocheting!

The post A GLIMPSE of the First Galaxies? appeared first on AAS Nova.

  •  

From Gas to Cluster: Simulating Star Formation in the Early Universe

globular cluster

JWST observations have begun uncovering some of the oldest star clusters in the universe, but their formation mechanisms are still uncertain. A recent study uses high-resolution simulations to understand early star formation and how local globular clusters may have originated. 

Supersonically Induced Gas Objects

Our leading cosmological model of the universe suggests that stars and galaxies coalesce within dark matter halos, eventually forming the larger structures we see today. However, some of the oldest astronomical objects in the universe — massive collections of stars called globular clusters — contain little to no dark matter, making their formation mechanisms somewhat mysterious. How do large clusters with thousands of stars form outside of dark matter halos?

supersonically induced gas objects

Visualizations of the gas density in the simulated star-forming regions in this study. Click to enlarge. [Lake et al 2025]

Recent studies have suggested that as the dark matter and baryons (i.e., normal matter) in the early universe began to clump together and form slightly denser areas, the pristine gas and dark matter began to move relative to one another. Baryons, still tightly coupled to photons, did not have the same freedom to collect in dense regions that the dark matter did, creating supersonic (about five times the speed of sound) relative motions that separated gas clumps and early dark matter halos. These separate, dark-matter-free gas clumps formed baryon-enriched structures known as supersonically induced gas objects.

Over the past decade, simulations and theory have shown that supersonically induced gas objects can form star clusters, which may be the origin story of many of the local globular clusters seen today. However, these simulations have been limited by their resolution. Unable to resolve individual star formation and not including key aspects like feedback, these simulations have left open questions about these dark-matter-free objects.  

High-Resolution Simulations

Seeking to more deeply understand supersonically induced gas objects, William Lake (University of California, Los Angeles; Dartmouth College) and collaborators perform high-resolution simulations that include detailed physics and can track the formation of individual stars. The simulations varied the metallicity and presence of protostellar jets, properties that are both known to impact the star formation process in gas clouds.

imf

Mass distribution for the stars formed in the simulated supersonically induced gas objects. The simulated clusters form more high-mass stars than what is seen in local star-forming regions. Click to enlarge. [Lake et al 2025]

From the simulations, the authors find that star formation occurs naturally in these early systems. Both feedback from jets and the metallicity of the gas affect star-formation outcomes — jets tend to have a minor impact on the star formation efficiency in low-metallicity clouds, but disruption from the jets can cause low-mass stars to form in metal-enriched systems. However, in general, the authors conclude that supersonically induced gas clouds tend to form higher-mass stars than local star clusters, which agrees with what is expected for the universe’s first stellar population. 

Given that these objects likely form very high-mass stars, these primordial star clusters will have extremely high stellar mass surface densities and brightnesses compared to what is observed locally. With such enhanced brightness, these objects may be bright enough for JWST to observe them. Further high-redshift observations of star clusters will allow for further constraints on the formation of the universe’s first stars and will yield more information about the possible origins of the globular clusters we see in the local universe.

Citation

“The Stellar Initial Mass Function of Early Dark Matter–Free Gas Objects,” William Lake et al 2025 ApJL 985 L6. doi:10.3847/2041-8213/add347

The post From Gas to Cluster: Simulating Star Formation in the Early Universe appeared first on AAS Nova.

  •  

Robotic Spacecraft for Swift Boost Mission Arrives at NASA Wallops

Photograph of a large hangar
Northrop Grumman will load the LINK robotic servicing spacecraft from Katalyst Space into a Pegasus XL rocket at the Horizontal Integration Facility at NASA’s Wallops Flight Facility in Virginia, shown here. LINK arrived at Wallops on June 5, 2026, to begin integration.
NASA/Ron Beard

The LINK robotic servicing spacecraft, built by Katalyst Space and designed to capture and boost NASA’s Neil Gehrels Swift Observatory arrived at the agency’s Wallops Flight Facility in Virginia on Friday, June 5.

Inside NASA Wallops’ Horizontal Integration Facility, Northrop Grumman engineers will install the satellite into one of the company’s Pegasus XL rockets ahead of launch.

All spacecraft in low Earth orbit experience drag caused by our planet’s atmosphere. As a result, satellites without propulsion systems to counteract this effect gradually lose altitude and fall toward Earth.

Recent increased solar activity magnified the impact of atmospheric drag on Swift, causing it to sink faster than anticipated.

NASA contracted Katalyst to boost the 21-year-old observatory back to a higher altitude, pioneering a new servicing capability for the nation’s spacecraft fleet and allowing Swift to resume science observations.

After loading LINK into the Pegasus XL, Northrop Grumman will attach the rocket to the bottom of Stargazer, the company’s modified L-1011 aircraft.

Stargazer will deploy Pegasus XL from above Kwajalein Atoll, part of the Republic of the Marshall Islands in the South Pacific Ocean, later this month. The rocket will deliver the LINK spacecraft to an orbit where it can reach Swift.

As activities on the ground have raced to get LINK to Swift, the observatory team has been continuously making Swift’s orientation more aerodynamic to preserve altitude.

Learn more about the Swift mission at:

https://science.nasa.gov/mission/swift/

By Jeanette Kazmierczak
Goddard Space Flight Center, Greenbelt, Md.

The post Robotic Spacecraft for Swift Boost Mission Arrives at NASA Wallops appeared first on NASA Science.
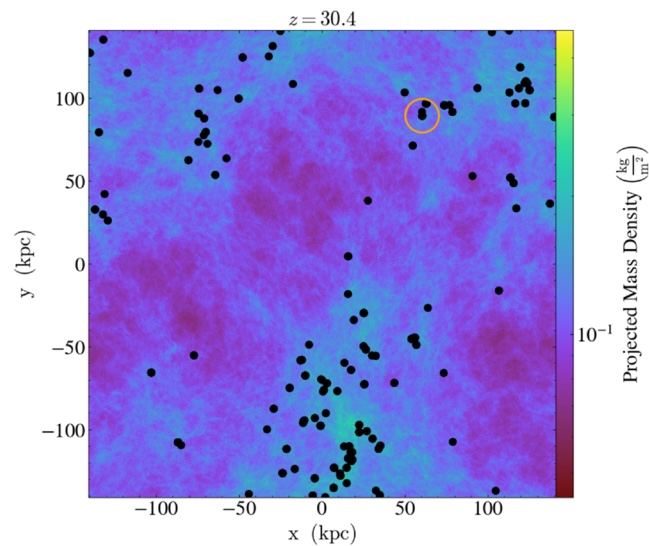
  •  

Webb Weighs Most Distant Inactive Black Hole Ever Found

This Webb image shows the highly distorted red galaxy MRG-M0138 seen through a foreground cluster of galaxies (white sources). Image credit: NASA / ESA / CSA / Webb.

A supermassive black hole 6 billion times the mass of the Sun lurks in MRG-M0138, a gravitationally lensed quiescent galaxy seen when the Universe was just 3 billion years old, according to an analysis of data collected by the NIRSpec Integral Field Spectrograph onboard the NASA/ESA/CSA James Webb Space Telescope.
The post Webb Weighs Most Distant Inactive Black Hole Ever Found appeared first on Sci.News: Breaking Science News.

  •  

Causality and the Arrow of Time Are Big Bang Problems for Cosmic Story-Telling

The big bang has causality issues, particularly the "horizon problem." I critique suggested solutions like cosmic inflation and negentropy, arguing that they require unproven concepts. The Creator, as described in the Bible, provides a coherent explanation without causality violations, in contrast with those scientific storytelling fairy tales for adults.

  •  
  •  

How I Survived the Godless Australian Education System

I reflect on my educational journey, highlighting challenges such as family separation and multiple school changes. I excelled in science and mathematics yet was indoctrinated on Godless cosmology and rejected the Creator. Later Jesus Christ saved me from atheism and renewed my mind to His truth.

  •  

Are We Really Observing the Universe in Real Time?

When we look out into space, even with the most powerful telescopes, are we seeing the universe in real time? Are we observing events as they happen, that is, at the time measured on our local clocks?

  •  

Why are Astronomers Stunned by Abundant Oxygen in Earliest Known Galaxy?

Astronomers have discovered a galaxy, allegedly dating from just 300 million years after the big bang, with unexpectedly high oxygen levels. This is in contradiction to existing cosmological models with galaxy formation taking much longer. The findings refute the validity of the big bang story itself.

  •  
❌