Planetary scientists analyzing a lunar meteorite known as Northwest Africa (NWA) 12593 have uncovered evidence of an asteroid impact that occurred 3.5 billion years ago on the Moon, helping to reconstruct a period of intense bombardment that left lasting marks across the inner Solar System.
Well-known microbes that grow on our crops, our gardens, even our skin have been found thriving at two to three times the flying height of a commercial jetliner.
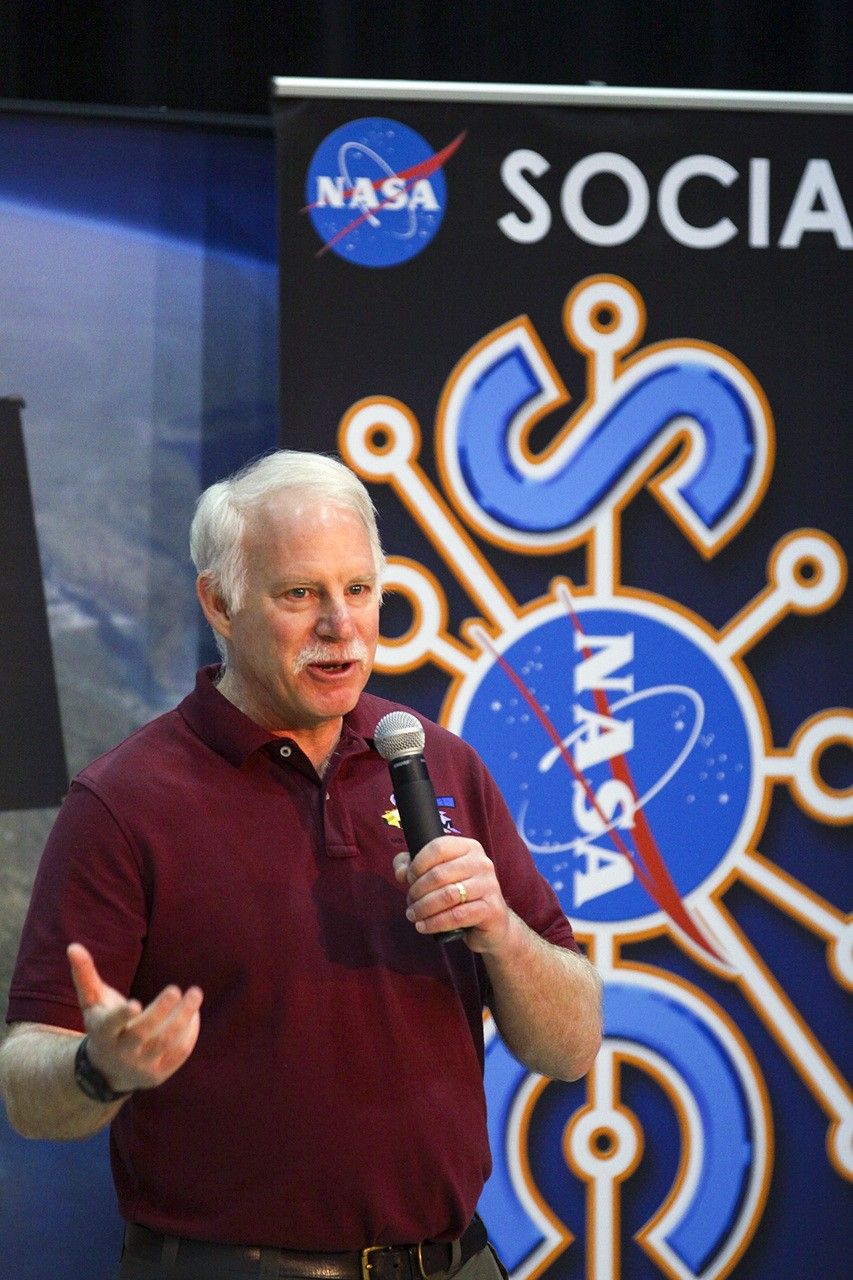
Irons, now an emeritus scientist at NASA Goddard Space Flight Center, played an integral role in shaping the Landsat program into what it is today. He served as deputy project scientist for Landsat 7 before taking over as project scientist for Landsat 8. From the earliest days of Landsat 8—then called the Landsat Data Continuity Mission (LDCM)—all the way through launch and operation, Irons worked across the agency and with colleagues at the USGS to ensure that Landsat continued providing critical data to researchers around the world. He championed rigorous calibration standards and fought to keep the thermal band on Landsat 8. Now, with projects like OpenET relying on evapotranspiration data derived from Landsat thermal imagery, the strength of his vision has only become more apparent.
Irons also served as the director of NASA Goddard’s Earth Science Division during the turbulent early days of the COVID-19 pandemic. Contending with global disruption, he prioritized making sure that everyone had the support that they needed to continue doing great work. As a leader and a scientist, Irons left a legacy of collaboration and innovation that lives on today.
We checked in with Irons about his role in Landsat’s history, what it takes to be a good leader, and winning the Pecora award:
NASA missions are so collaborative. Are there mentors, colleagues, or teams that you would want to share this recognition with or give special mention to?
One reason I feel so honored is that prior recipients have been my supervisors, mentors, role models, and colleagues whose work I admired and who inspired me. There’s a long list of people who have been recipients, and I am very honored to be added to that list.
There are also many people who have not yet been recognized who are very deserving. I’ve written letters of support for others, and I hope I’m called on again because there are more people who deserve recognition than there are awards to give out.
One of the things highlighted in the Pecora Award announcement was your commitment to the long-term continuous data record of Landsat. Looking at the Landsat program, why is this continuity so critical for Earth science today?
Data continuity is the backbone of the Landsat program. We are looking for change over time. When we talk about climate change and the impact of humans on the land surface, those changes are multi-decadal. We wouldn’t be able to understand, characterize, and monitor those changes without a continuous data record.
And it’s really important that the data record is well-calibrated. When we see changes between data from one Landsat sensor relative to another, we need to be confident that it’s a change occurring on the Earth, not a change in the performance of the sensors.
That’s another major contribution cited in your award: how much you pushed for rigorous data calibration and quality assurance. How did you establish those processes, and how did that make Landsat the gold standard of satellite data?
Early in my career, I got in trouble over calibration. NASA was flying an airborne sensor called the Thematic Mapper Simulator, intended to anticipate the capabilities of Landsat 4 and 5. But the operators kept changing the radiometric gain in-flight to maximize the dynamic range. I told NASA Headquarters that we couldn’t compare that data to the actual Thematic Mappers if they kept changing the gain—it wasn’t the same radiometry! The HQ manager got really upset, but I weathered the storm and stuck to my guns.
Later, when Landsat 4 and 5 were returned to the U.S. government from private operation, there had been no real calibration since launch. I advocated for a ground system component at USGS EROS to perform calibration. I didn’t build it, but I did advocate for USGS to hire a brilliant guy named Jim Storey, who developed the software for the precise geolocation of pixels in the data.
When I became Landsat 8 Project Scientist, we needed a pre-launch calibration lead. I advocated for Brian Markham. Brian just did a remarkable job ensuring the calibration of the Operational Land Imager (OLI) and its cross-calibration with previous instruments. He was modest, humble, and built a highly effective team across private industry and agencies.
Another important part of your legacy was the effort to ensure that thermal-infrared measurements continued onto Landsat 8. Why was retaining those measurements so important?
Back when USGS charged for data, the use of thermal data was minimal. Some well-respected papers even claimed it wouldn’t be possible to use thermal data to estimate evapotranspiration rates. Based on that, the Director of Earth Sciences at NASA HQ was convinced that the thermal capability wasn’t providing a return on investment.
But while this debate was ongoing, people began developing methodologies for estimating evapotranspiration and water consumption using thermal data—prominently Martha Anderson at the USDA, and researchers at the University of Idaho. It became crucial for monitoring agricultural water use in the West, and was even used in adjudicating water rights. It was also useful for cloud detection and fire monitoring.
I felt strongly that dropping the thermal capability was inconsistent with our directive to continue the Landsat data record. However, due to time pressures and budget constraints, the decision was initially made to fly Landsat 8 without a thermal instrument. But then, when our schedule was pushed back by an independent review board, a window opened up. Center Director Ed Weiler, who had moved to HQ, supported putting a thermal sensor on the payload. Kathy Richardson and engineer Fernando Pellerano were assigned to build it on an incredibly tight schedule, and they did an unbelievable job.
Now, deriving evapotranspiration rates for water consumption is considered essential. Ironically, for Landsat 9, NASA HQ even briefly considered launching a satellite with only a thermal sensor!
You were the Project Scientist from the earliest days of the Landsat Data Continuity Mission (LDCM) all the way through the Landsat 8 launch and beyond. What was the biggest challenge you faced during its development?
There were a lot of problems. Laughs. Because of the Land Remote Sensing Policy Act of 1992, the government was exploring commercial data buys for the follow-on mission. NASA spent five painful years attempting to implement LDCM as a commercial data buy. Only one company ultimately responded to the RFP, and it wasn’t a good deal for NASA, so it was rejected.
Then we were directed to put the Landsat sensor on an NPOESS platform (combining civilian and military weather satellite requirements). That platform wasn’t technically suitable, and the program ultimately fell apart.
Finally, the Office of Science and Technology Policy directed us to launch a free-flyer. Bill Ochs took over as project manager, and he deserves so much credit for the success of Landsat 8. He essentially rescued the project and put it on a path to success.
Reflecting on the partnership between USGS and NASA, how did you help build that, and what makes long-term interagency collaboration possible?
Darrell Williams and I worked very hard to establish a good relationship between NASA Goddard and USGS EROS. I took many trips to Sioux Falls. With Landsat 7, the EROS Center Director at the time, Don Lauer, brought in new people with great experience, like Jim Storey, Doug Daniels, and Jim Nelson. They developed the geometric rectification software for Landsat 7, and by the time we worked on Landsat 8, they had the right people in place to develop the whole data processing system. And we all got along really well with them. We still keep in touch with a number of them and consider them friends.
With Landsat 10 on the horizon, are there emerging applications or discoveries you’re excited about?
Yes. A major emerging capability is using Landsat data in concert with other systems, like ESA’s Sentinel-2, or with LIDAR and radar for 3D forest mapping. The community has asked for more frequent observations, especially more frequent thermal observations to measure water consumption more precisely without extrapolating over long gaps during the growing season.
There’s also great interest in using Landsat for water quality assessment, combining it with the PACE mission to monitor coastal and inland water quality. And tracking glacial velocities, glacial retreat, and even population displacement in conflict regions are all expanding areas. Landsat is truly foundational.
What was your biggest takeaway about leadership from your role as Director for the Earth Science Division at Goddard?
I was asked to step up after my predecessor, Piers Sellers—who was an absolute superstar—passed away. My main goal was simply to create an environment where the highly diverse researchers within the division could be successful. I wanted to minimize bureaucratic hindrances so they could focus on their work.
What I learned is that there is a limit to authority. Dictating doesn’t work. You have to lead, engage people, bring them into discussions, and get their buy-in. I used to joke that the job was like working with 1,400 valedictorians! It’s a high-achieving, dedicated group. My challenge was sometimes just reminding them to respect the work of the person down the hall, because people can get so fiercely focused on their own research.
My primary goal during my tenure was to provide stability, especially since it spanned what was then the longest government shutdown in history, followed by the COVID-19 pandemic. I was incredibly impressed by how productive the division remained through a complete disruption in how they worked.
What is the most important piece of advice you would give to young scientists?
Persistence. Persistence in pursuing your interests is critical. The only reason Landsat 8 was a success was that we persisted through several failed attempts to reformulate the program, schedule challenges, and budget uncertainties.
Funding and mission success aren’t entitlements based on your name or reputation. You have to work hard, keep putting forward proposals, do good work, and persist through rejections. If you really believe in what you’re doing, Goddard is a great place to work. You can get a lot done. But it takes persistence.
This interview was condensed and lightly edited for clarity.
The ancient history of our planet’s impact events is coming into focus, thanks to researchers who have triangulated similarly aged impacts on Earth, the Moon, and the asteroid 4 Vesta in a new study.
The lunar meteorite NWA 12593 correlates not only with impact events observed across three locations in our solar system but also contains evidence of three separate impact events that occurred at different times.
The findings, revealed in a recent paper published in Geology, show that scientists are using this new impact data to fill in the volatile early-Earth period when life began.
Early Earth Impacts
The Archean period, roughly 4 to 2.5 billion years ago, was a consequential time from which our earliest fossil records date, corresponding to around 3.5 billion years ago. Researchers believe that life likely first arose at this time, yet it may have faced adversity from bombardment by space rocks between 3.2 and 3.5 billion years ago, although scientists disagree on how intense this impact activity was.
Our planet’s geological activity eventually destroys evidence of the ancient past through erosion, subduction, and burial, continually reshaping the surface. Yet those early years are essential to understanding the origins of water, atmospheres, and life on Earth.
“On Earth, the first fossil evidence of life shows up around 3.5 billion years ago, meaning that life is emerging and evolving before then. The question that we often have, even going back further, is what was the impact record when life was emerging?” said lead author Carolyn Crow, a planetary scientist at the University of Colorado Boulder.
“It is important for understanding how life is taking hold, how life is emerging,” Crow added. “The cadence of these catastrophic events is an important part of the equation.”
A Neighbor Remembers
While Earth’s surface is constantly renewed by geological processes, our nearest significant neighbor, the Moon, is much more stable, retaining its geological record for longer periods. Because of this, lunar meteorites provide a resource for scientists to understand the impact of Earth and the inner solar system by matching them to known impacts on our planet and in the asteroid belt.
For the recent study, the team focused on a lunar meteorite discovered in northwest Africa, designated NWA 12593, and identified three separate impact events in a single sample.
Radiometric dating traced the oldest to 3.5 million years ago, intriguingly close to the time of the earliest known fossils. Extraordinary in power, this impact produced the mineral zirconia by melting the lunar surface into a lava-like flow. Without the precise laboratory conditions required to produce stable cubic zirconia, only traces of mineral remained in the sample.
According to the team, the first impact aligns with previously known impact events on Earth, and the fourth-largest object in the asteroid belt, 4 Vesta. It’s extremely rare to find such corresponding evidence between three bodies, providing important data on this time of frequent collisions.
“It’s not very common, which is why we’re very excited about it,” says Crow. “It’s pretty rare to have all three records line up like this.”
Later Impacts
Evidence of later impacts included breccia composed of large, angular, broken mineral fragments cemented together. The team believes the breccia resulted from a second impact that struck the melt sheet formed by the first.
“Breccias are similar to what you would see if you went and chipped out a chunk of concrete. You would see all these little rocks, and then it’s fused together by the cement,” says Crow. “But the meteorite is fused together by the impact process. You get all these chunks of different kinds of rocks that the impact hit into. These all get mixed up, and then it gets fused together like your concrete sidewalk.”
As for the third impact, the evidence for this is the meteorite’s mere presence on Earth; an event that occurred some time after the first would have ejected the lunar breccia, the researchers say, allowing it to eventually land on our planet.
In total, the sample reveals an intriguing impact history, preserving a record of bombardment that provides solid evidence for a flurry of activity in the inner solar system during a violent chapter in the early history of our Solar System.
Ryan Whalen covers science and technology for The Debrief. He holds an MA in History and a Master of Library and Information Science with a certificate in Data Science. He can be contacted at ryan@thedebrief.org, and follow him on Twitter @mdntwvlf.
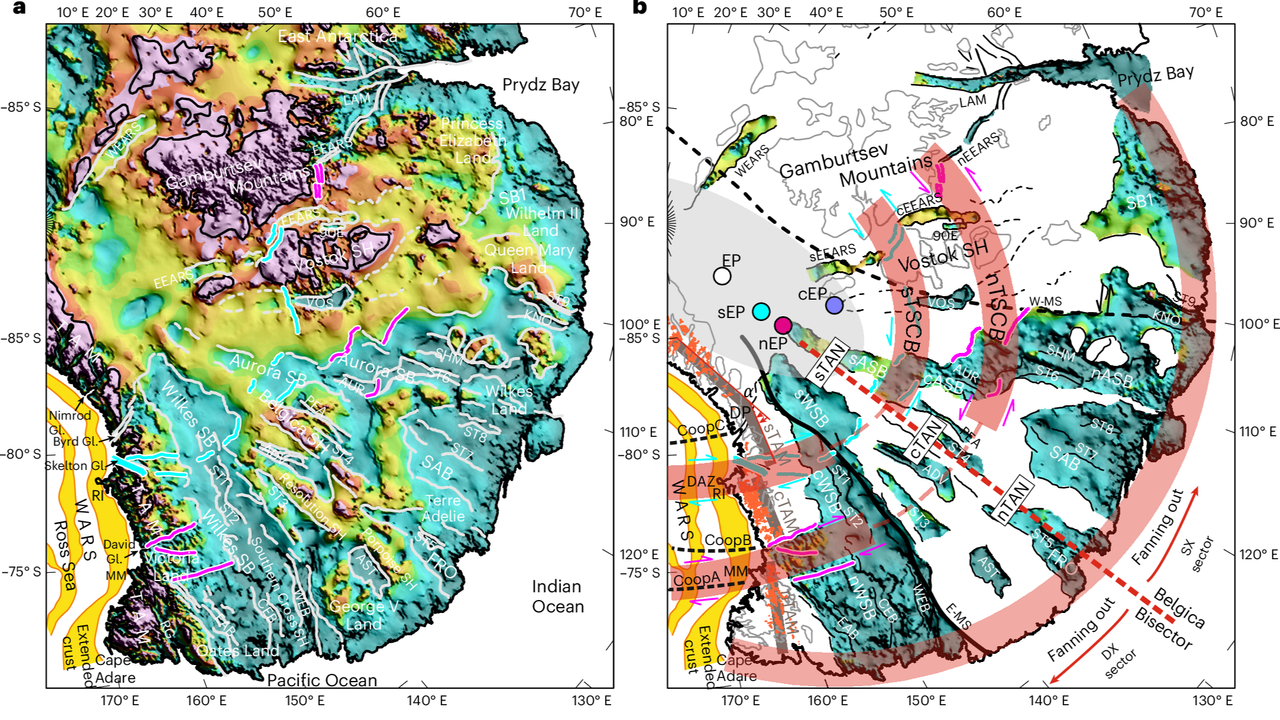
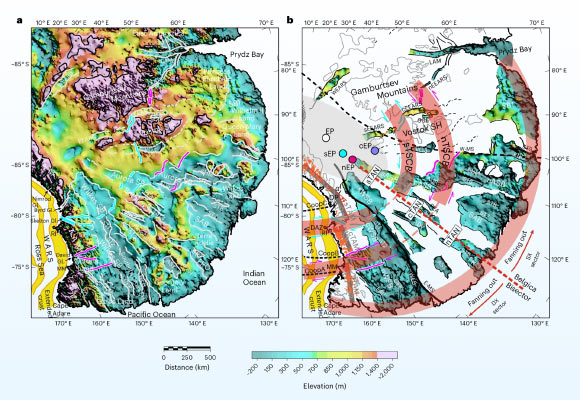
A mysterious geological structure that resembles a human hand with outstretched fingers has been revealed beneath East Antarctica. The discovery shows the frozen continent still hides many geological secrets.
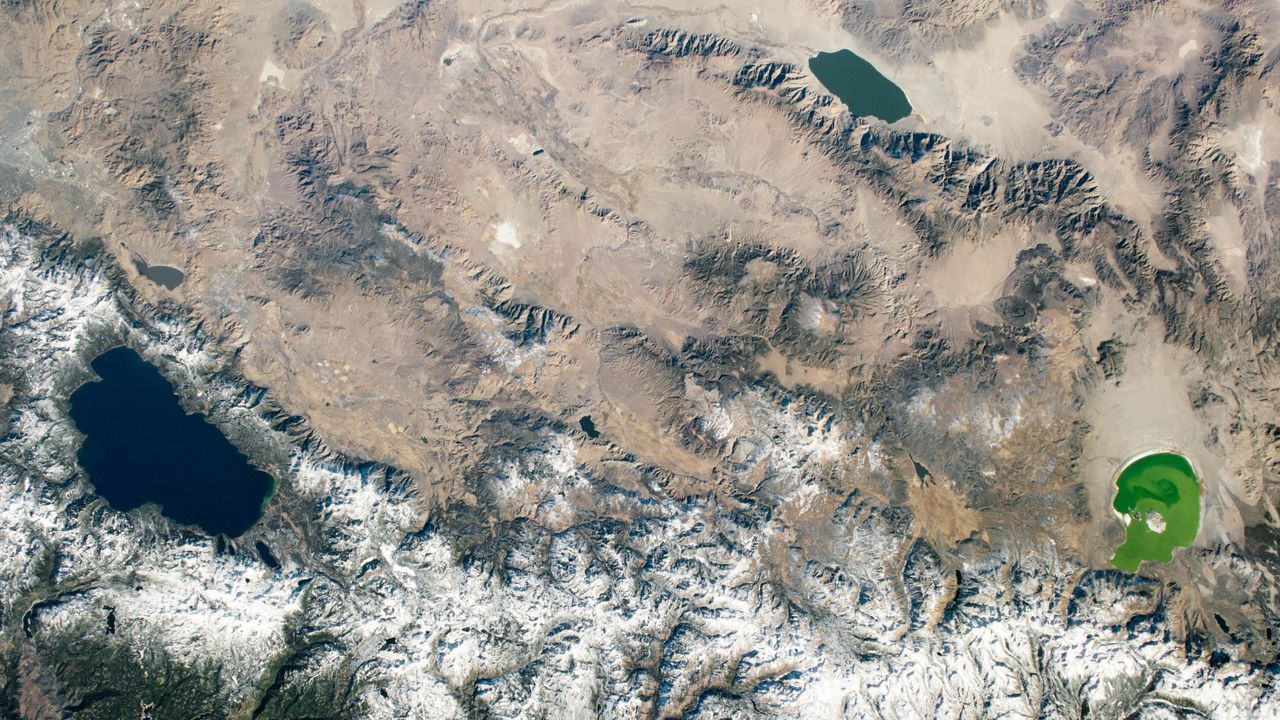
A 2020 astronaut photo shows three uniquely colored lakes — Tahoe, Walker and Mono — straddling contrasting biomes on either side of the California-Nevada border.
Unusually tall red auroras over Japan may be revealing that some solar storms are stronger than scientists realize. A study published in the Journal of Space Weather and Space Climate reports that red auroras observed over Japan extended to altitudes of roughly 500-800 kilometers above Earth. The discovery was made by researchers from Hokkaido University [...]
A new study suggests that the intense asteroid bombardment that struck the young Earth billions of years ago may have played an important role in creating the conditions needed for life to emerge. Today, asteroid impacts are often associated with destruction and mass extinctions. But during Earth’s earliest history, these violent collisions may have helped […]
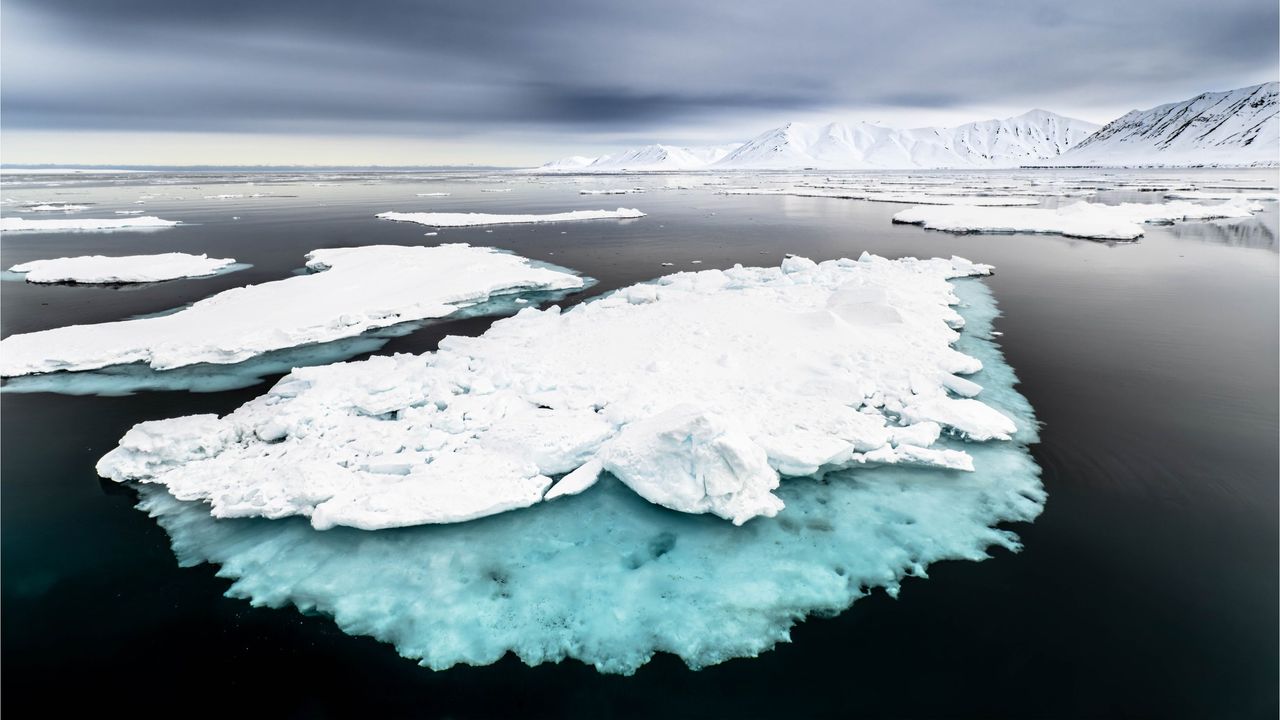
Researchers say the Arctic Ocean crossed a biological tipping point in 2009, when nitrate levels in the water suddenly started dropping due to a drastic reduction in sea ice extent.
By combining seismic, gravity and topographic data, a team of researchers from Italy, Switzerland, Germany and the United Kingdom found that several well-known subglacial basins in East Antarctica are part of a single fan-shaped province whose origins trace back to ancient continental stretching.
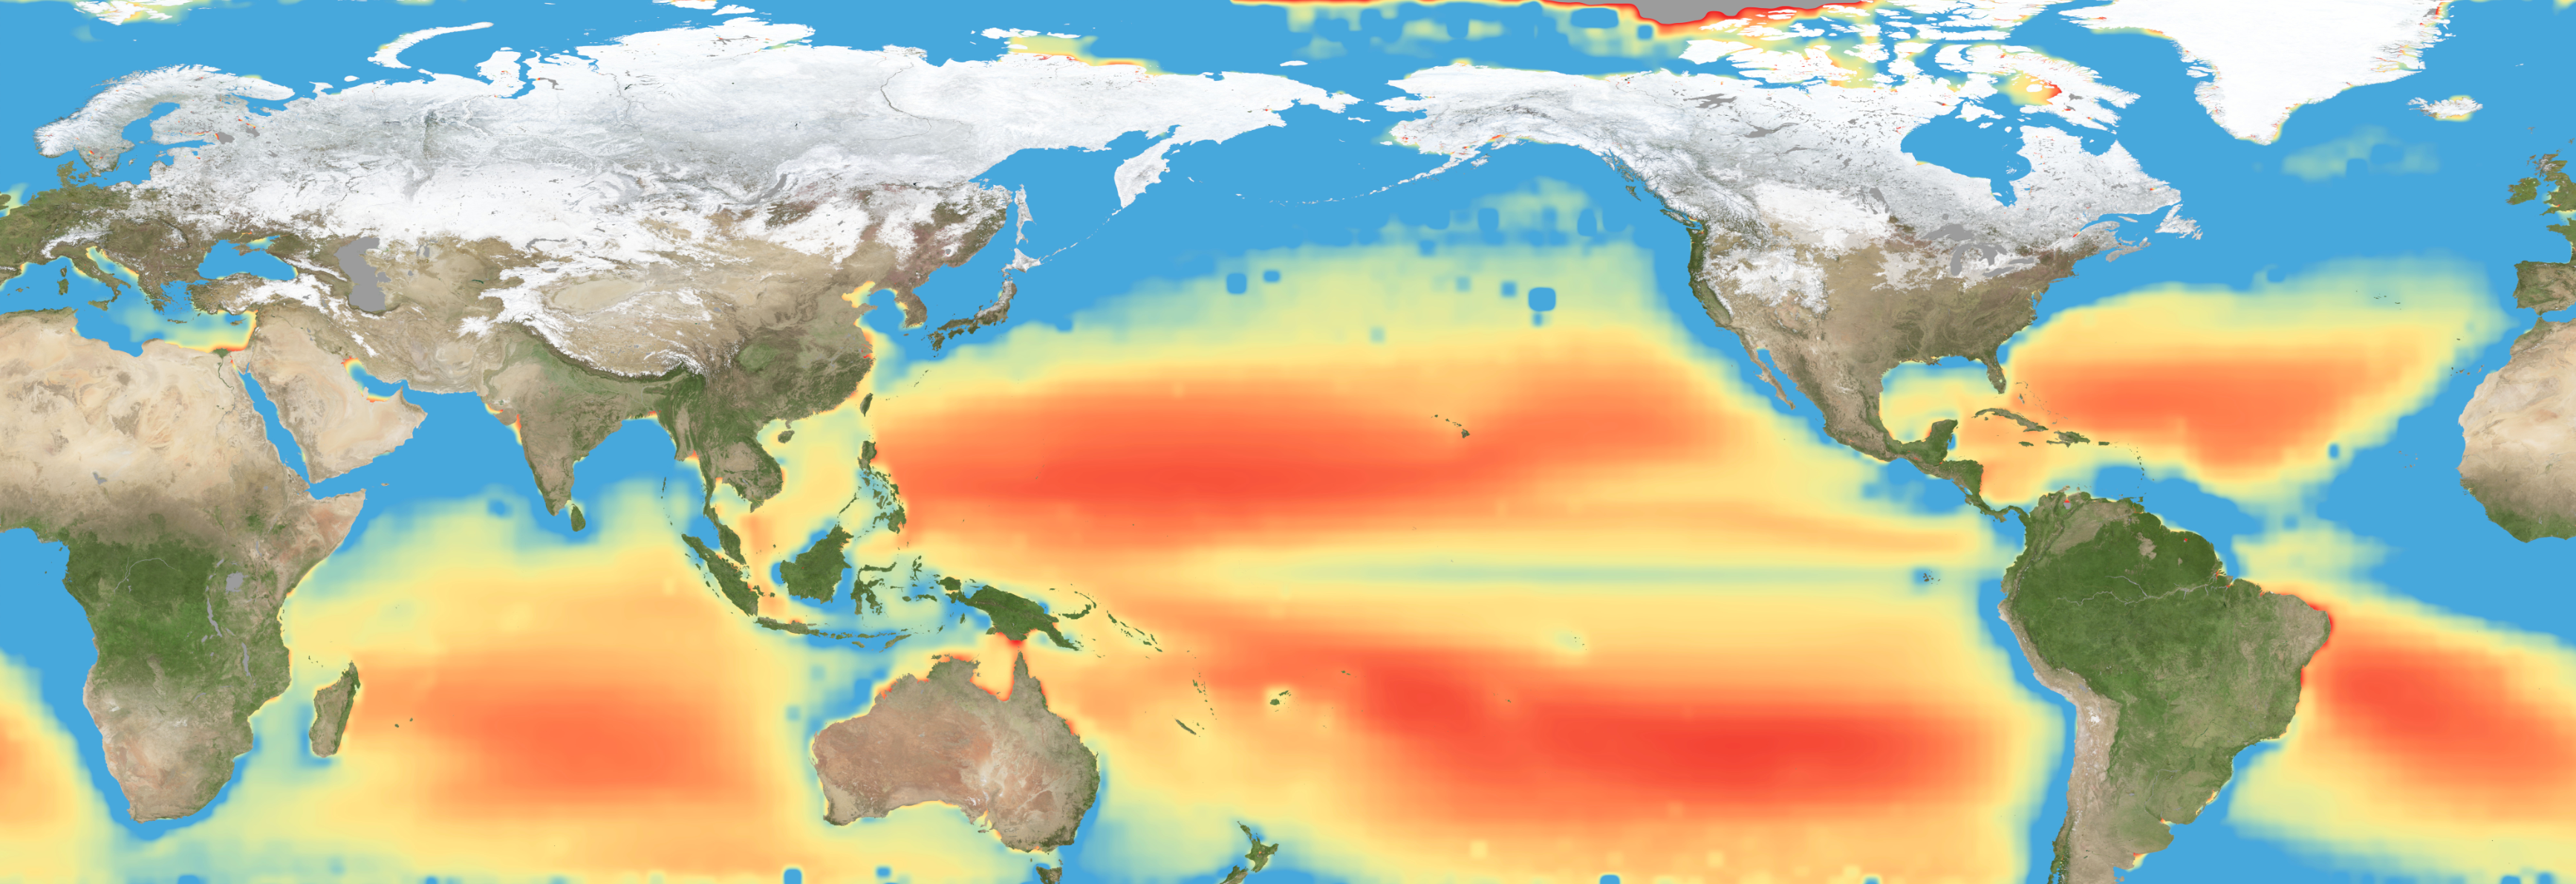
Warming waters decrease upwelling and lead to stress on marine microorganisms due to limited availability of vital nutrients. Red indicates the regions of highest nutrient-related stress.
Kel Elkins/NASA’s Scientific Visualization Studio
Editor’s note: This article was updated on June 5.
A new study combining NASA satellite observations, ocean surveys, and genetic testing on marine microorganisms found evidence that warming ocean waters may be limiting nutrient availability across much of the global ocean. The researchers report that this nutrient stress affects microscopic marine organisms and could influence marine ecosystems over time.
The research, published June 5 in Science Advances, tracked the condition of phytoplankton, which form the base of ocean food webs. Rather than measuring nutrients like nitrogen, iron, and phosphorus directly, the researchers inferred stress by tracking subtle shifts in the ratio of carbon to chlorophyll in phytoplankton observed from space. When the amount of chlorophyll decreases relative to carbon as seen in satellite data, it’s an indication that the plankton are stressed.
“As our ocean continues to change, the ability to observe and track ocean conditions through sustained, high quality remote sensing observations has never been more important,” said Laura Lorenzoni, Program Scientist for NASA’s Ocean Biology and Biogeochemistry Program at NASA Headquarters in Washington. “This is fundamental, as plankton communities are the base of the marine food web on which important economic activities rely.”
The research team combined two decades of data from NASA’s Aqua satellite’s Moderate Resolution Imaging Spectroradiometer (MODIS) sensor with plankton samples collected on research cruises around the world. The approach linked large-scale satellite observations with genetic markers in Prochlorococcus, a tiny but abundant marine microbe that shows signs of nutrient stress in its DNA. The result is a global map revealing where phytoplankton are thriving and where they’re struggling.
Ocean chlorophyll, as observed with NASA’s Moderate Resolution Imaging Spectroradiometer (MODIS) instrument between January 2010 through May 2016.
Marit Jentoft-Nilsen/NASA’s Goddard Space Flight Center
The strongest indications of nutrient stress on plankton appeared in the subtropical gyres, which are vast, relatively calm regions of the Atlantic, Pacific, and Indian oceans. In these areas, a layer of warm surface water stifles the flow of colder water from deeper in the ocean.
“When the surface of the ocean warms, it generates this very stable situation where a layer of low-density water sits on top of higher-density cold water,” said study coauthor Adam Martiny, an oceanographer at the University of California, Irvine. “You’ve probably experienced that if you’ve ever been to a lake in the summertime—it’s super warm right on the surface, and very cold deeper down when you stick your legs in.”
This layering blocks the upward flow of nutrient-rich water, limiting the availability of ocean surface nutrients that are crucial for plankton. In the South Pacific, one of the most nutrient-poor regions, a layer of warm surface water contributed to nitrogen and iron shortages, producing the most severe nutrient-related stress that the team discovered.
But the researchers were surprised to find that parts of the North Atlantic experience less nutrient stress than expected. Although there was evidence of a lack of phosphorus, the impact on microorganisms was comparatively mild.
That difference may reflect the biology of the organisms themselves. Phytoplankton can partially compensate for phosphorus shortages by recycling phosphorus more efficiently or replacing phosphorus-rich molecules inside their cells. Nitrogen shortages are harder to overcome because nitrogen is crucial for the proteins and cellular machinery required for photosynthesis and nutrient uptake.
The study revealed that nutrient stress is strongly correlated with seasons and major weather cycles such as El Niño and the Pacific Decadal Oscillation, which lead to warming waters in the Pacific Ocean. During La Niña events, which cool water over a large part of the Pacific, stronger upwelling brought more nutrients to surface waters and reduced stress in some regions. Superimposed on those multi-year cycles, however, was a longer-term trend.
From 2002 through 2021, average sea-surface temperatures increased across nearly 90% of the ocean area examined in the study. Over the same period, nutrient stress generally intensified, consistent with previous hypothesis that warming oceans may become increasingly stratified and less able to replenish surface nutrients.
In many nutrient-poor regions of the Southern Hemisphere, however, the researchers found evidence that nutrient stress had not increased as much as expected despite significant warming. They suspect that microbes capable of capturing nitrogen from the air may partially offset the effects of reduced nutrient mixing.
That finding hints that marine ecosystems may possess more resilience to warming climates than some models predict. It also underscores the complexity of forecasting how ocean biology will respond to continued warming.
“We have two really powerful tools,” said study coauthor Michael Behrenfeld, a biochemist with Oregon State University in Corvallis, Oregon. The tools include satellite observations and cellular studies. “Both produce big data sets, but they are kind of opposites. We have very detailed data about microscopic phytoplankton … and then we have global coverage with satellites.”
By combining satellites that monitor the entire ocean with genetic clues carried inside microscopic plankton, the researchers say they are gaining a new way to track biological responses to changing environmental conditions near real time.
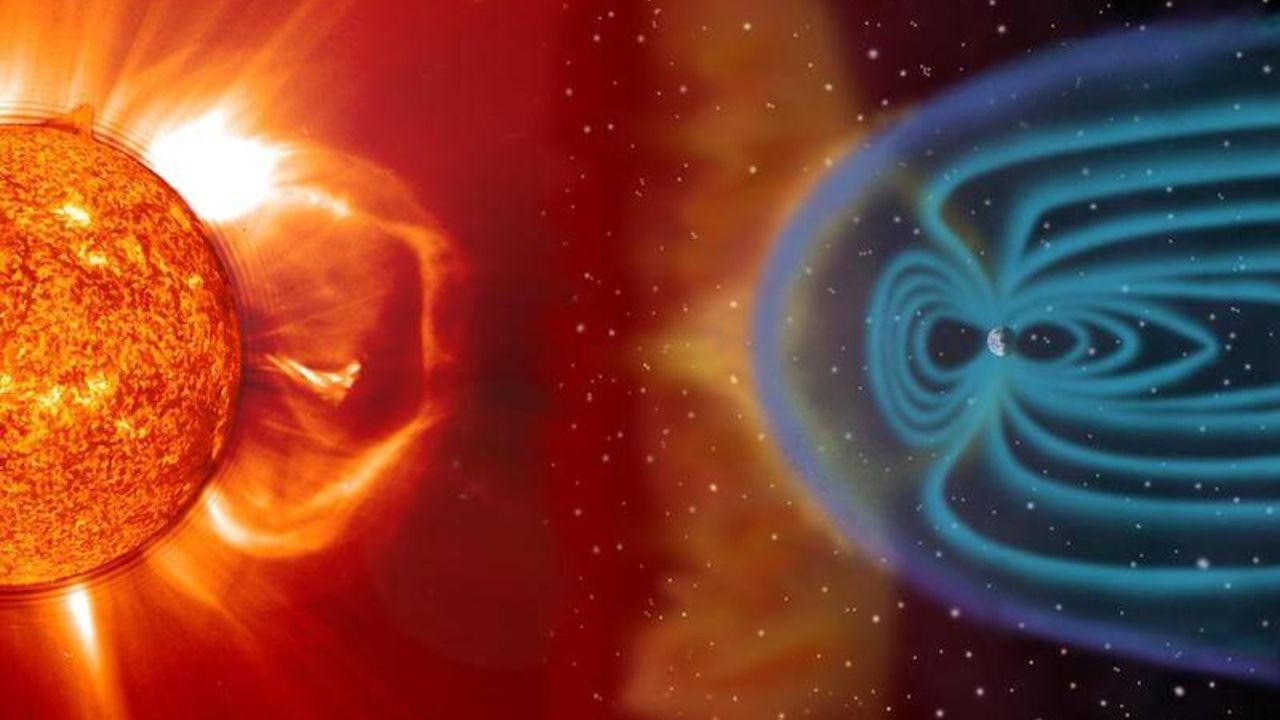
What happens when pileups of solar wind plasma collide with Earth’s protective magnetosphere? New work uses machine learning to examine how strongly these events affect our planet’s magnetic field.
Plasma Pileups
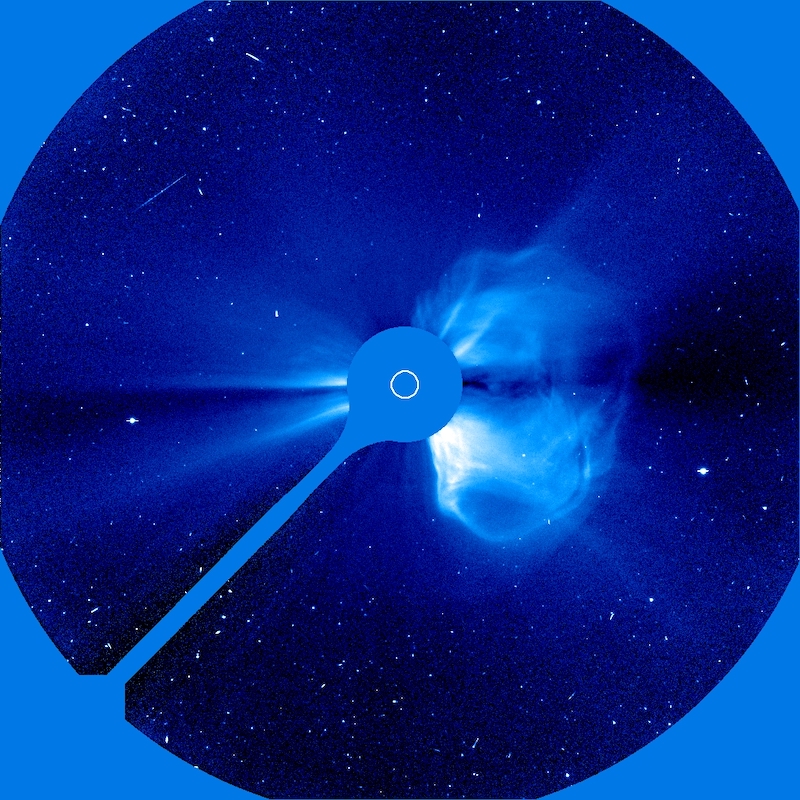
The Solar & Heliospheric Observatory (SOHO) took this coronagraphic image of a coronal mass ejection on 20 April 1998. [SOHO (ESA & NASA)]
Geomagnetic storms driven by solar activity paint night skies with glowing aurorae, but they also threaten spacecraft electronics with showers of high-energy particles. While immense eruptions of solar plasma and magnetic fields called coronal mass ejections are the most infamous example of solar activity, a team led by Yudong Ye (Sun Yat-Sen University) recently focused on another, less destructive form of activity: stream interaction regions.
Stream interaction regions arise when slow-moving solar wind is struck from behind by faster-moving solar wind emitted later. The collision of the two solar wind streams creates a tangle of compressed plasma and strong magnetic fields capable of peeling back Earth’s protective magnetosphere and dumping in high-energy charged particles, with beautiful yet harmful results.
Machine Learning Method
Though stream interaction regions are less disruptive than coronal mass ejections, they’re far more common; they frequently needle Earth’s magnetosphere, especially during the calmer years of the Sun’s activity cycle. Predicting how strongly a stream interaction region will influence Earth’s magnetosphere — in other words, how geoeffective it is — is challenging, however. When two streams of solar wind collide, their properties combine in complex and nonlinear ways that traditional statistical investigations have struggled to pin down.
Now, Ye and collaborators have used machine learning to study the properties and impact of stream interaction regions in a physically meaningful way. They performed their study on a sample of 879 stream interaction events for which there is abundant information, such as temperature, magnetic field strength and direction, and solar wind conditions before and after the event.
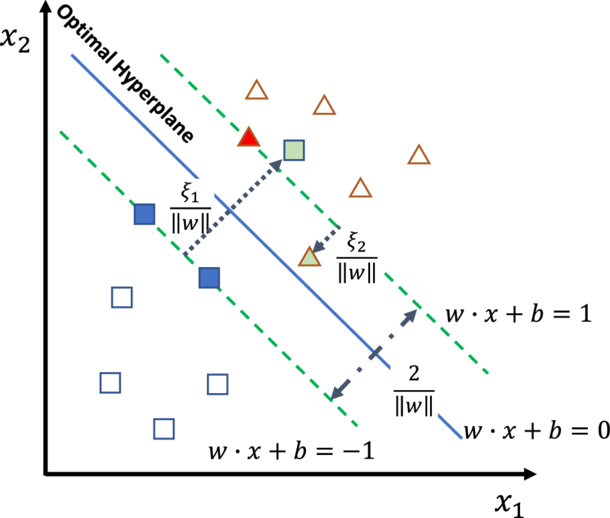
Illustration of the authors’ support vector machine framework. The optimal hyperplane is the boundary that best divides the data by maximizing the distance between the boundary and the data points nearest to it; these points are called support vectors. Square and triangle symbols represent two classes of data. Click to enlarge. [Ye et al. 2025]
Ye’s team based their framework on a support vector machine classifier: a classical machine learning algorithm that draws a mathematical boundary between groups of data while maximizing the distance between the boundary and the data points nearest to the dividing line. The support vector machine algorithm is well-suited to the task of modeling the geoeffectiveness of stream interaction regions because it doesn’t require a particularly vast dataset, can tolerate misclassified events, and allows for a physical interpretation of the results.
A Physical Interpretation
The team first reined in the model’s complexity by identifying the most important features in the dataset. They then determined which features or combination of features had the largest contribution to the output — in other words, which physical parameters most strongly determined the geoeffectiveness of the event.
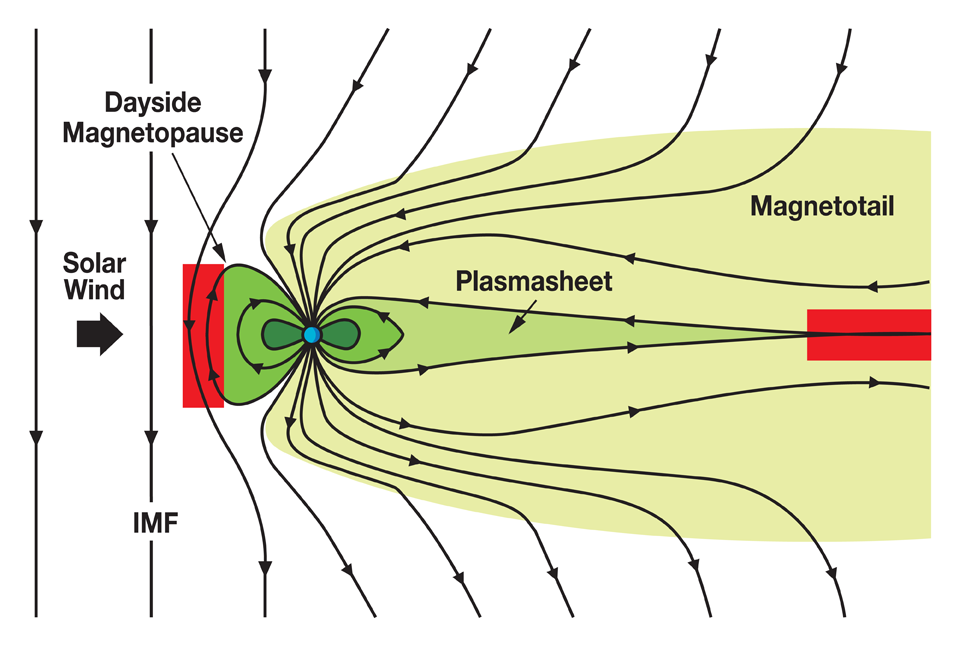
Illustration of how the interplanetary magnetic field (IMF) interacts with Earth’s magnetosphere. When the IMF points southward, as it does in this diagram, the impact on Earth’s magnetosphere is increased, with magnetic reconnection occurring in the red areas. Click to enlarge. [NASA]
Ye and collaborators found that the strongest determinants of an event’s geoeffectiveness were how long the solar wind was directed southward, the strength of the solar wind electric field, and the average and minimum strengths of the southward-pointing solar wind magnetic field. These results align with the current understanding of how energy is transferred from the solar wind to Earth’s magnetosphere through magnetic reconnection, a release of magnetic energy driven by rearrangement of magnetic fields. This shows how classical machine learning methods can enhance our ability to predict the outcome of oncoming space weather while simultaneously examining the physical drivers of the event.
Citation
“Assessing the Geoeffectiveness of Stream Interaction Regions Through Physically Interpretable Machine Learning,” Yudong Ye et al 2025 ApJ993 10. doi:10.3847/1538-4357/ae0454
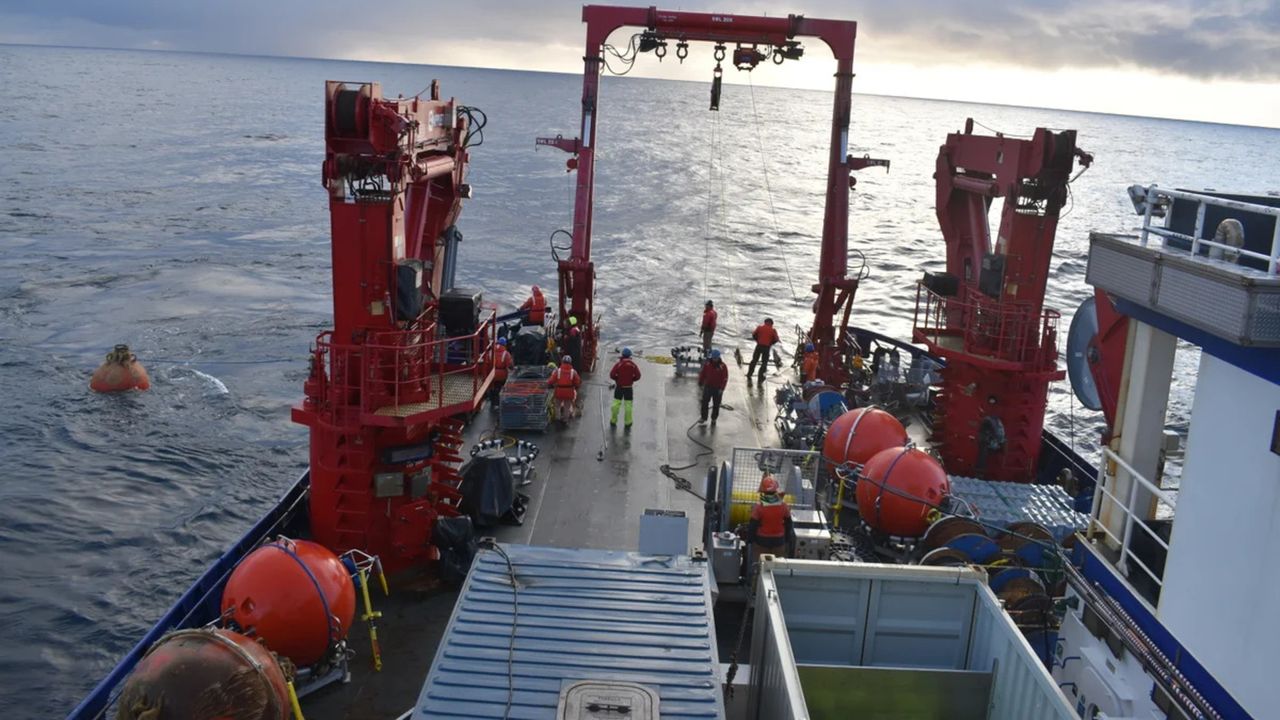
The Ocean Observatories Initiative has been collecting data on physical, chemical, geological and biological conditions in the Atlantic and Pacific Oceans for the past decade
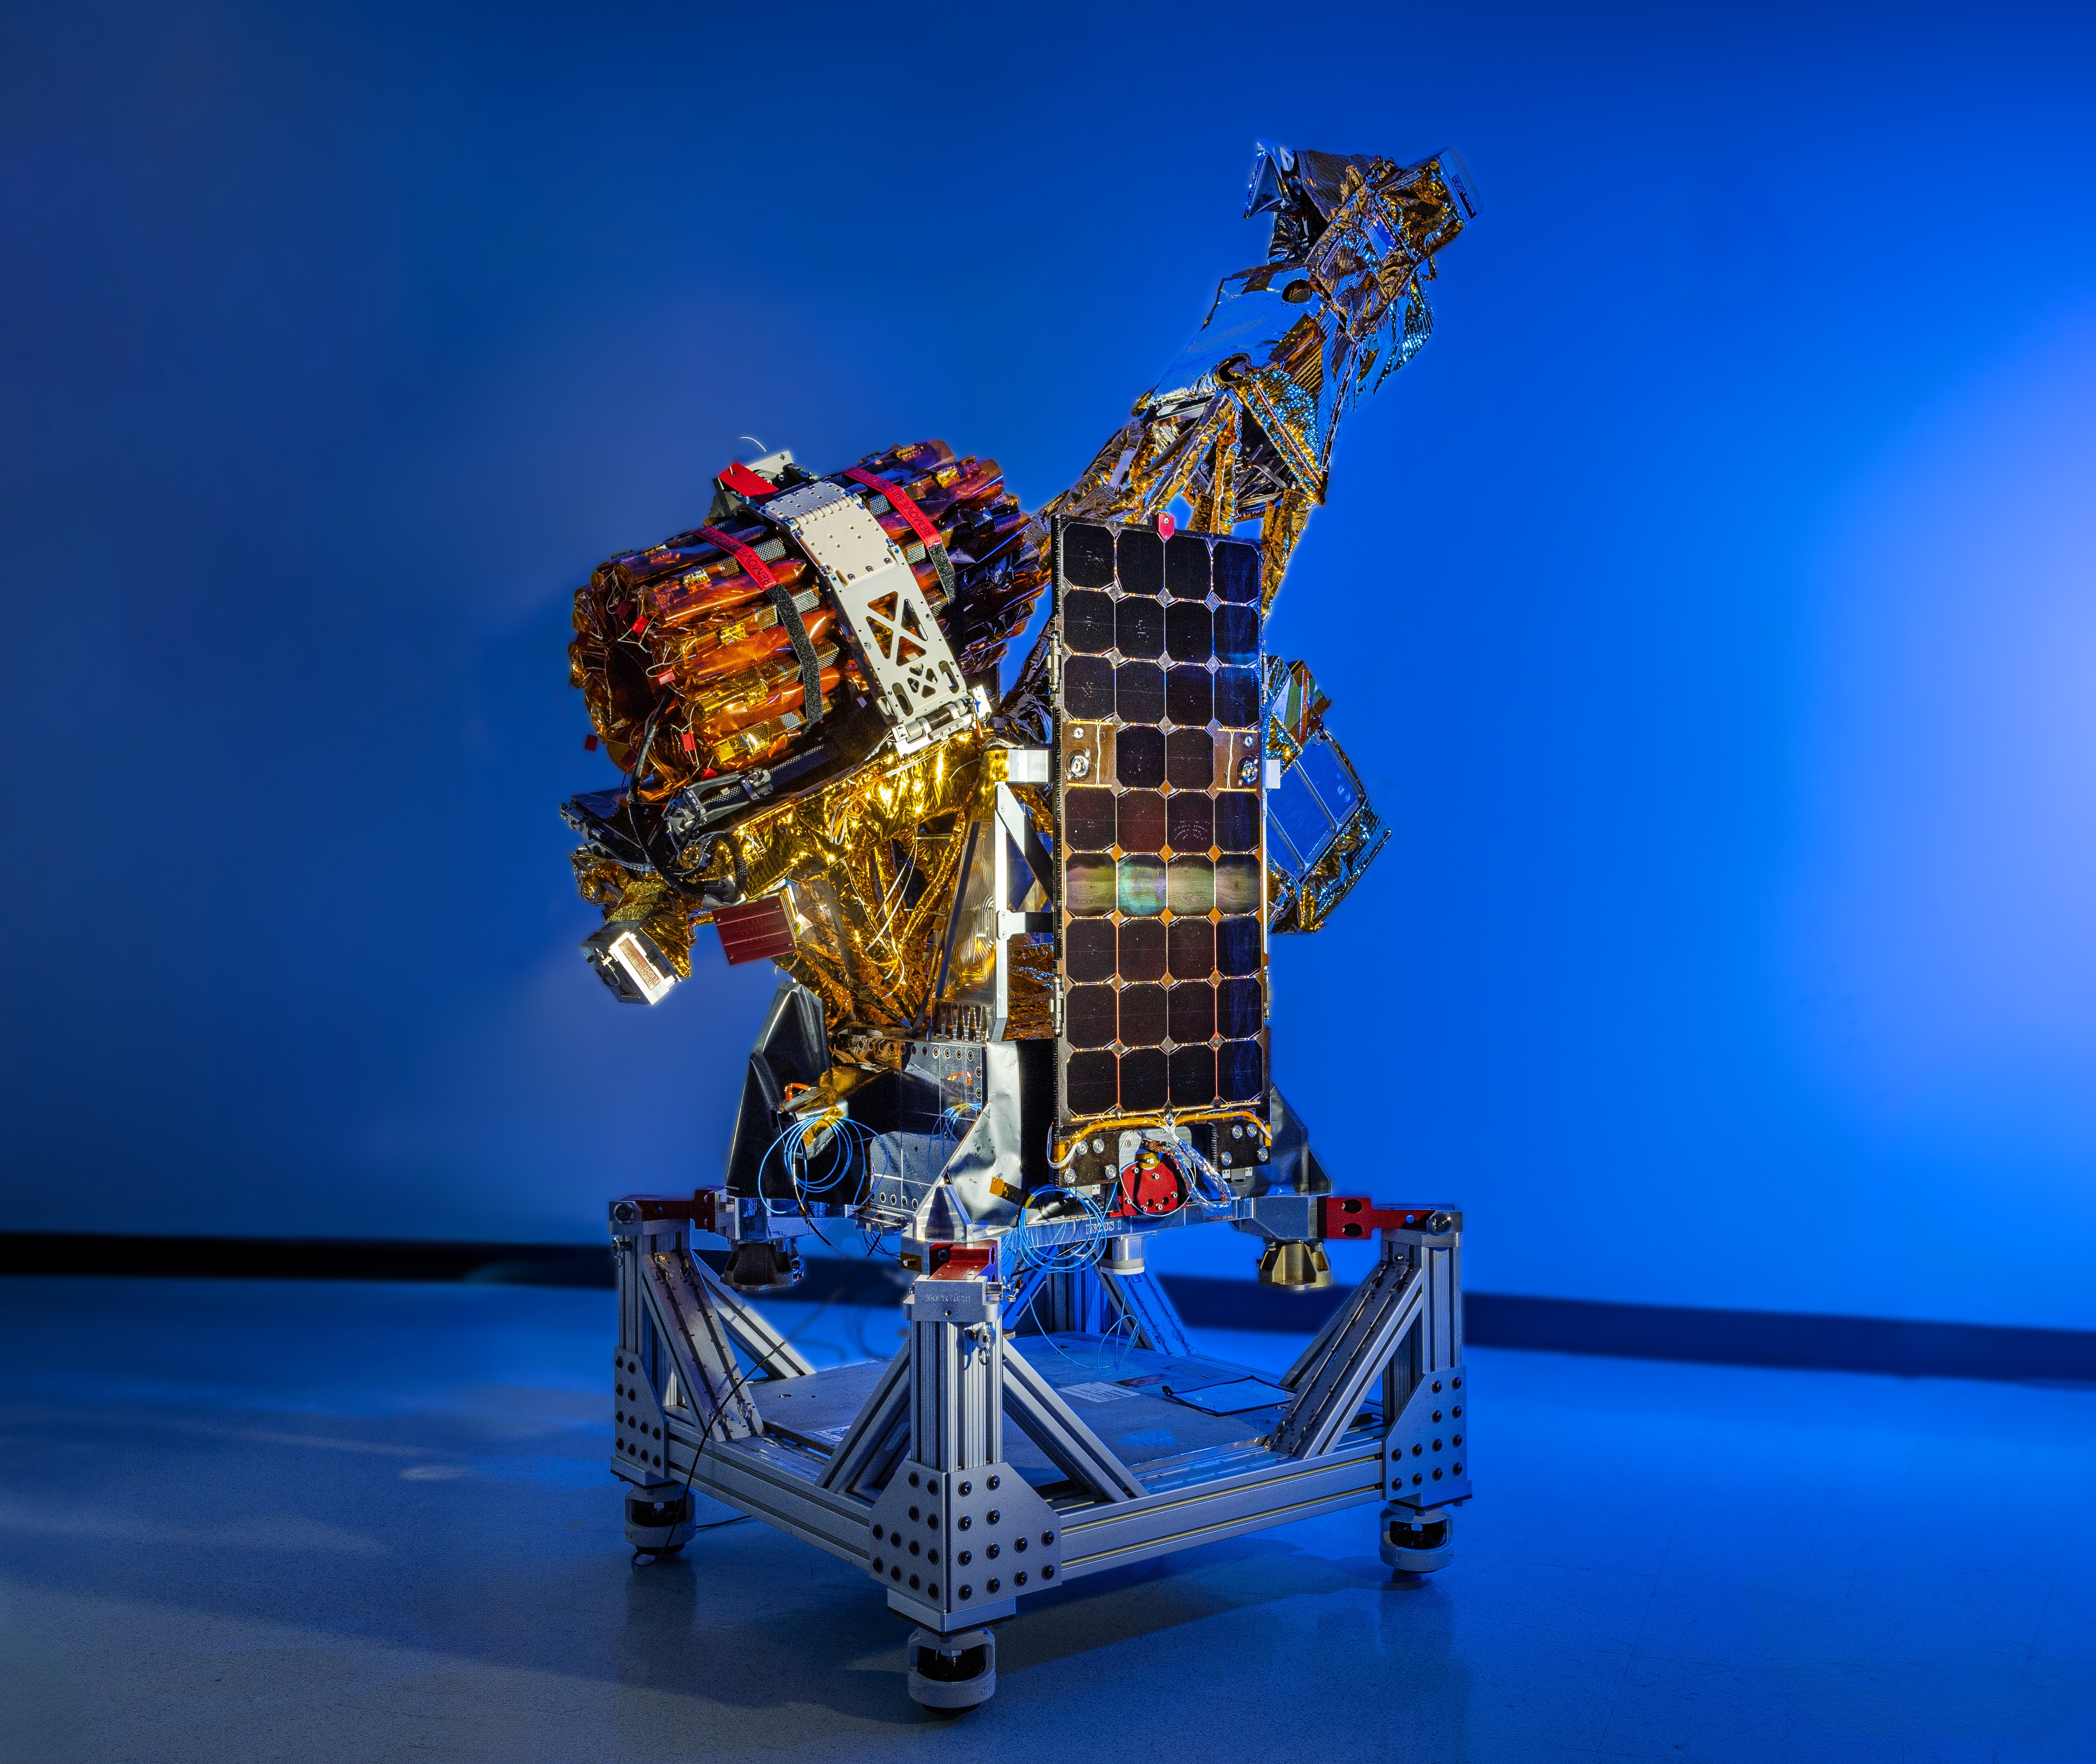
Two of the three SmallSats for NASA’s INCUS mission, including the one shown here, have completed assembly and testing in preparation for shipment to NASA’s Wallops Flight Facility in Virginia for a 2027 launch. From low Earth orbit the satellites will observe the dynamics of tropical convective storms.
Blue Canyon Technologies
Teams working on NASA’s INCUS (Investigation of Convective Updrafts) mission, the first space-based survey of the dynamics of tropical convective storms, have completed assembly and tested two of the mission’s small satellites, or SmallSats. Testing continues on the third SmallSat and is scheduled for completion no earlier than September in advance of a 2027 launch.
The three satellites will fly in tight coordination in low Earth orbit, with the first and second satellites separated by 30 seconds and the second and third satellite by 90 seconds.
Characterized by the sudden and intense lifting of large amounts of air and water, tropical convective storms provide more than half of the world’s precipitation, a crucial source of life-supporting fresh water. But they also produce severe weather, which can increase risks to life and property. The INCUS mission will help improve understanding of where, when, and why convective storms form.
Led by principal investigator Sue van den Heever of Colorado State University in Fort Collins, INCUS will use spaceborne radar instruments developed at NASA’s Jet Propulsion Laboratory in Southern California to observe the vertical motion of air and water, known as convective mass flux, as storms develop and evolve. The mission will also explore how environmental factors such as air temperature, humidity, pressure, wind speed, and wind direction correlate with that movement.
These insights will improve storm forecasting, potentially mitigating loss of life and property damage in affected communities, by helping decision-makers plan for and respond to severe weather events and manage freshwater supplies.
Teams at NASA JPL built each INCUS satellite’s radar, which were combined with a deployable mesh radar reflector made by Tendeg in Louisville, Colorado. The middle satellite also carries a microwave radiometer, also made at NASA JPL, that provides spatial context to the vertical precipitation profiles provided by the radars.
The three assemblies shipped in late 2025 and early 2026 to Blue Canyon Technologies in Lafayette, Colorado, where they were integrated with Blue Canyon’s spacecraft buses. The first two satellites, also called observatories, have successfully undergone vibration and thermal vacuum testing to ensure they will be able to withstand the jostling of launch and the extreme temperatures of space.
These two observatories also shipped to Tendeg, where teams successfully performed test deployments of the reflectors. Then they returned to Blue Canyon for additional testing. They’ll remain in storage before heading out next year to the launch site at NASA’s Wallops Flight Facility in Virginia.
Funded through the Earth Venture Mission-3 acquisition under NASA’s Earth System Science Pathfinder Program, INCUS is one of several missions fulfilling the clouds, convection, and precipitation requirements of NASA’s Earth System Observatory, a series of interconnected missions set to study our home planet’s dynamic natural systems and how they interact. The mission is also part of FALCON (Fleet for the Atmosphere Linking Commercial Observations with NASA), a fleet of atmosphere-observing satellites that will combine hardware contributions from NASA centers, universities, and commercial partners.
Warming waters decrease upwelling and lead to stress on marine microorganisms due to limited availability of vital nutrients. Red indicates the regions of highest nutrient-related stress.
Kel Elkins/NASA’s Scientific Visualization Studio
Editor’s note: This article was updated on June 5.
A new study combining NASA satellite observations, ocean surveys, and genetic testing on marine microorganisms found evidence that warming ocean waters may be limiting nutrient availability across much of the global ocean. The researchers report that this nutrient stress affects microscopic marine organisms and could influence marine ecosystems over time.
The research, published June 5 in Science Advances, tracked the condition of phytoplankton, which form the base of ocean food webs. Rather than measuring nutrients like nitrogen, iron, and phosphorus directly, the researchers inferred stress by tracking subtle shifts in the ratio of carbon to chlorophyll in phytoplankton observed from space. When the amount of chlorophyll decreases relative to carbon as seen in satellite data, it’s an indication that the plankton are stressed.
“As our ocean continues to change, the ability to observe and track ocean conditions through sustained, high quality remote sensing observations has never been more important,” said Laura Lorenzoni, Program Scientist for NASA’s Ocean Biology and Biogeochemistry Program at NASA Headquarters in Washington. “This is fundamental, as plankton communities are the base of the marine food web on which important economic activities rely.”
The research team combined two decades of data from NASA’s Aqua satellite’s Moderate Resolution Imaging Spectroradiometer (MODIS) sensor with plankton samples collected on research cruises around the world. The approach linked large-scale satellite observations with genetic markers in Prochlorococcus, a tiny but abundant marine microbe that shows signs of nutrient stress in its DNA. The result is a global map revealing where phytoplankton are thriving and where they’re struggling.
Ocean chlorophyll, as observed with NASA's Moderate Resolution Imaging Spectroradiometer (MODIS) instrument between January 2010 through May 2016.
Marit Jentoft-Nilsen/NASA's Goddard Space Flight Center
The strongest indications of nutrient stress on plankton appeared in the subtropical gyres, which are vast, relatively calm regions of the Atlantic, Pacific, and Indian oceans. In these areas, a layer of warm surface water stifles the flow of colder water from deeper in the ocean.
“When the surface of the ocean warms, it generates this very stable situation where a layer of low-density water sits on top of higher-density cold water,” said study coauthor Adam Martiny, an oceanographer at the University of California, Irvine. “You’ve probably experienced that if you’ve ever been to a lake in the summertime—it’s super warm right on the surface, and very cold deeper down when you stick your legs in.”
This layering blocks the upward flow of nutrient-rich water, limiting the availability of ocean surface nutrients that are crucial for plankton. In the South Pacific, one of the most nutrient-poor regions, a layer of warm surface water contributed to nitrogen and iron shortages, producing the most severe nutrient-related stress that the team discovered.
But the researchers were surprised to find that parts of the North Atlantic experience less nutrient stress than expected. Although there was evidence of a lack of phosphorus, the impact on microorganisms was comparatively mild.
That difference may reflect the biology of the organisms themselves. Phytoplankton can partially compensate for phosphorus shortages by recycling phosphorus more efficiently or replacing phosphorus-rich molecules inside their cells. Nitrogen shortages are harder to overcome because nitrogen is crucial for the proteins and cellular machinery required for photosynthesis and nutrient uptake.
The study revealed that nutrient stress is strongly correlated with seasons and major weather cycles such as El Niño and the Pacific Decadal Oscillation, which lead to warming waters in the Pacific Ocean. During La Niña events, which cool water over a large part of the Pacific, stronger upwelling brought more nutrients to surface waters and reduced stress in some regions. Superimposed on those multi-year cycles, however, was a longer-term trend.
From 2002 through 2021, average sea-surface temperatures increased across nearly 90% of the ocean area examined in the study. Over the same period, nutrient stress generally intensified, consistent with previous hypothesis that warming oceans may become increasingly stratified and less able to replenish surface nutrients.
In many nutrient-poor regions of the Southern Hemisphere, however, the researchers found evidence that nutrient stress had not increased as much as expected despite significant warming. They suspect that microbes capable of capturing nitrogen from the air may partially offset the effects of reduced nutrient mixing.
That finding hints that marine ecosystems may possess more resilience to warming climates than some models predict. It also underscores the complexity of forecasting how ocean biology will respond to continued warming.
“We have two really powerful tools,” said study coauthor Michael Behrenfeld, a biochemist with Oregon State University in Corvallis, Oregon. The tools include satellite observations and cellular studies. “Both produce big data sets, but they are kind of opposites. We have very detailed data about microscopic phytoplankton … and then we have global coverage with satellites.”
By combining satellites that monitor the entire ocean with genetic clues carried inside microscopic plankton, the researchers say they are gaining a new way to track biological responses to changing environmental conditions near real time.

 Login