
❌

Normal view

In Pursuit of Precision: Remembering John Barker 

31 July 2026 at 20:04

By Laura E.P. Rocchio 

John L. Barker died in early July at age 88. He worked with the Landsat program for more than 30 years; his calibration and characterization work made science-grade Landsat data a reality.

John L. Barker, a seminal force behind Landsat’s science-grade data, died on Monday, July 6, 2026. He was 88. 

Barker was instrumental in transforming Landsat from a technology demonstration satellite that produced pictures of Earth into a well-understood science mission collecting images made from physically-based spectral measurements of Earth’s surface. The calibration standards relentlessly pursued by Barker have broadly informed NASA’s calibration criteria for land remote sensing. 

Described as hard-working, gregarious, extremely sincere, and fun-loving, Barker was a “number chaser” known for his boundless energy, pursuit of precision, and love of data and dance.

Landing on Landsat 

Barker trained as a nuclear- and cosmo-chemist at the University of Chicago’s Enrico Fermi Institute, where his doctoral research focused on the chemical history of cosmic matter in deep-sea sediments. He received his PhD in 1967 and began teaching at the University of Maryland College Park a year later. In 1969, Barker joined the Unitarian Universalist Church of Silver Spring. Doing volunteer work there, he met Charlie Schnetzler, Earth Resources Branch Chief at NASA’s Goddard Space Flight Center. 

When a position became available at NASA Goddard, Schnetzler — who had long recognized Barker’s brilliance — encouraged him to apply. Barker got the position. He started working at Goddard in 1973, a year after Landsat 1 — the very first land Earth-observing satellite — was launched.  

Barker soon became interested in doing environmental research with Landsat and started using the satellite data to monitor sediments in Swift Creek Lake near Richmond, Virginia. He also worked with famed oceanographer Jacques Cousteau and his son Philippe, participating in a proof-of-concept study that received, processed, and relayed Landsat satellite data collected off the coast of Mississippi to Cousteau’s research vessel, the Calypso, within 24 hours. As the Calypso plied the Gulf waters, Landsat satellite data was relayed to Cousteau’s crew to help them find plankton upwellings and sediment plumes. This near-real-time data processing, which took an extraordinary amount of effort at Goddard, was considered a computational feat at a time when it would typically take two months or more to get Landsat images to researchers.  

During this effort, Barker and his data processing collaborators discovered that if the Landsat Multispectral Scanner System’s (MSS) green and red spectral data were collected in high-gain mode (a setting that amplified the sensor’s electrical signal), the higher sensitivity enabled bathymetric measurements to be made in areas where ocean waters were clear. The follow-on NASA-Cousteau Bathymetry Experiment pioneered the field of satellite-derived bathymetry. 

With so much to discover, the energy and pace of work during Barker’s early years at Goddard was intense. Sixty-hour workweeks were the norm (until an energy-saving decision to turn large mainframe computers off at night cut back extensive working hours). 

As Barker continued to use Landsat data for environmental studies, he realized that no one understood the performance of the MSS instruments or the calibration of the data very well. How well did the satellite data match physical measurements made on the ground? How stable were Landsat measurements over time? 

A year after Landsat launched in 1972, Barker began his career with NASA. He was an early, avid Landsat data user. "The Landsat program was created in the United States in the heady scientific and exploratory times associated with taming the atom and going to the Moon,” he remarked years later.
A year after Landsat launched in 1972, Barker began his career with NASA. He was an early, avid Landsat data user. “The Landsat program was created in the United States in the heady scientific and exploratory times associated with taming the atom and going to the Moon,” he remarked years later.

“Much to my surprise, after many years of work on it, I found out that we really didn’t understand the calibration of the Landsat’s MSS systems very well at all,” Barker explained in a 2005 interview.  

Barker, used to making exacting measurements in the world of chemistry, wanted to find out exactly how well-calibrated Landsat data was. 

“I basically decided that, where I could make the biggest contribution — since I had a[Text Wrapping Break]background in physics, engineering, and chemistry… was in the characterization of the instrument,” Barker shared in 2005.  

He spent the next three decades doing just that. 

Knowing the Numbers 

After digging into the calibration of the MSS sensors carried aboard the first three Landsat satellites as Landsat Associate Project Scientist, Barker became the point person for defining the calibration performance requirements of subsequent Landsat satellites. Specifically, he heavily influenced the design, characterization, and sustained calibration effort for Landsat’s 4, 5, and 7. 

During the development and build of the MSS and Thematic Mapper (TM) instruments for  Landsat 4 and 5, Barker spent long stretches of time with the Hughes Santa Barbara engineers doing the instrument build and testing. Despite a tremendously arduous and stressful development cycle for the next-generation Thematic Mapper instrument, what stood out to Barker most from that time was the teamwork and camaraderie between NASA and industry Landsat builders. 

The “embedded NASA scientist” role that Barker initiated in the late 1970s is now a formal position written into the satellite contracts with every new Landsat build. 

With Barker’s encouragement and then-Landsat Assistant Project Scientist Darrel Williams’ and Project Scientist Vince Salomonson’s endorsement, NASA Goddard made characterizing the performance of Landsat 4 and 5 a key mission objective. 

Barker led this characterization effort, called the Landsat Image Data Quality Assessment, or LIDQA. The end-to-end Landsat infrastructure, from sensors to ground processing, was carefully scrutinized to ensure the best image data quality. The effort involved more than 400 external investigators working together with Barker’s Goddard-based team. Barker brought a young scientist named Brian Markham on board, and together they assembled what could be considered Barker’s opus: a six-volume NASA publication of Technical Memorandums that reported on the LIDQA assessments of Landsat 4 and 5. Barker meticulously documented the characterization work of his team in this publication. The printed volumes originally had thick orange covers, and were affectionately referred to as the “Orange Books.”  

“He was certainly instrumental in taking the Landsat sensor data from the pretty picture for analog interpretation to scientific data for digital analyses,” Markham notes.  

The calibration methodology established by Barker and the LIDQA team and documented in the Orange Books has been described as the “first quantitative documentation of the Landsat sensors and their data” and has widely influenced land remote sensing calibration. 

As Williams shares, “John’s work vis-a-vis calibration had a tremendous impact on the wider remote sensing community, showing both what was needed and what was possible.” 

Pursuit of Precision 

Barker was only a peripheral presence during the build of the failed Landsat 6 commercial satellite, turning his attention to the calibration of NASA’s MODIS satellites. When government responsibility for Landsat 7 was restored, Barker, together with Markham, were back at it. 

Barker had a singular focus on improving radiometric accuracy. His drive for data precision was insatiable. This was perhaps a combination of nature and nurture. His father John L. Barker, Sr. invented the radar speed gun, establishing a ±2 mph accuracy, which he had to defend in court. 

Pre-PowerPoint, Barker would roll a carry-on suitcase full of viewgraphs to meetings. “No short and sweet chart sets for him!” recalls former Landsat Systems Engineer and close friend, Terry Arvidson. 

Described as a perfectionist, Barker was always striving for 0.1% precision — or better. 

“The last decimal point is exciting,” Barker exclaimed in a 2005 oral history interview.  

The well-understood and consistent, 50-plus-year data record of Landsat is a result of Barker’s dogged pursuit of precision. But this trait could be both a strength and struggle for Barker. He rarely published his work in peer-reviewed journals because he always thought he could get better results. And his tenaciousness could be a challenge for managers who had to balance his insistence of excellence with the limits of agreed-upon satellite specifications and cost considerations.  

A photograph of John Barker holding an award.
Barker’s work characterizing and calibrating Landsat data earned many awards over the decades. In April 2001, he received the NASA Distinguished Service Medal — NASA’s top honor for federal employees — for his work advancing the U.S. Space Program.

Fortunately, Markham, who Barker had taken under his wing, was able to document and publish much of the work done during this period. A long list of Markham and Barker papers can be found in peer-reviewed literature.  

Markham recalls Barker’s extraordinary energy and excitement and his need for little sleep, even recalling fondly Barker’s uncanny ability to start a long (90 minutes-plus!) calibration conversation just as the work day was ending. 

There were two key lessons he learned from Barker: (1) a number without an uncertainty (±n) is almost meaningless and (2) always have three ways to measure something so you can check for agreement; this will help with the difficult goal of demonstrating accuracy. 

“John was instrumental in creating the philosophy that Landsat was, first and foremost, a scientific instrument that collected calibrated data, not just pictures,” explains former Landsat 9 and Deputy Landsat 8 Project Scientist Jeff Masek.  

“It’s hard to separate his impact from Brian Markham’s since they worked so closely together, but as a team, they always sought to improve the calibration of the on-orbit instruments and use that information to achieve a consistent radiometric record going straight back to 1972.” 

Trailblazer and Mentor 

Barker and Markham were instrumental in shaping the calibration methodology used by Landsat and most NASA land-observing satellites today. The use of desert test sites for vicarious calibration, data collection by newly launched satellites as they under-fly their predecessors during their climb into orbit, pre-launch calibration and testing requirements, multiple onboard calibration sources, spectral band-to-band comparisons across satellites, and the use of the Moon as a calibration target are all concepts Barker championed, adopted, and shared with fellow NASA, U.S. Geological Survey, and university collaborators. This multifaceted methodology is what creates Landsat’s robust scientific data set.   

“We have a calibrated archive now primarily because of John’s seminal efforts to chase down every electron,” says Williams, a longtime Landsat 7 Project Scientist. 

Barker’s influence also extended to every aspect of data integrity. He worked closely with instrument builders and the U.S. Geological Survey’s Landsat calibration team to set up verification processes that ensure satellite instrument data flows correctly from sensor to spacecraft to ground station to data user. 

“He was passionate about Landsat and worked with all levels of the program to make sure we had the best satellite, instruments, data, and products possible,” states Masek.  

During the days of Landsat 7, Barker and Masek worked closely to shape Barker’s calibration presentations into talks that could be grasped by non-calibration scientists. Along the way, Masek, who had formerly known little about calibration, developed a detailed and nuanced understanding of it. 

“I didn’t feel talked down to, I felt like part of the process. He was a great mentor. He helped us all be the best we could be,” Masek recalls. 

Barker’s mentorship extended from the technical to the interpersonal. Jim Irons, later to become Landsat 8 Project Scientist and the Director of the Earth Sciences Division at Goddard, recounts feeling genuinely consoled by thoughtful advice Barker gave him early in his career as he dealt with a difficult professor during his PhD studies. 

Zeal for Calibration, Zest for Life 

While Barker poured himself into his quest for quality data, it was not his only passion. For decades, he was the President of the Goddard Dance Club, a social ballroom dancing organization with nearly 200 members.  

After his 2007 retirement from NASA, Barker could be found dancing 11 hours a week. When the pandemic temporarily shuttered the dancing facilities, Barker and his wife Noni continued to dance for nearly an hour a day at home.  

He danced the samba in Brazil, rode camels in Egypt and Morocco. 

“He was full of life, always had a smile, and had the best laugh ever,” Arvidson shares.  

He loved a good argument and was rarely bitter or angry.  

Masek sums it up this way: “John was a lovely guy.”  

Barker was surrounded by Noni and his two children, Lauren and David, when he passed away in early July at the hospital where he was being treated after a fall.  

His influence marches on. Jeff Pedelty, who Barker mentored on Landsat 7, became the embedded NASA scientist for the Landsat 8 and 9 builds and now supports Landsat 10. He has long kept a photograph of Barker on his desk, with a sticky note reminder: “All the data. All the time.”    

John and Noni were married for X years. They had two children, Lauren and David.
John and Noni were married for 67 years. They had two children, Lauren and David, and danced together around the world and through the decades. 

Thank you to Darrel Williams, Jim Irons, Brian Markham, Jeff Pedelty, Terry Arvidson, and Jeff Masek for sharing their thoughts and memories about John. 

The post In Pursuit of Precision: Remembering John Barker  appeared first on NASA Science.
Satellite Images Revealed Something Unusual About the Color of These Antarctic Islands—Here’s the Odd Reason Behind Their Appearance

28 July 2026 at 15:42

Seen from space, the Danger Islands along Antarctica’s rocky coastline have a distinctive pink-orange coloration, with tiny trails of pink closer to its shorelines.

However, the unique colors of these islands aren’t attributable to minerals, colorful lichens, or other kinds of usual causes. According to NASA, the Danger Islands look the way they do because of their iconic residents.

Now, data about the influence these creatures have on their surrounding habitat his helping scientists monitor the health of an entire Antarctic ecosystem from space.

A Colorful Surprise Spotted from Space

According to a new study’s findings, the vast colonies of Adélie penguins on the Danger Islands are the culprit behind their coloration. More specifically, it is the guano these flightless birds produce that has permanently altered their coloration when seen from space, resulting in pink stains along the shoreline environments where these waddling creatures reside.

Surprisingly, the guano stains offer an effective means of tracking the diets of these birds, which can serve as a good proxy for the broader changes occurring in Antarctica’s marine environment.

NASA Danger Islands
NASA image based on Landsat satellite imagery by Michala Garrison, showing pink guano stains along the coastlines of Heroina and Beagle Island (Image Credit: USGS/NASA Earth Observatory/Michala Garrison).

Primarily, this is because these large penguin colonies can deposit enough guano that their presence is detectable in satellite imagery, as is revealed in Landsat satellite imagery collected since the mid 1980s. The distinctive pinkish hue observed on the Danger Islands today indicates a diet rich in krill, whereas eating more fish would produce very different color signatures—all of which can be detected through satellite observations.

Decades of Penguin Activity Revealed

For the new research, scientist Casey Youngflesh with the Department of Biological Sciences at Clemson University, along with her coauthors, analyzed more than three decades of Landsat satellite imagery collected from 1984 through 2013.

These observations, combined with samples collected from field studies involving penguin colonies, helped the researchers establish links between specific color patterns and the balance of krill and fish in the birds’ diets.

Among the team’s findings, the data revealed a very close relationship between penguin food sources and the extent of sea ice in the surrounding area, particularly during the breeding season of these shore-dwelling birds.

penguins
In the drone image above, a colony of penguins can be seen in two large circular groups along Antarctica’s coastline (Image Credit: Thomas Sayre-McCord/WHOI/MIT)

Colonies of penguins along the warmer Antarctic Peninsula and West Antarctica—locations where there is less sea ice—revealed a greater reliance on krill. By contrast, Eastern Antarctic penguins consumed more fish in areas where sea ice persisted for longer. This higher-quality food source is also linked to improved chick growth and a greater degree of overall population success in the long term.

“Sea ice is such a hugely important factor in the Antarctic marine environment,” said Youngflesh. “The structure of the region’s food web is changing in response.”

The Future of Antarctic Environments

Along with what the team’s findings reveal about the lives and sustenance patterns of penguins, they also bring to mind several questions about the future of their habitat.

Although sea ice in Antarctica was found to be primarily stable during the years Youngflesh and her team examined, since 2013 it has shrunken significantly, reaching record low levels. Further declines are expected in the decades ahead, signaling changes that could push Adélie penguins toward increasingly krill-dependent diets.

This could become complicated as commercial krill fishing has seen expansion in recent years, and recovering populations of whales and seals are also competing for the same food source.

Right now, researchers are working to produce new computer models based on data obtained from the Landsat 8 and Landsat 9 satellites, which will help them continue to observe penguin diets from orbit. This data provides an unusual—but also a remarkably effective—means of monitoring the changing health of Antarctica’s fragile ecosystem.

The findings were reported in a new study, “Space-based monitoring of penguin diet links sea ice, food webs, and population change,” which appeared in the journal Current Biology on July 20, 2026.

Micah Hanks is the Editor-in-Chief and Co-Founder of The Debrief. A longtime reporter on science, defense, and technology with a focus on space and astronomy, he can be reached at micah@thedebrief.org. Follow him on X @MicahHanks, and at micahhanks.com.

Jim Irons, Former Landsat Project Scientist, Wins Pecora Award

10 June 2026 at 15:00
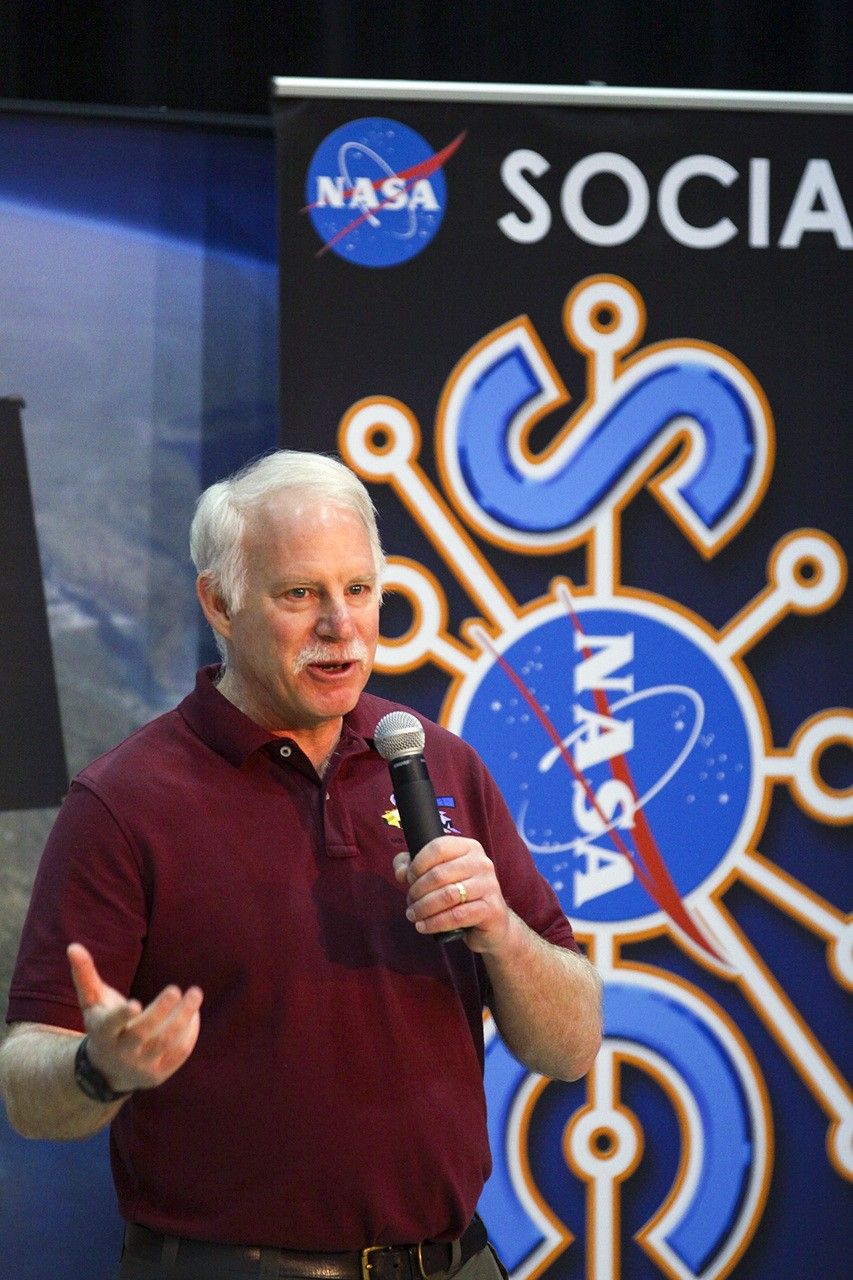
Jim Irons speaking into a microphone with some colorful banners behind him.
Now an emeritus scientist at NASA Goddard Space Flight Center, Dr. Jim Irons is the former Landsat 8 Project and GSFC Earth Science Division Director.

Last month, Landsat’s very own Jim Irons won the prestigious William T. Pecora Award. 

Irons, now an emeritus scientist at NASA Goddard Space Flight Center, played an integral role in shaping the Landsat program into what it is today. He served as deputy project scientist for Landsat 7 before taking over as project scientist for Landsat 8. From the earliest days of Landsat 8—then called the Landsat Data Continuity Mission (LDCM)—all the way through launch and operation, Irons worked across the agency and with colleagues at the USGS to ensure that Landsat continued providing critical data to researchers around the world. He championed rigorous calibration standards and fought to keep the thermal band on Landsat 8. Now, with projects like OpenET relying on evapotranspiration data derived from Landsat thermal imagery, the strength of his vision has only become more apparent. 

Irons also served as the director of NASA Goddard’s Earth Science Division during the turbulent early days of the COVID-19 pandemic. Contending with global disruption, he prioritized making sure that everyone had the support that they needed to continue doing great work. As a leader and a scientist, Irons left a legacy of collaboration and innovation that lives on today. 

We checked in with Irons about his role in Landsat’s history, what it takes to be a good leader, and winning the Pecora award:

NASA missions are so collaborative. Are there mentors, colleagues, or teams that you would want to share this recognition with or give special mention to?

One reason I feel so honored is that prior recipients have been my supervisors, mentors, role models, and colleagues whose work I admired and who inspired me. There’s a long list of people who have been recipients, and I am very honored to be added to that list.

There are also many people who have not yet been recognized who are very deserving. I’ve written letters of support for others, and I hope I’m called on again because there are more people who deserve recognition than there are awards to give out. 

One of the things highlighted in the Pecora Award announcement was your commitment to the long-term continuous data record of Landsat. Looking at the Landsat program, why is this continuity so critical for Earth science today?

Data continuity is the backbone of the Landsat program. We are looking for change over time. When we talk about climate change and the impact of humans on the land surface, those changes are multi-decadal. We wouldn’t be able to understand, characterize, and monitor those changes without a continuous data record.

And it’s really important that the data record is well-calibrated. When we see changes between data from one Landsat sensor relative to another, we need to be confident that it’s a change occurring on the Earth, not a change in the performance of the sensors.

That’s another major contribution cited in your award: how much you pushed for rigorous data calibration and quality assurance. How did you establish those processes, and how did that make Landsat the gold standard of satellite data?

Early in my career, I got in trouble over calibration. NASA was flying an airborne sensor called the Thematic Mapper Simulator, intended to anticipate the capabilities of Landsat 4 and 5. But the operators kept changing the radiometric gain in-flight to maximize the dynamic range. I told NASA Headquarters that we couldn’t compare that data to the actual Thematic Mappers if they kept changing the gain—it wasn’t the same radiometry! The HQ manager got really upset, but I weathered the storm and stuck to my guns.

Later, when Landsat 4 and 5 were returned to the U.S. government from private operation, there had been no real calibration since launch. I advocated for a ground system component at USGS EROS to perform calibration. I didn’t build it, but I did advocate for USGS to hire a brilliant guy named Jim Storey, who developed the software for the precise geolocation of pixels in the data.

When I became Landsat 8 Project Scientist, we needed a pre-launch calibration lead. I advocated for Brian Markham. Brian just did a remarkable job ensuring the calibration of the Operational Land Imager (OLI) and its cross-calibration with previous instruments. He was modest, humble, and built a highly effective team across private industry and agencies.

Another important part of your legacy was the effort to ensure that thermal-infrared measurements continued onto Landsat 8. Why was retaining those measurements so important?

Back when USGS charged for data, the use of thermal data was minimal. Some well-respected papers even claimed it wouldn’t be possible to use thermal data to estimate evapotranspiration rates. Based on that, the Director of Earth Sciences at NASA HQ was convinced that the thermal capability wasn’t providing a return on investment.

But while this debate was ongoing, people began developing methodologies for estimating evapotranspiration and water consumption using thermal data—prominently Martha Anderson at the USDA, and researchers at the University of Idaho. It became crucial for monitoring agricultural water use in the West, and was even used in adjudicating water rights. It was also useful for cloud detection and fire monitoring.

I felt strongly that dropping the thermal capability was inconsistent with our directive to continue the Landsat data record. However, due to time pressures and budget constraints, the decision was initially made to fly Landsat 8 without a thermal instrument. But then, when our schedule was pushed back by an independent review board, a window opened up. Center Director Ed Weiler, who had moved to HQ, supported putting a thermal sensor on the payload. Kathy Richardson and engineer Fernando Pellerano were assigned to build it on an incredibly tight schedule, and they did an unbelievable job.

Now, deriving evapotranspiration rates for water consumption is considered essential. Ironically, for Landsat 9, NASA HQ even briefly considered launching a satellite with only a thermal sensor!

You were the Project Scientist from the earliest days of the Landsat Data Continuity Mission (LDCM) all the way through the Landsat 8 launch and beyond. What was the biggest challenge you faced during its development?

There were a lot of problems. Laughs. Because of the Land Remote Sensing Policy Act of 1992, the government was exploring commercial data buys for the follow-on mission. NASA spent five painful years attempting to implement LDCM as a commercial data buy. Only one company ultimately responded to the RFP, and it wasn’t a good deal for NASA, so it was rejected.

Then we were directed to put the Landsat sensor on an NPOESS platform (combining civilian and military weather satellite requirements). That platform wasn’t technically suitable, and the program ultimately fell apart.

Finally, the Office of Science and Technology Policy directed us to launch a free-flyer. Bill Ochs took over as project manager, and he deserves so much credit for the success of Landsat 8. He essentially rescued the project and put it on a path to success.

Reflecting on the partnership between USGS and NASA, how did you help build that, and what makes long-term interagency collaboration possible?

Darrell Williams and I worked very hard to establish a good relationship between NASA Goddard and USGS EROS. I took many trips to Sioux Falls. With Landsat 7, the EROS Center Director at the time, Don Lauer, brought in new people with great experience, like Jim Storey, Doug Daniels, and Jim Nelson. They developed the geometric rectification software for Landsat 7, and by the time we worked on Landsat 8, they had the right people in place to develop the whole data processing system. And we all got along really well with them. We still keep in touch with a number of them and consider them friends. 

With Landsat 10 on the horizon, are there emerging applications or discoveries you’re excited about?

Yes. A major emerging capability is using Landsat data in concert with other systems, like ESA’s Sentinel-2, or with LIDAR and radar for 3D forest mapping. The community has asked for more frequent observations, especially more frequent thermal observations to measure water consumption more precisely without extrapolating over long gaps during the growing season.

There’s also great interest in using Landsat for water quality assessment, combining it with the PACE mission to monitor coastal and inland water quality. And tracking glacial velocities, glacial retreat, and even population displacement in conflict regions are all expanding areas. Landsat is truly foundational.

What was your biggest takeaway about leadership from your role as Director for the Earth Science Division at Goddard?

I was asked to step up after my predecessor, Piers Sellers—who was an absolute superstar—passed away. My main goal was simply to create an environment where the highly diverse researchers within the division could be successful. I wanted to minimize bureaucratic hindrances so they could focus on their work.

What I learned is that there is a limit to authority. Dictating doesn’t work. You have to lead, engage people, bring them into discussions, and get their buy-in. I used to joke that the job was like working with 1,400 valedictorians! It’s a high-achieving, dedicated group. My challenge was sometimes just reminding them to respect the work of the person down the hall, because people can get so fiercely focused on their own research.

My primary goal during my tenure was to provide stability, especially since it spanned what was then the longest government shutdown in history, followed by the COVID-19 pandemic. I was incredibly impressed by how productive the division remained through a complete disruption in how they worked.

What is the most important piece of advice you would give to young scientists?

Persistence. Persistence in pursuing your interests is critical. The only reason Landsat 8 was a success was that we persisted through several failed attempts to reformulate the program, schedule challenges, and budget uncertainties.

Funding and mission success aren’t entitlements based on your name or reputation. You have to work hard, keep putting forward proposals, do good work, and persist through rejections. If you really believe in what you’re doing, Goddard is a great place to work. You can get a lot done. But it takes persistence.

This interview was condensed and lightly edited for clarity.

Explore More

Jim Irons, Former Landsat Project Scientist, Wins Pecora Award

9 min read

Landsat’s Jim Irons won the prestigious William T. Pecora Award. Irons, now an emeritus scientist at NASA Goddard Space Flight Center,…

Jun 10, 2026
Article

Digging Back in Time in the UAE

5 min read

Once below a shallow sea, Jabal al Fāyah now stands above the desert in the United Arab Emirates as a…

Jun 8, 2026
Article

Fire’s Footprint on Santa Rosa Island

3 min read

A wildland fire charred grassland, coastal sage scrub, and chaparral across one-third of the island, the second largest of the…

Jun 2, 2026
Article

Jim Irons, Former Landsat Project Scientist, Wins Pecora Award

10 June 2026 at 15:00
Jim Irons speaking into a microphone with some colorful banners behind him.
Now an emeritus scientist at NASA Goddard Space Flight Center, Dr. Jim Irons is the former Landsat 8 Project and GSFC Earth Science Division Director.

Last month, Landsat’s very own Jim Irons won the prestigious William T. Pecora Award. 

Irons, now an emeritus scientist at NASA Goddard Space Flight Center, played an integral role in shaping the Landsat program into what it is today. He served as deputy project scientist for Landsat 7 before taking over as project scientist for Landsat 8. From the earliest days of Landsat 8—then called the Landsat Data Continuity Mission (LDCM)—all the way through launch and operation, Irons worked across the agency and with colleagues at the USGS to ensure that Landsat continued providing critical data to researchers around the world. He championed rigorous calibration standards and fought to keep the thermal band on Landsat 8. Now, with projects like OpenET relying on evapotranspiration data derived from Landsat thermal imagery, the strength of his vision has only become more apparent. 

Irons also served as the director of NASA Goddard’s Earth Science Division during the turbulent early days of the COVID-19 pandemic. Contending with global disruption, he prioritized making sure that everyone had the support that they needed to continue doing great work. As a leader and a scientist, Irons left a legacy of collaboration and innovation that lives on today. 

We checked in with Irons about his role in Landsat’s history, what it takes to be a good leader, and winning the Pecora award:

NASA missions are so collaborative. Are there mentors, colleagues, or teams that you would want to share this recognition with or give special mention to?

One reason I feel so honored is that prior recipients have been my supervisors, mentors, role models, and colleagues whose work I admired and who inspired me. There’s a long list of people who have been recipients, and I am very honored to be added to that list.

There are also many people who have not yet been recognized who are very deserving. I’ve written letters of support for others, and I hope I’m called on again because there are more people who deserve recognition than there are awards to give out. 

One of the things highlighted in the Pecora Award announcement was your commitment to the long-term continuous data record of Landsat. Looking at the Landsat program, why is this continuity so critical for Earth science today?

Data continuity is the backbone of the Landsat program. We are looking for change over time. When we talk about climate change and the impact of humans on the land surface, those changes are multi-decadal. We wouldn’t be able to understand, characterize, and monitor those changes without a continuous data record.

And it’s really important that the data record is well-calibrated. When we see changes between data from one Landsat sensor relative to another, we need to be confident that it’s a change occurring on the Earth, not a change in the performance of the sensors.

That’s another major contribution cited in your award: how much you pushed for rigorous data calibration and quality assurance. How did you establish those processes, and how did that make Landsat the gold standard of satellite data?

Early in my career, I got in trouble over calibration. NASA was flying an airborne sensor called the Thematic Mapper Simulator, intended to anticipate the capabilities of Landsat 4 and 5. But the operators kept changing the radiometric gain in-flight to maximize the dynamic range. I told NASA Headquarters that we couldn’t compare that data to the actual Thematic Mappers if they kept changing the gain—it wasn’t the same radiometry! The HQ manager got really upset, but I weathered the storm and stuck to my guns.

Later, when Landsat 4 and 5 were returned to the U.S. government from private operation, there had been no real calibration since launch. I advocated for a ground system component at USGS EROS to perform calibration. I didn’t build it, but I did advocate for USGS to hire a brilliant guy named Jim Storey, who developed the software for the precise geolocation of pixels in the data.

When I became Landsat 8 Project Scientist, we needed a pre-launch calibration lead. I advocated for Brian Markham. Brian just did a remarkable job ensuring the calibration of the Operational Land Imager (OLI) and its cross-calibration with previous instruments. He was modest, humble, and built a highly effective team across private industry and agencies.

Another important part of your legacy was the effort to ensure that thermal-infrared measurements continued onto Landsat 8. Why was retaining those measurements so important?

Back when USGS charged for data, the use of thermal data was minimal. Some well-respected papers even claimed it wouldn’t be possible to use thermal data to estimate evapotranspiration rates. Based on that, the Director of Earth Sciences at NASA HQ was convinced that the thermal capability wasn’t providing a return on investment.

But while this debate was ongoing, people began developing methodologies for estimating evapotranspiration and water consumption using thermal data—prominently Martha Anderson at the USDA, and researchers at the University of Idaho. It became crucial for monitoring agricultural water use in the West, and was even used in adjudicating water rights. It was also useful for cloud detection and fire monitoring.

I felt strongly that dropping the thermal capability was inconsistent with our directive to continue the Landsat data record. However, due to time pressures and budget constraints, the decision was initially made to fly Landsat 8 without a thermal instrument. But then, when our schedule was pushed back by an independent review board, a window opened up. Center Director Ed Weiler, who had moved to HQ, supported putting a thermal sensor on the payload. Kathy Richardson and engineer Fernando Pellerano were assigned to build it on an incredibly tight schedule, and they did an unbelievable job.

Now, deriving evapotranspiration rates for water consumption is considered essential. Ironically, for Landsat 9, NASA HQ even briefly considered launching a satellite with only a thermal sensor!

You were the Project Scientist from the earliest days of the Landsat Data Continuity Mission (LDCM) all the way through the Landsat 8 launch and beyond. What was the biggest challenge you faced during its development?

There were a lot of problems. Laughs. Because of the Land Remote Sensing Policy Act of 1992, the government was exploring commercial data buys for the follow-on mission. NASA spent five painful years attempting to implement LDCM as a commercial data buy. Only one company ultimately responded to the RFP, and it wasn’t a good deal for NASA, so it was rejected.

Then we were directed to put the Landsat sensor on an NPOESS platform (combining civilian and military weather satellite requirements). That platform wasn’t technically suitable, and the program ultimately fell apart.

Finally, the Office of Science and Technology Policy directed us to launch a free-flyer. Bill Ochs took over as project manager, and he deserves so much credit for the success of Landsat 8. He essentially rescued the project and put it on a path to success.

Reflecting on the partnership between USGS and NASA, how did you help build that, and what makes long-term interagency collaboration possible?

Darrell Williams and I worked very hard to establish a good relationship between NASA Goddard and USGS EROS. I took many trips to Sioux Falls. With Landsat 7, the EROS Center Director at the time, Don Lauer, brought in new people with great experience, like Jim Storey, Doug Daniels, and Jim Nelson. They developed the geometric rectification software for Landsat 7, and by the time we worked on Landsat 8, they had the right people in place to develop the whole data processing system. And we all got along really well with them. We still keep in touch with a number of them and consider them friends. 

With Landsat 10 on the horizon, are there emerging applications or discoveries you’re excited about?

Yes. A major emerging capability is using Landsat data in concert with other systems, like ESA’s Sentinel-2, or with LIDAR and radar for 3D forest mapping. The community has asked for more frequent observations, especially more frequent thermal observations to measure water consumption more precisely without extrapolating over long gaps during the growing season.

There’s also great interest in using Landsat for water quality assessment, combining it with the PACE mission to monitor coastal and inland water quality. And tracking glacial velocities, glacial retreat, and even population displacement in conflict regions are all expanding areas. Landsat is truly foundational.

What was your biggest takeaway about leadership from your role as Director for the Earth Science Division at Goddard?

I was asked to step up after my predecessor, Piers Sellers—who was an absolute superstar—passed away. My main goal was simply to create an environment where the highly diverse researchers within the division could be successful. I wanted to minimize bureaucratic hindrances so they could focus on their work.

What I learned is that there is a limit to authority. Dictating doesn’t work. You have to lead, engage people, bring them into discussions, and get their buy-in. I used to joke that the job was like working with 1,400 valedictorians! It’s a high-achieving, dedicated group. My challenge was sometimes just reminding them to respect the work of the person down the hall, because people can get so fiercely focused on their own research.

My primary goal during my tenure was to provide stability, especially since it spanned what was then the longest government shutdown in history, followed by the COVID-19 pandemic. I was incredibly impressed by how productive the division remained through a complete disruption in how they worked.

What is the most important piece of advice you would give to young scientists?

Persistence. Persistence in pursuing your interests is critical. The only reason Landsat 8 was a success was that we persisted through several failed attempts to reformulate the program, schedule challenges, and budget uncertainties.

Funding and mission success aren’t entitlements based on your name or reputation. You have to work hard, keep putting forward proposals, do good work, and persist through rejections. If you really believe in what you’re doing, Goddard is a great place to work. You can get a lot done. But it takes persistence.

This interview was condensed and lightly edited for clarity.

Explore More

Jim Irons, Former Landsat Project Scientist, Wins Pecora Award
9 min read

Landsat’s Jim Irons won the prestigious William T. Pecora Award. Irons, now an emeritus scientist at NASA Goddard Space Flight Center,…

Jun 10, 2026
Article
Digging Back in Time in the UAE
5 min read

Once below a shallow sea, Jabal al Fāyah now stands above the desert in the United Arab Emirates as a…

Jun 8, 2026
Article
Fire’s Footprint on Santa Rosa Island
3 min read

A wildland fire charred grassland, coastal sage scrub, and chaparral across one-third of the island, the second largest of the…

Jun 2, 2026
Article

The post Jim Irons, Former Landsat Project Scientist, Wins Pecora Award appeared first on NASA Science.

Decades of NASA Satellite Data Reveals the Elusive, Enigmatic ‘Urban Pulse” of Six Major Cities

9 June 2026 at 13:02


A multi-institutional team of researchers led by University of Connecticut Professor Zhe Zhu has developed a method for measuring the dynamic, real-time activity of urban environments from space, which they are calling an “Urban Pulse.”

The research team behind the novel urban activity metric said that monitoring a city’s Urban Pulse could help mitigate uncontrolled urban sprawl or decay and enable environmentalists and urban planners to intervene before disasters become unavoidable.

Measuring an Urban Pulse Could Reveal Neighborhoods ‘Not Doing Well”

Although environmentalists and urban planners have a wide range of tools to measure the activities within a city, Zhu notes that scientists have spent decades merely capturing the “outcome of urbanization,” such as a finished road or a newly completed home. However, the researcher and lead author of a study detailing the Urban Pulse methodology added that, even with all the current tools, “you don’t really see the dynamics within an urban area.”

According to a statement detailing the new approach, a city’s pulse is determined by all construction activity within it. Along with new construction, the metric includes repairs, infrastructure improvements, or expansion into previously undeveloped green spaces. When used correctly, the researchers said that it can help determine “if and where their city is not doing well.”

“This would allow (authorities) to be proactive rather than conducting a metaphorical autopsy after the decay of an area is evident,” the team explained.

Bridging the Gap Between Abstract Urban Theories and Measurable, Real-World Data

To test their approach, the team evaluated the Urban Pulse of six cities: Seattle, Shenzhen, Lagos, Mumbai, Dubai, and Mexico City. This involved a deep examination of what the team termed “decades of dense time-series data” collected by NASA’s Harmonized Landsat and Sentinel-2 (HLS)  satellites for physical transformations in an urban environment, such as new construction, measurable infrastructure improvements, and demolition.

Instead of analyzing each city’s changes manually, the team evaluated the above changes on what they called “the neighborhood level” using a deep-learning and time-series-analysis approach called CAPES, developed by former UConn postdoctoral researcher Ji Won Suh. The team said that, by observing these “high-frequency rhythms of development” from a broad ‘outer space’ perspective, their approach “bridges the gap between abstract urban theories and measurable, real-world data.”

Urban Pulse
This figure visualizes Dubai’s rapid expansion as a glowing “urban pulse.” Mapping monthly construction data from the city’s top 65 most active locations, the ridge plot reveals how distinct neighborhoods grow through spiky, cyclical, and asynchronous bursts. Rather than a steady wave, urbanization unfolds as dynamic, localized heartbeats, exposing the complex rhythms driving a modern metropolis. Image Credit: Zhe Zhu/GERS Lab.

After examining CAPES’ results, the team found several key markers within the Urban Pulse. For example, the view from space revealed that growth within cities is not smooth and steady. Instead, Zhu and colleagues said that development happens in “abrupt, intense, and episodic bursts of construction.”

CAPES also revealed that the rhythms of an urban environment are cyclical. For example, while a city may show relatively steady growth on a broader level, individual neighborhoods go through “dramatic boom-and-rest cycles” of expansion and dormancy that don’t appear to follow predictable annual seasons.

The third pattern revealed by measuring the six cities’ Urban Pulse from space was that cities are “asynchronous,” meaning a single city does not ‘beat’ in unison. The team noted that neighborhoods “pulse at completely different times.” When it functions properly, this “uncoordinated rhythm” helps prevent the city’s infrastructure and labor markets from “overheating.”

Unlike previous methods for tracking a city’s evolution, the team noted that their Urban Pulse approach can help researchers “visualize a city’s reaction to global shocks.” For example, the team said that their analysis captured “the exact moment the COVID-19 pandemic triggered a widespread, synchronized ‘cardiac arrest’ in urban development worldwide.”

However, their new tool also revealed what the researchers termed “profound inequalities” in how individual cities recovered from the dramatic halt to urban growth. For example, the team said that the Urban Pulse of Shenzhen revealed synchronized ‘dips’ in activity, followed almost immediately by “rapid, policy-driven rebounds.” However, the same Orban Pulse analysis showed that the reactions in Mumbai and Mexico City were much more “muted.”

“It’s like in human beings,” Zhu explained. “When you get a disease, it’s not going to show up exactly the same in different people.”

A ‘Very Impactful Tool’ for Navigating Cities

Although the Urban Pulse metric offers a tantalizing tool for academics, the team noted real-world benefits for global policymakers, urban planners, and environmentalists, adding that “it serves as an early warning system.”

“By monitoring the rhythm, rate, and amplitude of neighborhood pulses, governments can identify early signs of urban decay or unsustainable sprawl and intervene before crises become entrenched,” they explained.

The team also suggested that making Urban Pulse data publicly available could “revolutionize how everyday people interact with their cities.” For example, an urban family considering a move to a new city or a new part of their current city could track a target neighborhood’s pulse to spot early warning signs of decay or early indicators of positive-trending growth. The same data could help business owners plan new locations or expanded service routes, depending on the business profile and the local Urban Pulse trends.

“This is going to be a very impactful tool influencing not only top-down policy decisions from governments but also bottom-up decisions from everyday people navigating their cities,” Zhu explained.

In a recent study, “The Urban Pulse: Diagnosing the urbanization process as spiky, cyclical, and asynchronous” was published in the Proceedings of the National Academy of Sciences.

Christopher Plain is a Science Fiction and Fantasy novelist and Head Science Writer at The Debrief. Follow and connect with him on X, learn about his books at plainfiction.com, or email him directly at christopher@thedebrief.org.

❌