❌

Reading view

Monthly Roundup: Science of the Sun

three images of the Sun

The Sun’s activity history, the sources of tiny jets, and how magnetic fields might impact space weather forecasts: today’s Monthly Roundup introduces a trio of recent research articles from the Astrophysical Journal that tackle hot topics in solar physics.

From 1755 to 2020: Reconstructing Centuries of Solar Activity

Since the 1970s, regular monitoring of the Sun’s magnetic field has allowed researchers to decipher the Sun’s behavior as it cycles through periods of low and high activity. But what resources exist for studying the Sun’s past behavior? To investigate the long-term behavior of the Sun, researchers reach for historical records of sunspots, which stretch back to the 1700s.
maps of simulated photospheric magnetic fields

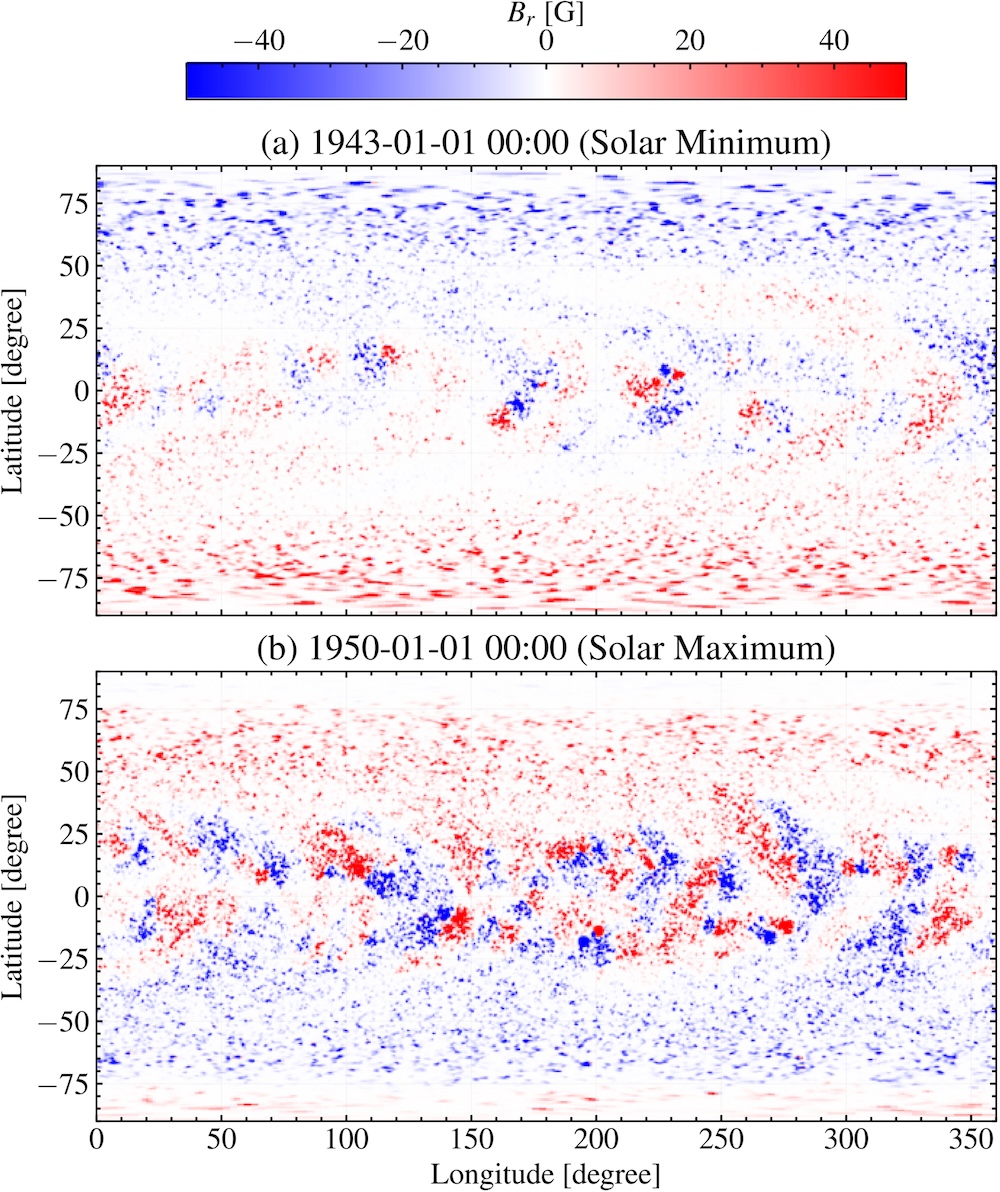
Example maps of the simulated photospheric radial magnetic field during a period of low (top) and high (bottom) solar activity. Click to enlarge. [Jha et al. 2026]

Bibhuti Kumar Jha (Southwest Research Institute) and collaborators explored whether historical records and modern statistics could be used to reconstruct the behavior of the solar magnetic field centuries into the past. Jha’s team used recorded sunspot numbers from 1755 to 2020 as an input for their newly developed Synthetic Active Region Generator, which generates synthetic solar active regions based on known statistics of these regions. This catalog of active regions becomes the input for the Advective Flux Transport model, which simulates the active regions as they emerge and evolve, allowing for an estimation of the magnetic field across the Sun’s disk.

Jha and coauthors found that this method successfully reproduced the expected large-scale behavior of the Sun’s magnetic field across multiple solar cycles, such as the reversal of the polarity of the solar magnetic field near the peak of the activity cycle. While this work highlights the impressive results obtained from combining historical sunspot records with modern sunspot statistics, the team pointed out that this method cannot accurately reproduce all quantities because of the nonlinear nature of the underlying physics. Future work will refine the model further, and in the meantime, the team’s simulated historical magnetic field maps will be made publicly available.

Where Do the Tiniest Coronal Jets Come From?

The Sun’s atmosphere is filled with an ever-shifting maze of magnetic field lines, which reconfigure and release pent-up magnetic energy in a process called magnetic reconnection. Magnetic reconnection can launch particles and heat plasma, and it’s thought to be responsible for driving jets on a variety of scales in the Sun’s tenuous outer atmosphere, or corona. Annu Bura (Indian Institute of Astrophysics; Pondicherry University) and coauthors investigated the physical origins of the smallest of these reconnection driven jets, picoflare jets, using data from the Extreme Ultraviolet Imager on board Solar Orbiter. Solar Orbiter has ventured within 0.3 au of the Sun, and its Extreme Ultraviolet Imager has returned exceptionally precise high-energy images of our home star.
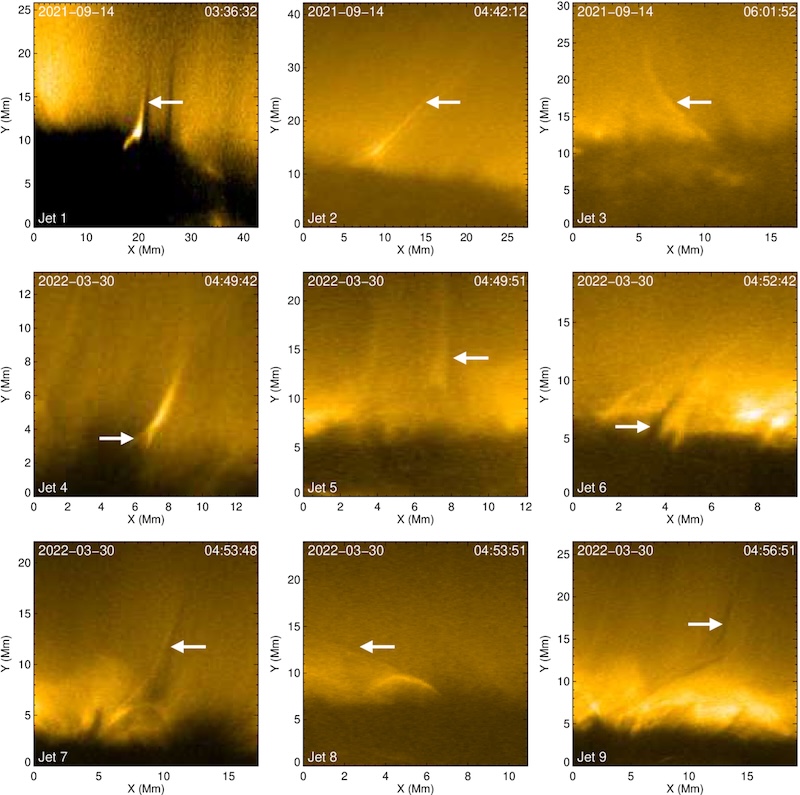
Examples of coronal jetlets

Examples of jets identified in this study. You can see an animation of this figure. [Bura et al. 2026]

Bura and collaborators identified picoflare jets by the presence of a hot, bright spire coupled with a cool, dark streak, forming a structure shaped like the letter “Y” upside down. They found that the bright and dark features were on average 650 and 490 kilometers wide, respectively, with a typical jet length of 16,900 kilometers. They also found that the bright features moved more quickly than the dark features, and the jets tended to last about 6 minutes. Overall, these measurements place the jets in between the scales expected for picoflare jets and slightly larger features called jetlets, though the energies are consistent with expectations for picoflare jets.

Using radiation magnetohydrodynamics simulations, the team explored the origins of their sample of jets. The simulations suggested that the bright features arose from hot, tenuous coronal plasma, while the accompanying dark features were due to cooler, denser plasma venturing upward from deeper in the Sun’s atmosphere, in the chromosphere. Overall, the simulations and observations support a picture in which picoflare-scale jets are driven by magnetic reconnection after magnetic flux emerges through the Sun’s surface. This echoes the formation route of larger coronal jets, suggesting that this process may apply to a wide range of physical scales.

Investigating the Influence of the Solar Polar Magnetic Field

The vast majority of our observations of the Sun have come from within a few degrees of the ecliptic plane, either from telescopes situated on Earth’s surface or from spacecraft that stuck close to the plane of our solar system. With rare but notable exceptions — the Ulysses spacecraft, which measured the Sun’s magnetic field and plasma environment from a near-polar orbit, and Solar Orbiter, which took the first-ever image of the Sun’s poles in November 2025 — the Sun’s poles have remained hidden from our instruments.

Our limited knowledge of the Sun’s polar magnetic field has consequences for our ability to model space weather events like coronal mass ejections. A team led by Xiao Zhang (Chinese Academy of Sciences; University of Chinese Academy of Sciences) has used numerical simulations to investigate how solar polar magnetic field conditions influence the propagation of a coronal mass ejection (CME) through the solar system.
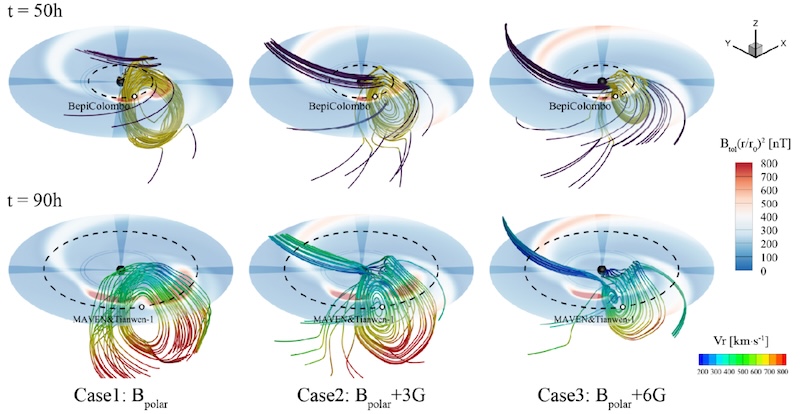
Simulation results showing the propagation and expansion of a coronal mass ejection

Simulation results showing how the propagation and expansion of a CME are affected by the polar magnetic field strength. Click to enlarge. [Zhang et al. 2026]

The team simulated a CME from 4 December 2021, which was observed by the BepiColombo spacecraft at Mercury and Tianwen-1 and MAVEN at Mars. The simulations showed that as the polar magnetic field strength increases, the CME’s movement through the solar system becomes slower. CMEs typically expand as they billow outward from the solar corona and sweep past the planets; increasing the polar magnetic field strength slowed the CME’s expansion as well. A stronger polar magnetic field also alters the background solar wind, making it slower and denser. Overall, these results demonstrate that the strength of the Sun’s poorly constrained polar magnetic field can have a significant impact on the movement and evolution of a CME. In future work, Zhang’s team plans to expand their investigation to a larger sample of CMEs.

Citation

“Historical Reconstruction of Solar Surface Magnetism from Cycles 1–24 Using the Synthetic Active Region Generator and the Advective Flux Transport Model,” Bibhuti Kumar Jha et al 2026 ApJ 997 279. doi:10.3847/1538-4357/ae279a

“On the Origin of Coronal Picoflare Jets,” Annu Bura et al 2026 ApJ 1000 94. doi:10.3847/1538-4357/ae48e6

“Influence of Solar Polar Magnetic Fields on the Propagation of Coronal Mass Ejections,” Xiao Zhang et al 2026 ApJ 1000 200. doi:10.3847/1538-4357/ae4c54

The post Monthly Roundup: Science of the Sun appeared first on AAS Nova.

  •  

Featured Image: Disequilibrium on Display

eight images from the Hubble Arp Galaxy Survey

Notice anything unusual about these galaxies? Each of the scenes above is crafted from observations from the Hubble Arp Galaxy Survey, which turned the talents of the Hubble Space Telescope toward 216 targets in the Arp and Arp–Madore catalogs. These catalogs contain galaxies that are visibly out of equilibrium, either caught in the middle of an interaction with another galaxy, sporting strange structures, or illuminated by brilliant starbursts. Julianne Dalcanton (Flatiron Institute; University of Washington), Meredith Durbin (University of Washington; University of California, Berkeley), and Benjamin Williams (University of Washington) designed the survey to create an archive of previously unobserved sources in these catalogs of peculiar galaxies. In addition to providing a new high-resolution view of these sources, the team hopes that the survey will serve as a launchpad for new investigations and complementary observations from facilities like JWST and the Atacama Large Millimeter/submillimeter Array. To learn more about the Hubble Arp Galaxy Survey and see more of the new images, be sure to check out the full article linked below.

Citation

“The Hubble Arp Galaxy Survey,” Julianne J. Dalcanton et al 2026 ApJS 283 25. doi:10.3847/1538-4365/adfc67

The post Featured Image: Disequilibrium on Display appeared first on AAS Nova.

  •  

Featured Image: A Treasure Trove of Strong Lenses

Hubble and DESI images of four gravitationally lensed sources

The seemingly warped and stretched galaxies in the image above show the work of gravitational lensing, in which the powerful gravitational pull of galaxies or galaxy clusters bends the light from background objects. Xiaosheng Huang (University of San Francisco and Lawrence Berkeley National Laboratory) and coauthors have used a neural network to amass a sample of 3,500 gravitational lensing candidates in data from the Dark Energy Spectroscopic Instrument (DESI) Legacy Surveys. Now, the team has used the Hubble Space Telescope to confirm some of the most promising candidates. Four of the newly confirmed systems are presented in the image above, with the DESI data shown in color and the higher-resolution Hubble data in black and white. Huang and collaborators also demonstrated the ability of their forward-modeling pipeline, GIGA-Lens, to constrain lens properties rapidly, even for large images like those from Hubble. Ultimately, Huang and coauthors hope to identify lensing systems that can be used to search for low-mass dark matter halos and test our theories of cosmology, as well as those that can be monitored for signs of lensed supernovae — providing a way to measure the expansion rate of the universe. To learn more about this sample of gravitational lenses and what the team plans to do next, be sure to check out the full research article linked below.

Citation

“DESI Strong Lens Foundry. I. HST Observations and Modeling with GIGA-Lens,” Xiaosheng Huang et al 2026 ApJ 998 69. doi:10.3847/1538-4357/ae22d2

The post Featured Image: A Treasure Trove of Strong Lenses appeared first on AAS Nova.
  •  

Featured Image: Hubble Revisits the Crab Nebula

Hubble Space Telescope image of the Crab Nebula

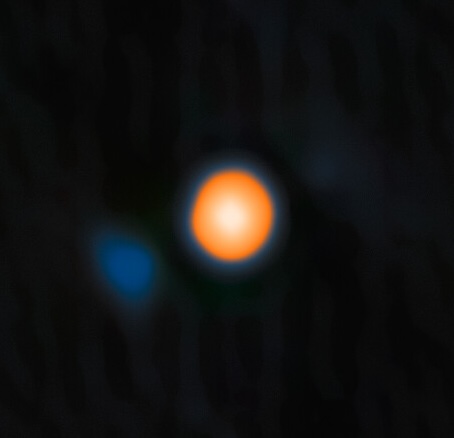
In 1999–2000, the Hubble Space Telescope captured what was then the most detailed image ever taken of the Crab Nebula. In the quarter-century since the release of that image, the nebula — the remnant of a star observed to explode as a supernova in July 1054 — has been slowly unfurling and changing as the ejected stellar material expands into space. Now, as reported in a research article by William Blair (Johns Hopkins University) and collaborators, astronomers have turned Hubble’s inquisitive eye toward the Crab Nebula once again. One of the new images is shown above (click for the full view!). By comparing the new and old Hubble images, Blair’s team uncovered dramatic changes in the nebula’s intricate filamentary structure. These changes are due to the nebula’s three-dimensional expansion as well as evolution in the density of its knots and filaments. To learn more about the new Hubble portrait of the Crab Nebula, be sure to check out the full article linked below.

Citation

“The Crab Nebula Revisited Using HST/WFC3,” William P. Blair et al 2026 ApJ 997 81. doi:10.3847/1538-4357/ae2adc

The post Featured Image: Hubble Revisits the Crab Nebula appeared first on AAS Nova.
  •  

Featured Image: Hubble Samples a Dusty Cosmic Sandwich

protoplanetary disk IRAS23077+6707

Dracula's Chivito

Hubble Space Telescope image of Dracula’s Chivito. [Monsch et al 2026]

The disks of gas and dust that collect around young stars — protoplanetary disks — hold the secrets to how planets form. When a protoplanetary disk is tilted edge-on from our perspective, the disk’s dense, dusty midplane blocks the light from the star at the center, revealing structures like winds and jets wafting off of the disk. Pictured above and to the right is the spectacular edge-on protoplanetary disk IRAS23077+6707, which is also known as Dracula’s Chivito. (Delightfully, the name combines references to the backgrounds of two of the astronomers who identified the object as a protoplanetary disk: one hailing from Transylvania and another from Uruguay, where a sandwich called a chivito is the national dish.) Though the distance to this disk is not known, estimates place it around 1,000 light-years away, which would make the disk about 4,200 au across — larger than any other known protoplanetary disk. Recently, a team led by Kristina Monsch (Center for Astrophysics ∣ Harvard & Smithsonian) published their Hubble Space Telescope observations of Dracula’s Chivito. These observations show in great detail the structure within the disk, including large-scale asymmetries, wispy tendrils, and potential signs of dust grains settling toward the midplane. To learn more about this exceptional protoplanetary disk, be sure to check out the full research article linked below.

Citation

“Hubble Reveals Complex Multiscale Structure in the Edge-On Protoplanetary Disk IRAS23077+6707,” Kristina Monsch et al 2026 ApJ 996 45. doi:10.3847/1538-4357/ae247f

The post Featured Image: Hubble Samples a Dusty Cosmic Sandwich appeared first on AAS Nova.
  •  

Selections from 2025: The Nine-Ringed Bullseye Galaxy

Bullseye galaxy

Editor’s Note: For the remainder of 2025, we’ll be looking at a few selections that we haven’t yet discussed on AAS Nova from among the most-downloaded articles published in AAS journals this year. The usual posting schedule will resume January 2nd.

The Bullseye: HST, Keck/KCWI, and Dragonfly Characterization of a Giant Nine-ringed Galaxy

Published February 2025

Main takeaway:

Bullseye galaxy rings

Red ellipses overplotted on the first eight rings identified with Hubble in the Bullseye galaxy. Click to enlarge. [Pasha et al 2025]

Using a combination of the Hubble Space Telescope, the Dragonfly Telephoto Array, and the Keck Cosmic Web Imager, Imad Pasha (Yale University) and collaborators discovered and performed deep follow-up observations of a giant collisional ring galaxy aptly nicknamed the “Bullseye” galaxy (LEDA 1313424). The team identified a staggering nine rings in the Bullseye with a likely tenth that has since faded — the most rings found in any collisional ring galaxy to date. The rings are a result of a small blue dwarf galaxy shooting through the Bullseye’s core about 50 million years ago, sending ripples through the galaxy.

Why it’s interesting:

Galaxy mergers and interactions are commonplace in the universe, but it is very rare for a dwarf galaxy to strike right through a large galaxy’s core. When this does happen, the collision sends shock waves through the impaled galaxy, sweeping gas and dust outward and forming rings where star formation can occur (hence the name, collisional ring galaxy). These galaxies are valuable sites to explore galactic structure and evolution as well as provide a unique case to study galaxy mergers and interactions. Previously discovered collisional ring galaxies have at most two or three rings, so when Pasha and collaborators found the stunning nine in the Bullseye, it was clear they caught something significant.

Catching the Bullseye at a lucky time in its evolution:

Why does the Bullseye have so many rings? Theoretical studies of these head-on collisions predict that many rings will form and travel outward after the initial crash; however, the rings tend to dissolve after only a few hundred million years. Catching this collision only 50 million years after it happened means we are witnessing the earlier stages of the Bullseye’s evolution. This lucky discovery not only confirms theoretical predictions for collisional ring galaxies, it also may be a clue to how another unique galaxy type, giant low-surface brightness galaxies, originate. Given the wispy ring material found at very large radii from the Bullseye, the authors suggested that collisional ring galaxies may evolve into giant low-surface brightness galaxies as they expand outward and fade. Further investigation and a larger sample of collisional ring galaxies are necessary to confirm this hypothesis, but the Bullseye provides interesting and critical observational evidence of these predictions for the first time.

Citation

Imad Pasha et al 2025 ApJL 980 L3. doi:10.3847/2041-8213/ad9f5c

The post Selections from 2025: The Nine-Ringed Bullseye Galaxy appeared first on AAS Nova.

  •  

Selections from 2025: The Sun Changed Course in 2008

extreme-ultraviolet image of the Sun

Editor’s Note: For the remainder of 2025, we’ll be looking at a few selections that we haven’t yet discussed on AAS Nova from among the most-downloaded articles published in AAS journals this year. The usual posting schedule will resume January 2nd.

The Sun Reversed Its Decades-Long Weakening Trend in 2008

Published September 2025

Main takeaway:

plots of solar wind parameters from 2008 to 2025

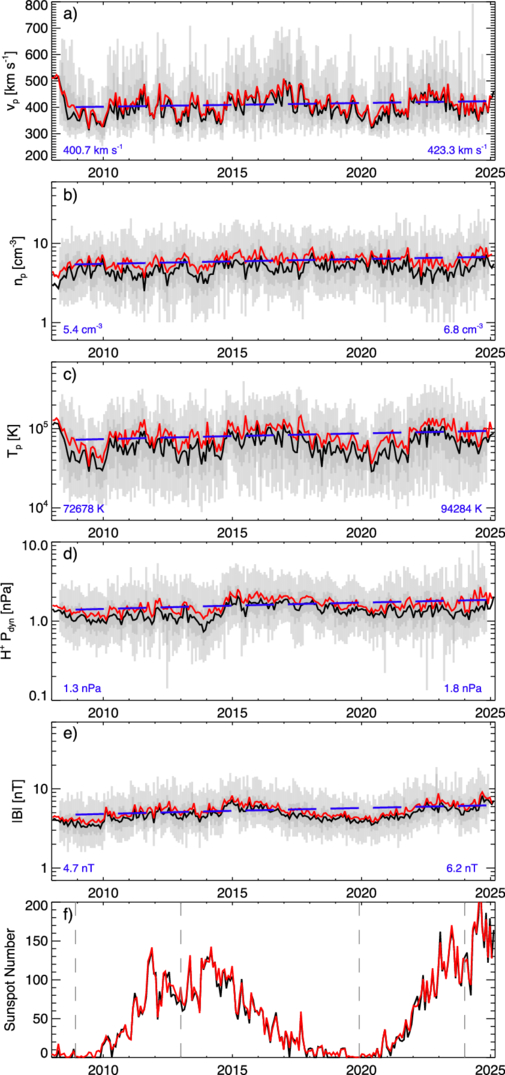
Various solar wind parameters measured at Earth’s orbital distance from 2008 to 2025. [Jasinski and Velli 2025]

Jamie Jasinski (NASA’s Jet Propulsion Laboratory) and Marco Velli (NASA’s Jet Propulsion Laboratory and the University of California, Los Angeles) analyzed solar wind data from 2008 to 2025 and found that many solar wind parameters such as speed, density, temperature, and magnetic field strength increased over that time period. This increase ran counter to expectations that the Sun may be entering a historically low period of activity in 2008.

Why it’s interesting:

The Sun undergoes an 11-year activity cycle that is driven by a change in its internal magnetic field structure. As the Sun’s magnetic activity changes, the number of sunspots, the frequency of solar flares and coronal mass ejections, and the intensity of the solar wind vary as well. Atop these mostly regular 11-year changes are longer-term variations. A recent example of this longer-term behavior began in the 1980s, when an overall weakening trend was stamped upon the usual 11-year cycle. This decline led to an exceptionally deep solar minimum in 2008, leading researchers to suspect that the Sun’s activity level might remain low for decades.

The historical context for a prolonged weak period:

Though the Sun reversed its weakening activity trend in 2008, a prolonged period with little solar activity wouldn’t have been unprecedented. Astronomers have monitored and counted sunspots for centuries, allowing modern-day researchers to investigate the Sun’s behavior long before spacecraft began to study our home star. In the historical record, there are two instances of weak solar activity spanning multiple decades: the Maunder minimum in 1645–1715 and the Dalton minimum in 1790–1830. Compared to the 11-year solar cycle, these longer-term behaviors are more difficult to predict, and their causes are uncertain.

Citation

Jamie M. Jasinski and Marco Velli 2025 ApJL 990 L55. doi:10.3847/2041-8213/adf3a6

The post Selections from 2025: The Sun Changed Course in 2008 appeared first on AAS Nova.

  •  

Selections from 2025: Hubble Observes 3I/ATLAS

3I/ATLAS

Editor’s Note: For the remainder of 2025, we’ll be looking at a few selections that we haven’t yet discussed on AAS Nova from among the most-downloaded articles published in AAS journals this year. The usual posting schedule will resume January 2nd.

Hubble Space Telescope Observations of the Interstellar Interloper 3I/ATLAS

Published August 2025

Main takeaway:

3I/ATLAS

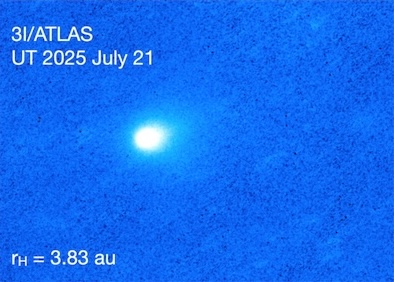
3I/ATLAS as seen by Hubble on 21 July 2025, when the comet was 3.83 au from the Sun. [Adapted from Jewitt et al. 2025]

David Jewitt (University of California, Los Angeles) and collaborators used the Hubble Space Telescope to observe the interstellar object 3I/ATLAS just a few weeks after it was discovered. These observations allowed the team to constrain the object’s mass-loss rate and the size of its nucleus, placing its radius between 0.22 and 2.8 kilometers.

Why it’s interesting:

3I/ATLAS is just the third known object to visit our solar system from another planetary system. With such a small sample size, every interstellar object discovered is a source of fascination. Are these objects more like comets or asteroids? How many of them roam the space between the stars? What, exactly, launches them into interstellar space? Using all available tools, including powerful observatories like Hubble, researchers can extract as much information as possible when interstellar objects make their brief journeys through our solar system, and get us closer to answering these key questions.

How these observations were planned, and what happened afterward:

After interstellar objects 1I/ʻOumuamua and 2I/Borisov zipped through the solar system in 2017 and 2019, respectively, researchers knew it was only a matter of time before the next interstellar interloper paid a visit. In preparation for the next arrival, Jewitt’s team proposed a target-of-opportunity observation with Hubble. This allowed them to disrupt the telescope’s planned observing schedule once 3I/ATLAS was discovered, getting an early high-resolution look that could guide further observations. Since then, researchers have published more than 30 articles in the AAS journals alone about 3I/ATLAS. In these articles, researchers have sought to understand where 3I/ATLAS came from, investigated its polarization properties, collected JWST data of the object, found it in pre-discovery data, and much more, crafting a comprehensive view of a rare visitor to our neighborhood.

Citation

David Jewitt et al 2025 ApJL 990 L2. doi:10.3847/2041-8213/adf8d8

The post Selections from 2025: Hubble Observes 3I/ATLAS appeared first on AAS Nova.
  •  

Hubble on the Hunt: A Spectroscopic Search for Betelbuddy

constellation Orion

Multiple research teams have turned to the famous red supergiant Betelgeuse in search of a possible companion star hiding in its glare. A carefully designed spectroscopic search has placed new constraints on the identity of Betelgeuse’s stellar buddy.

Betelgeuse and its companion star

An image of Betelgeuse and its probable companion star from the ‘Alopeke instrument on the Gemini North telescope. [International Gemini Observatory/NOIRLab/NSF/AURA; Image Processing: M. Zamani (NSF NOIRLab); CC BY 4.0]

Betelgeuse and Its Buddy

Betelgeuse, a nearby red supergiant, is a variable star with a 400-day primary pulsation period and a 2,100-day secondary variation period. Recent studies have speculated that this secondary period is due to the presence of an 0.5–2.0-solar-mass companion star (often nicknamed “Betelbuddy”), and researchers using a speckle imaging technique likely spotted this companion earlier this year.

As is often the case when there’s an intriguing astronomical possibility, multiple research teams have sought out Betelgeuse’s purported stellar companion in different ways. One avenue recently described in a published paper was spectroscopic, searching for signs of ultraviolet emission lines from a growing young star.

Spectroscopic Search

In just 10 million years, Betelgeuse has sped through its main-sequence lifetime and taken on a new starring role as a red supergiant. In contrast, a 0.5–2.0-solar-mass companion star would not have even reached the main sequence in the same span of time. How is it possible to spot a tiny young stellar object next to a much brighter supergiant?

Hubble's observing pattern of Betelgeuse

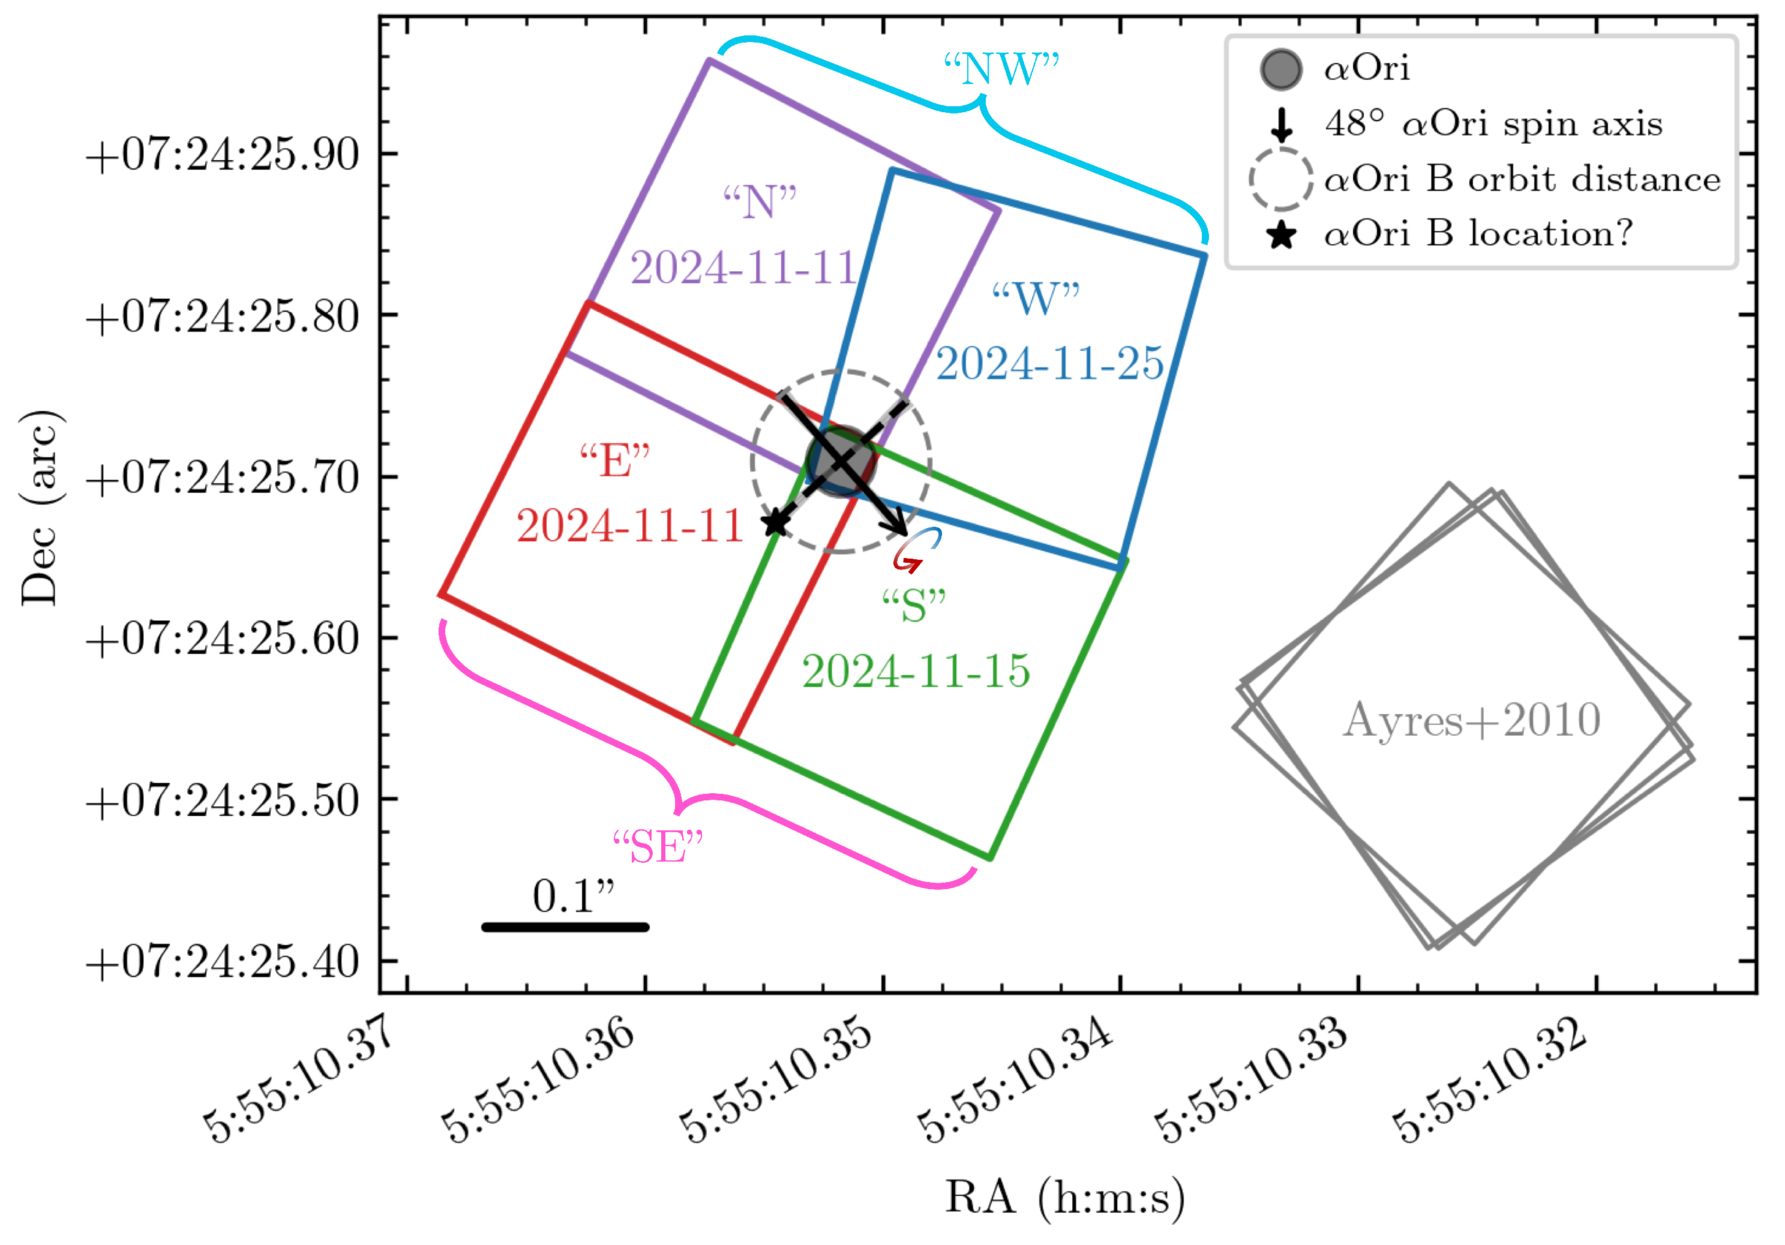
Hubble observing pattern, showing how the quadrants are arrayed around Betelgeuse. Click to enlarge. [Goldberg et al. 2025]

A team led by Jared Goldberg (Flatiron Institute) found a possible way forward in the far-ultraviolet, where young stellar objects and red supergiants both display prominent emission lines. Though Betelgeuse would greatly outshine its stellar buddy, the companion’s orbital motion should shift its emission lines relative to those of Betelgeuse, bringing them into view. To guide their search, the team consulted spectra of known young stellar objects, finding a dozen ultraviolet spectral lines that either rival the strength of those from Betelgeuse or aren’t present in Betelgeuse’s spectrum at all.

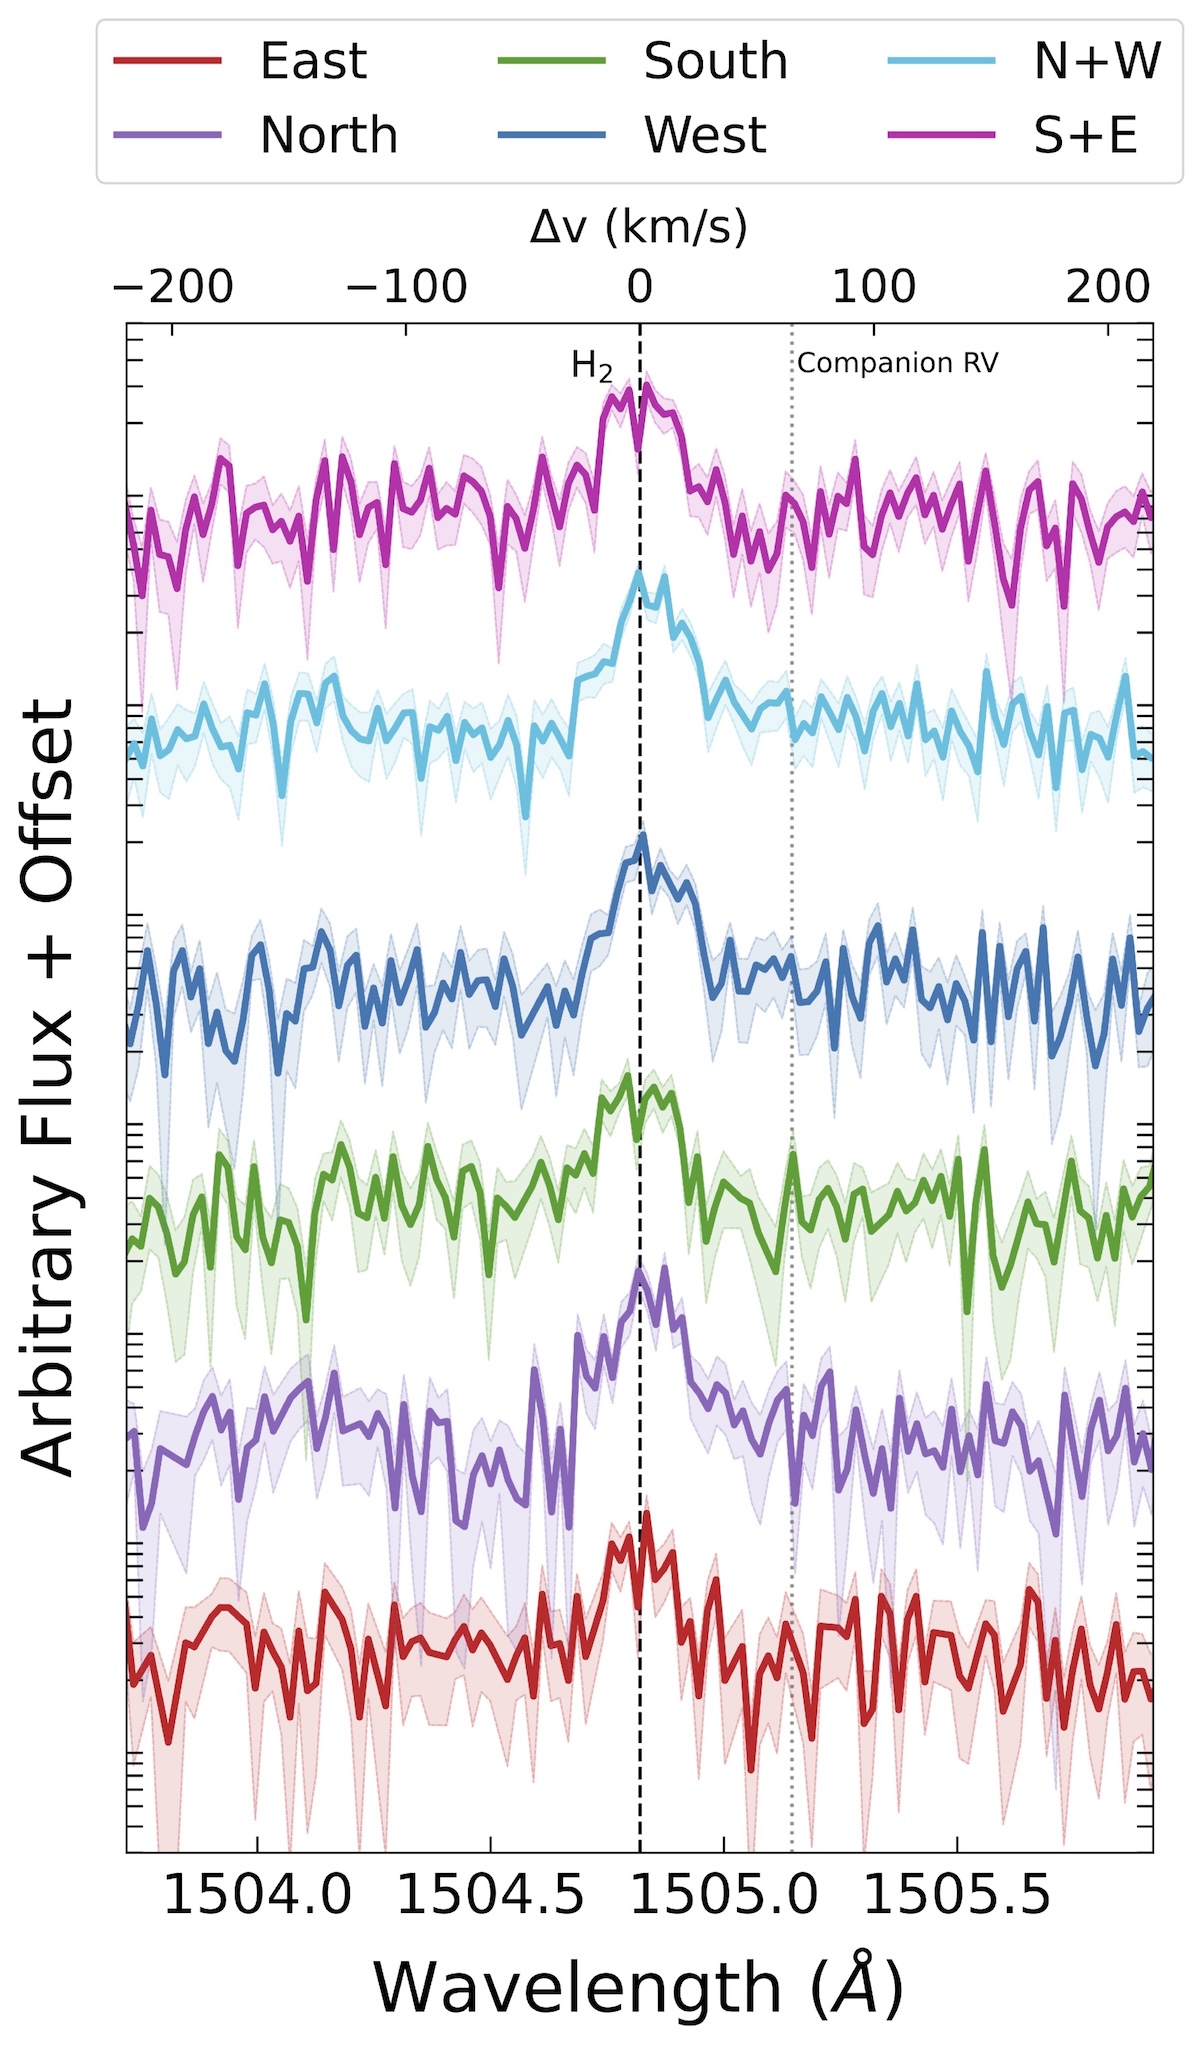
The search is on: Goldberg and collaborators observed Betelgeuse with the Hubble Space Telescope in November 2024, timed to when the companion star’s emission lines would be shifted relative to Betelgeuse. The observations split Betelgeuse’s disk into quadrants, only one or two of which should contain the companion, helping the team tease out the signal from the smaller star, if present. Ultimately, though, no statistically significant signals were found.

spectra of Betelgeuse

Emission around Betelgeuse’s 1504.82 Angstrom H2 line from each of the four observed quadrants as well as combinations of two quadrants. No significant signals were detected at the expected radial velocity of the companion star. [Goldberg et al. 2025]

When Finding Nothing Tells You Something

A lack of a significant detection doesn’t mean that the companion isn’t there, but it does place constraints on its identity. The data confidently rule out a companion star twice as massive as the Sun, marginally permit a star in the 1.1–1.5-solar-mass range, and favor a star lower than 1.1 solar masses.

Researchers assigned a likely mass of about 1.5 solar masses to the probable companion star imaged earlier this year. Though this is at the limit of what’s permitted by the ultraviolet observations, Goldberg and coauthors note that the companion star’s ultraviolet output could be suppressed due to tidal coupling with Betelgeuse or other processes. If the star’s ultraviolet emission is lower than expected, a 1.5-solar-mass companion remains consistent with Hubble’s non-detection of the star.

This is a fantastic example of how multiple lines of inquiry can converge on similar solutions. With the companion star expected to swing around to a favorable observing position again in 2027, this is certainly not the last chapter in the tale of Betelgeuse and Betelbuddy.

Citation

“Betelgeuse, Betelgeuse, Betelgeuse, Betel-buddy? Constraints on the Dynamical Companion to α Orionis from HST,” Jared A. Goldberg et al 2025 ApJ 994 101. doi:10.3847/1538-4357/ae0c0c

The post Hubble on the Hunt: A Spectroscopic Search for Betelbuddy appeared first on AAS Nova.
  •  

Citizen Science Born in the Pandemic: The Hubble Image Similarity Project

images from the Hubble Image Similarity Project

Motivated by a desire to support community members financially during the coronavirus pandemic, researchers employed 30 local citizen scientists in the Hubble Image Similarity Project. This project quantified the similarities between astronomical images, providing a way to test the results of image-search algorithms.

Seeking Similarities

Eagle Nebula

The Eagle Nebula, pictured here in an image from Kitt Peak National Observatory, is a star-forming region in the Milky Way. [T.A.Rector (NRAO/AUI/NSF and NOIRLab/NSF/AURA) and B.A.Wolpa (NOIRLab/NSF/AURA); CC BY 4.0]

Say you have an image of a star-forming region, featuring eye-catching gas clouds, dense and dusty knots, and newborn stars. How would you go about finding other images that resemble yours?

You might start your search with an astronomical image database, using filters for object type or instrument to sift through thousands and thousands of options. But even filtering out everything but star-forming regions might yield vastly different results, given the widely varying shapes, colors, and sizes of these regions.

Or maybe you’ll feed your image into a neural network that has been trained to spot similar images. The results may seem promising, but how can you tell whether the algorithm has found the images that are the most similar? Would another algorithm do better?

The Hubble Image Similarity Project

Astronomical image collections rarely contain information about similarities between images in their metadata, and while neural networks appear to excel at gathering similar images, the results of these models are generally unverified. The Hubble Image Similarity Project, led by Richard White (Space Telescope Science Institute) and Josh Peek (Space Telescope Science Institute and Johns Hopkins University), addressed these issues with a team of citizen scientists who generated similarity information for astronomical images, providing a quantitative means to test the results of neural networks.

example of how the Hubble Image Similarity Project selects image cutouts for study

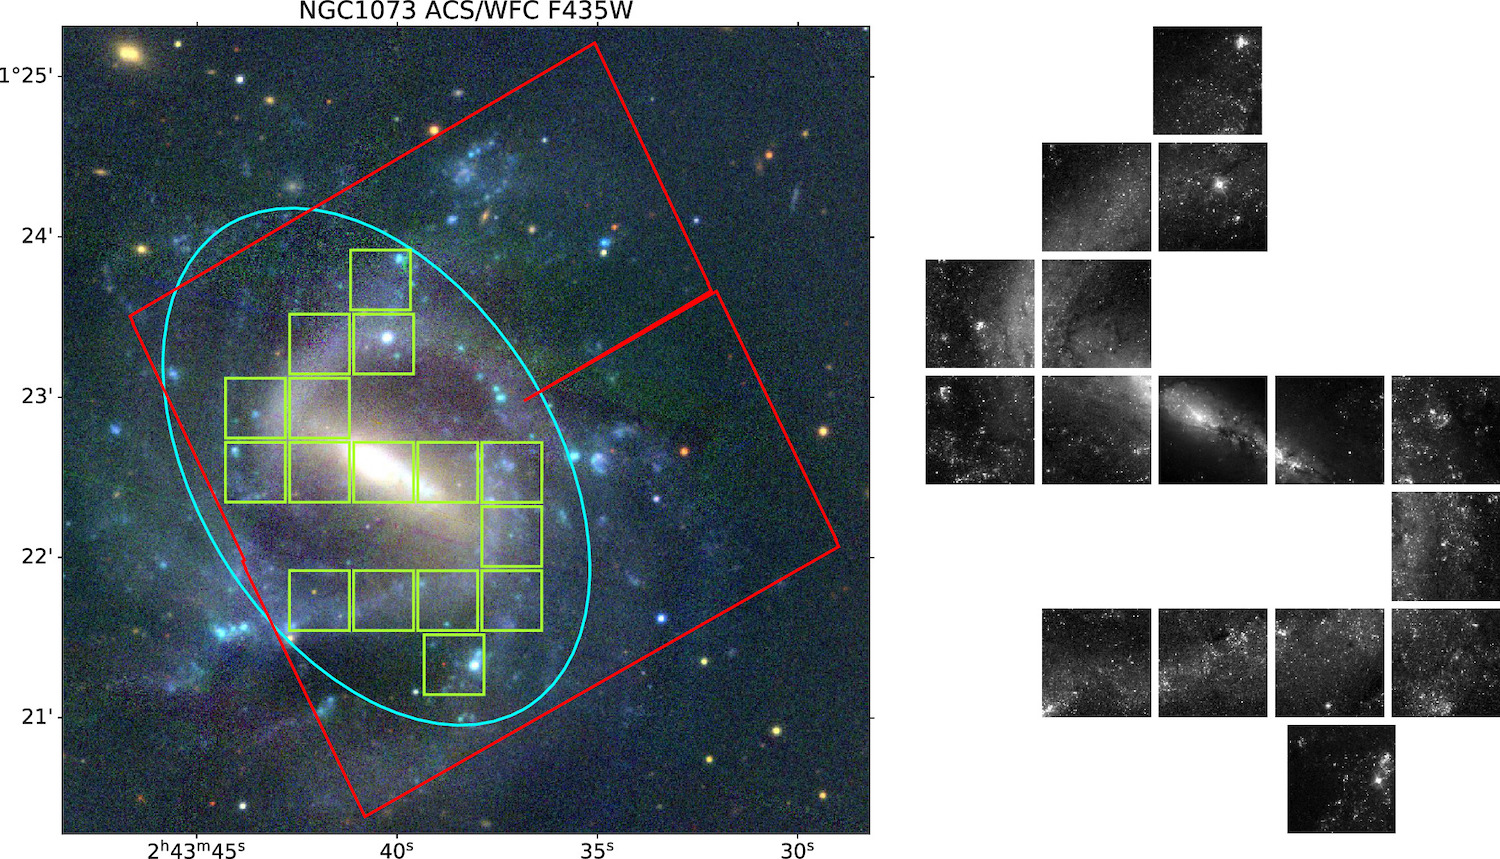
An example of individual test images (green squares) extracted from a Hubble Legacy Archive image (red square). Low-contrast areas have been excluded, leaving the galaxy’s spiral arms for analysis. Click to enlarge. [White & Peek 2025]

White and Peek began by amassing a sample of images from the Hubble Legacy Archive. This sample included many different object types, such as galaxies, planetary nebulae, star-forming regions, and star clusters. After trimming and binning the images, converting them to 8-bit grayscale, filtering out low-contrast images, and eliminating satellite trails, image artifacts, and repeated observations of the same patch of sky, 2,098 images of 666 objects remained.

Citizen Scientists, Assemble

White and Peek recruited 30 members of the community within walking distance of the Space Telescope Science Institute to identify similar astronomical images, and the reviewers were paid for their work. In the three phases of the project, reviewers considered test images one at a time and 1) selected all similar images from a set of 15 comparison images, 2) selected the most similar image from a narrowed-down set of 6 comparison images, and finally 3) selected the most similar image from a set of 3 comparison images.

similar images from the Hubble Image Similarity Project and a visualization of the data

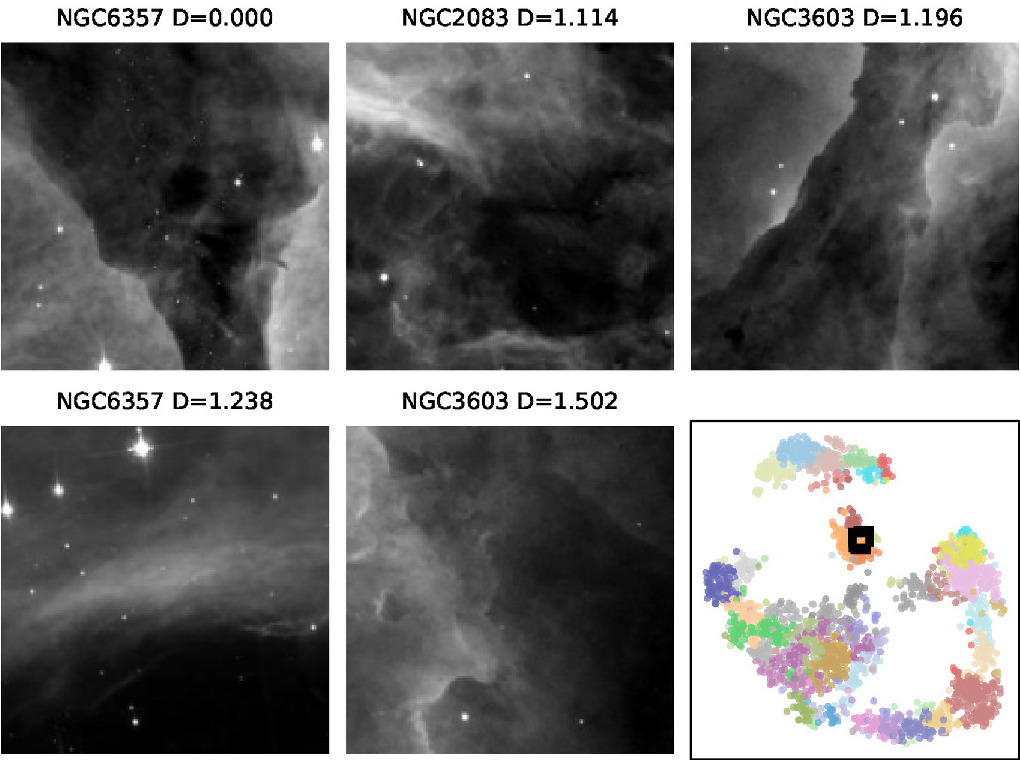
Examples of similar images according to the image similarity matrix. In the lower-right corner is a visualization of the similarity data. The semicircle of data points in the bottom half of this visualization represents galaxies, while star clusters occupy the small arc near the top and nebulae sit in the island in the center of the plot. Click to enlarge. [Adapted from White & Peek 2025]

The citizen science team ultimately compared 5.4 million pairs of images, and White and Peek used these comparisons to produce an image similarity matrix. The matrix describes the metaphorical “distance” between the images, with the most similar images being the smallest distance apart.

Similar images resemble one another in terms of structure, texture, and other factors that White and Peek say are “difficult even to describe in words” — for example, the diffuse glow of a galaxy interrupted by a bright star with diffraction spikes, or a nebula speckled with stars and dense dusty clumps. The similarity data from this study are available online and can be used to test the performance of image-search algorithms. In future work, the authors plan to carry out a similar project using images of the Martian landscape.

Citation

“The Hubble Image Similarity Project,” Richard L. White and J. E. G. Peek 2025 AJ 169 306. doi:10.3847/1538-3881/adcb43

The post Citizen Science Born in the Pandemic: The Hubble Image Similarity Project appeared first on AAS Nova.

  •  

Featured Image: Hubble and JWST Check Up on the BOAT Gamma-Ray Burst

combined Hubble and JWST image of GRB 221009A

The bright spot visible within its fuzzy host galaxy in the image above is the optical and infrared light from a superlative gamma-ray burst. Discovered in October 2022, GRB 221009A was the brightest gamma-ray burst ever observed by humans, and likely a once-in-ten-millennia event, earning it the nickname “the Brightest of All Time” or BOAT gamma-ray burst. This image shows the afterglow of this burst nearly a year after it exploded onto the scene. In a recent article, Huei Sears (Rutgers University) and collaborators analyzed Hubble and JWST observations made 185–345 days after the discovery of the burst. These observations captured the burst’s fading light and showed a distinct shift in the rate at which the light dimmed at around 50 days. This shift is evidence of powerful jets from the source of the burst. Sears’s team also discovered a blue component to the afterglow emission. This blue component may be due to the burst’s afterglow echoing off of dust in the host galaxy — if confirmed, this will mark the first time this feature has been detected. To learn more about what astronomers have discovered in the years since GRB 221009A was first spotted, be sure to check out the full research article linked below!

Citation

“Late-Time HST and JWST Observations of GRB 221009A: Evidence for a Break in the Light Curve at 50 Days,” Huei Sears et al 2025 ApJ 984 196. doi:10.3847/1538-4357/adc306

The post Featured Image: Hubble and JWST Check Up on the BOAT Gamma-Ray Burst appeared first on AAS Nova.

  •  

Loin d'être inutiles, les petits bras du T. rex auraient eu une fonction redoutable selon ce chercheur

Ses bras font rire. Pourtant, une griffe du T. rex pouvait exercer une pression colossale sur sa proie. Ces membres minuscules, longtemps moqués, cachent peut-être l'une des armes les plus ingénieuses de la préhistoire. Et si on avait tout faux depuis le début ? 

  •  

Des chercheurs identifient le plus grand scorpion de tous les temps : il mesurait plus d’un mètre !

Imaginez un scorpion de plus d’un mètre de long arpentant les rivages d’un monde presque dépourvu de vie terrestre. C’est pourtant ce que suggère une nouvelle étude consacrée à Praearcturus gigas, un géant du Dévonien qui pourrait détenir le record du plus grand scorpion de tous les temps.

  •  

Record-Breaking Black Hole Wind Blasts Through Space at 30% the Speed of Light

Quasar Black HoleA distant quasar has revealed one of the most extreme ultraviolet outflows ever observed, providing new clues about the powerful interactions between supermassive black holes and their host galaxies. A supermassive black hole more than a billion times the mass of the Sun is blasting gas through space at such extraordinary speeds that astronomers are [...]
  •  

Quelque chose déforme cette galaxie depuis des milliards d’années, et les astronomes le voient enfin

Une nouvelle cartographie du mouvement de millions d'étoiles montre que le Petit Nuage de Magellan, l'une des galaxies naines les plus proches de la Voie lactée, n'est pas une galaxie en rotation stable comme on le pensait. Les données révèlent une expansion généralisée provoquée par l'influence...

  •  

Les scientifiques pensaient les Denisoviens introuvables : cette découverte spectaculaire change désormais tout

Pendant quinze ans, les Denisoviens n'ont eu ni visage ni contour. Juste de l'ADN extrait d'un fragment d'os sibérien grand comme un ongle. En 2025, un crâne exceptionnel découvert en Chine a tout changé. Homo longi, surnommé l'Homme dragon, donne enfin un visage à ce groupe humain fantôme. 

  •  
❌