❌

Reading view

How NASA Science and Artemis Are Shaping the 2026 FIFA World Cup 
Researchers tested soccer balls aboard the International Space Station to study how internal mass affects motion and stability in microgravity.
NASA

As the FIFA World Cup approaches, NASA is bringing space science and engineering to soccer fans worldwide. From June 11 to July 19, 2026, NASA will host an exhibit at FIFA Fan Festival™ Houston where visitors can learn how research aboard the International Space Station benefits life on Earth and experience missions in low Earth orbit, the Moon, and beyond through the Artemis program. 

On June 11, as the FIFA World Cup begins, NASA’s exhibit at Fan Festival Houston will open to the public. The event is free to attend and open for every match of the tournament in East Downtown, Houston. On June 20, Johnson Space Center Director Vanessa Wyche will introduce select Artemis II crew members following their historic mission around the Moon. The crew will participate in World Cup activities ahead of the Netherlands-Sweden match in Houston and will appear on the Fan Festival Houston main stage to share their experience with fans. 

The connection between NASA and the World Cup goes beyond the exhibit floor, reaching all the way to orbit. NASA spinoff technologies are innovations developed for space exploration that go on to shape commercial products and everyday life – even on the soccer field. 

For more than 25 years, research aboard the International Space Station has enabled breakthroughs in science, technology, and human health while advancing innovations that benefit people on Earth. That work includes studies that improve understanding of the aerodynamics and physics involved in soccer ball flight. 

In partnership with the ISS National Laboratory in 2019, researchers used the station’s microgravity environment to study how a soccer ball’s internal mass affects its motion, stability, and rotation. The findings have improved understanding of how embedded technologies, including match-ball sensors, can influence performance during play. The research contributed to studies used in the development and evaluation of soccer balls for major international tournaments, including FIFA World Cup competition. 

Understanding the relationship between an object’s center of mass and its geometric center is key to predicting how free-flying objects move, including spacecraft, satellites, and aircraft. 

Since 2022, Adidas has embedded electronics inside official match balls used in major tournaments. The sensors track speed, position, and contact in real time to support officiating and broadcast technology. But those sensors also add mass in specific locations inside the ball, and uneven mass distribution can affect how a ball moves through the air. 

The space-based research has helped improve understanding of how internal mass, including embedded sensors, can influence stability and rotation in real-world playing conditions. 

This work builds on earlier research into how spinning objects behave in microgravity. 

Engineers at NASA’s Ames Research Center in Silicon Valley, California tested Adidas’ Brazuca ball, developed for the 2014 FIFA World Cup, in wind tunnel conditions at the Fluid Mechanics Laboratory. Researchers studied aerodynamic behavior, including how low-spin kicks can produce “knuckling,” where the ball moves unpredictably due to unstable airflow across the seams. NASA engineers measured the speeds and flow conditions where this effect was most pronounced. 

Adjustments in panel shape, seam depth, and surface texture can influence flight consistency, helping determine whether a ball curves, dips, or holds its line during play. 

Now, NASA and Adidas are presenting that science through a STEMonstration that compares how differently balanced soccer balls spin and move in microgravity. The experiment shows how the same physics that governs motion in space also shape the game millions watch on Earth. 

Through research aboard the International Space Station and technology developed for exploration, NASA continues to demonstrate how discoveries made for space can benefit people on Earth—including athletes and fans participating in the world’s most popular sport. 

Watch the soccer ball STEMonstration video: 

💾

Have you ever kicked a soccer ball and wondered why it curves, spins, or sometimes wobbles? NASA astronaut Jessica Meir aboard the International Space Statio...
  •  

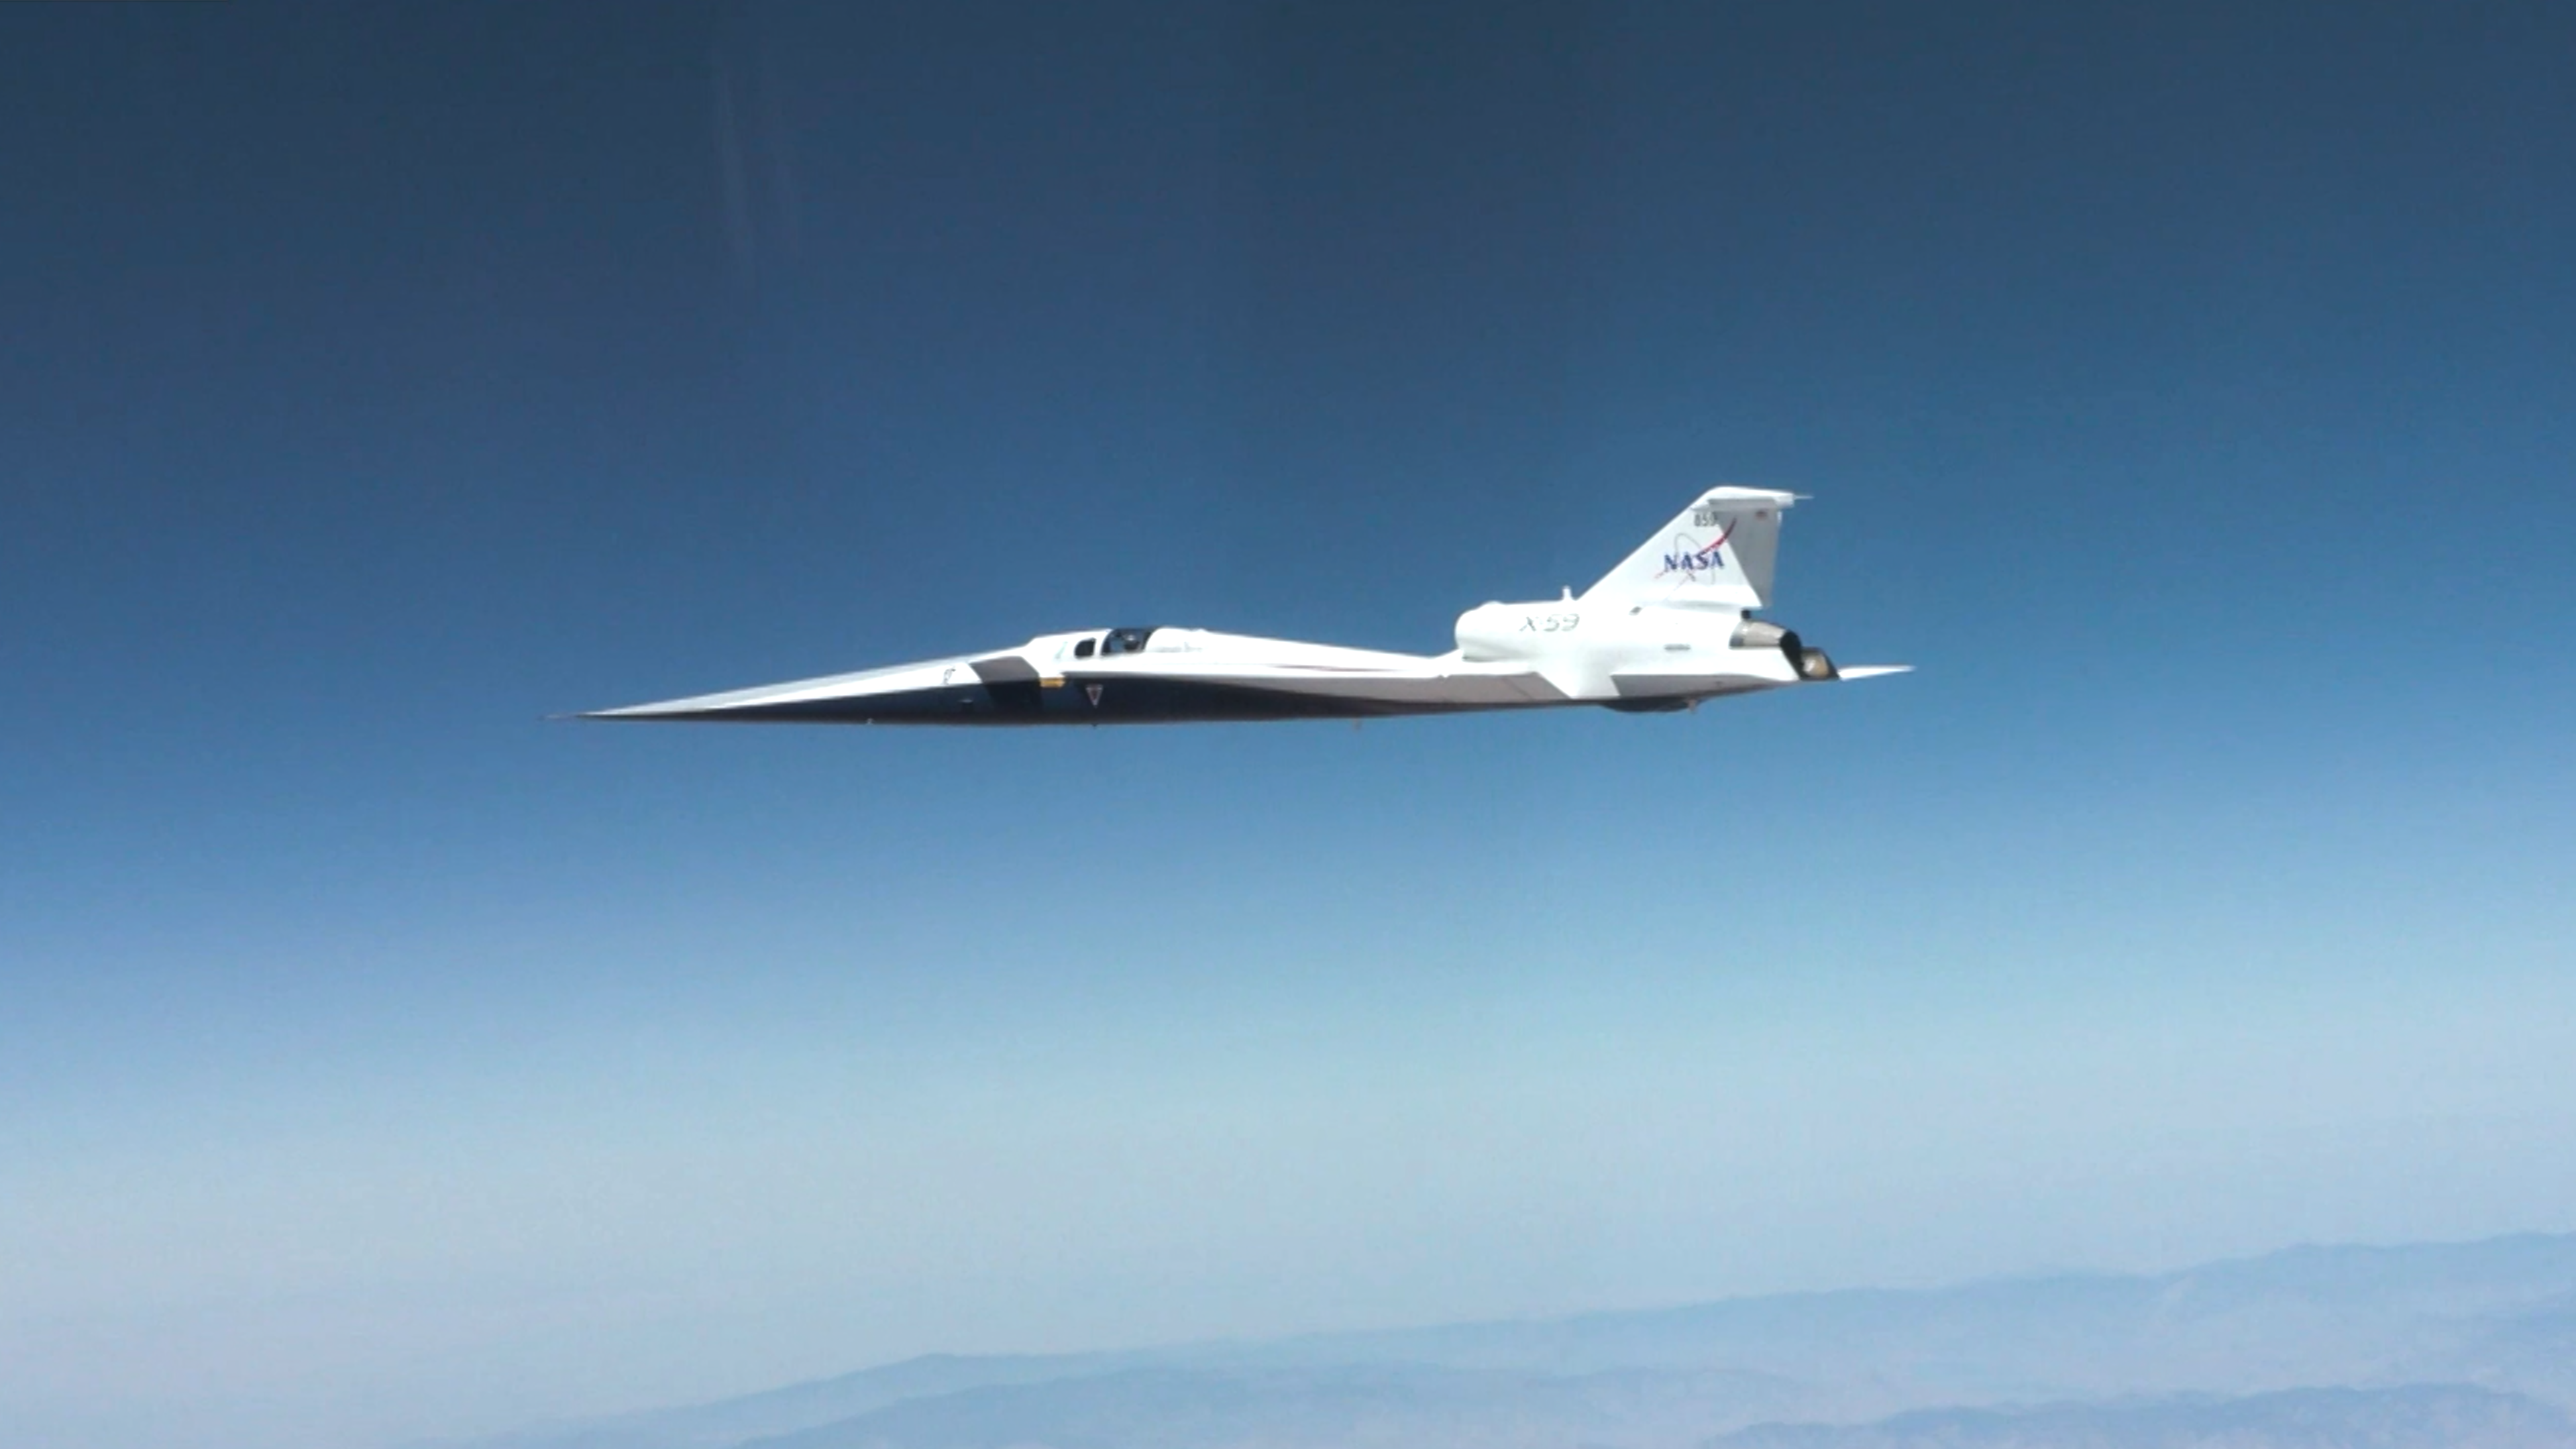
Supersonic!

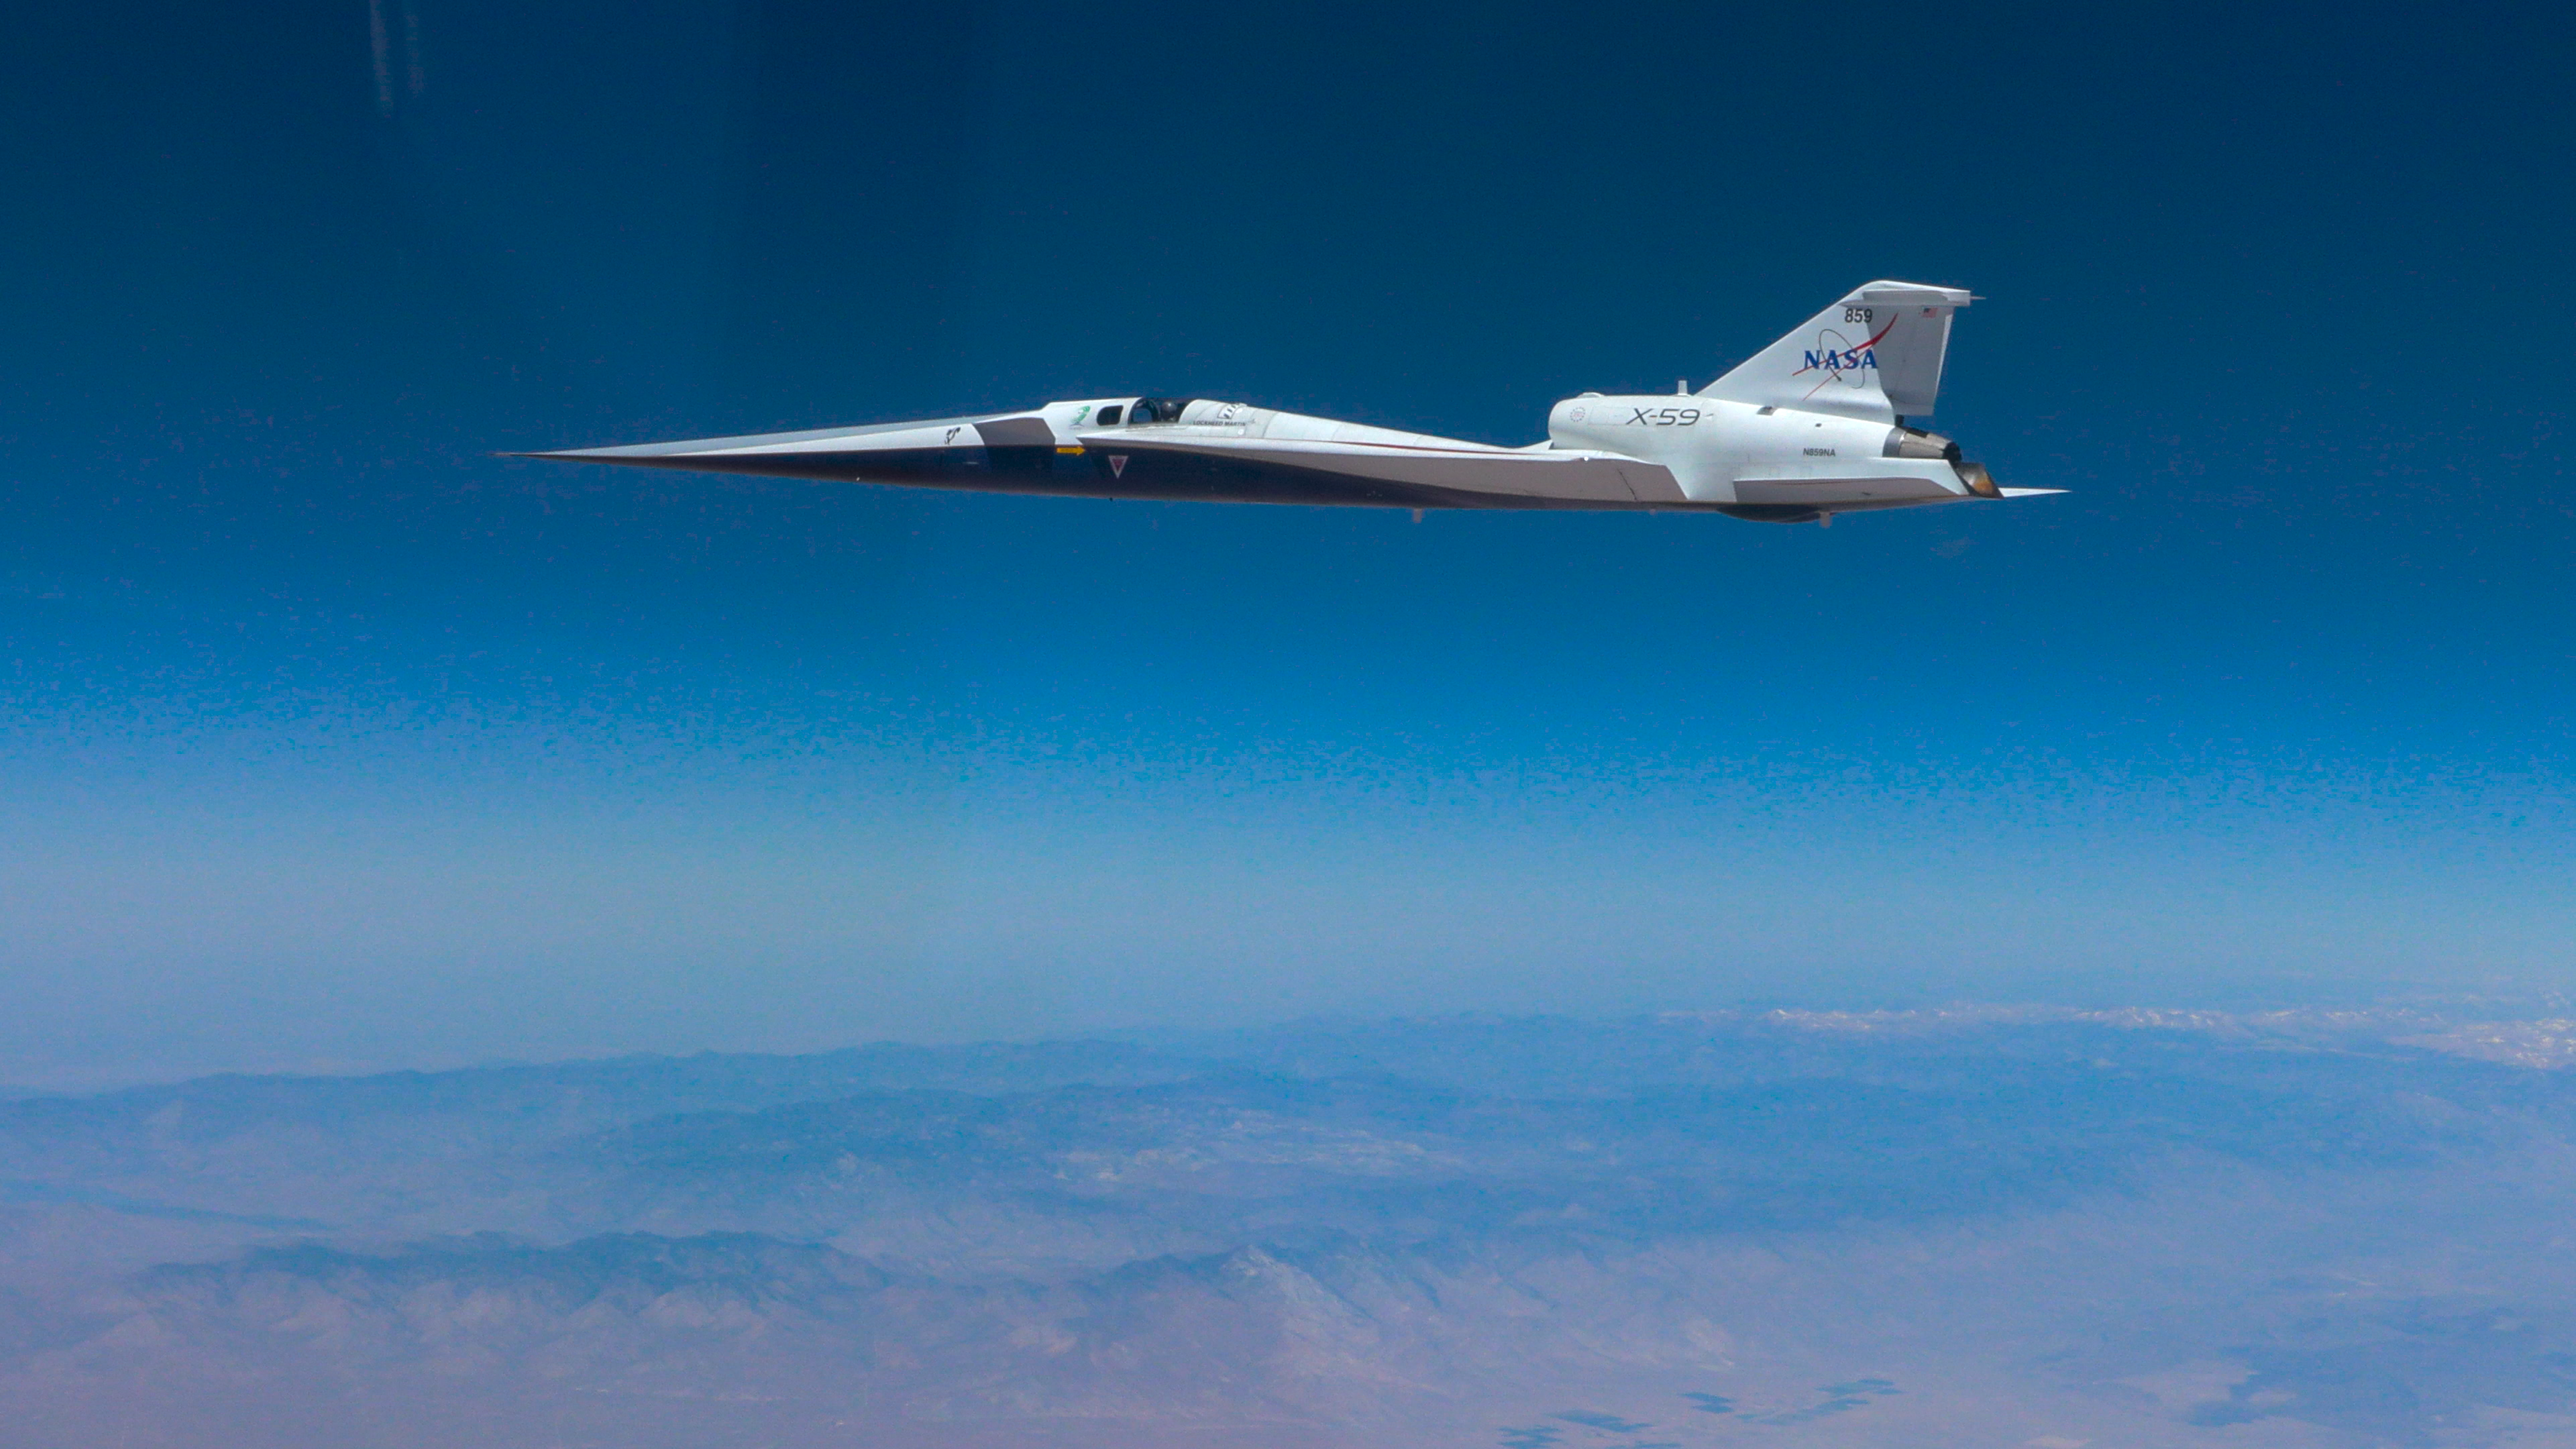
NASA’s X-59 quiet supersonic research aircraft flies through the blue sky. The plane has a distinctive long, sharp nose. There are mountains visible at the bottom of the photo.
NASA/Lori Losey

On June 5, 2026, NASA’s experimental X-59 aircraft flew faster than the speed of sound for the first time, setting the stage for demonstrating its quiet supersonic capabilities later this year. NASA test pilot Jim “Clue” Less took off and landed at Edwards Air Force Base in California, reaching a top speed of approximately Mach 1.1 (713 mph). The flight lasted 81 minutes, with the team focusing on flying qualities at both subsonic and then supersonic speeds.

The X-59 is the centerpiece of NASA’s Quesst mission, which aims to demonstrate quiet supersonic flight and help enable commercial supersonic flight over land worldwide. These advancements will help travelers reach their preferred destinations faster, spending less time in the air.

Learn more about the milestone and Quesst.

Image credit: NASA/Lori Losey

  •  

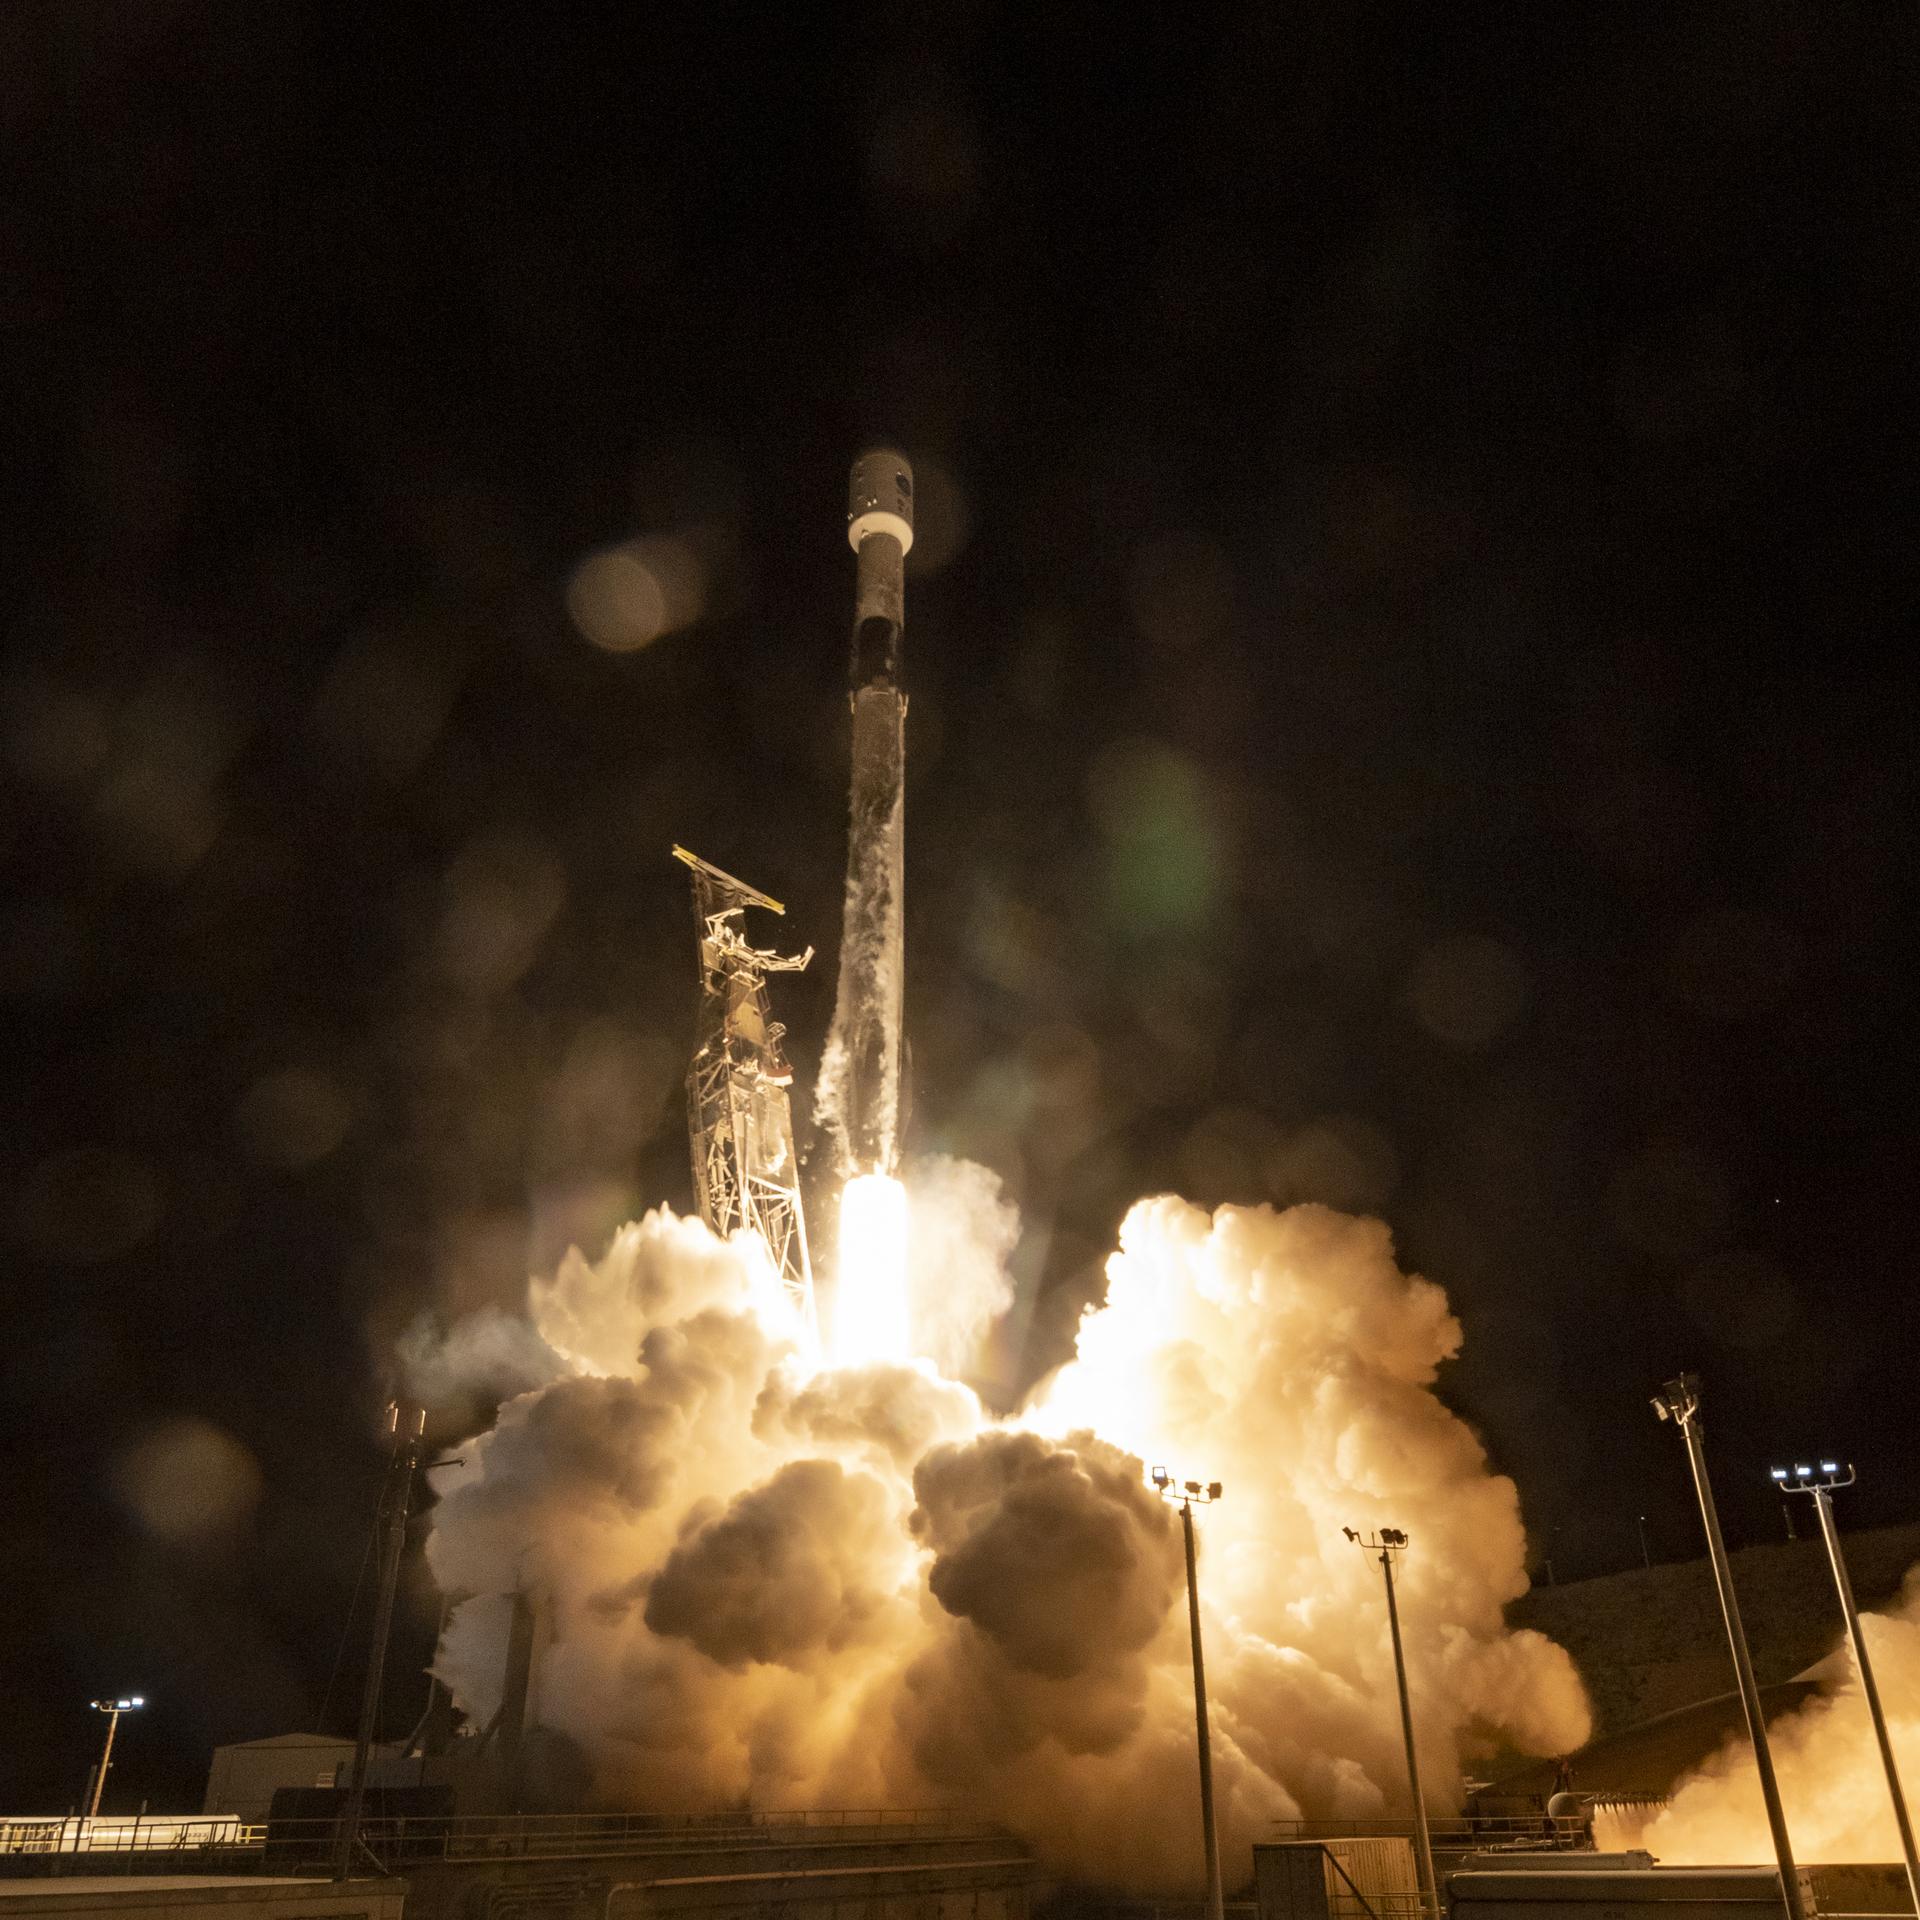
NASA’s INCUS Satellites Progress Toward Launch

2 Min Read

NASA’s INCUS Satellites Progress Toward Launch

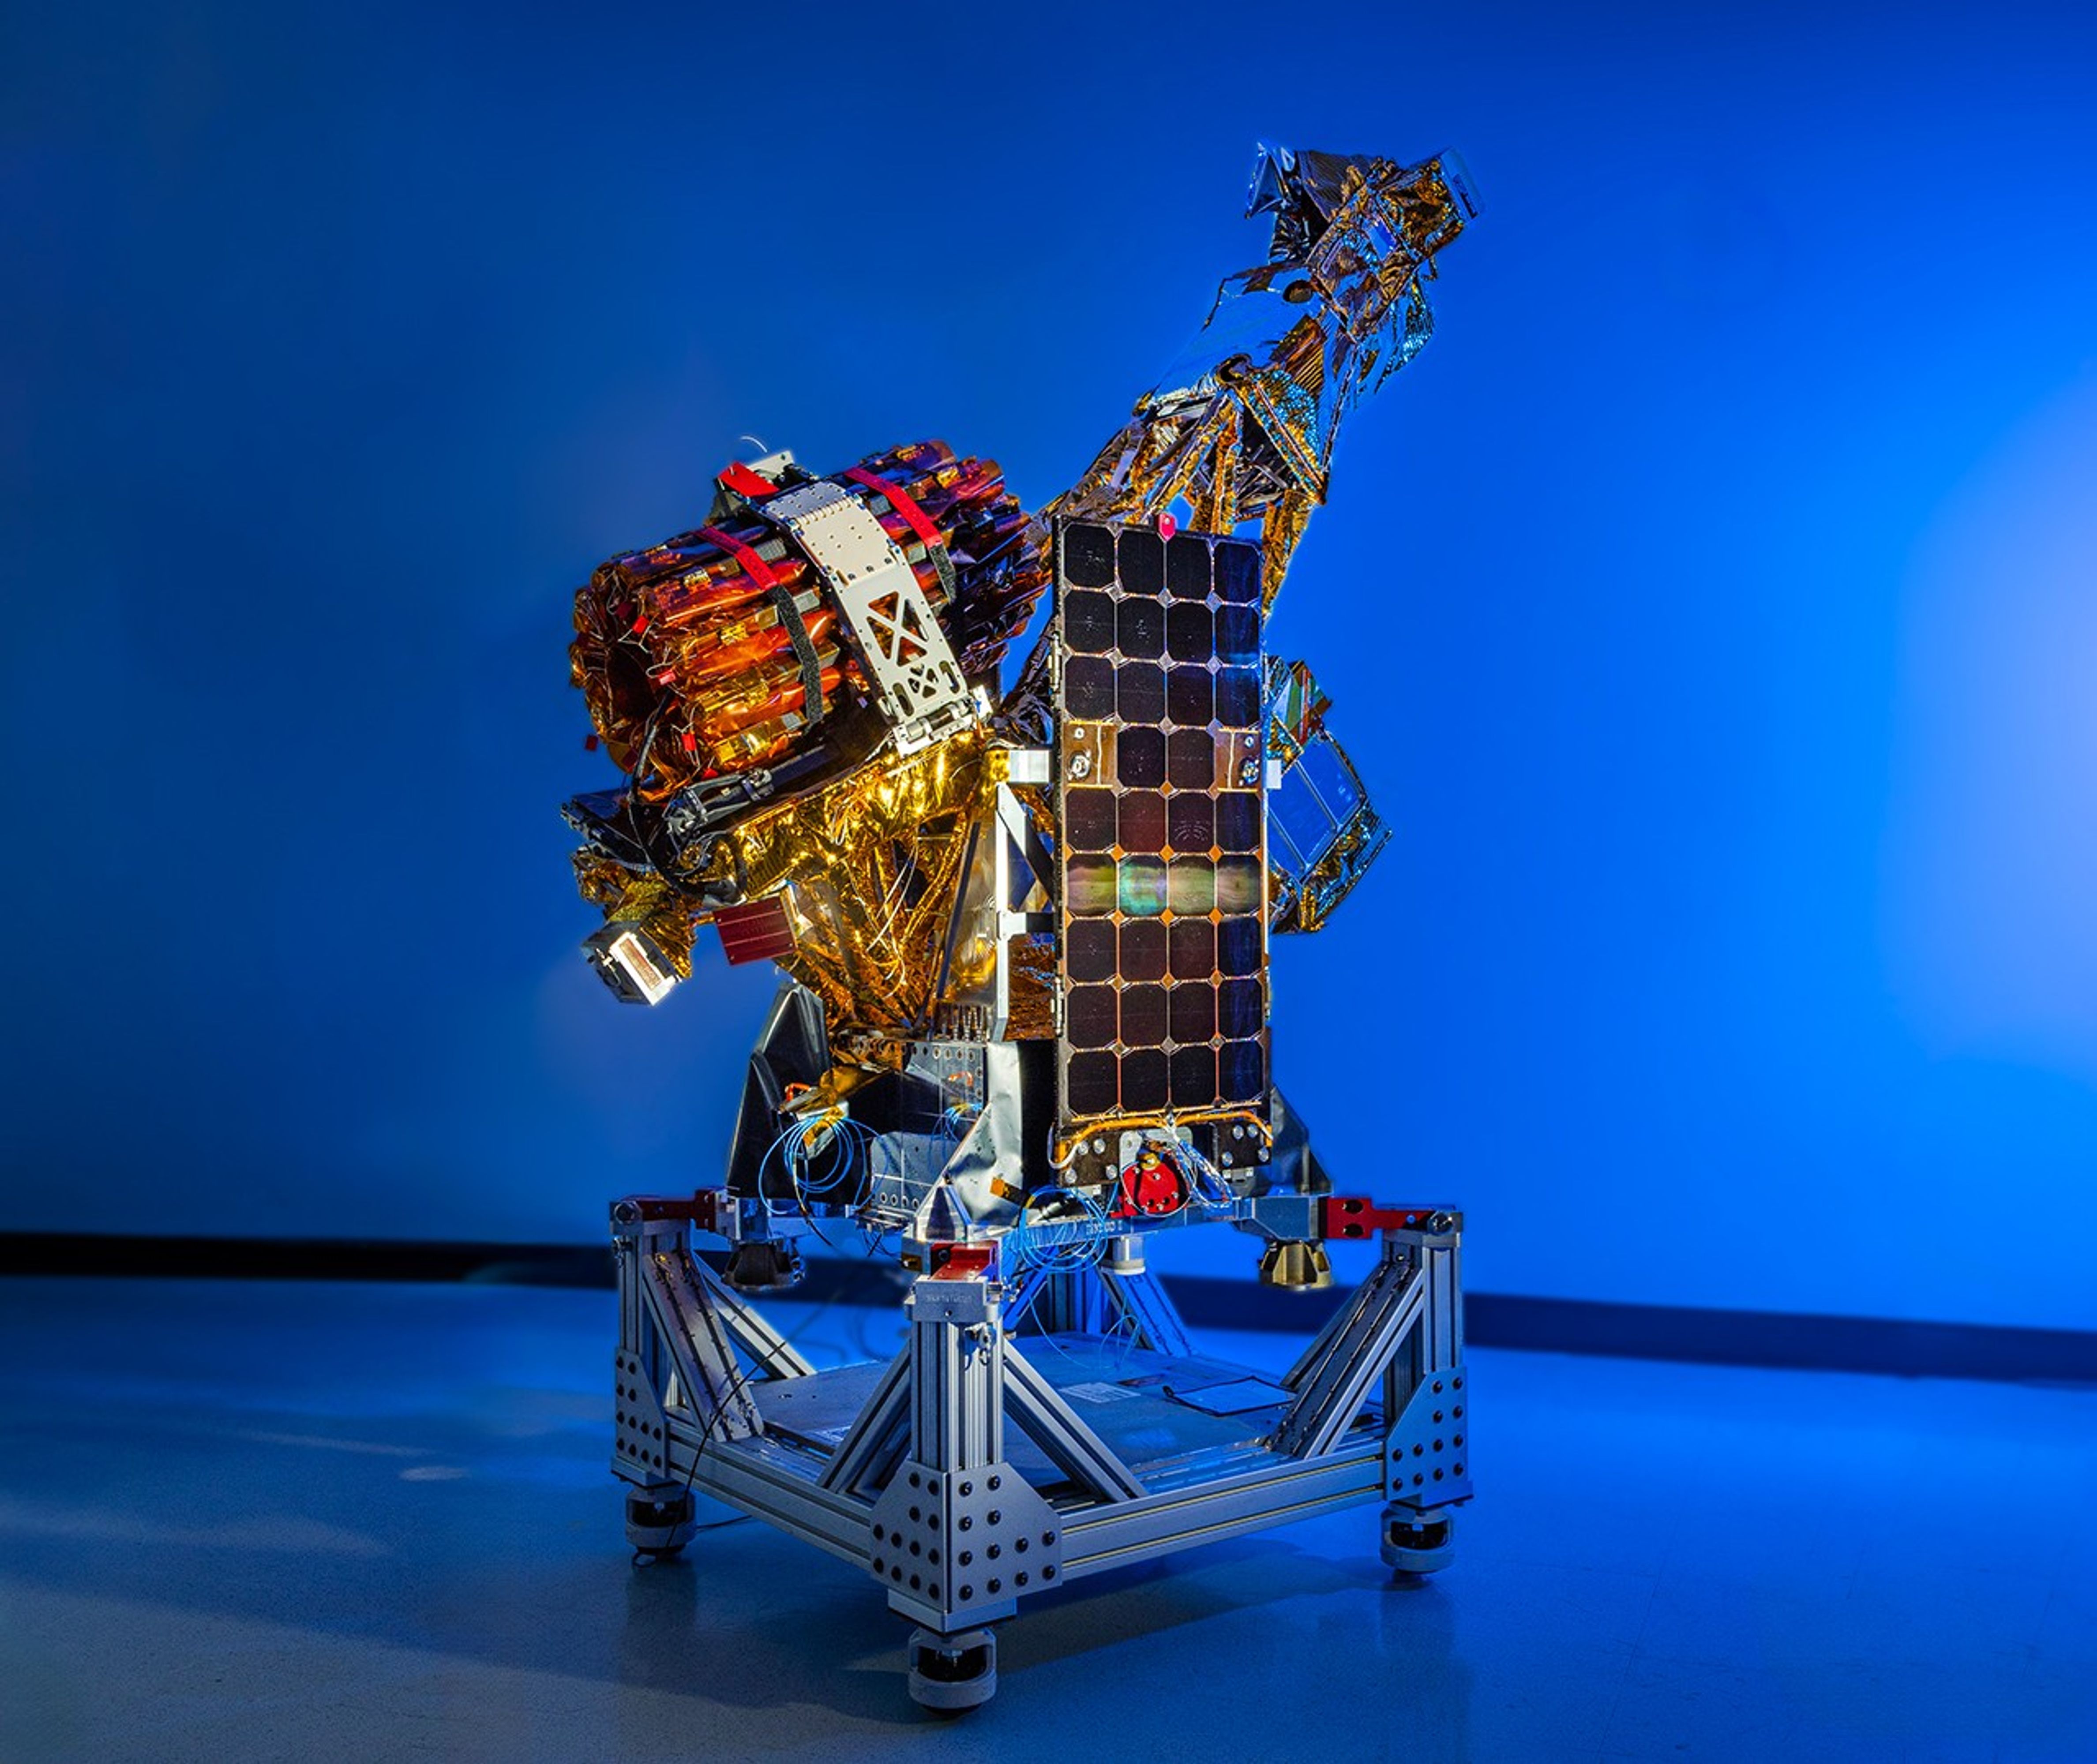
A complex spacecraft partially wrapped in gold-colored foil and featuring a large rectangular solar panel stands on a metallic support structure against a solid blue background.
PIA26614
Credits:
Blue Canyon Technologies

Downloads

NASA’s INCUS Satellites Progress Toward Launch

JPEG (10.32 MB)

Description

One of the three satellites that make up NASA’s INCUS (Investigation of Convective Updrafts) mission sits on a fixture at the facilities of Blue Canyon Technologies in Lafayette, Colorado. The satellite completed testing in preparation for launch in late May 2026. The mission will make the first space-based survey of the dynamics of tropical convective storms.

The three nearly identical satellites will fly in tight coordination in low Earth orbit, with the first and second satellites separated by 30 seconds, and the second and third satellite separated by 90 seconds. 

Each satellites carries a radar designed to observe the vertical motion of air and water — known as convective mass flux — as storms develop and evolve. The middle satellite will also carry a microwave radiometer.

The INCUS mission is set to launch in 2027 from NASA’s Wallops Flight Facility in Virginia.

Funded through the Earth Venture Mission-3 acquisition under NASA’s Earth System Science Pathfinder Program and led by principal investigator Sue van den Heever at Colorado State University in Fort Collins, INCUS is one of several missions fulfilling the clouds, convection, and precipitation requirements of NASA’s Earth System Observatory, a set of interconnected missions set to study our home planet’s dynamic natural systems and how they interact. The mission is also part of FALCON (Fleet for the Atmosphere Linking Commercial Observations with NASA), a fleet of atmosphere-observing satellites that will combine hardware contributions from NASA centers, universities, and commercial partners.

  •  

Digging Back in Time in the UAE

Limestone ridges appear as linear features running north–south with orange-toned desert to the west and a darker-toned mountain range to the east.
Jabal al Fāyah rises from the Rub’ al Khali desert in an image captured by the OLI (Operational Land Imager) on Landsat 8 on October 23, 2025.
NASA Earth Observatory / Lauren Dauphin

About an hour’s drive east of Dubai’s gleaming towers and artificial islands, a quieter, more natural landscape takes shape. At the far northern edge of the Rub’ al Khali, a saffron-colored sand sea laps against the Al-Hajar Mountains. A series of pale ridges rises finlike from the desert plain, with the largest—Jabal al Fāyah—standing 412 meters (1,352 feet) above sea level.  

The Landsat 8 satellite captured this image of the ridges cutting across the Emirate of Sharjah in the northern part of the United Arab Emirates on October 23, 2025. To geologists, the limestone ridges are a reminder of the region’s watery past, signs that this land lay underwater tens of millions of years ago when the sedimentary rock layers were deposited.

Jabal al Fāyah functions as a barrier, trapping windblown sand in dune fields to its west. The weathering of iron-bearing minerals in the sand grains gives the dune fields their orange hue. To the east, the branching channels of overlapping alluvial fans extending from the Al-Hajar Mountains carry gravels and eroded sediments from basalts and other dark mafic rocks. 

The dark rocks to the east—part of the Samail Ophiolite—are known to geologists for being among the world’s largest, best-preserved, and most accessible exposures of ancient oceanic lithosphere, the rigid outer layer of Earth that includes both the crust and upper mantle. Oceanic lithosphere like this is normally subducted and recycled back into the mantle when tectonic plates collide. But in this area, a large section from beneath the Tethys Sea was scraped off and thrust onto the Arabian plate in a process called obduction.  

Development associated with Dubai appears as a light gray zone along the coast of the Persian Gulf with the dark gray Al-Hajar Mountains on the far right side of the image. A ridge lies in the middle of the image in a sandy area.
Dubai lies to the west of the limestone ridges, and the Al-Hajar Mountains lie to the east, in an image acquired by the OLI (Operational Land Imager) on Landsat 8 on October 23, 2025.
NASA Earth Observatory / Lauren Dauphin

The Jabal al Fāyah ridges themselves are made up of marine limestone that was deposited on top of the ophiolite over tens of millions of years spanning the late Cretaceous through the early to mid-Paleocene. Limestone typically forms along continental margins in warm, shallow oceans, often in lagoons and coral reefs, out of the calcium carbonate found in the shells and skeletons of marine life. In many parts of the ridges, coral fragments and marine invertebrate fossils are visible embedded in the rock. A feature called Fossil Rock sits a few kilometers north of Jabal al Fāyah and adjacent to the limestone ridge Jabal Mulayḩah. It contains an abundance of snail, clam, and sea urchin remains. 

For archaeologists, the ridges are at the center of a much more recent tale of human adaptation and survival that has played out in just the past few hundred thousand years. The ridges and parts of the surrounding landscape—inscribed as a UNESCO World Heritage site in 2025—are dotted with dozens of archaeological sites that trace human occupation on the Arabian Peninsula back to between 210,000 and 120,000 years ago, to the Middle Paleolithic. That was a period when waves of anatomically modern humans (Homo sapiens) migrated out of Africa and shared the planet with other groups such as Neanderthals.   

Many of the sites contain stone flakes, blades, scrapers, hand axes, and other stone tools. The archaeological treasure trove offers early evidence of modern humans surviving in a harsh desert environment and raises questions about the routes modern Homo sapiens may have taken on their journey out of Africa.  

Geological evidence indicates that lakes periodically formed on the east side of the ridge, providing critical food and water resources that would have supported early inhabitants in this unforgiving climate. Rocky overhangs along the ridge would have provided shelter from the heat and wind. Some of the sites show evidence of intermittent occupation beginning as early as 210,000 years ago, making this one of the earliest signs of human habitation on the Arabian Peninsula.   

NASA Earth Observatory images by Lauren Dauphin, using Landsat data from the U.S. Geological Survey. Story by Adam Voiland.

Downloads

Development associated with Dubai appears as a light gray zone along the coast of the Persian Gulf with the dark gray Al-Hajar Mountains on the far right side of the image. A ridge lies in the middle of the image in a sandy area.

October 23, 2025

JPEG (3.89 MB)

References & Resources

You may also be interested in:

Stay up-to-date with the latest content from NASA as we explore the universe and discover more about our home planet.

Thailand’s Krabi Coast

3 min read

The coastal province features striking tropical karst landscapes and sandy beaches alongside a mix of natural land cover and developed…

Article

A Bit of Gray on an Emerald Isle

3 min read

Ireland is best known for its many greens, but the striking grays of the island’s Burren region also stand out…

Article

Eyeing the Richat Structure

3 min read

The circular geologic feature in northwestern Africa can be hard to recognize from the ground, but it is obvious when…

Article
  •  

NASA Satellites Help Map Ocean Nutrient Stress 

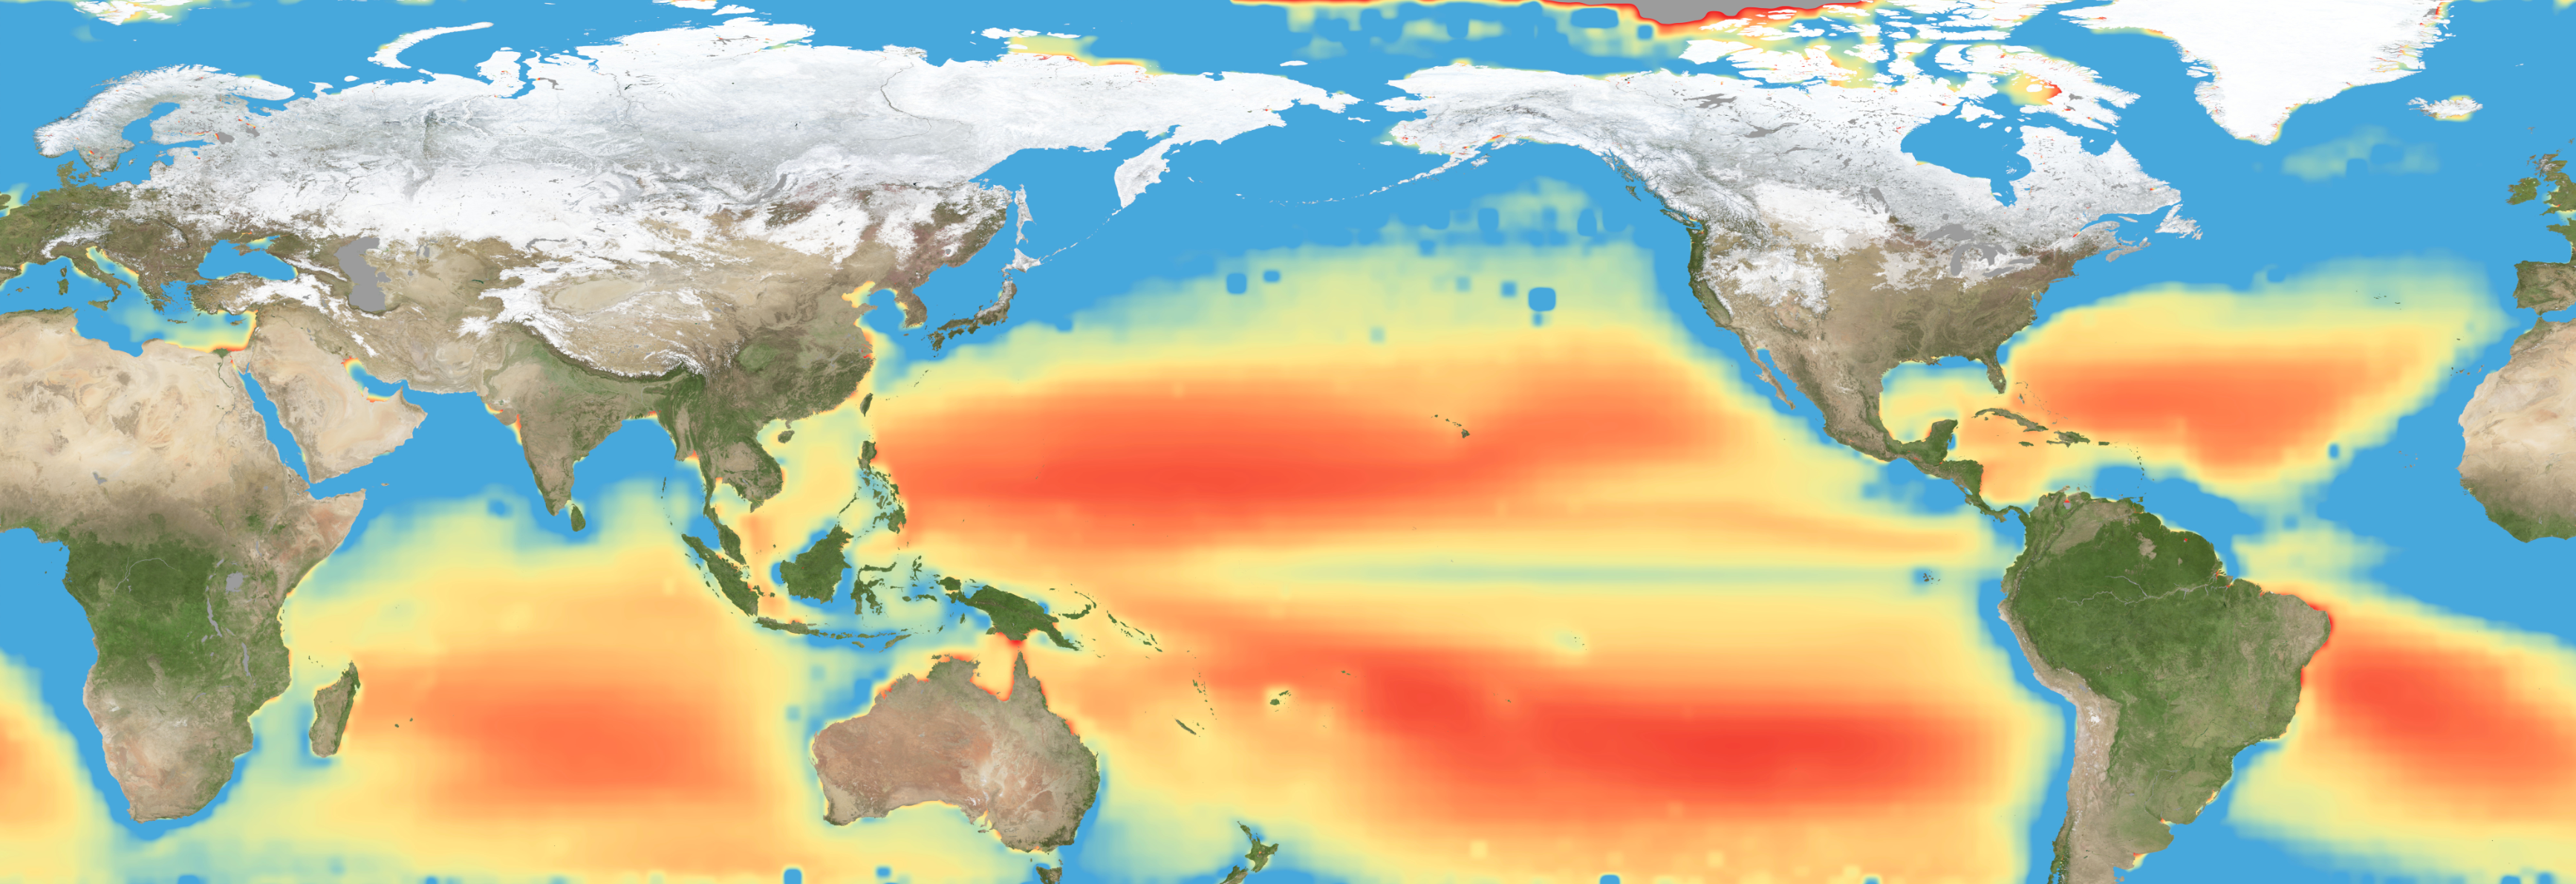
A flat map of the world shows regions in the ocean colored red to indeicate elevated levels of stress on plankton due to a lack of nutrients.
Warming waters decrease upwelling and lead to stress on marine microorganisms due to limited availability of vital nutrients. Red indicates the regions of highest nutrient-related stress.
Kel Elkins/NASA’s Scientific Visualization Studio

Editor’s note: This article was updated on June 5.

A new study combining NASA satellite observations, ocean surveys, and genetic testing on marine microorganisms found evidence that warming ocean waters may be limiting nutrient availability across much of the global ocean. The researchers report that this nutrient stress affects microscopic marine organisms and could influence marine ecosystems over time.

The research, published June 5 in Science Advances, tracked the condition of phytoplankton, which form the base of ocean food webs. Rather than measuring nutrients like nitrogen, iron, and phosphorus directly, the researchers inferred stress by tracking subtle shifts in the ratio of carbon to chlorophyll in phytoplankton observed from space. When the amount of chlorophyll decreases relative to carbon as seen in satellite data, it’s an indication that the plankton are stressed. 

“As our ocean continues to change, the ability to observe and track ocean conditions through sustained, high quality remote sensing observations has never been more important,” said Laura Lorenzoni, Program Scientist for NASA’s Ocean Biology and Biogeochemistry Program at NASA Headquarters in Washington. “This is fundamental, as plankton communities are the base of the marine food web on which important economic activities rely.” 

The research team combined two decades of data from NASA’s Aqua satellite’s Moderate Resolution Imaging Spectroradiometer (MODIS) sensor with plankton samples collected on research cruises around the world. The approach linked large-scale satellite observations with genetic markers in Prochlorococcus, a tiny but abundant marine microbe that shows signs of nutrient stress in its DNA. The result is a global map revealing where phytoplankton are thriving and where they’re struggling. 

Ocean chlorophyll, as observed with NASA’s Moderate Resolution Imaging Spectroradiometer (MODIS) instrument between January 2010 through May 2016.
Marit Jentoft-Nilsen/NASA’s Goddard Space Flight Center

The strongest indications of nutrient stress on plankton appeared in the subtropical gyres, which are vast, relatively calm regions of the Atlantic, Pacific, and Indian oceans. In these areas, a layer of warm surface water stifles the flow of colder water from deeper in the ocean.  

“When the surface of the ocean warms, it generates this very stable situation where a layer of low-density water sits on top of higher-density cold water,” said study coauthor Adam Martiny, an oceanographer at the University of California, Irvine. “You’ve probably experienced that if you’ve ever been to a lake in the summertime—it’s super warm right on the surface, and very cold deeper down when you stick your legs in.” 

This layering blocks the upward flow of nutrient-rich water, limiting the availability of ocean surface nutrients that are crucial for plankton. In the South Pacific, one of the most nutrient-poor regions, a layer of warm surface water contributed to nitrogen and iron shortages, producing the most severe nutrient-related stress that the team discovered. 

But the researchers were surprised to find that parts of the North Atlantic experience less nutrient stress than expected. Although there was evidence of a lack of phosphorus, the impact on microorganisms was comparatively mild. 

That difference may reflect the biology of the organisms themselves. Phytoplankton can partially compensate for phosphorus shortages by recycling phosphorus more efficiently or replacing phosphorus-rich molecules inside their cells. Nitrogen shortages are harder to overcome because nitrogen is crucial for the proteins and cellular machinery required for photosynthesis and nutrient uptake. 

The study revealed that nutrient stress is strongly correlated with seasons and major weather cycles such as El Niño and the Pacific Decadal Oscillation, which lead to warming waters in the Pacific Ocean. During La Niña events, which cool water over a large part of the Pacific, stronger upwelling brought more nutrients to surface waters and reduced stress in some regions. Superimposed on those multi-year cycles, however, was a longer-term trend. 

From 2002 through 2021, average sea-surface temperatures increased across nearly 90% of the ocean area examined in the study. Over the same period, nutrient stress generally intensified, consistent with previous hypothesis that warming oceans may become increasingly stratified and less able to replenish surface nutrients. 

In many nutrient-poor regions of the Southern Hemisphere, however, the researchers found evidence that nutrient stress had not increased as much as expected despite significant warming. They suspect that microbes capable of capturing nitrogen from the air may partially offset the effects of reduced nutrient mixing. 

That finding hints that marine ecosystems may possess more resilience to warming climates than some models predict. It also underscores the complexity of forecasting how ocean biology will respond to continued warming. 

“We have two really powerful tools,” said study coauthor Michael Behrenfeld, a biochemist with Oregon State University in Corvallis, Oregon. The tools include satellite observations and cellular studies. “Both produce big data sets, but they are kind of opposites. We have very detailed data about microscopic phytoplankton … and then we have global coverage with satellites.”   

By combining satellites that monitor the entire ocean with genetic clues carried inside microscopic plankton, the researchers say they are gaining a new way to track biological responses to changing environmental conditions near real time. 

By James Riordon
NASA’s Earth Science News Team

Media contact: Elizabeth Vlock
NASA Headquarters

About the Author

James Riordon

James Riordon

Senior Science Writer

  •  

NASA’s X-59 Aircraft Flies Supersonic for First Time

4 min read

Preparations for Next Moonwalk Simulations Underway (and Underwater)

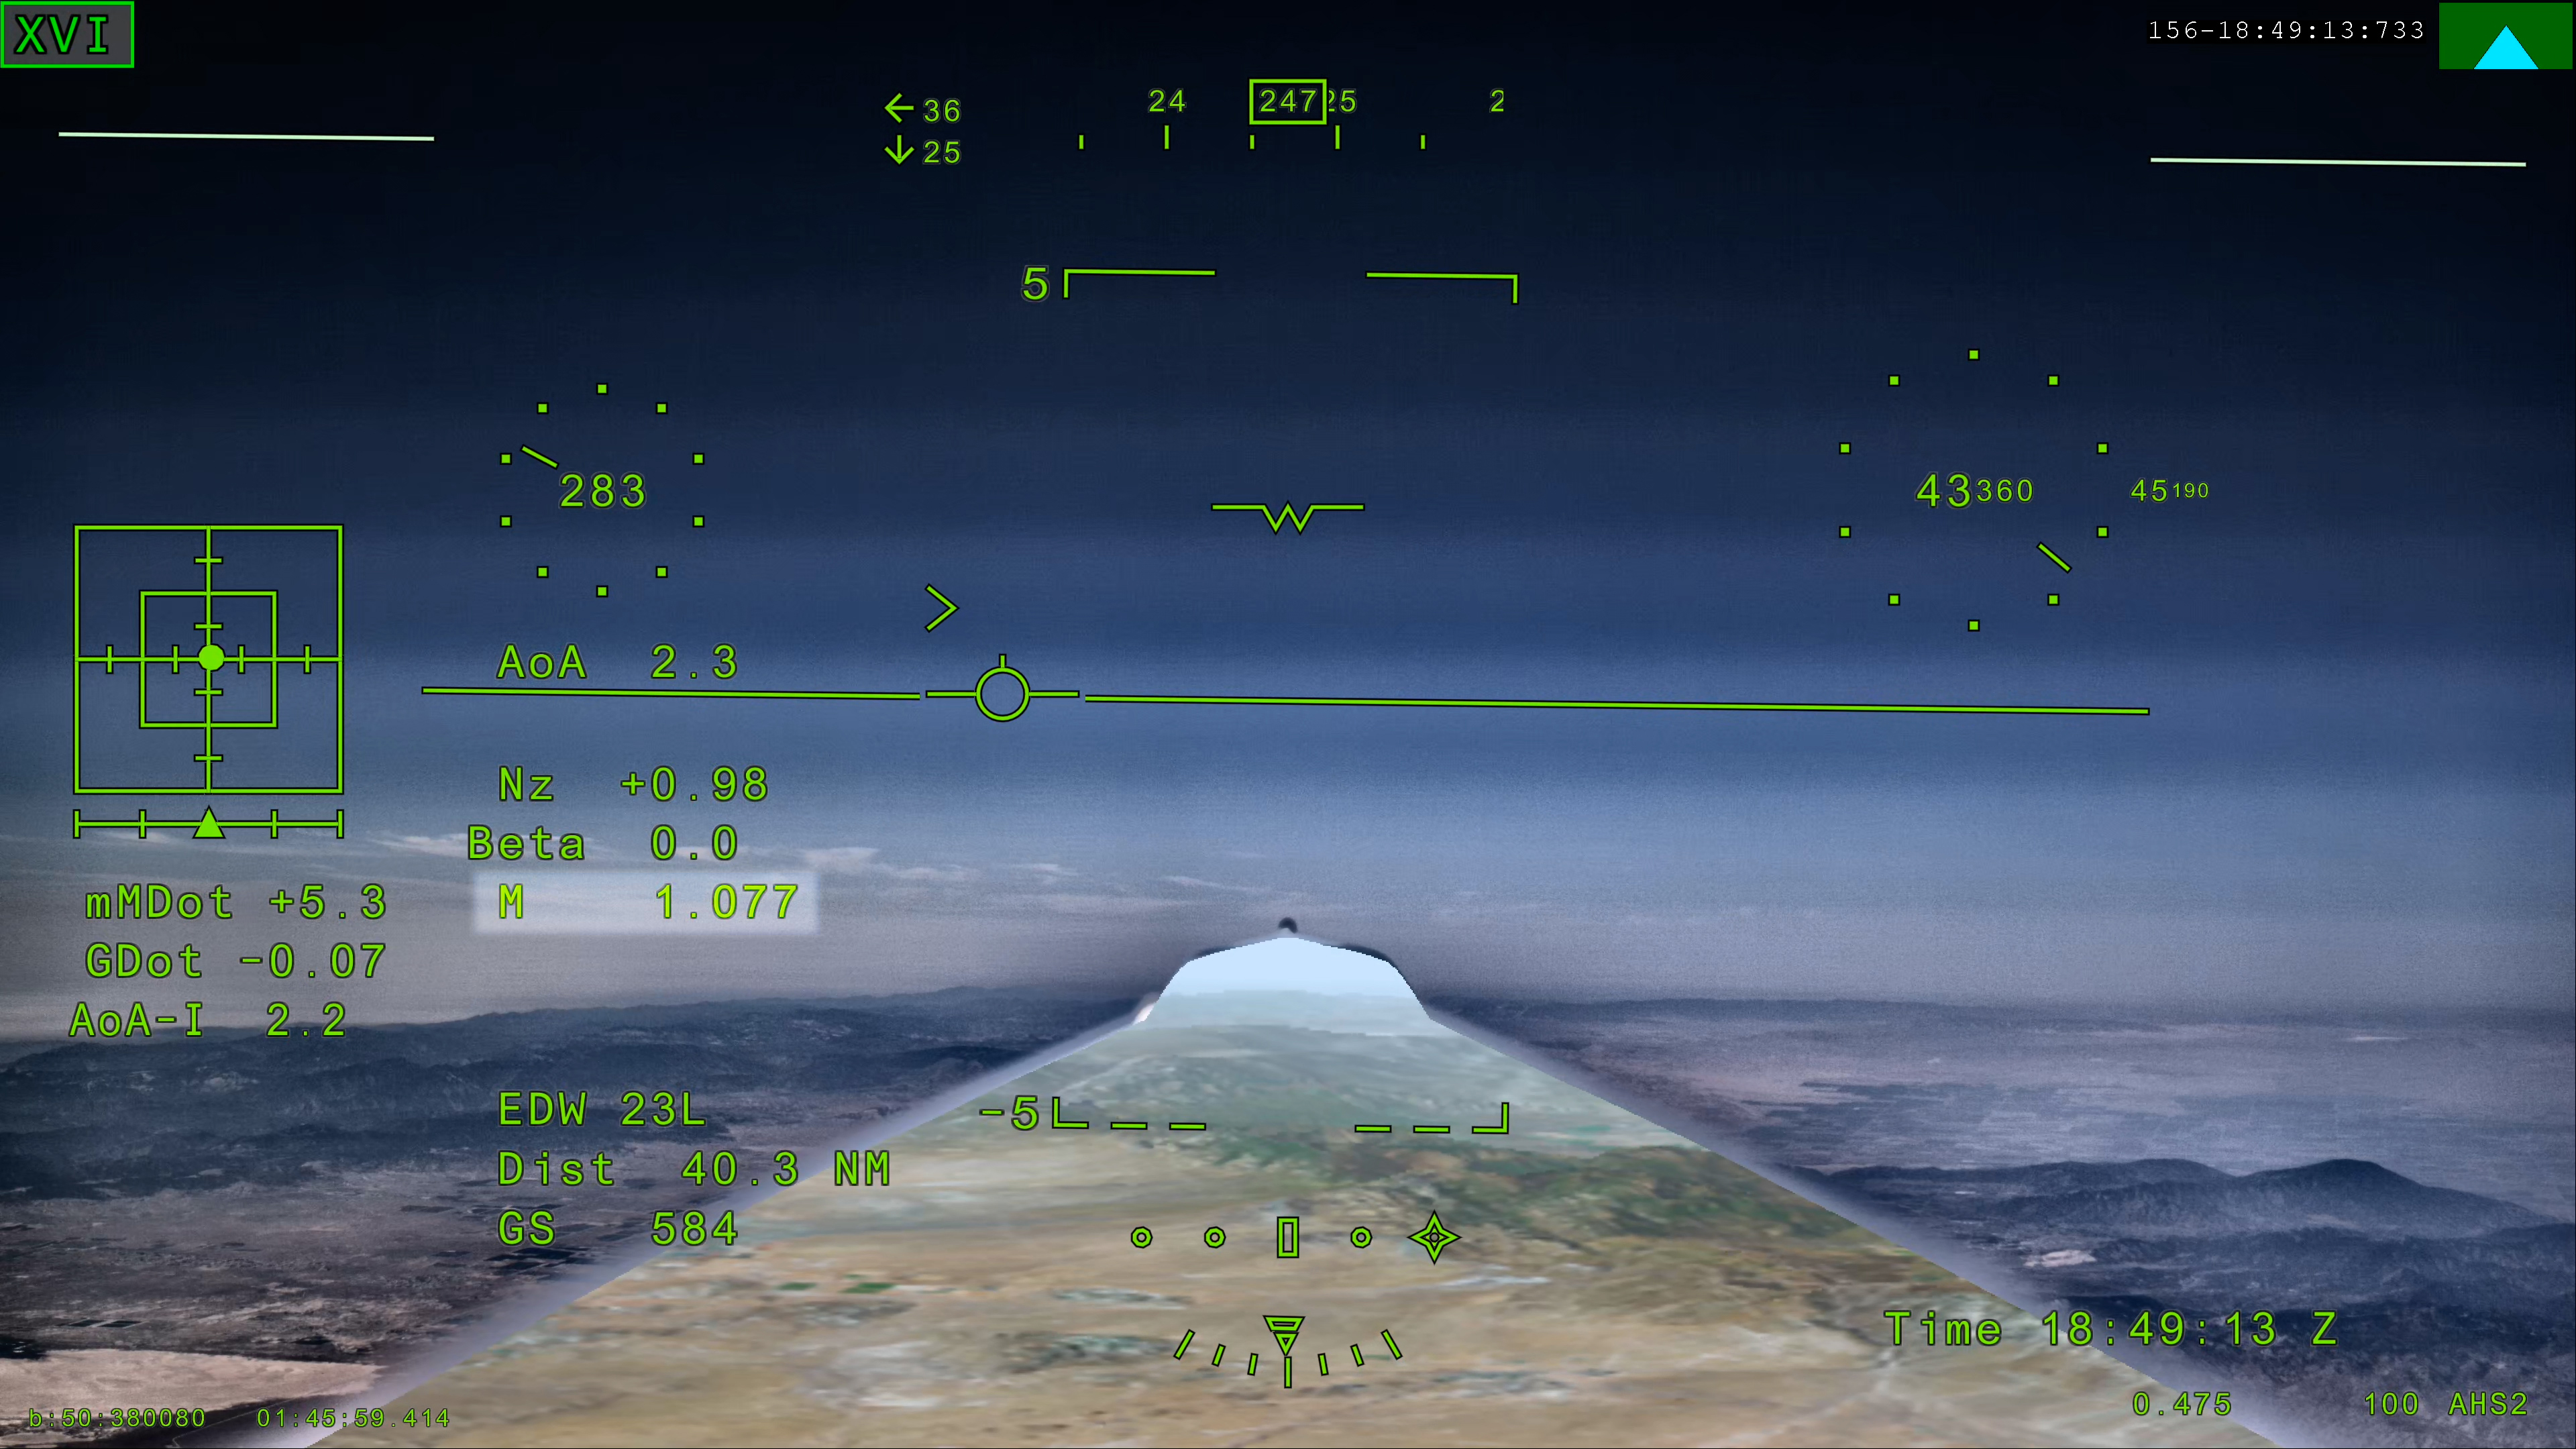
NASA’s X 59 eXternal Vision System digital display shows green flight data overlaid on the forward scenery as the aircraft flies supersonic. Numerical indicators, horizon references, and a Mach number readout are visible on the screen.
NASA’s X-59 eXternal Vision System shows Mach 1.077 on Friday, June 5, 2026, marking the aircraft’s first time reaching supersonic speed in support of NASA’s Quesst mission. The moment represents a milestone for the aircraft as it transitions to include test flights faster than the speed of sound.

NASA

NASA’s experimental X-59 aircraft marked a major milestone Friday, June 5, when it flew faster than the speed of sound for the first time, setting the stage for demonstrating its quiet supersonic capabilities later this year. 

NASA test pilot Jim “Clue” Less took off and landed at Edwards Air Force Base in California, reaching a top speed of approximately Mach 1.1 (713 mph) and altitude of 43,400 feet. The X-59’s flight began at 11:08 a.m. PDT and lasted 81 minutes, with the team focusing on flying qualities at both subsonic and then supersonic speeds.  

In the coming days, we expect to take the next step and push to Mach 1.4

jared isaacman

jared isaacman

NASA Administrator

”X-59 is getting ready for its quiet supersonic debut. Since the aircraft’s first flight on Oct. 28, 2025, the team has made tremendous progress, flying 16 times in the last 90 days and getting into a steady test rhythm. In the coming days, we expect to take the next step and push to Mach 1.4,” said NASA Administrator Jared Isaacman “I’m grateful to the NASA team and Lockheed Martin Skunk Works for their help getting us to this point, and I hope this is the first of many collaborations as we rebuild NASA’s X-plane portfolio.” 

The X-59 is designed to fly at supersonic speeds while creating only a quiet thump instead of a loud sonic boom. For this flight, a NASA F‑15 chase plane flew nearby to monitor the X‑59. The loud sonic booms from the F-15 obscured any sound made by the X-59.  

“The X-59’s first supersonic flight is a testament to America’s enduring leadership in science, engineering, and aerospace innovation,” said Michael Kratsios, Assistant to the President for Science and Technology and Director of the Office of Science and Technology Policy. “This achievement comes as the Trump Administration continues work to unleash supersonic flight and enable American ingenuity.” 

This first supersonic flight is a significant milestone, but an event even more critical to the mission is upcoming. In just days, the aircraft is expected to make its first “mission conditions” flight, reaching a cruising speed of Mach 1.4 (925 mph) and altitude of approximately 55,000 feet. The X-59 also will be accompanied by a chase plane for this flight.  

NASA’s X-59 quiet supersonic research aircraft flies above the clouds during its first supersonic flight. The aircraft is shown in side profile during level flight with desert and mountain terrain visible below.
NASA’s X-59 quiet supersonic research aircraft completed its first supersonic flight Friday, June 5, 2026, marking the first time the aircraft exceeded the speed of sound in support of NASA’s Quesst mission. The milestone represents a major step in flight testing as the aircraft expands into the supersonic portion of its flight envelope.
NASA / Lori Losey

This speed and altitude are the base conditions for the X-59 when it will eventually fly over several U.S. communities enabling NASA to gather data about how people may perceive its quiet thump. NASA will share this data with U.S. and international regulators to help establish new data-driven noise standards to enable a future viable market for supersonic commercial flight over land. 

For the last several months, the X-59 has been participating in an ongoing series of flights where the plane has been flying at a wide range of speeds and altitudes – a process known as envelope expansion. These tests are the first phase of the X-59’s flight testing. They are focused on performance and involve chase plane monitoring. When the aircraft completes this phase it will enter another, focused on its sound profile in order to verify its quiet thump capability.  

The X-59 is the centerpiece of NASA’s Quesst mission, which aims to demonstrate quiet supersonic flight and help enable commercial supersonic flight over land worldwide. These advancements will help travelers reach their preferred destinations faster, spending less time in the air. 

Through Quesst’s development of the X-59, NASA also will deliver design tools and technology for quiet supersonic airliners that will achieve the high speeds desired by commercial operators without disturbing people on the ground. NASA will validate design tools through ground and flight testing, providing U.S. aircraft manufacturers the ability to explore new quiet supersonic concepts, and provide them with confidence that their resulting designs will meet quiet flight requirements.  

quesst-logo-horizontal-051826sm

Read more about NASA’s Quesst mission and the X-59.

Keep Exploring

Discover More Topics From NASA
💾

NASA’s X-59 quiet supersonic research aircraft completed its first supersonic flight Friday, June 5, 2026, marking the first time the aircraft exceeded the s...
  •  

NASA Announces Winners of 2026 University Innovation Competition 

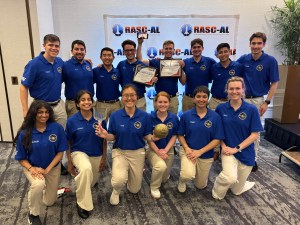
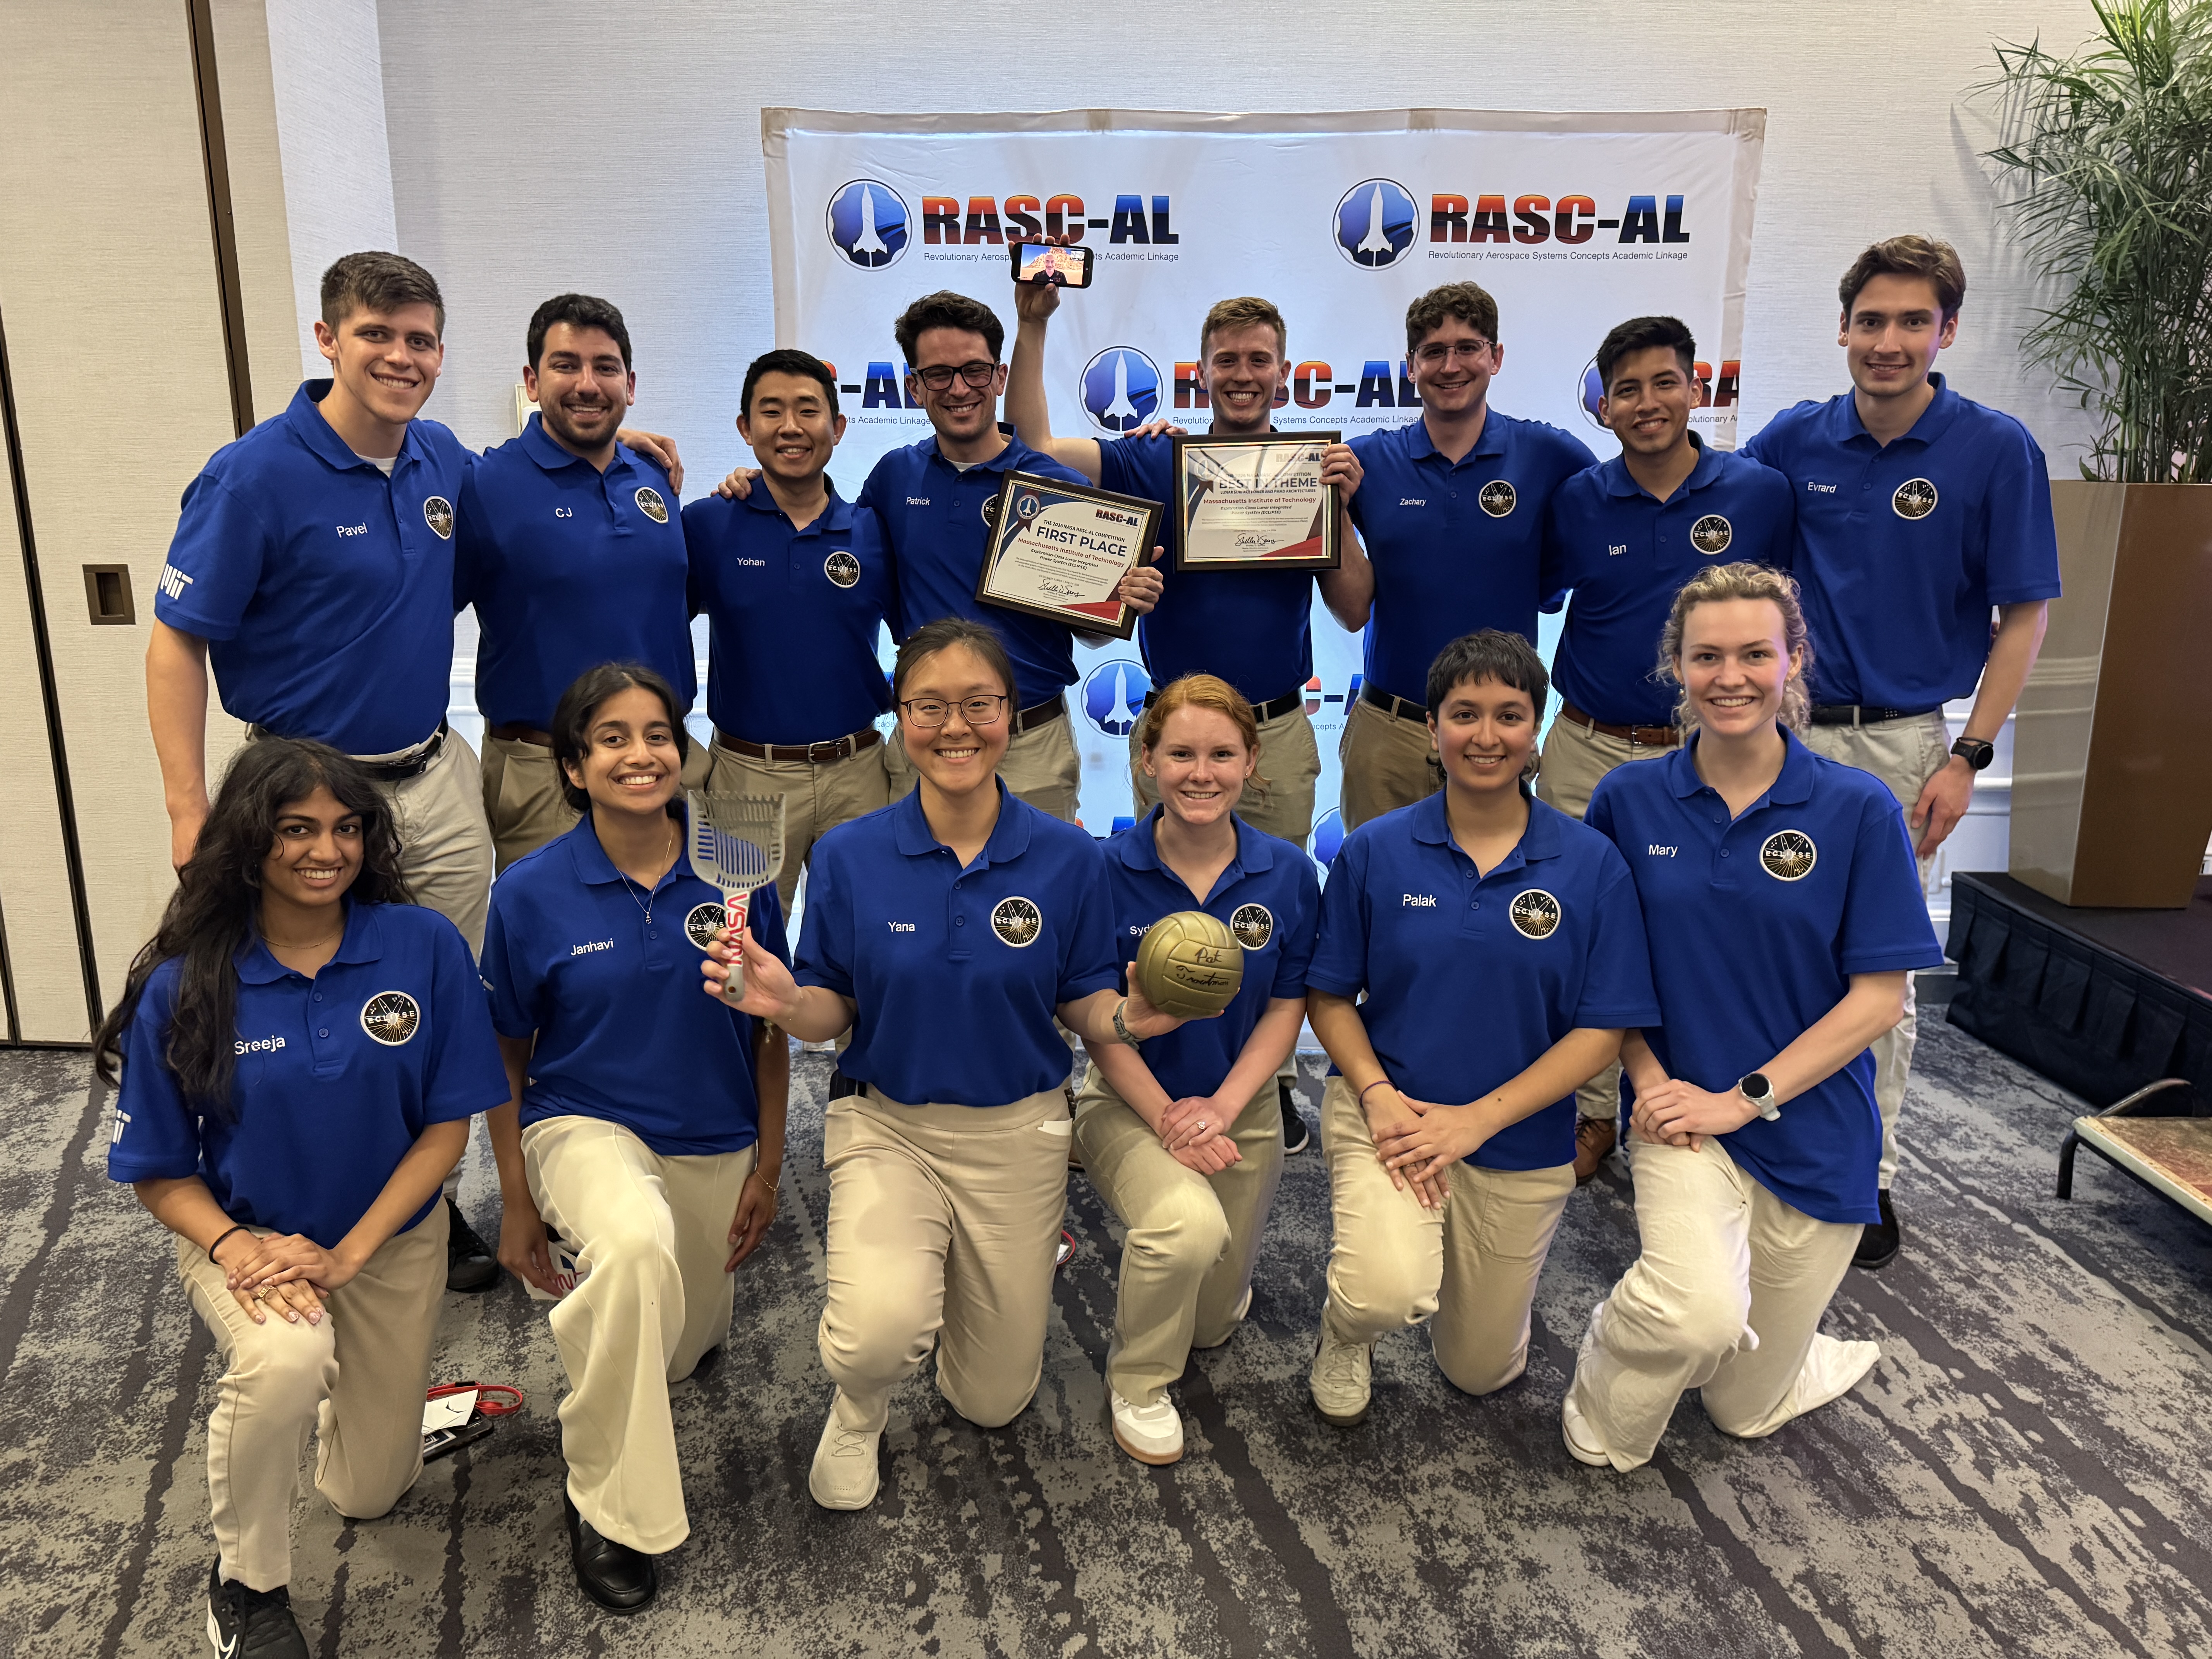
A group of 14 students wearing blue polo shirts smile at the camera while holding the first place certificate for winning the NASA RASC-AL challenge.
The Massachusetts Institute of Technology team that won the 2026 RASC-AL competition for their project, Exploration-Class Lunar Integrated Power SystEm.
Credit: National Institute of Aerospace

NASA announced the Massachusetts Institute of Technology project, Exploration-Class Lunar Integrated Power SystEm, as the first place winner for the 2026 Revolutionary Aerospace Systems Concepts – Academic Linkage (RASC-AL) competition, which challenges students to bridge gaps in aerospace technology by innovating new system concepts and prototypes. 

Another team from the same university won second place overall for their project, Mars Exploration Layered Infrastructure for Operations, Research, and Advancement, while Virginia Polytechnic Institute and State University took third place with the Mars Pylon Network.  

Empowering the next generation, the competition also supports the agency’s workforce development priorities by offering university teams hands-on experience in mission architecture development, systems engineering, and technical communication. 

“The winning teams demonstrated how academic innovation can support Artemis mission goals,” said Daniel Mazanek, program sponsor for RASC-AL and senior space systems engineer, NASA’s Langley Research Center in Hampton, Virginia. “Their work highlights the important role student research plays in shaping future space exploration, and the results showcase how disciplined analysis can elevate innovative ideas into viable exploration concepts.”  

Fourteen finalists attended the multi-day RASC-AL Forum in Cocoa Beach, Florida, and gave formal presentations outlining their mission architectures, technology solutions, and supporting analysis. These discussions provided students with real-time engineering feedback, exposing them to the rigor and scrutiny applied to human spaceflight concepts under development within the agency. 

Awards were presented to teams demonstrating the highest levels of technical rigor, innovation, and mission alignment. In addition to the top prizes, other awards included: 

  • Best in Communications, Position, Navigation, and Time Architectures for Mars Surface Operations Theme: Massachusetts Institute of Technology 
    Mars Exploration Layered Infrastructure for Operations, Research, and Advancement MELIORA)
  • Best in Lunar Sample Return Concept Theme: South Dakota State University 
    Sample Extraction of Lunar Elements for Network Entry (SELENE)
  • Best in Lunar Surface Power and Power Management and Distribution Architectures Theme: Massachusetts Institute of Technology 
    Exploration-Class Lunar Integrated Power SystEm (ECLIPSE) 
  • Best in Lunar Technology Demonstrations Leveraging Common Infrastructure Theme: Massachusetts Institute of Technology 
    CLPS-enabled Highly-autonomous End-to-End isruSystem Evaluations to Build Understanding and Resilient Growth by Experimenting with Regolith (CHEESEBURGER) 
  • Best Prototype: 

    Embry-Riddle Aeronautical University, Worldwide Campus 
    Advanced Utilization of Resources for Energy & Viability Off-Earth (Project AUREVO)
    University of Illinois, Urbana-Champaign with Leonardo de Vinci Engineering School 
    Mining and Advanced Transformation of Regolith for Infrastructure and eXpansion (MATRIX) 

“The RASC-AL program allows students to demonstrate their ability to transform innovative concepts into technically sound studies, with emphasis on technical rigor, clear communication, and systems-level thinking,” said Christopher Jones,  program sponsor for RASC-AL and chief technologist for the Systems Analysis and Concepts Directorate at NASA Langley. “These are the hallmarks of effective engineering that we’re looking for and reflect the standards required for real-world aerospace problem-solving,”  

The NASA RASC-AL competition represents a cross-agency collaboration. The competition is administered by the National Institute of Aerospace and managed by the NASA Tournament Lab, part of the agency’s Prizes, Challenges, and Crowdsourcing Program.  

For more information, visit:  

https://go.nasa.gov/3GS1OGm

  •  

NASA’s Artemis II Moon Mission Research Continues on Earth

5 min read

NASA’s Artemis II Moon Mission Research Continues on Earth

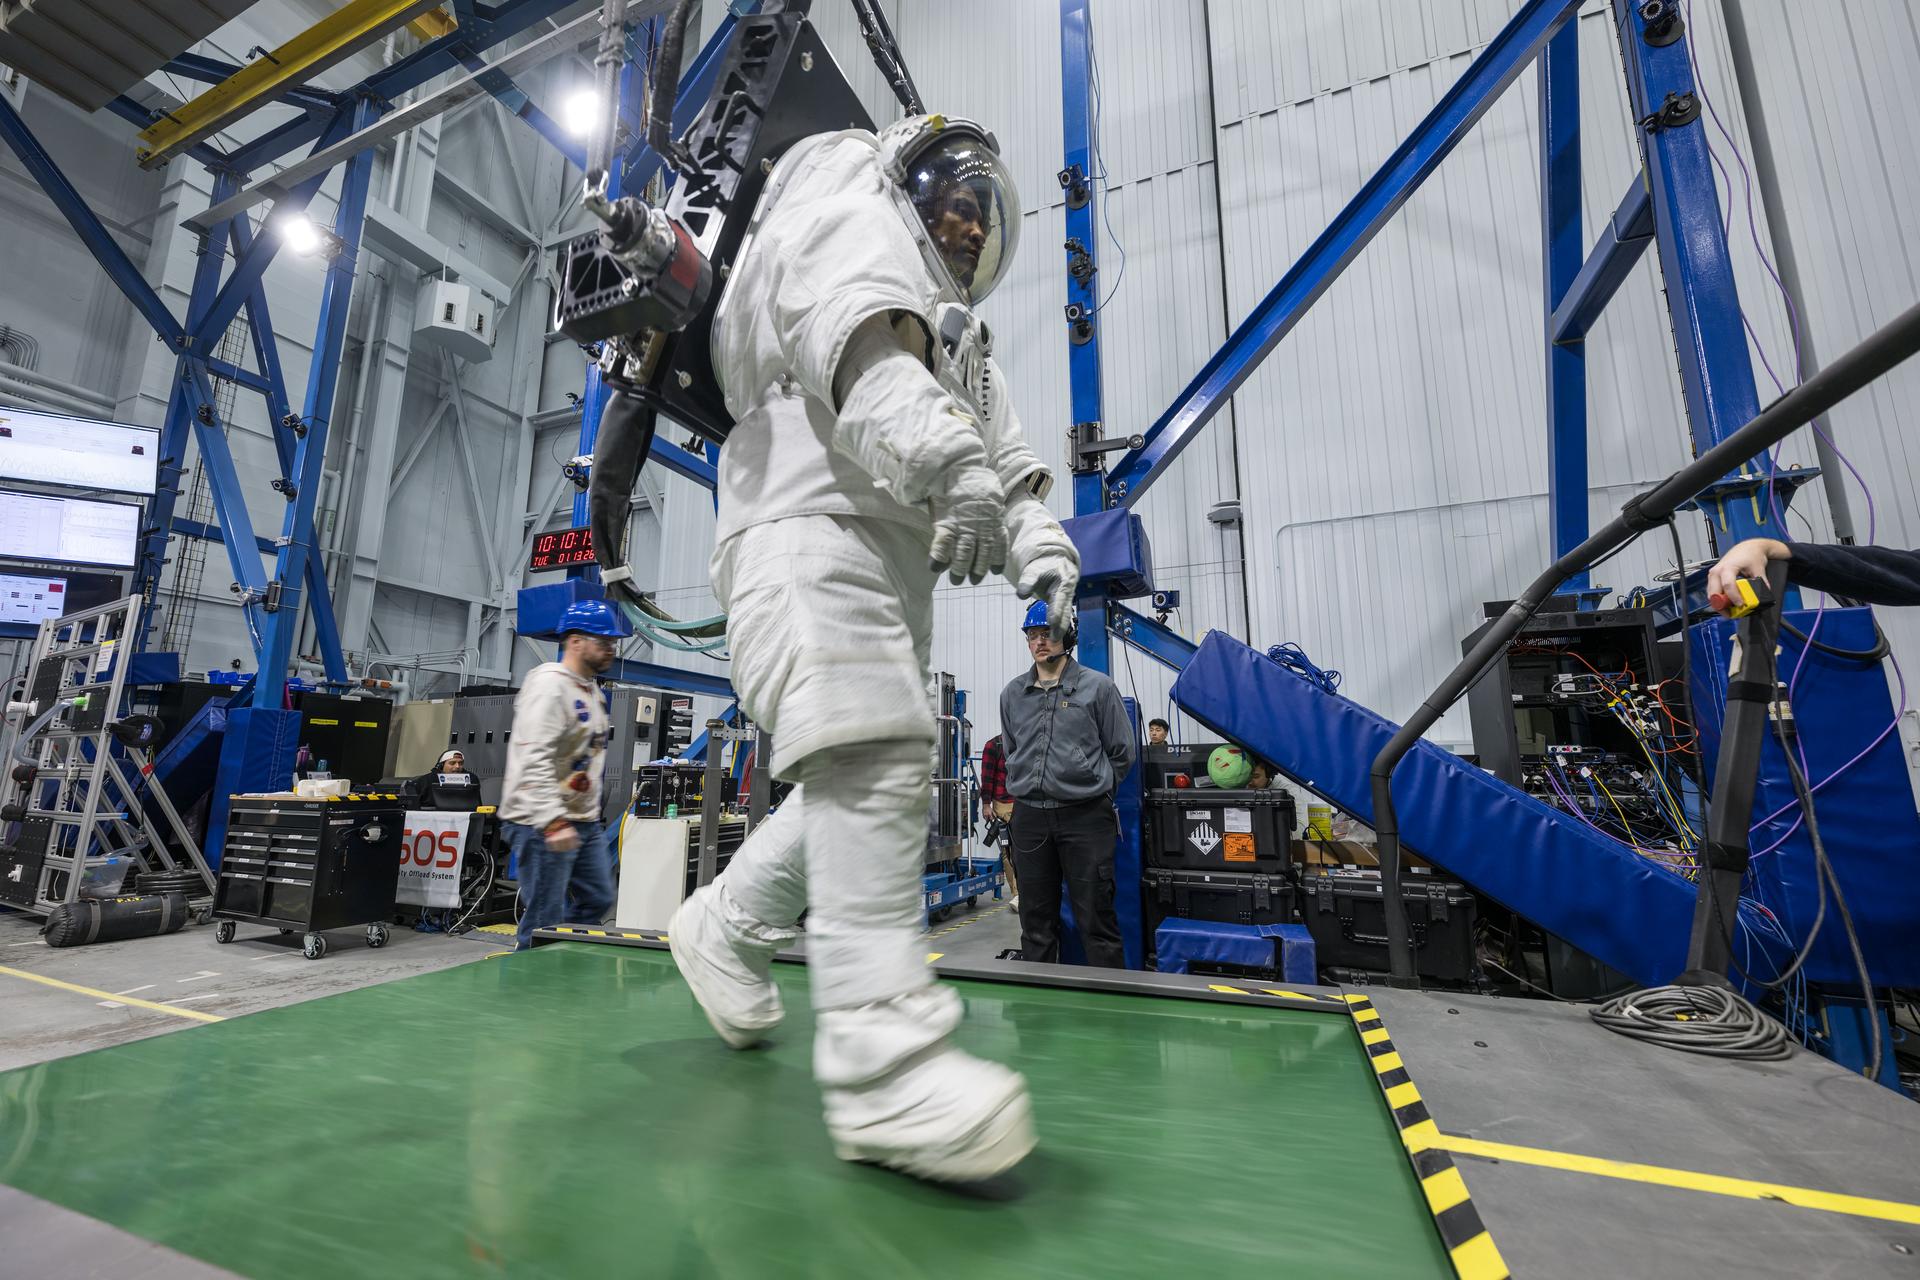
Dressed in a white space suit—with hands gloved, feet booted and head in a helmet with a clear visor—Artemis II astronaut Victor Glover walks on a wide green treadmill. His suit is harnessed to a black machine that is taking the weight off Glover such that, while in the suit, he experiences forces equivalent to lunar gravity. Two people wearing casual clothes and blue hard hats stand in the background, waiting to support Glover and the experiment, should the need arise.  Behind Glover are crisscrossing blue iron beams that stretch to a high ceiling in this industrial building at NASA’s Johnson Space Center.
Artemis II astronaut Victor Glover walks on a treadmill while in a space suit harnessed to NASA’s Active Response Gravity Offload System at NASA’s Johnson Space Center. Glover is simulating a walk on a planetary surface while in a suit that has been offloaded to lunar gravity. Artemis II astronauts completed this and other suited tasks before their mission launched and within a few days of landing, giving researchers a chance to assess how quickly upon landing crews’ bodies adapt to a different gravity. Results will help scientists better understand how soon after landing crews can complete mission-critical tasks on the surface of the Moon or Mars.
NASA/Robert Markowitz

Since NASA’s Artemis II crew members safely splashed down in the Pacific Ocean on April 10 after their record-setting mission around the Moon, science teams have been busy collecting more data and combing through observations collected on the test flight. Results from these science investigations will help support safe human exploration of deep space and provide a blueprint for how future missions will conduct science on the lunar surface as NASA builds a Moon Base and develops an enduring human presence there.

Postflight crew health, performance data

In the hours, days, and weeks after landing, the Artemis II crew members, NASA astronauts Reid Wiseman, Victor Glover, Christina Koch, and CSA (Canadian Space Agency) astronaut Jeremy Hansen, contributed critical data to help the agency understand how the human body reacts to spaceflight. Collecting this data as soon as possible after landing was important to understand how the body adapts from microgravity to Earth’s gravity. The data will inform NASA’s understanding of how quickly crews can complete mission-critical tasks after landing on a planetary surface like the Moon or Mars, where there won’t be landing support personnel to assist.  

Within a day of splashdown, researchers collected a suite of data for the Artemis II Spaceflight Standard Measures study, which is part of a larger effort across the astronaut corps to gather a baseline set of health measurements on blood pressure, heart rate, eye health, and motor control. Crew members also completed a mini obstacle course, which included lying down, standing up, unfurling a rope ladder, ladder climbing, and more, to assess how their bodies were adapting to Earth’s gravity.

Once the crew returned to NASA’s Johnson Space Center in Houston, researchers guided them through further medical check-ups and tests of motor control. Over the next several days, the crew completed obstacle courses wearing spacesuits offloaded to lunar gravity, which is roughly one-sixth the force of Earth’s gravity. Researchers are now analyzing this data to gain insight into how crews may perform as they adapt to the gravity of a planetary surface.

As part of the Immune Biomarkers study, researchers are comparing blood and saliva samples collected after the Artemis II splashdown with samples collected preflight and during the mission. Among other topics, the study investigates whether and how dormant viruses reawaken in astronauts’ bodies while in space.

Some crew members completed postflight cognition tests and a simulated manual spacecraft docking task to assess motor control for the ARCHeR (Artemis Research for Crew Health & Readiness) study. This, combined with data collected through a wrist-worn device while crew members were in space, is used to understand the effect of space hazards on well-being and performance.

Initial data collections for Artemis II health studies concluded 45 days after splashdown. However, medical teams will continually monitor astronaut health throughout the Artemis II crew members’ lifetimes.

Once this data is processed and anonymized, information will be available for scientists to study the effects of spaceflight via a request to NASA’s Life Sciences Data Archive. The results from this work could lead to new technologies and studies that help predict the adaptability of crews on future missions to the Moon and Mars.

Analyzing astronaut-derived organ chips flown around Moon

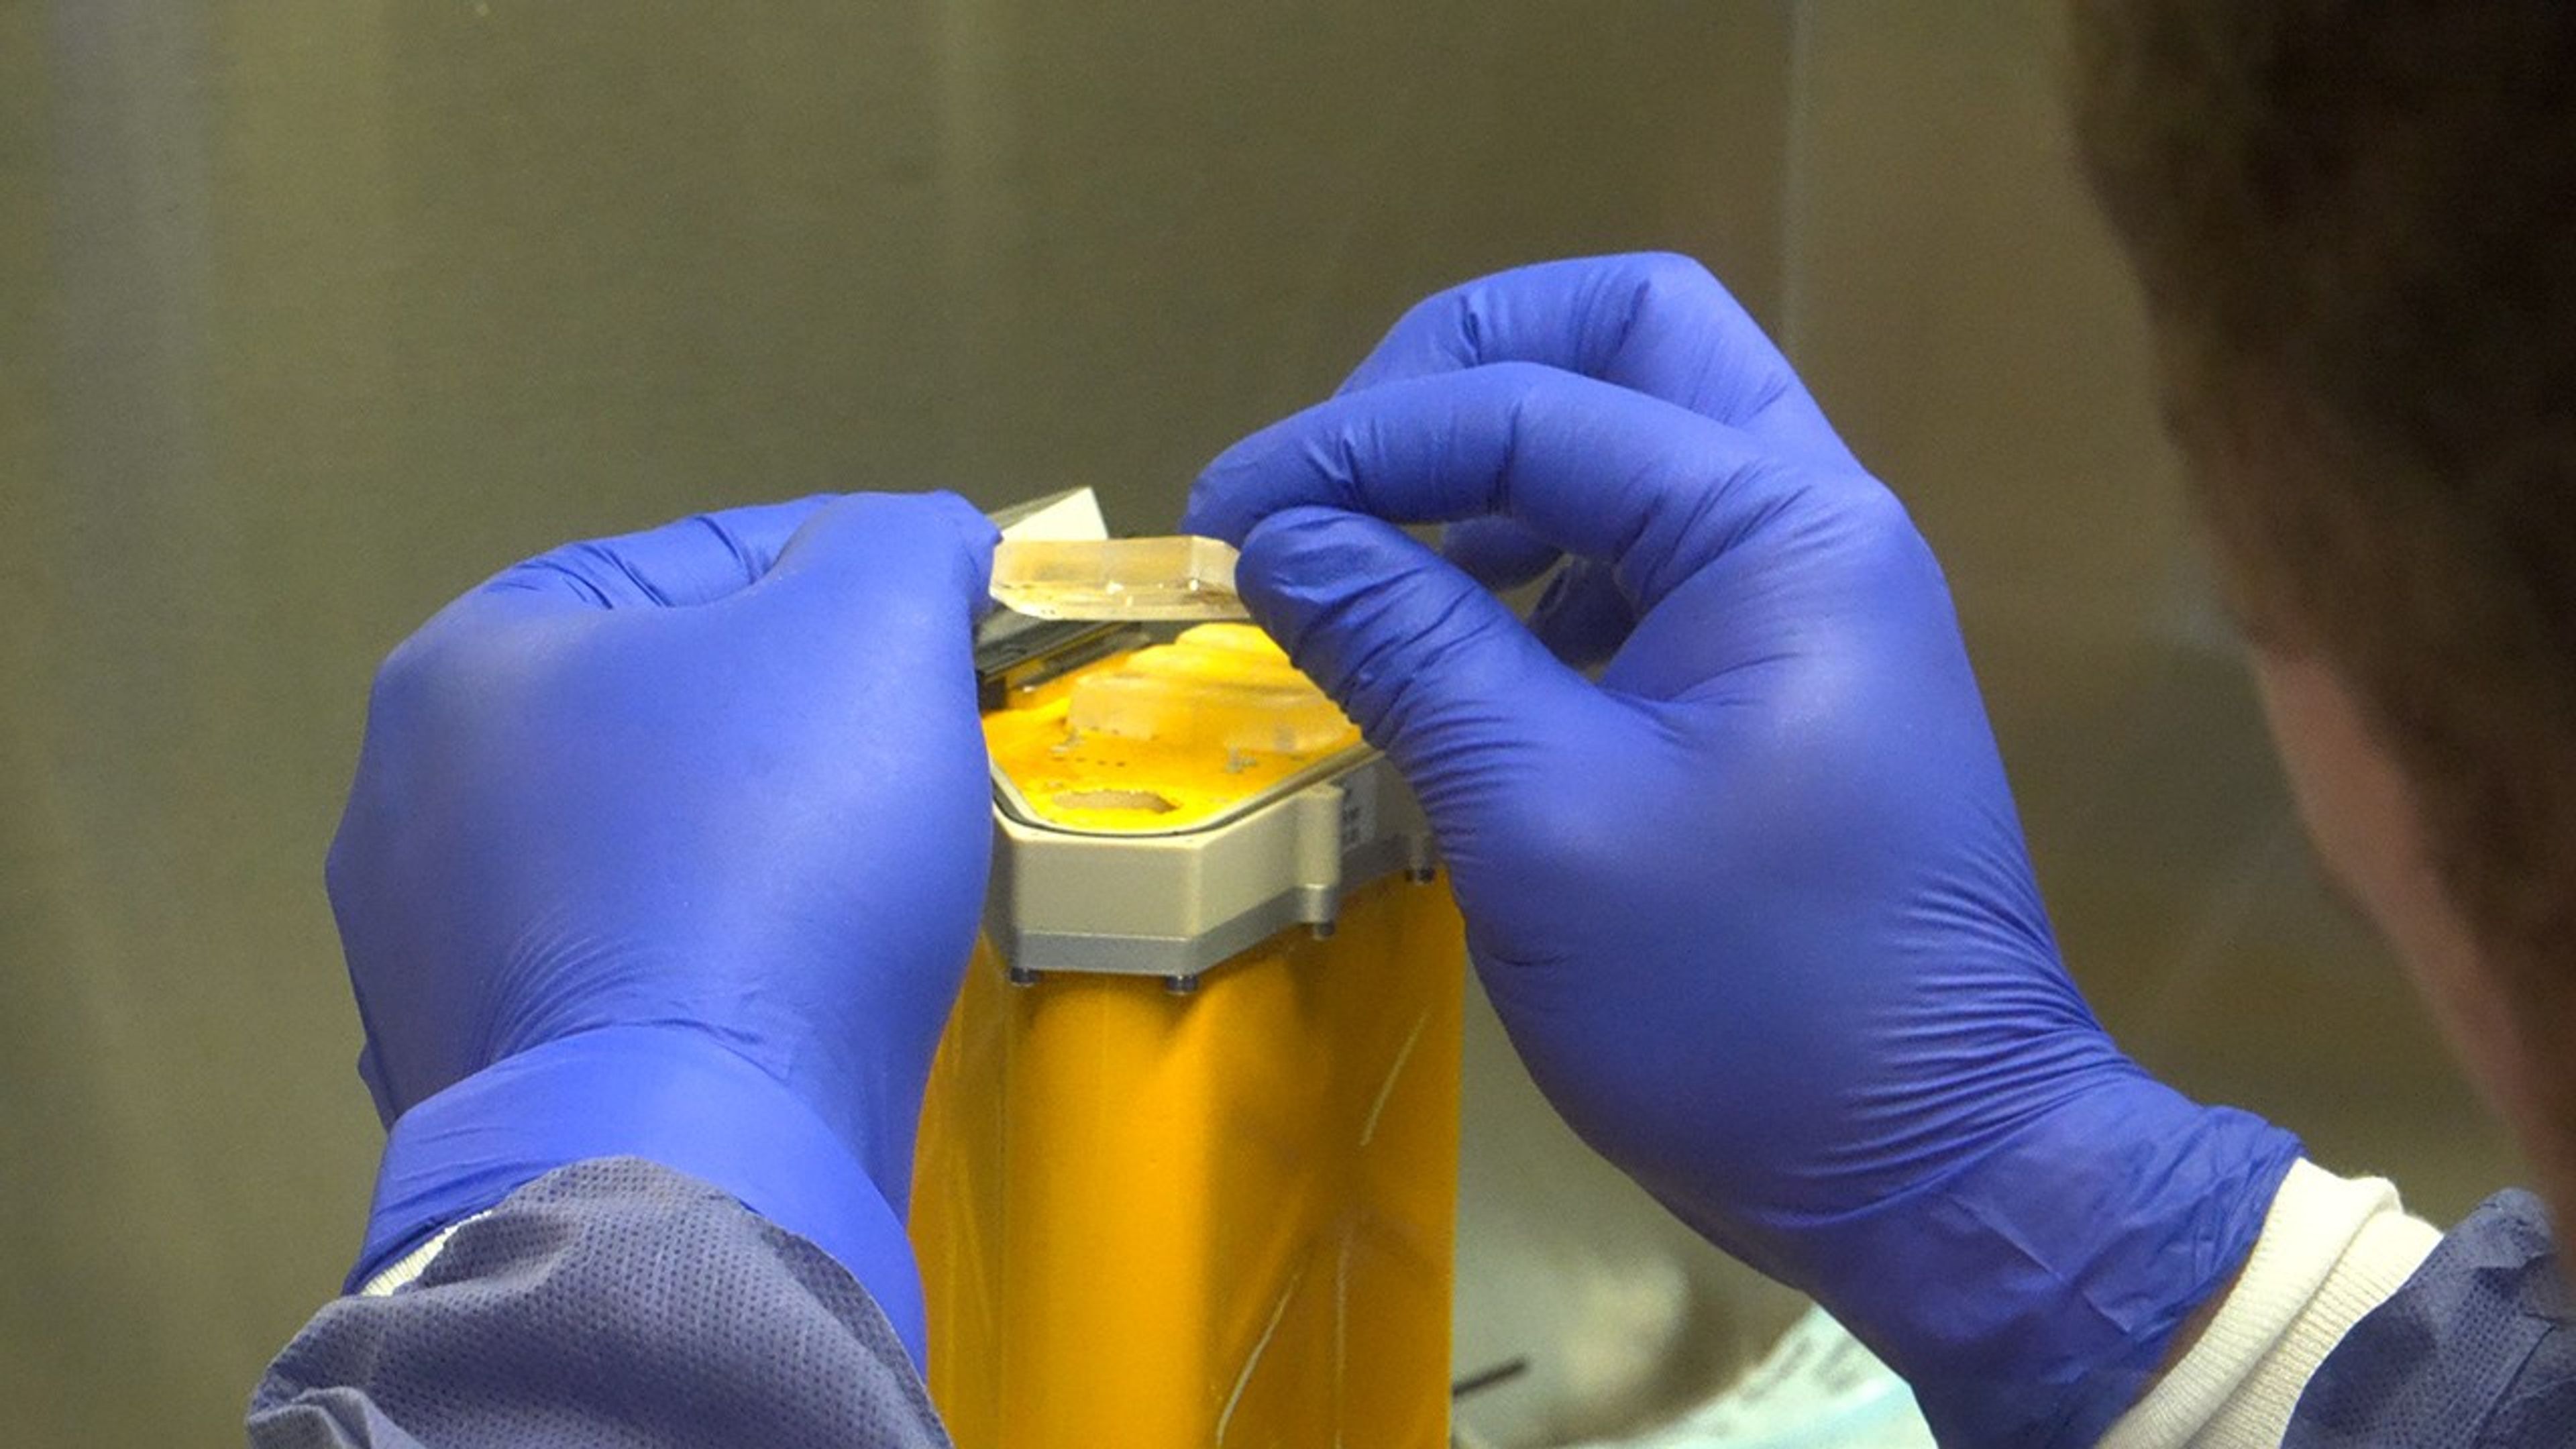
A person wearing blue gloves holds a small cylindrical organ chip.
A scientist handles AVATAR organ chips following their journey around the Moon aboard Orion. The chips contain cells from each astronaut and are being prepared for detailed analysis.
NASA

Organ chips from NASA’s AVATAR (A Virtual Astronaut Tissue Analog Response) investigation are being analyzed at chip developer Emulate’s laboratory in Boston. The organ chips included bone marrow cells from each Artemis II astronaut. They flew around the Moon with the astronauts, and now researchers are studying these organ chips to determine how deep space radiation and microgravity affect human health at the molecular level.

Scientists are comparing the chips flown aboard the spacecraft to ground controls and crew blood samples using advanced techniques, including single-cell RNA sequencing. The analysis will characterize how organ chips model individual responses to spaceflight, which is data that could allow NASA to send future astronauts’ AVATAR chips ahead on missions to develop personalized medical kits. The researchers plan to share early findings at scientific conferences while full analysis continues.

Lunar imagery, audio for data release

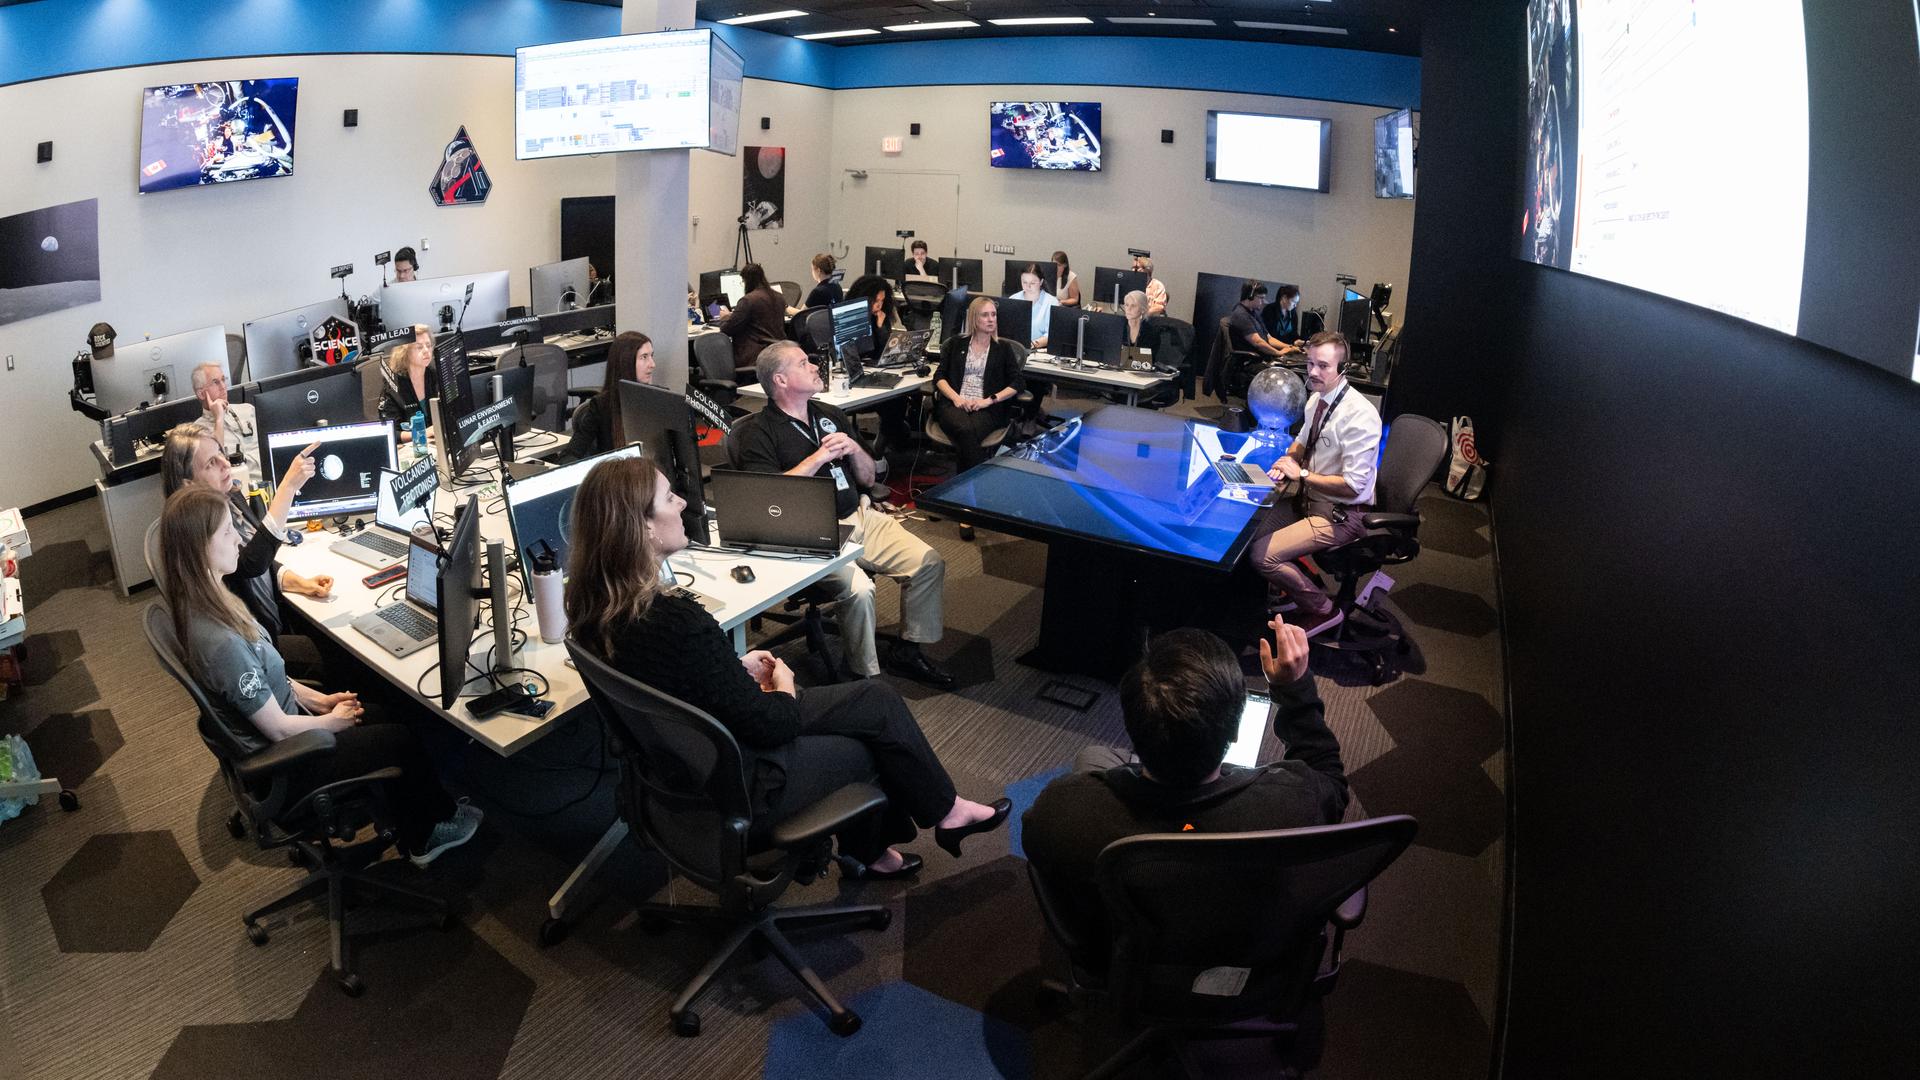
A large operations room filled with about two dozen staff members seated at computer workstations. Rows of desks with multiple monitors face a central area where a person sitting at a glass-topped desk appears to be speaking to the group. Large screens mounted on the walls display space-related imagery and data. Several people are looking towards a large screen hanging on a wall on the right of the image, while others work at their computers. The room is brightly lit, with blue accents along the walls, creating the atmosphere of a space operations or flight control center.
In this April 3, 2026, image, the Artemis II lunar science team is shown working in the Science Evaluation Room in the Mission Control Center at NASA’s Johnson Space Center in Houston. The team is putting together a plan of science observations for the Artemis II crew, which was headed toward the Moon aboard Orion. As they passed the Moon at closest approach on April 6, the crew applied the geology skills they learned in the classroom and in Moon-like environments on Earth as they photographed and described nuances of geologic features such as impact craters, ancient lava flows, and surface cracks and ridges. The crew noted differences in color, brightness, and texture — details that provide clues to surface composition and history.
NASA/Bill Stafford

On April 6, the Artemis II crew members studied features on and around the Moon for nearly seven hours during Orion’s closest approach to the lunar surface. Their work was guided by a minute-by-minute observation plan developed by the Artemis II lunar science team.

Scientists are reviewing the data collected from the mission, which includes images, video, and audio files, to release a report of their initial data interpretations later this year. The report will cover observations of impact flashes, variations in color on the lunar surface, and the shape and texture of faults and ridges. The team also will publish a report on how Artemis II lunar science observations were planned, organized, and executed for the benefit of future Artemis missions.

NASA will publish more than 100 science-related audio recordings with transcripts, as well as approximately 11,500 Earth and Moon image and video files from the mission science campaign, with accompanying data. While many of these images already are public, these records will be available through NASA’s Planetary Data System, a public archive of data from all of NASA’s planetary missions. To get the data ready, the team is converting files into standard formats that anyone can easily open and add information to make the data searchable in NASA’s archive for generations to come.

For more information on NASA’s Artemis II science efforts, visit:

https://www.nasa.gov/humans-in-space/artemis-ii-science/

Karen Fox / Molly Wasser

Headquarters, Washington

240-285-5155 / 240-419-1732

karen.c.fox@nasa.gov / molly.l.wasser@nasa.gov

  •  

NASA Concludes Antenna Mishap Investigation, Releases Report

5 min read

Preparations for Next Moonwalk Simulations Underway (and Underwater)

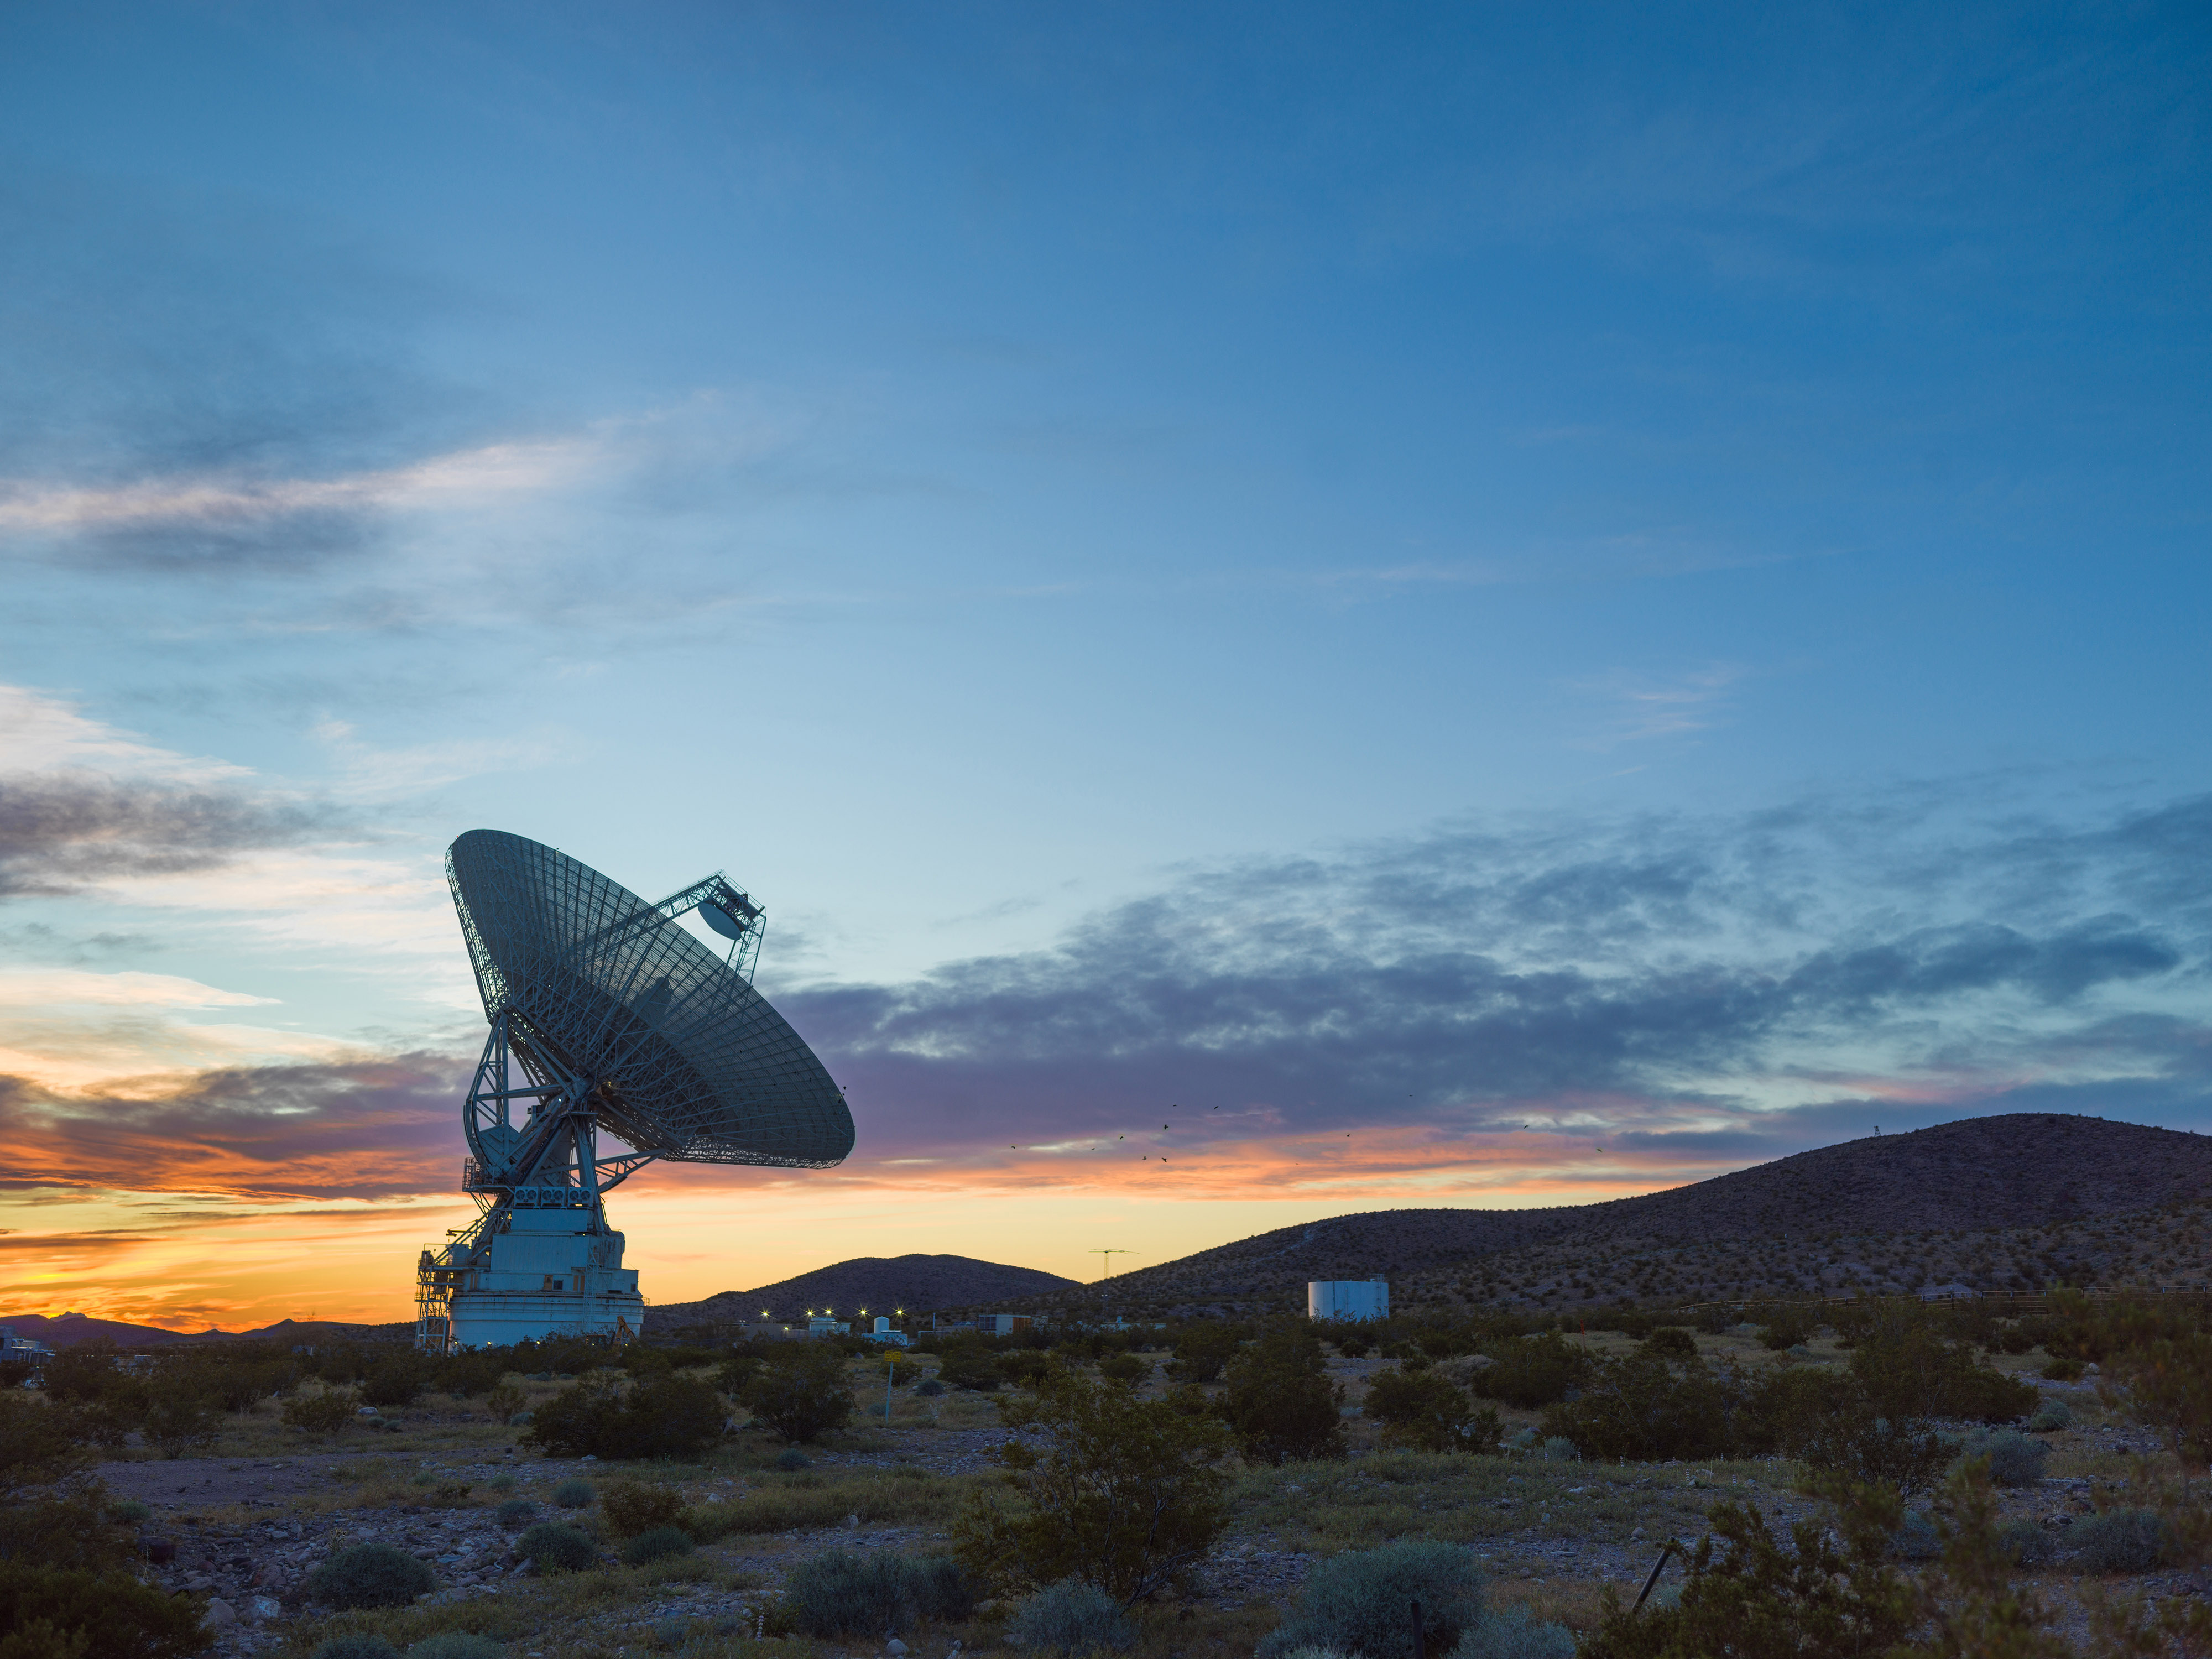
NASA’s Deep Space Station 14, a 230-foot wide radio antenna at the Goldstone Deep Space Communications Complex near Barstow, California is silhouetted against a glowing sunset sky of deep blues, purples, oranges, and yellows. Several support building can also be seen illuminated behind the antenna structure.
This sunset photo shows Deep Space Station 14, the 230-foot-wide (70-meter) antenna at the Goldstone Deep Space Communications Complex near Barstow, California, part of NASA’s Deep Space Network.
NASA/JPL

NASA has completed the investigation into the damage sustained last year at its 70-meter radio-frequency antenna, known as the Deep Space Station 14 (DSS-14), at the Goldstone Deep Space Communications Complex near Barstow, California. The agency has classified the event as a Type A mishap based on the total cost of damages. The antenna will remain offline to complete repairs and previously scheduled upgrades.


“NASA takes safety and any departure from established procedures seriously, and the investigation at Goldstone made clear that we must strengthen our processes. We are acting on the investigation’s findings,” said Joel Montalbano, acting associate administrator for NASA’s Space Operations Mission Directorate at the agency’s headquarters in Washington. “We will update and improve procedures, rebuild core in-house capabilities, and reinforce operational discipline across the Deep Space Network. NASA remains focused on learning from this and modernizing systems, so DSS-14 and the broader network are ready to support our ambitious future missions.”

On Sept. 16, 2025, the DSS‑14 antenna over‑rotated while actively tracking the Juno mission, placing excessive stress on cabling and associated structural supports. Water lines tied to the antenna’s fire‑suppression system also were damaged, causing significant flooding in the facility. There were no injuries.

NASA convened a Mishap Investigation Board, bringing together experts from across the agency to examine the technical, organizational, and cultural factors behind the incident. The board conducted on‑site inspections, interviews, and detailed reviews of technical documentation and operational logs from all three Deep Space Network sites. The board completed its final report in April and submitted it for agency concurrence.

The investigation issued findings and recommendations that emphasize training, technical rigor, operational procedures, system design, clear roles and responsibilities, and safety assurance. At the same time, teams already are applying lessons learned across all network sites to improve operational consistency. These steps will help bolster the network and reduce the risk of future mishaps.

In its final report, the board found the mishap primarily stemmed from software weaknesses, human error, and an undetected failure in the antenna’s hydraulic limit system. Investigators determined an electrical issue at the antenna the previous day caused the control system to misreport the antenna’s rotation state, an issue that went unnoticed and triggered multiple limit-stops during the Juno track on Sept. 16. While working to identify the limit-stop problem, operators performed several troubleshooting steps that inadvertently bypassed software and hardware safeguards, which ultimately led to the over-rotation incident. After flooding in the antenna base was observed, operators attempted to stow the antenna as a safety precaution, however, because the system had already passed the rotation limits, this action drove the antenna further into over‑rotation, causing additional damage.

Additionally, the investigation found the antenna’s hydraulic limit system, its final mechanical safeguard, was inoperable on Sept. 16 after being damaged in an undocumented prior incident. The system also had not been adequately tested for an undetermined period of time.

Investigators also concluded workplace culture pressured operators to work as expeditiously as possible, often stretching beyond their usual roles, expertise, and training, to keep the antenna operating. The board states the cultural conditions observed at Goldstone were not present at the network’s other sites, where roles and responsibilities are followed more consistently. Other contributing factors outlined in the report include inadequate procedures, reliance on undocumented practices and tacit knowledge, and gaps in the antenna’s control logic. NASA will accept this as the final report.

The agency estimates repairs will cost between $4.1 and $4.6 million, with a final figure to be determined after the antenna’s systems are fully assessed. The antenna will remain offline as it enters its previously scheduled extended maintenance and upgrade period, originally set to begin in August and expected to be completed by October 2028. These upgrades are part of broader network improvements essential to supporting future exploration and science missions, as well as enhancing the nation’s planetary defense capabilities.

“We are committed to learning everything we can from this incident, and we’ve already begun putting those lessons into practice,” said Kevin Coggins, deputy associate administrator for NASA’s SCaN (Space Communications and Navigation) Program at the agency’s headquarters. “Our teams are working to strengthen and standardize processes and training across all three network sites to ensure it remains resilient, consistent, and ready to support the next generation of missions. Every challenge is an opportunity to improve, and this is no exception.”

The Deep Space Network continues to provide full coverage for more than 40 missions despite the DSS‑14 incident. The network’s 13 other antennas, located at complexes in California, Australia, and Spain, are supporting all tracking needs without interruption. A dedicated scheduling team allocates antenna time across the network to meet each mission’s science and data‑return objectives. The team also maintains continuous coverage when an antenna goes offline for maintenance or an unexpected outage.

To view the report, which includes redactions to protect proprietary and privacy-sensitive material, visit:

https://www.nasa.gov/wp-content/uploads/2026/06/dss14-mishap-investigation-board-report-signed-final-redacted-hm-tagged-508.pdf?emrc=74c749

  •  

First Steps: America’s Grueling Second Spacewalk

Gemini IX-A astronaut Gene Cernan is backdropped by the blackness of space during America’s second spacewalk on June 5, 1966. His umbilical drifts across the foreground, partially obscuring the view of the astronaut.
A year after America’s first spacewalk, Gemini IX-A Eugene Cernan stepped outside his spacecraft for an ambitious extravehicular activity scheduled for 167 minutes. The challenges he faced led NASA to reevaluate plans, equipment, and training for future spacewalks.
NASA

One year after Gemini IV astronaut Edward H. White completed NASA’s first spacewalk the agency prepared for a demanding second excursion. Originally scheduled for Gemini VIII, the extravehicular activity (EVA) was reassigned to Gemini IX-A after that mission ended early, with Gene Cernan taking on the task.

On June 5, 1966—the mission’s third day—Cernan exited the spacecraft and quickly found himself fighting his own equipment. His spacesuit was so rigid that even simple movements required intense effort. He struggled to complete the simplest maneuvers.

Within minutes, Cernan was exhausted and sweating profusely. His spacesuit was cooled only through the circulation of oxygen and as he worked to complete the goals of the EVA, his helmet fogged over completely, obstructing his view and his heart rate rose to about 180 beats per minute. As concerns grew that he might lose consciousness, the EVA was called off and Cernan’s spacewalk ended after two hours and eight minutes.

When Gemini IX-A returned to Earth, doctors found that Cernan had lost 13 pounds during the three-day mission, most of it water lost during his EVA.

The challenges Cernan faced that day reshaped NASA’s approach to spacewalking. His experience directly influenced improved training methods, refined EVA procedures, and precipitated advances in spacesuit design—key steps in preparing astronauts for lunar surface missions just a few years later.

Credit: NASA

  •  

Fighting Fire With Fire

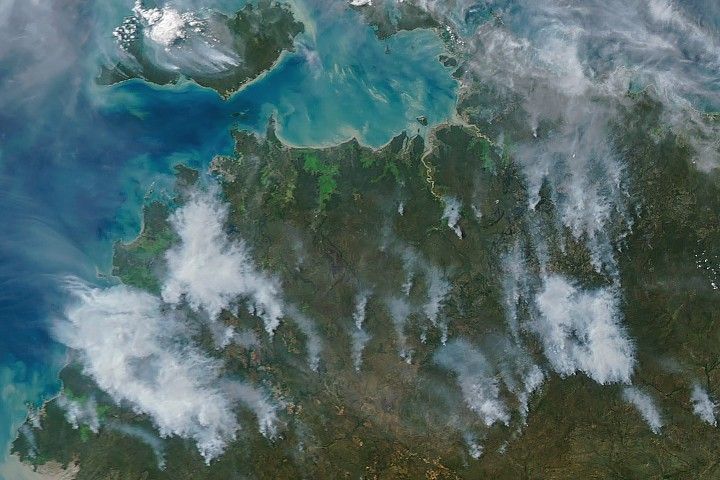
Several gray smoke plumes are visible drifting over a green landscape.
Smoke streams from fires in Australia’s Northern Territory in an image captured by the MODIS (Moderate Resolution Imaging Spectroradiometer) on NASA’s Aqua satellite on May 28, 2026.
NASA Earth Observatory/Michala Garrison

In May and June of most years, NASA satellites typically begin to detect large numbers of wildland fires throughout the Top End and Arnhem Land regions of Australia’s Northern Territory. On some days, especially in the afternoon, the blazes can resemble sizable wildfires in satellite imagery, spreading widely and producing expansive smoke plumes.

That was the case when NASA’s Aqua satellite acquired this image of smoke and fires on the afternoon of May 28, 2026. Often, however, fires burning in this area look smaller and less imposing. In the mornings just a few days earlier and later, for instance, NASA satellites detected little smoke despite observing many thermal anomalies, or hotspots, that indicated fire activity.

The pattern of burning, location, and timing are consistent with prescribed fires lit intentionally to manage the landscape. Land managers tend to light fires in the morning, and smoke builds over the course of the day. The process sometimes creates sizable plumes when there are updrafts and winds of moderate strength that carry smoke away from the fires, as happened on May 28 and again on June 2. The fires typically burn through the fire-adapted grasses, underbrush, and scattered trees in the region’s tropical savanna ecosystems.

Over the past few decades, the region’s land managers have combined deep-rooted Indigenous land management practices and modern technologies to establish large-scale landscape management programs such as the West Arnhem Land Fire Abatement project and Arnhem Land Fire Abatement. The goal of such efforts is to intentionally burn some of the savanna underbrush to create firebreaks and reduce fuel loads early in the dry season, reducing more destructive and emissions-intensive fires later in the season. The dry season generally begins in May and extends through September, according to Australia’s Bureau of Meteorology.

While research is ongoing, there are signs that the prescribed burning efforts are having the intended effect. Analysis of satellite observations of the fires suggests that prescribed burning efforts have shifted fire activity from late to early in the dry season, leading to a reduction in high-intensity fires and emissions.

NASA Earth Observatory image by Michala Garrison, using MODIS data from NASA EOSDIS LANCE and GIBS/Worldview. Story by Adam Voiland.

Downloads

Several gray smoke plumes are visible drifting over a green landscape.

May 28, 2026

JPEG (1.82 MB)

References & Resources

You may also be interested in:

Stay up-to-date with the latest content from NASA as we explore the universe and discover more about our home planet.

Fires Tear Through Nebraska Grasslands

3 min read

Dry, warm, and windy conditions across the U.S. Great Plains led to extreme fire activity in March 2026.

Article

Fires Rage in Georgia

3 min read

Firefighters are battling two destructive blazes in the southern part of the state as drought grips the U.S. Southeast.

Article

Fire’s Footprint on Santa Rosa Island

3 min read

A wildland fire charred grassland, coastal sage scrub, and chaparral across one-third of the island, the second largest of the…

Article
  •  

NASA Hosts 2026 Review on Advanced Composite Manufacturing

2 min read

Preparations for Next Moonwalk Simulations Underway (and Underwater)

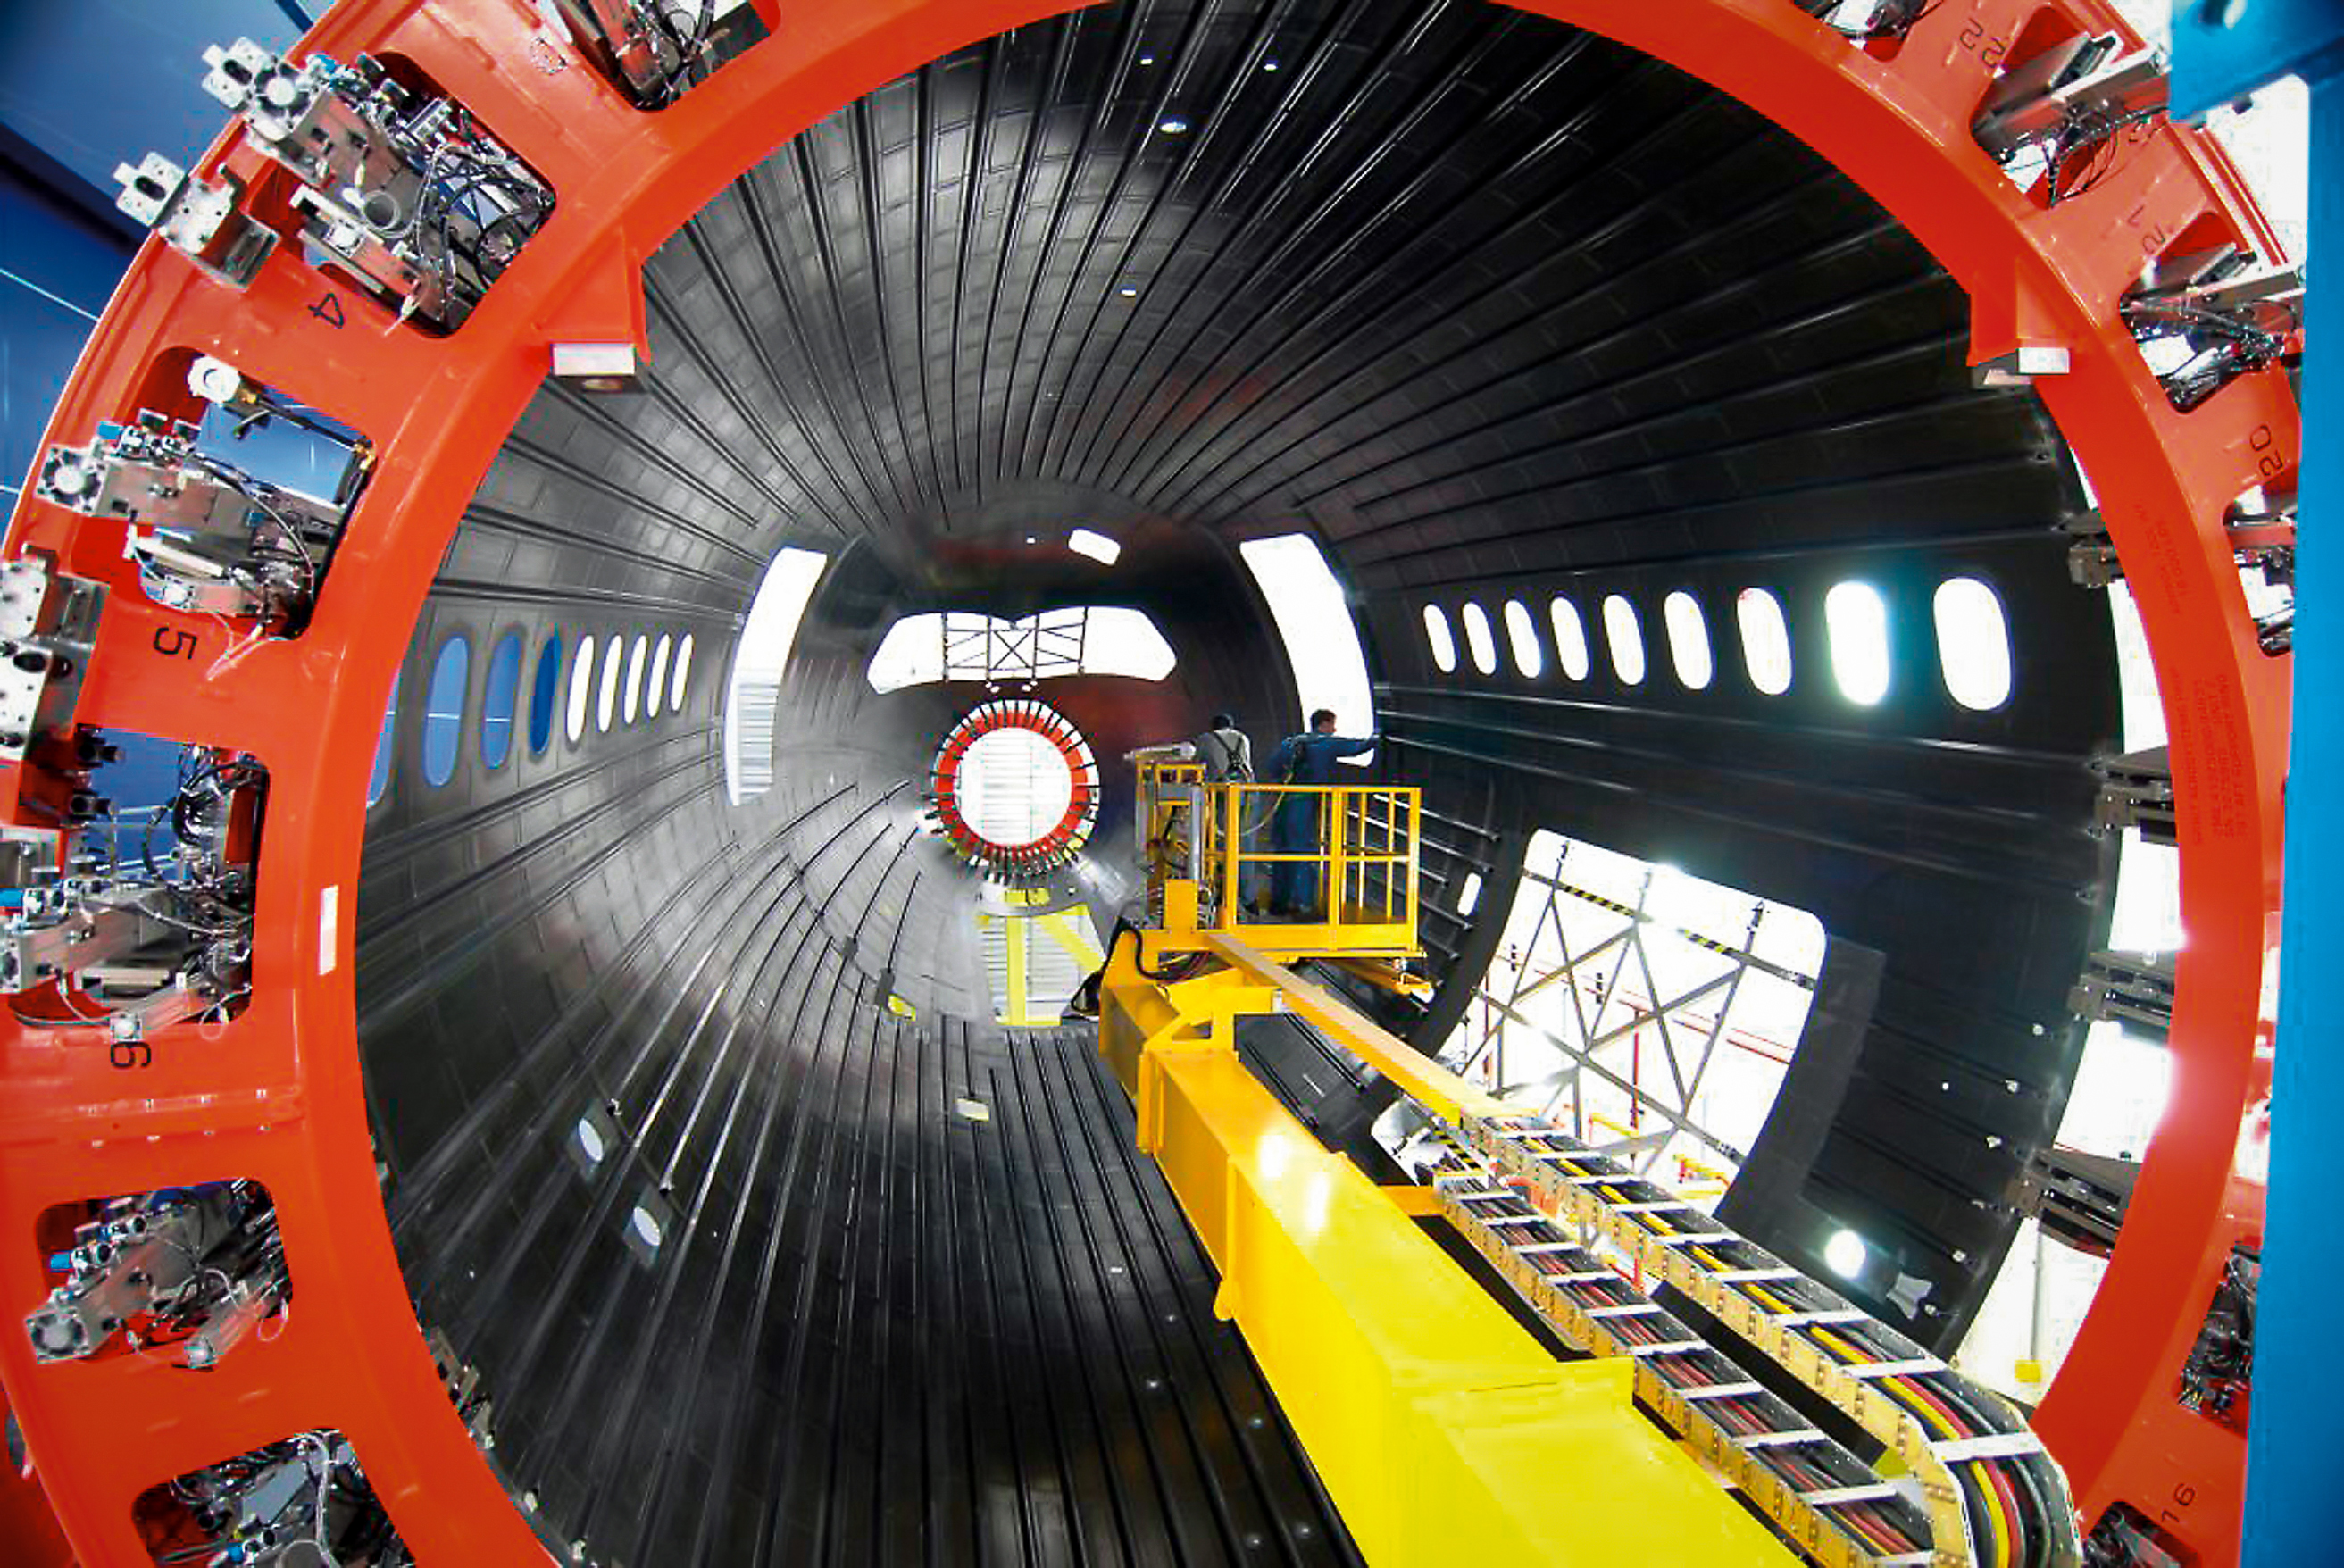
Large aircraft fuselage section under assembly inside a manufacturing facility as part of composite aircraft production work.
Boeing assembles a composite aircraft fuselage section in one of its production facilities. Composite materials are used in major portions of modern aircraft, including sections of the fuselage and wings on aircraft such as the Boeing 787. NASA’s HiCAM project aims to help accelerate manufacturing processes for future composite aircraft.
Boeing

NASA’s Hi-Rate Composite Aircraft Manufacturing (HiCAM) project brought together its full team of Advanced Composites Consortium partners for a 2026 spring review at NASA’s Langley Research Center in Hampton, Virginia.  

The meeting took place May 5-7, bringing together about 150 people from the consortium, a 22-member public-private partnership.  

The review gave NASA and industry partners a chance to look at recent progress and plan for the work ahead. NASA announced recent portfolio decisions, selecting technologies that can have the greatest impact on manufacturing rate for the next airplane program.   

During the meeting, teams reviewed the latest results from the project’s Development Phase and discussed early progress under Phase 2, known as the Demonstration Phase. This phase will scale up key manufacturing technologies in the coming years.  

A major part of the event included full-day workshops focused on assembly demonstrations of two large aircraft structures: the wing and fuselage. These sessions brought together NASA researchers, industry engineers, and partners to share updates, exchange ideas, and discuss long-term plans. Many teams said they noticed stronger collaboration and coordination across the group this year.  

That collaboration supports HiCAM’s goal of large-scale manufacturing demonstrations of a composite fuselage barrel and wing box in 2028 and 2029. These demonstrations represent major project milestones and will help show how advanced composite materials and processes could support faster, lower cost aircraft production.  

NASA and its partners continue to make steady progress toward the project’s goals. The project’s work could help pave the way for new manufacturing methods for lightweight composite structures that make future aircraft easier to build and more efficient to operate. 

Kimiko Booker
NASA Langley Research Center

Share

Details

Last Updated
Jun 04, 2026
  •  

NASA-Funded Study Shows Wildfire Smoke’s Hidden Ozone Toll

5 Min Read

NASA-Funded Study Shows Wildfire Smoke’s Hidden Ozone Toll

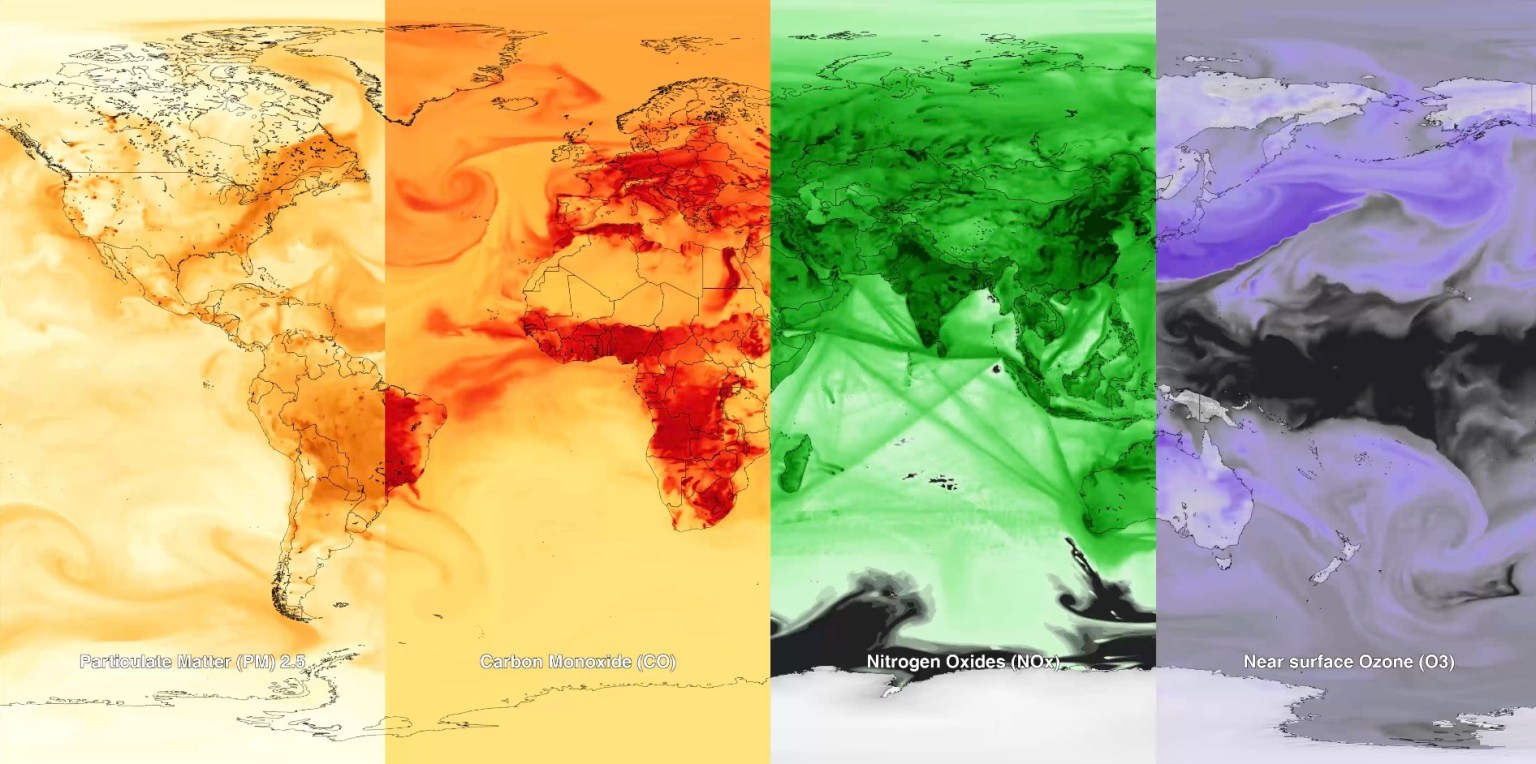
Canadian wildfire smoke carried carbon monoxide — a building block of ground-level ozone — thousands of miles downwind in June 2023.
Credits:
NASA’s Goddard Space Flight Center

Wildfire smoke is stoking a new challenge for cleaner air. A NASA-supported study published Thursday found that, over the last decade, wildfires have worsened ground-level ozone pollution across much of the contiguous United States, creating unhealthy air far from active flames.

Wildfires have become an increasingly important contributor to ground-level ozone, or smog, across much of the United States, researchers report June 4 in the journal Science. Nationally, fires offset nearly four years’ worth of ozone-control gains, with larger setbacks in the West and Midwest.

Smoke often is associated with the soot, ash, and other fine particles that make the air look hazy. But wildfires also emit gases such as carbon monoxide, which can help form surface ozone in sunlight when other pollutants are present. Surface ozone is an invisible pollutant harmful to human health, plants, and crops. As smoke plumes travel and mix with other pollution, those reactions can drive ozone increases hundreds or even thousands of miles from active fires.

“NASA Earth observations, along with ground monitoring networks, help reveal air quality risks from wildfires that can cross state lines, giving air quality managers better decision-making information as wildfire smoke affects more communities,” said John Haynes, manager of NASA Earth Action’s Health and Air Quality program at the agency’s Headquarters in Washington. “This is a strong example of NASA science serving communities here in the U.S.”

Building a clearer ozone picture

High in the atmosphere, ozone shields Earth from harmful ultraviolet radiation. Near the ground, however, ozone can irritate lungs, worsen asthma and other respiratory diseases, and increase health risks for children, older adults, outdoor workers, and people with existing health conditions.

To track surface ozone changes, researchers turned to deep learning, a form of artificial intelligence that finds patterns across large datasets. They used it to build a first-of-its-kind dataset estimating daily surface ozone from 2003 to 2024 on a kilometer-by-kilometer grid — about 0.6 miles on each side — across the contiguous U.S. The work received support from NASA’s Health and Air Quality program and other NASA grants.

The scientists combined data from about 1,000 ground-based air quality stations with atmospheric model data, weather information, wildfire pollution data, and satellite-derived information, including products from the Visible Infrared Imaging Radiometer Suite (VIIRS) and the Moderate Resolution Imaging Spectroradiometer (MODIS) instruments.

Smoke from Canada’s 2023 wildfires spread across North America. Tan to deep red colors show smoke intensity, estimated from black carbon in NASA’s GEOS-FP model.
NASA’s Scientific Visualization Studio (SVS) and NASA’s Global Modeling Assimilation Office (GMAO)

Their analysis revealed two distinct periods. From 2003 to 2015, U.S. ground-level ozone generally declined as emissions of ozone-forming pollutants decreased. After 2015, however, those gains slowed or reversed in many places. By comparing estimated ozone levels with scenarios that removed wildfire influence, the researchers found that pollution from wildfires was a main factor in that shift.

Without the wildfire contribution, ground-level ozone in the Midwest, for example, would likely have continued to decline. Instead, wildfires erased about 5.3 years’ worth of ozone-control progress since 2015.

“People in the Midwest may think fires burning far away will not affect them,” said the study’s corresponding author Jun Wang, an atmospheric scientist at the University of Iowa in Iowa City. “But once wildfire pollution is in the air, it can move across regions. Pollution from one place can affect air quality in another.”

Measuring the health toll

The study also found that wildfire-driven ozone increased exposure to unhealthy air and likely contributed to premature deaths. Premature deaths associated with long-term wildfire-related ozone exposure in the U.S. increased by an estimated 318 deaths per year after 2013, with the post-2013 average 46% higher than in the previous decade. The researchers calculated premature deaths using average lifespan, ozone exposure estimates, and population density.

The 2023 Canadian wildfires showed how widely those risks can spread, with smoke-driven ozone increases stretching across the Midwest and into parts of the Northeast and South. Overall, from 2022 to 2024, wildfires exposed an additional 43 million people in the U.S. to conditions that did not meet current federal air quality standards for ozone, the researchers estimated.

Capturing that national picture is difficult from ground monitors alone. Ground monitors remain the backbone of U.S. air quality tracking, but they do not cover every community. NASA’s scientifically validated satellite observations and models help researchers and agencies see air quality patterns across states, regions, and fire seasons.

That broader air quality work includes newer missions such as TEMPO (Tropospheric Emissions: Monitoring of Pollution). Launched in 2023, TEMPO is NASA’s first mission to use a space-based spectrometer to provide hourly daytime measurements of air quality over North America. Its view is sharp enough to distinguish pollution patterns, including surface ozone, across areas only a few square miles wide, a major improvement over earlier satellites.

Together, these capabilities help researchers and agencies see smoke-related ozone patterns that might otherwise be harder to detect, especially in rural and remote areas.

The work also points toward a practical use of NASA science during fire season. Wang’s team has used NASA support to develop FireAQ, a decision-support system that brings satellite observations, model forecasts, and fire and aerosol products into weekly briefings with state and local air quality officials. The goal is to help officials see where smoke-related pollution may move next and give communities better information.

About the Author

Emily DeMarco

Emily DeMarco

Writer/Editor (IV), Earth Science Division

Share

Details

Last Updated
Jun 05, 2026
Contact
Emily DeMarco
Location
Goddard Space Flight Center
  •  

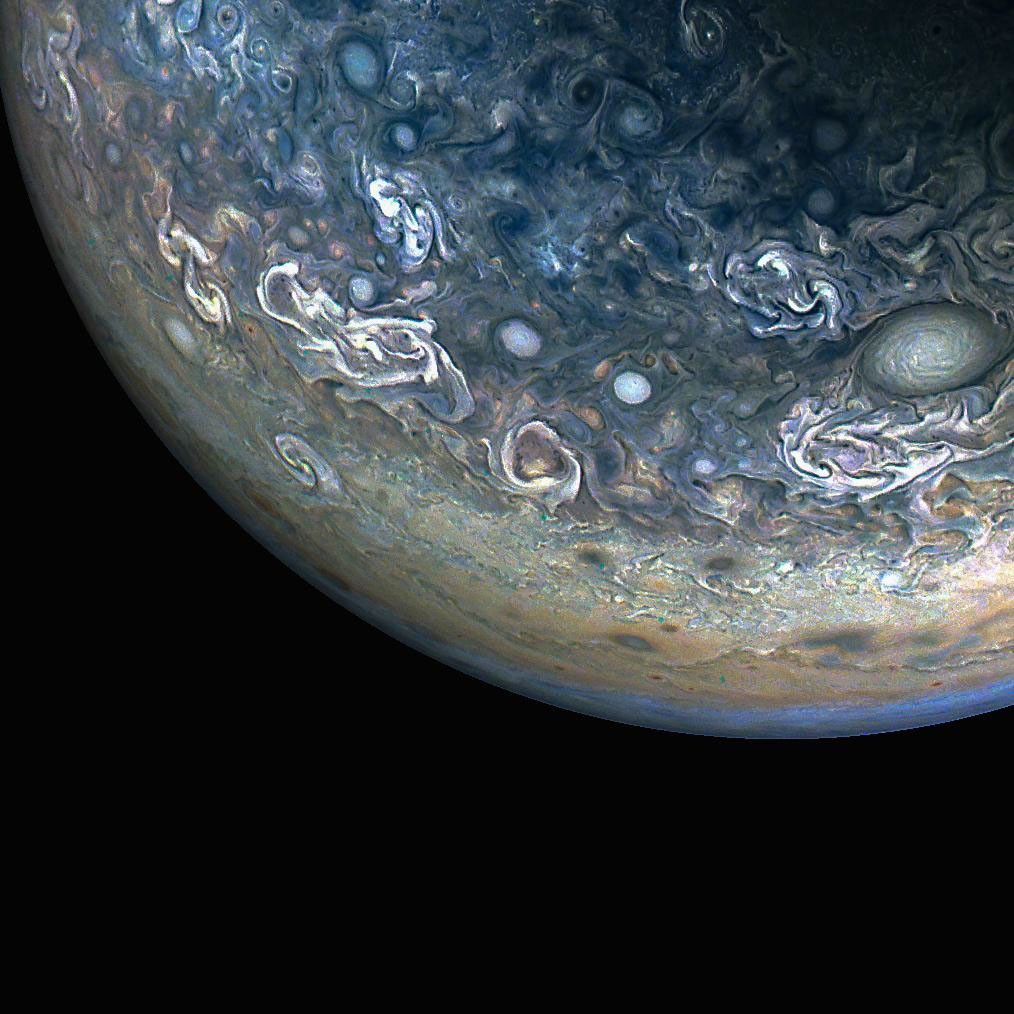
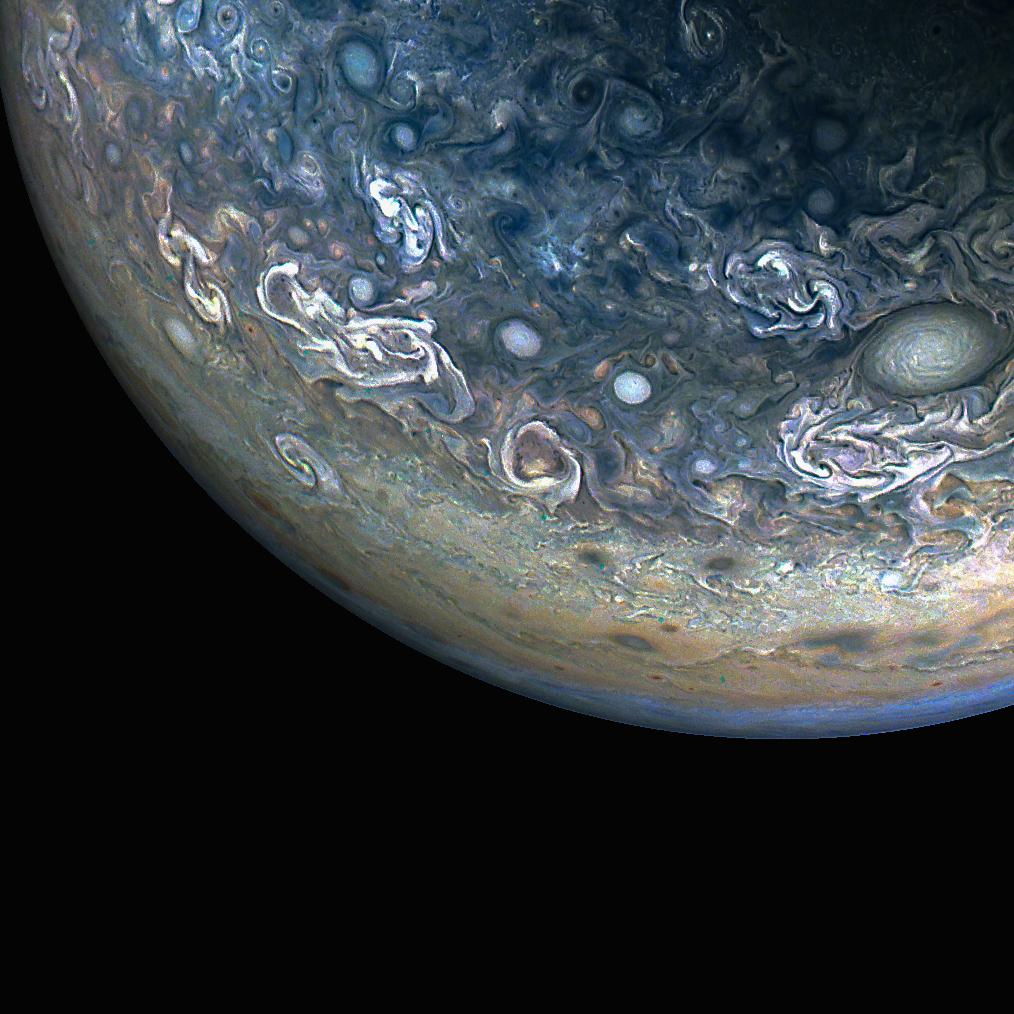
Colorful, Chaotic Jupiter

Three quarters of Jupiter can be seen in this photo; the darkness of space covers the bottom of the image. Green and blue swirls cover the planet's surface.
NASA/JPL-Caltech/SwRI/MSSS; Image processing by Gary Eason © CC BY

NASA’s Juno spacecraft captured this color-enhanced view of Jupiter’s northern hemisphere during its 61st close flyby of the giant planet on May 12, 2024.

Citizen scientist Gary Eason made this image using raw data from the JunoCam instrument, applying digital processing techniques to enhance color and clarity. It provides a detailed view of chaotic clouds and cyclonic storms in an area known to scientists as a folded filamentary region. In these regions, the zonal jets that create the familiar banded patterns in Jupiter’s clouds break down, leading to turbulent patterns and cloud structures that rapidly evolve over the course of only a few days.

Learn more about opportunities to do NASA science with citizen science projects.

Image credit: NASA/JPL-Caltech/SwRI/MSSS; Image processing by Gary Eason © CC BY

  •  

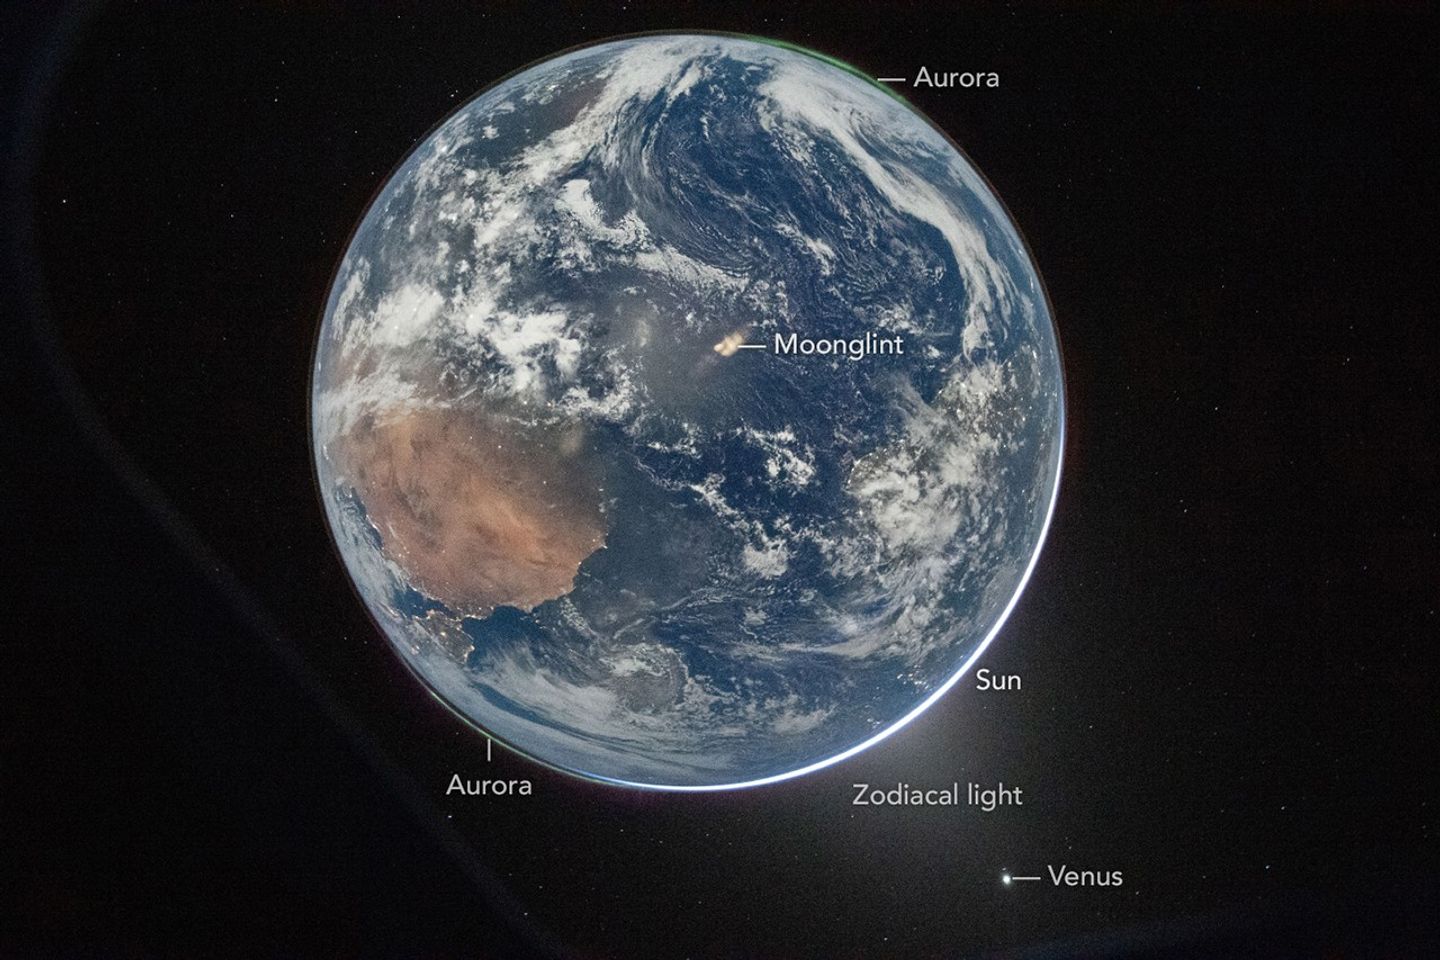
A Moonlit Earth as Seen From Artemis II

Earth’s full disk is seen through the window of a spacecraft. The glow of aurora, a sliver of the Sun, and fuzzy zodiacal light surround the planet, and city lights are visible on the continents.
April 2, 2026

One of the first images transmitted back to Earth from the Artemis II mission was a stunner. In a single image, Earth’s full disk appears amid celestial phenomena that illustrate its place in the solar system. And although the visible hemisphere appears to be awash in sunlight, it is actually lit by moonlight. The astronauts’ vantage point provided a rare opportunity to capture nighttime features—most notably lights from human habitation—from a new perspective.

An Artemis crew member captured the photo from the Orion spacecraft after it completed the translunar injection burn, which sent the spacecraft out of Earth orbit and on a trajectory toward the Moon. In the photo, Earth eclipses the Sun from Orion’s perspective, leaving only a small sliver of its bright light visible around the bottom right edge. Green auroras, caused by charged particles from the Sun interacting with Earth’s upper atmosphere, glow around the north and south poles (lower left and upper right, respectively).

The Sun’s light also produces the fuzzy glow, known as zodiacal light, that appears to the lower right of Earth. This phenomenon comes from sunlight reflecting off interplanetary dust. Skywatchers on Earth may see it at certain times of year around dawn or dusk as a faint column of light extending up from the horizon. Data collected by NASA’s Juno spacecraft on its journey to Jupiter suggest that Mars may be a significant source of the dust particles that produce zodiacal light. Earth’s other planetary neighbor, Venus, appears as the bright object in the bottom right of the image.

Earth’s full disk is seen through the window of a spacecraft. Various features are labeled. The glow of aurora, a sliver of the Sun, and fuzzy zodiacal light surround the planet, and city lights are visible on the continents.
April 2, 2026

On Earth itself, city lights are evidence of human activity. Bright areas appear in Spain, Portugal, and northern Africa (lower left), sub-Saharan Africa (center left), and Brazil (center right). Digital camera technology—with help from the illumination of a full Moon—made it possible to see these and other details of Earth’s surface and atmosphere in low light. The crew set the camera’s ISO to 51,200 to make it highly sensitive to light. For comparison, an ISO setting of 100 or 200 is common for daytime photography.

Previous nighttime views of Earth taken from spacecraft may look very different from this photo but have also inspired and enlightened. For instance, the Apollo 12 crew photographed Earth eclipsing the Sun in 1969; astronaut Alan Bean would go on to depict his impressions of the event in paintings.

More recently, astronauts aboard the International Space Station have photographed the planet at night from low Earth orbit, while NASA’s Black Marble nighttime lights product suite uses satellite observations to produce science-quality records of nighttime lights at daily, monthly, and yearly time scales. Those programs provide sustained data records, while the Artemis II photo is distinctive as a single human-captured full-disk view showing many low-light features at once.
Cindy Evans, senior exploration scientist in the Astromaterials Research and Exploration Science Division at NASA’s Johnson Space Center, was working in the Science Evaluation Room during the Artemis II mission and was one of the first people on Earth to see the image. Evans was struck both by its beauty and the perspective revealed by all the visible solar system features. “I love the image so much because it was taken with Earth in moonshine, and shows Earth as a solar system body, a dynamic planet interacting with the solar wind, and a place harboring life,” she said.

The image is scientifically valuable, as well, said Miguel Román, Deputy Director for Atmospheres and Data Systems at NASA’s Goddard Space Flight Center. “It speaks powerfully to the breadth of what NASA does across science and human exploration,” he said. Román studies artificial light at night, as viewed from space, as a measurable signal of human activity.

“[This photo] reminds us that Earth at night is visually compelling, physically complex, and scientifically underexplored,” Román said. “I see this image as a glimpse of what Earth science can become in the future.”

NASA images prepared for Earth Observatory by Lauren Dauphin. Story by Lindsey Doermann.

References & Resources

You may also be interested in:

Stay up-to-date with the latest content from NASA as we explore the universe and discover more about our home planet.
Great Balls of Fire

4 min read

An astronaut on the International Space Station was surprised to photograph a shower of light streaking through the darkness while…

Article

Earthset From the Lunar Far Side

2 min read

The crew of NASA’s Artemis II mission captured extraordinary images of our home planet during their journey around the far…

Article

Shades of a Lunar Eclipse

3 min read

A series of nighttime satellite images revealed how moonlight reaching Earth varied throughout a total lunar eclipse.

Article
  •  
❌