Il 19 gennaio 2024, il lander giapponese SLIM — soprannominato “Moon Sniper” per la precisione del suo sistema di atterraggio — toccava la superficie lunare diventando il quinto veicolo spaziale nella storia a completare un allunaggio morbido. Quasi subito, però, qualcosa andò storto: i pannelli solari si trovarono orientati nella direzione sbagliata rispetto al sole, […]
The spy law known as Section 702, which authorizes the NSA and FBI's warrantless surveillance, will all but certainly expire on Friday for the first time.
Et si une simple tasse de thé contribuait à vieillir en meilleure santé ? Selon une nouvelle revue scientifique, cette boisson pourrait aider à protéger le cœur, le cerveau et même les muscles. À condition toutefois de choisir le bon type de thé et d'éviter certains produits qui pourraient en...
O novo Mobi Fold, o primeiro rato dobrável da Logitech, acaba de chegar ao mercado. Juntamente com esta solução, que se desliga automaticamente quando dobrado, chega-nos o Spotlight 2, um controlador de apresentações que vai além dos slides com um sistema háptico inédito nesta categoria.
C’est sans aucun doute l’événement sportif le plus attendu dans le monde cette année : la Coupe du monde de football 2026. Elle réunira plus d'un milliard de personnes, derrière leurs écrans, ou bien sur place dans les différentes stades. Mais cette Coupe, qui avait été annoncée comme la plus...
A Legion Go Gen 2 é a evolução natural da portátil de gaming da Lenovo, melhorando o ecrã e atualizando o hardware, mas essas melhorias refletem-se no peso (na carteira e nas mãos).
A multi-institutional team of researchers led by University of Connecticut Professor Zhe Zhu has developed a method for measuring the dynamic, real-time activity of urban environments from space, which they are calling an “Urban Pulse.”
The research team behind the novel urban activity metric said that monitoring a city’s Urban Pulse could help mitigate uncontrolled urban sprawl or decay and enable environmentalists and urban planners to intervene before disasters become unavoidable.
Measuring an Urban Pulse Could Reveal Neighborhoods ‘Not Doing Well”
Although environmentalists and urban planners have a wide range of tools to measure the activities within a city, Zhu notes that scientists have spent decades merely capturing the “outcome of urbanization,” such as a finished road or a newly completed home. However, the researcher and lead author of a study detailing the Urban Pulse methodology added that, even with all the current tools, “you don’t really see the dynamics within an urban area.”
According to a statement detailing the new approach, a city’s pulse is determined by all construction activity within it. Along with new construction, the metric includes repairs, infrastructure improvements, or expansion into previously undeveloped green spaces. When used correctly, the researchers said that it can help determine “if and where their city is not doing well.”
“This would allow (authorities) to be proactive rather than conducting a metaphorical autopsy after the decay of an area is evident,” the team explained.
Bridging the Gap Between Abstract Urban Theories and Measurable, Real-World Data
To test their approach, the team evaluated the Urban Pulse of six cities: Seattle, Shenzhen, Lagos, Mumbai, Dubai, and Mexico City. This involved a deep examination of what the team termed “decades of dense time-series data” collected by NASA’s Harmonized Landsat and Sentinel-2 (HLS) satellites for physical transformations in an urban environment, such as new construction, measurable infrastructure improvements, and demolition.
Instead of analyzing each city’s changes manually, the team evaluated the above changes on what they called “the neighborhood level” using a deep-learning and time-series-analysis approach called CAPES, developed by former UConn postdoctoral researcher Ji Won Suh. The team said that, by observing these “high-frequency rhythms of development” from a broad ‘outer space’ perspective, their approach “bridges the gap between abstract urban theories and measurable, real-world data.”
This figure visualizes Dubai’s rapid expansion as a glowing “urban pulse.” Mapping monthly construction data from the city’s top 65 most active locations, the ridge plot reveals how distinct neighborhoods grow through spiky, cyclical, and asynchronous bursts. Rather than a steady wave, urbanization unfolds as dynamic, localized heartbeats, exposing the complex rhythms driving a modern metropolis. Image Credit: Zhe Zhu/GERS Lab.
After examining CAPES’ results, the team found several key markers within the Urban Pulse. For example, the view from space revealed that growth within cities is not smooth and steady. Instead, Zhu and colleagues said that development happens in “abrupt, intense, and episodic bursts of construction.”
CAPES also revealed that the rhythms of an urban environment are cyclical. For example, while a city may show relatively steady growth on a broader level, individual neighborhoods go through “dramatic boom-and-rest cycles” of expansion and dormancy that don’t appear to follow predictable annual seasons.
The third pattern revealed by measuring the six cities’ Urban Pulse from space was that cities are “asynchronous,” meaning a single city does not ‘beat’ in unison. The team noted that neighborhoods “pulse at completely different times.” When it functions properly, this “uncoordinated rhythm” helps prevent the city’s infrastructure and labor markets from “overheating.”
Unlike previous methods for tracking a city’s evolution, the team noted that their Urban Pulse approach can help researchers “visualize a city’s reaction to global shocks.” For example, the team said that their analysis captured “the exact moment the COVID-19 pandemic triggered a widespread, synchronized ‘cardiac arrest’ in urban development worldwide.”
However, their new tool also revealed what the researchers termed “profound inequalities” in how individual cities recovered from the dramatic halt to urban growth. For example, the team said that the Urban Pulse of Shenzhen revealed synchronized ‘dips’ in activity, followed almost immediately by “rapid, policy-driven rebounds.” However, the same Orban Pulse analysis showed that the reactions in Mumbai and Mexico City were much more “muted.”
“It’s like in human beings,” Zhu explained. “When you get a disease, it’s not going to show up exactly the same in different people.”
A ‘Very Impactful Tool’ for Navigating Cities
Although the Urban Pulse metric offers a tantalizing tool for academics, the team noted real-world benefits for global policymakers, urban planners, and environmentalists, adding that “it serves as an early warning system.”
“By monitoring the rhythm, rate, and amplitude of neighborhood pulses, governments can identify early signs of urban decay or unsustainable sprawl and intervene before crises become entrenched,” they explained.
The team also suggested that making Urban Pulse data publicly available could “revolutionize how everyday people interact with their cities.” For example, an urban family considering a move to a new city or a new part of their current city could track a target neighborhood’s pulse to spot early warning signs of decay or early indicators of positive-trending growth. The same data could help business owners plan new locations or expanded service routes, depending on the business profile and the local Urban Pulse trends.
“This is going to be a very impactful tool influencing not only top-down policy decisions from governments but also bottom-up decisions from everyday people navigating their cities,” Zhu explained.
Christopher Plain is a Science Fiction and Fantasy novelist and Head Science Writer at The Debrief. Follow and connect with him on X, learn about his books at plainfiction.com, or email him directly at christopher@thedebrief.org.
China is expanding the role of its commercial rocket companies by shortlisting four such entities for launches of a new space station cargo transport system.
NASA’s Artemis II Moon Mission Research Continues on Earth
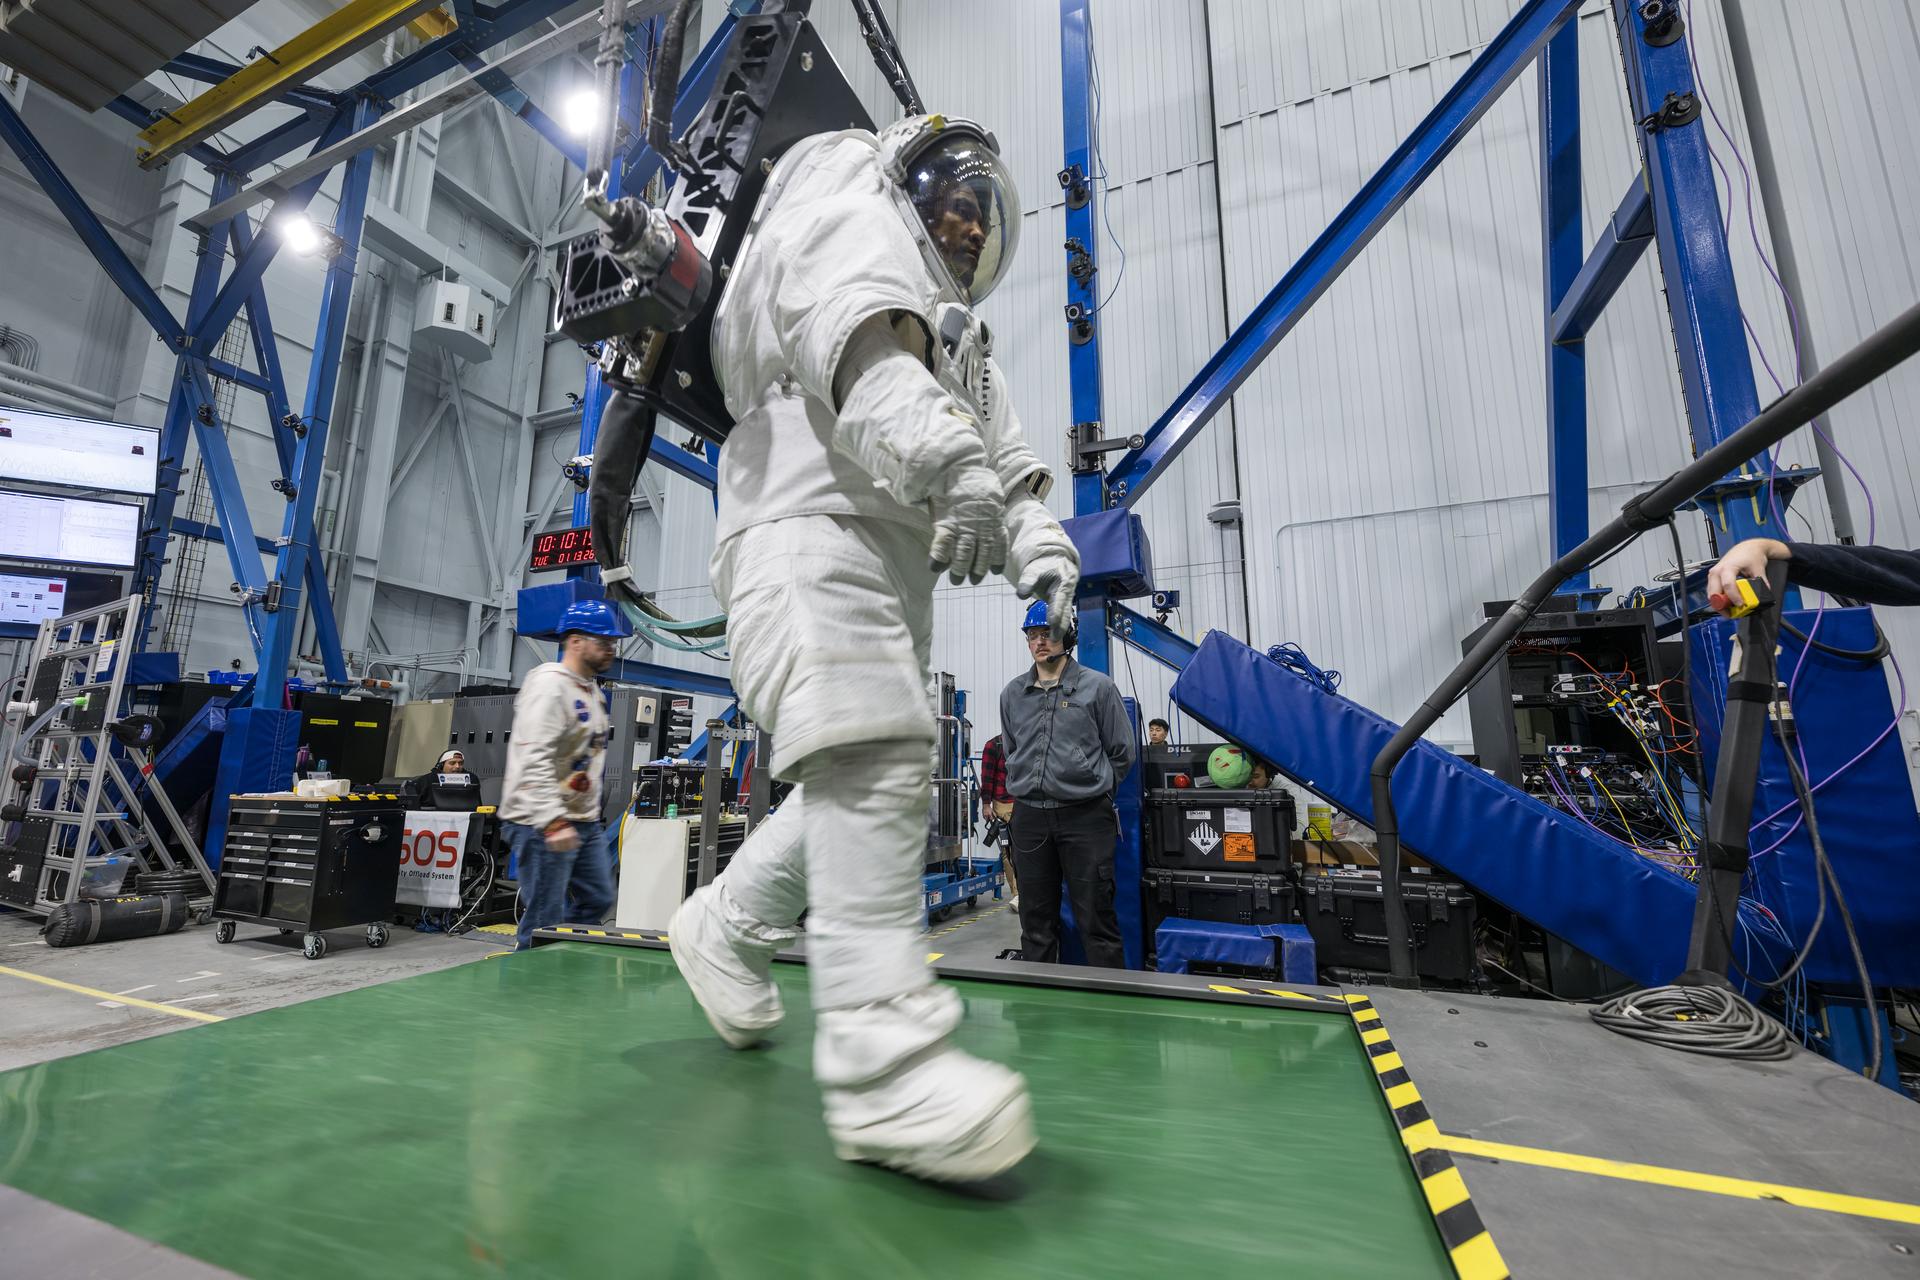
Artemis II astronaut Victor Glover walks on a treadmill while in a space suit harnessed to NASA’s Active Response Gravity Offload System at NASA’s Johnson Space Center. Glover is simulating a walk on a planetary surface while in a suit that has been offloaded to lunar gravity. Artemis II astronauts completed this and other suited tasks before their mission launched and within a few days of landing, giving researchers a chance to assess how quickly upon landing crews’ bodies adapt to a different gravity. Results will help scientists better understand how soon after landing crews can complete mission-critical tasks on the surface of the Moon or Mars.
NASA/Robert Markowitz
Since NASA’s Artemis II crew members safely splashed down in the Pacific Ocean on April 10 after their record-setting mission around the Moon, science teams have been busy collecting more data and combing through observations collected on the test flight. Results from these science investigations will help support safe human exploration of deep space and provide a blueprint for how future missions will conduct science on the lunar surface as NASA builds a Moon Base and develops an enduring human presence there.
Postflight crew health, performance data
In the hours, days, and weeks after landing, the Artemis II crew members, NASA astronauts Reid Wiseman, Victor Glover, Christina Koch, and CSA (Canadian Space Agency) astronaut Jeremy Hansen, contributed critical data to help the agency understand how the human body reacts to spaceflight. Collecting this data as soon as possible after landing was important to understand how the body adapts from microgravity to Earth’s gravity. The data will inform NASA’s understanding of how quickly crews can complete mission-critical tasks after landing on a planetary surface like the Moon or Mars, where there won’t be landing support personnel to assist.
Within a day of splashdown, researchers collected a suite of data for the Artemis II Spaceflight Standard Measures study, which is part of a larger effort across the astronaut corps to gather a baseline set of health measurements on blood pressure, heart rate, eye health, and motor control. Crew members also completed a mini obstacle course, which included lying down, standing up, unfurling a rope ladder, ladder climbing, and more, to assess how their bodies were adapting to Earth’s gravity.
Once the crew returned to NASA’s Johnson Space Center in Houston, researchers guided them through further medical check-ups and tests of motor control. Over the next several days, the crew completed obstacle courses wearing spacesuits offloaded to lunar gravity, which is roughly one-sixth the force of Earth’s gravity. Researchers are now analyzing this data to gain insight into how crews may perform as they adapt to the gravity of a planetary surface.
As part of the Immune Biomarkers study, researchers are comparing blood and saliva samples collected after the Artemis II splashdown with samples collected preflight and during the mission. Among other topics, the study investigates whether and how dormant viruses reawaken in astronauts’ bodies while in space.
Some crew members completed postflight cognition tests and a simulated manual spacecraft docking task to assess motor control for the ARCHeR (Artemis Research for Crew Health & Readiness) study. This, combined with data collected through a wrist-worn device while crew members were in space, is used to understand the effect of space hazards on well-being and performance.
Initial data collections for Artemis II health studies concluded 45 days after splashdown. However, medical teams will continually monitor astronaut health throughout the Artemis II crew members’ lifetimes.
Once this data is processed and anonymized, information will be available for scientists to study the effects of spaceflight via a request to NASA’s Life Sciences Data Archive. The results from this work could lead to new technologies and studies that help predict the adaptability of crews on future missions to the Moon and Mars.
Analyzing astronaut-derived organ chips flown around Moon
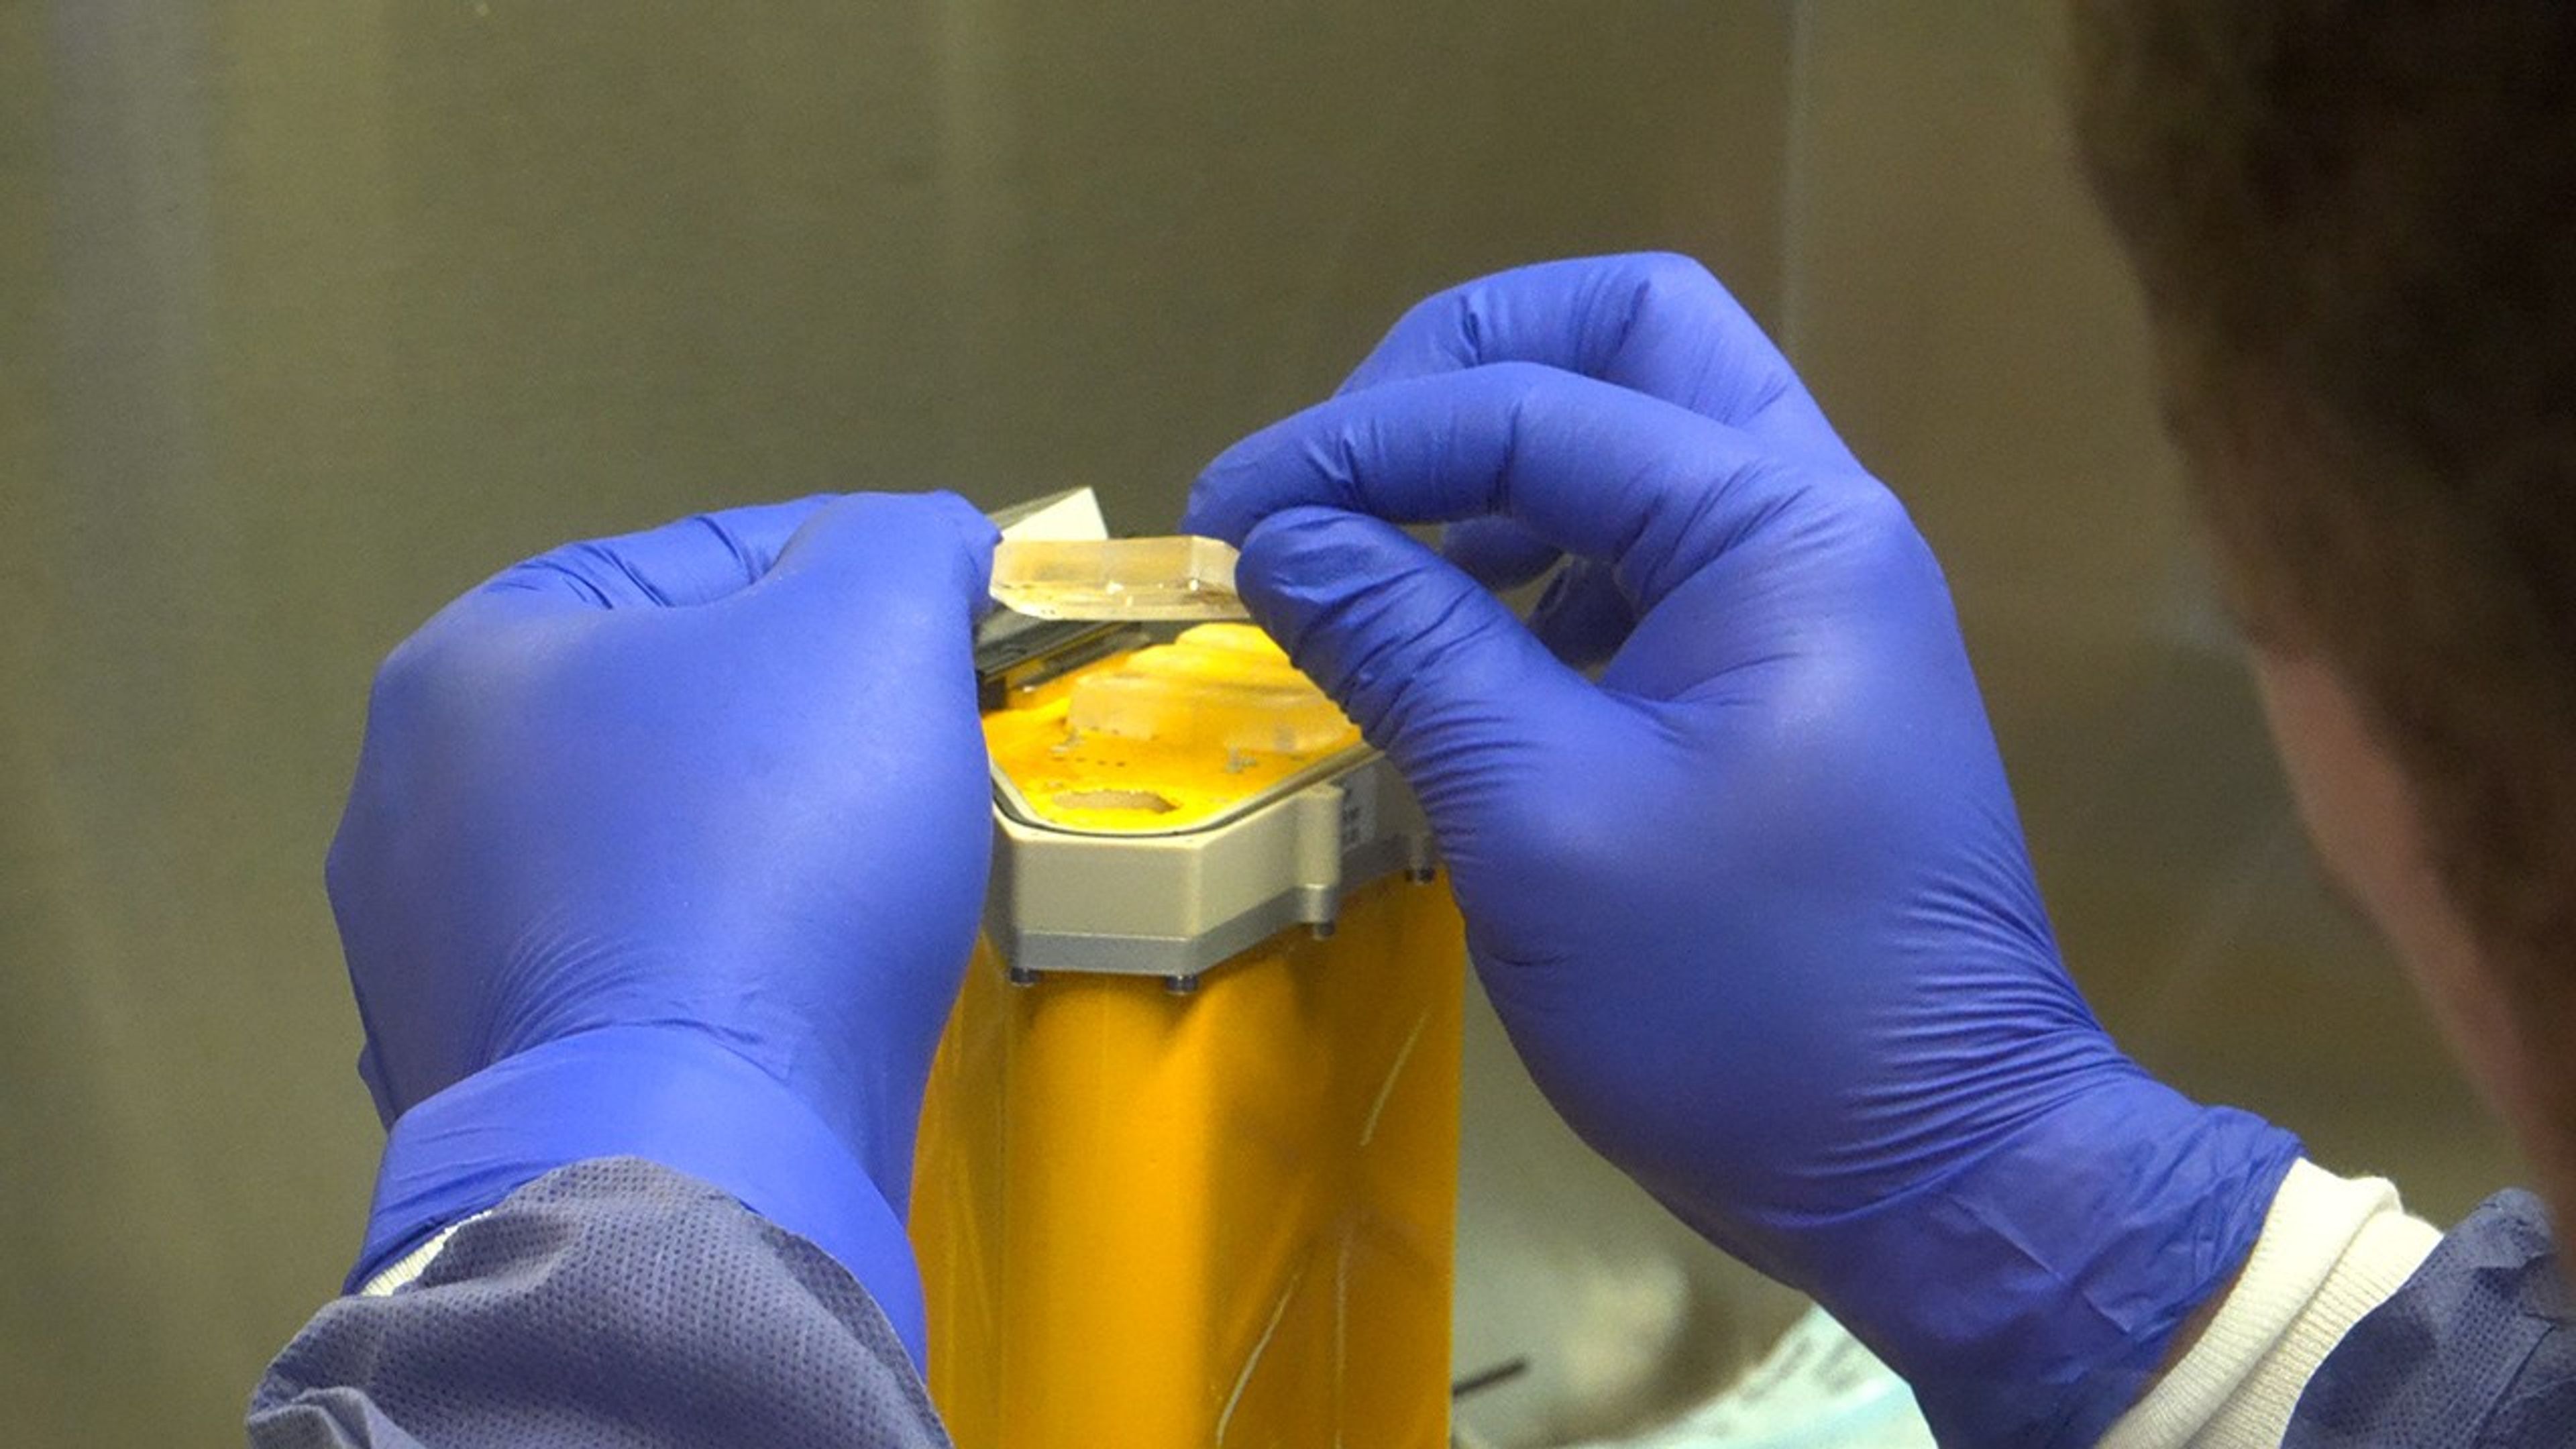
A scientist handles AVATAR organ chips following their journey around the Moon aboard Orion. The chips contain cells from each astronaut and are being prepared for detailed analysis.
NASA
Organ chips from NASA’s AVATAR (A Virtual Astronaut Tissue Analog Response) investigation are being analyzed at chip developer Emulate’s laboratory in Boston. The organ chips included bone marrow cells from each Artemis II astronaut. They flew around the Moon with the astronauts, and now researchers are studying these organ chips to determine how deep space radiation and microgravity affect human health at the molecular level.
Scientists are comparing the chips flown aboard the spacecraft to ground controls and crew blood samples using advanced techniques, including single-cell RNA sequencing. The analysis will characterize how organ chips model individual responses to spaceflight, which is data that could allow NASA to send future astronauts’ AVATAR chips ahead on missions to develop personalized medical kits. The researchers plan to share early findings at scientific conferences while full analysis continues.
Lunar imagery, audio for data release
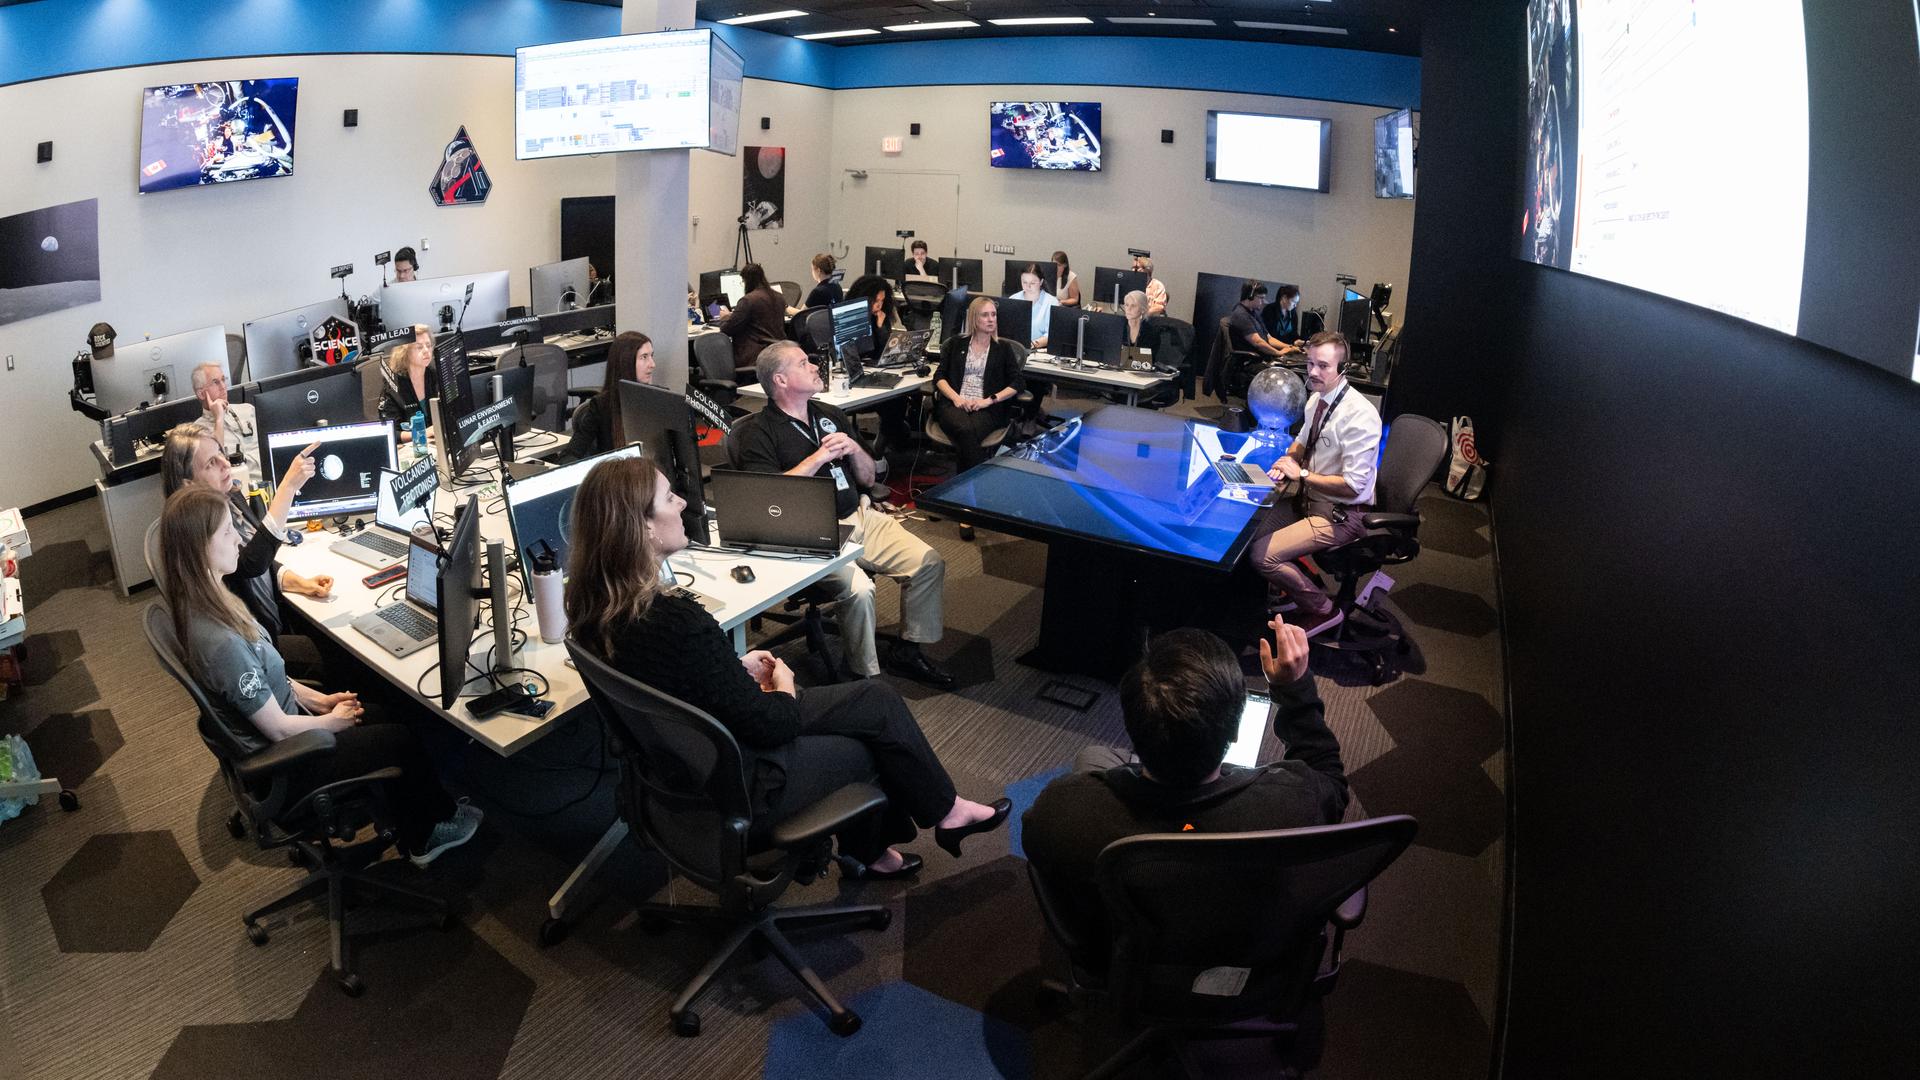
In this April 3, 2026, image, the Artemis II lunar science team is shown working in the Science Evaluation Room in the Mission Control Center at NASA’s Johnson Space Center in Houston. The team is putting together a plan of science observations for the Artemis II crew, which was headed toward the Moon aboard Orion. As they passed the Moon at closest approach on April 6, the crew applied the geology skills they learned in the classroom and in Moon-like environments on Earth as they photographed and described nuances of geologic features such as impact craters, ancient lava flows, and surface cracks and ridges. The crew noted differences in color, brightness, and texture — details that provide clues to surface composition and history.
NASA/Bill Stafford
On April 6, the Artemis II crew members studied features on and around the Moon for nearly seven hours during Orion’s closest approach to the lunar surface. Their work was guided by a minute-by-minute observation plan developed by the Artemis II lunar science team.
Scientists are reviewing the data collected from the mission, which includes images, video, and audio files, to release a report of their initial data interpretations later this year. The report will cover observations of impact flashes, variations in color on the lunar surface, and the shape and texture of faults and ridges. The team also will publish a report on how Artemis II lunar science observations were planned, organized, and executed for the benefit of future Artemis missions.
NASA will publish more than 100 science-related audio recordings with transcripts, as well as approximately 11,500 Earth and Moon image and video files from the mission science campaign, with accompanying data. While many of these images already are public, these records will be available through NASA’s Planetary Data System, a public archive of data from all of NASA’s planetary missions. To get the data ready, the team is converting files into standard formats that anyone can easily open and add information to make the data searchable in NASA’s archive for generations to come.
For more information on NASA’s Artemis II science efforts, visit:
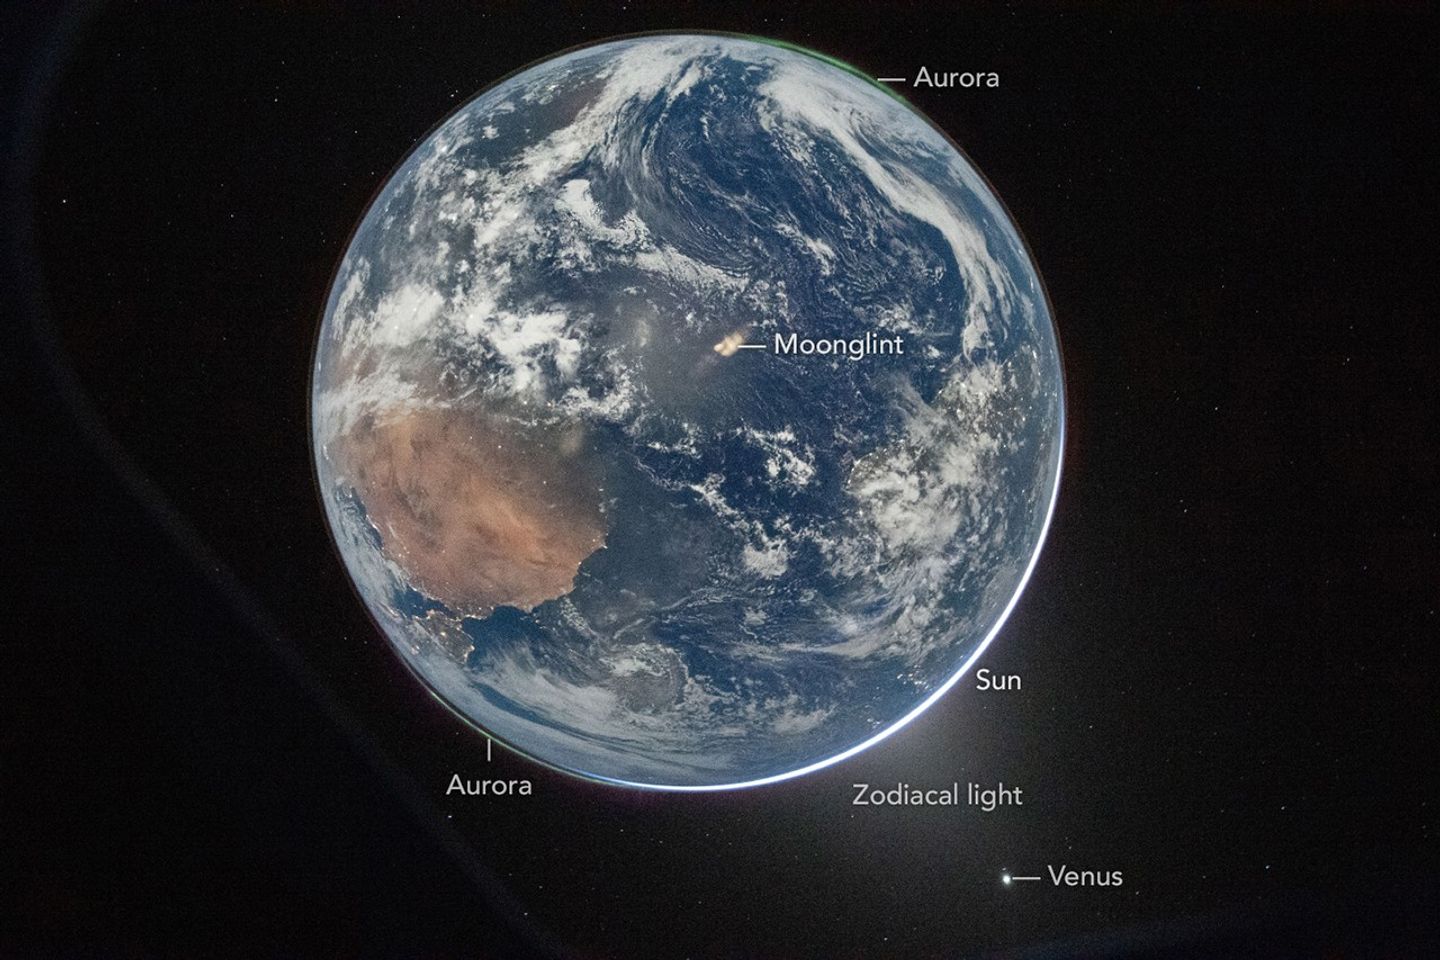
One of the first images transmitted back to Earth from the Artemis II mission was a stunner. In a single image, Earth’s full disk appears amid celestial phenomena that illustrate its place in the solar system. And although the visible hemisphere appears to be awash in sunlight, it is actually lit by moonlight. The astronauts’ vantage point provided a rare opportunity to capture nighttime features—most notably lights from human habitation—from a new perspective.
An Artemis crew member captured the photo from the Orion spacecraft after it completed the translunar injection burn, which sent the spacecraft out of Earth orbit and on a trajectory toward the Moon. In the photo, Earth eclipses the Sun from Orion’s perspective, leaving only a small sliver of its bright light visible around the bottom right edge. Green auroras, caused by charged particles from the Sun interacting with Earth’s upper atmosphere, glow around the north and south poles (lower left and upper right, respectively).
The Sun’s light also produces the fuzzy glow, known as zodiacal light, that appears to the lower right of Earth. This phenomenon comes from sunlight reflecting off interplanetary dust. Skywatchers on Earth may see it at certain times of year around dawn or dusk as a faint column of light extending up from the horizon. Data collected by NASA’s Juno spacecraft on its journey to Jupiter suggest that Mars may be a significant source of the dust particles that produce zodiacal light. Earth’s other planetary neighbor, Venus, appears as the bright object in the bottom right of the image.
April 2, 2026
On Earth itself, city lights are evidence of human activity. Bright areas appear in Spain, Portugal, and northern Africa (lower left), sub-Saharan Africa (center left), and Brazil (center right). Digital camera technology—with help from the illumination of a full Moon—made it possible to see these and other details of Earth’s surface and atmosphere in low light. The crew set the camera’s ISO to 51,200 to make it highly sensitive to light. For comparison, an ISO setting of 100 or 200 is common for daytime photography.
Previous nighttime views of Earth taken from spacecraft may look very different from this photo but have also inspired and enlightened. For instance, the Apollo 12 crew photographed Earth eclipsing the Sun in 1969; astronaut Alan Bean would go on to depict his impressions of the event in paintings.
More recently, astronauts aboard the International Space Station have photographed the planet at night from low Earth orbit, while NASA’s Black Marble nighttime lights product suite uses satellite observations to produce science-quality records of nighttime lights at daily, monthly, and yearly time scales. Those programs provide sustained data records, while the Artemis II photo is distinctive as a single human-captured full-disk view showing many low-light features at once.
Cindy Evans, senior exploration scientist in the Astromaterials Research and Exploration Science Division at NASA’s Johnson Space Center, was working in the Science Evaluation Room during the Artemis II mission and was one of the first people on Earth to see the image. Evans was struck both by its beauty and the perspective revealed by all the visible solar system features. “I love the image so much because it was taken with Earth in moonshine, and shows Earth as a solar system body, a dynamic planet interacting with the solar wind, and a place harboring life,” she said.
The image is scientifically valuable, as well, said Miguel Román, Deputy Director for Atmospheres and Data Systems at NASA’s Goddard Space Flight Center. “It speaks powerfully to the breadth of what NASA does across science and human exploration,” he said. Román studies artificial light at night, as viewed from space, as a measurable signal of human activity.
“[This photo] reminds us that Earth at night is visually compelling, physically complex, and scientifically underexplored,” Román said. “I see this image as a glimpse of what Earth science can become in the future.”
NASA images prepared for Earth Observatory by Lauren Dauphin. Story by Lindsey Doermann.
Os quatro astronautas da missão Crew-12 foram instruídos pela NASA a vestir os fatos espaciais e a refugiarem-se na cápsula Dragon, enquanto cosmonautas russos tentam uma reparação mais extensa no módulo Zvezda.
O Microsoft Build 2026 foi o palco escolhido pela tecnológica para o lançamento de novos modelos de IA próprios para reduzir a dependência da OpenAI, do novo chip quântico Majorana 2 e de uma plataforma de agentes que vai ao "coração" de como as organizações trabalham.
Microsoft's Build developer conference kicked off today, and as with almost everything the company has done in the last few years, Microsoft's opening keynote focused overwhelmingly on AI and other closely related technologies. There's Microsoft Scout, an OpenClaw-based "Autopilot" agent that can hook into Microsoft 365 data to perform tasks for users; several new AI models; an expanded preview of "Codename MDASH," which is a "multi-model agentic scanning system" meant to detect and fix software vulnerabilities.
A few of those announcements stood out to us as particularly interesting, either for esoteric technical reasons or because they seem like they may have some utility for those who aren't spending their every waking moment using generative AI tools. (Microsoft's recent efforts to make its flagship operating system faster, more reliable, more useful, and less annoying didn't really come up, but there have been plenty of other announcements on that front lately.)
On the hardware front, we didn't get any updates for existing Surface devices (not counting yesterday's Surface Laptop Ultra announcement), but we did get something new: the Surface RTX Spark Dev Box is "a compact developer PC" built around Nvidia's new RTX Spark chip with up to 128GB of built-in memory.
The discovery of interstellar object 3I/ATLAS raises speculation about its nature, with some suggesting it could be an alien spacecraft. However, most astronomers believe it is a comet. The question highlights differing belief systems regarding the origins of life, with critics emphasizing the necessity of extraordinary evidence for such claims.
Recent measurements indicate a rise in atmospheric CO2, attributed to human activities by various "experts", despite claims that human contribution is minimal. Research by Dai Ato challenges the established pre-industrial CO2 level of 280 ppm, suggesting it’s underestimated and highlighting flaws in related climate studies, thus questioning current climate change assumptions.

 Login