Près d'un Français sur deux utiliserait déjà l'IA au quotidien et voici les usages qu'ils en font


Across the stories today, a common thread emerges: the growing tension between ambitious climate goals and the messy realities of making change happen on the ground. From Colorado’s largest-ever oil lease sale to federal subsidies flowing toward aging coal plants, the gap between environmental necessity and economic momentum has rarely felt more stark.
The day’s coverage points to growing momentum around innovation, but also the persistent pull of established systems. While virtual power plants gain traction in Massachusetts and Minnesota as states seek clean energy solutions, the federal government simultaneously allocated $700 million to support the struggling coal industry through the Defense Production Act. It’s a reminder that progress and pressure often arrive together, creating policy landscapes that can feel contradictory but reflect the complex economics of energy transition.
Perhaps most telling are the stories of communities caught between these larger forces. In Colorado’s northwestern wilderness, the Bureau of Land Management is opening 156,000 acres of critical wildlife habitat — including migration corridors for the nation’s largest elk herd — to oil and gas drilling. Meanwhile, in the Dominican Republic, 450 families near the Pueblo Viejo gold mine are demanding relocation from what they describe as dangerous pollution, while Canada’s corporate watchdog office remains unstaffed and unable to respond.
These human-scale impacts reveal how environmental challenges increasingly operate across borders and timescales. The Middle East conflict now threatens global food security through fertilizer trade disruptions, while mangrove forests — nature’s carbon guardians for tens of millions of years — face existential pressure from rising seas happening faster than these resilient ecosystems can adapt.
Behind the numbers are real communities adapting in real time. In Nepal’s fertile southern plains, farmer Dhruba Prasai stands guard over his crops every night as wildlife emerges from nearby forests, highlighting the complex relationship between conservation success and agricultural livelihoods. In Norfolk, authorities must consider exhuming a 200-year-old mass grave of sailors as coastal erosion — accelerated by climate change — threatens this historic site.
Yet today’s stories also showcase remarkable resilience and ingenuity. A Kent village transformed itself into a living solar system model to inspire environmental awareness. The stunning turquoise dwarf gecko has rebounded from near-extinction thanks to trade bans and conservation efforts. Amazon communities are pioneering new models for sustainable resource management while protecting some of the world’s last intact forests.
The juxtaposition feels particularly acute in water policy, where federal officials prepare to impose Colorado River management plans if seven states can’t reach agreement, while a Labour politician calls for public ownership of Thames Water amid ongoing environmental concerns. These parallel struggles — one over scarcity, another over stewardship — underscore how water governance has become a defining issue for both climate adaptation and democratic accountability.
As the week unfolds, all eyes will be on whether the Biden administration’s mixed signals on energy policy — supporting both clean innovation and fossil fuel infrastructure — represent a pragmatic transition strategy or a failure to fully commit to climate goals. The stories emerging from frontline communities, from Nepal’s fields to Colorado’s wilderness, suggest that the window for managed, equitable change continues to narrow, making each policy choice increasingly consequential for both people and planet.
The post UK Electric Vehicle Loopholes Add 17 Million Tonnes CO2 While Coastal Erosion Threatens 200-Year-Old Sailors’ Grave — Today’s Environmental Briefing for Sun, Jun 7 2026 first appeared on EnviroLink Network.
British vehicles are projected to release an additional 17 million tonnes of carbon dioxide into the atmosphere by 2030, primarily due to regulatory changes made last year that created loopholes in the country’s electric vehicle transition rules. The staggering emissions increase stems largely from provisions that allow manufacturers to sell more plug-in hybrid electric vehicles (PHEVs) while still meeting their clean car quotas.
Environmental campaigners are now pushing back against renewed industry pressure to further weaken these electric vehicle mandates. The current rules require car manufacturers to sell increasing percentages of electric vehicles each year, designed to accelerate the UK’s transition away from fossil fuel-powered transportation. However, automotive industry representatives are lobbying for a second round of regulatory rollbacks, arguing the targets are too aggressive.
The 17 million tonne emissions gap represents a significant setback for the UK’s climate goals, equivalent to the annual carbon footprint of several million households. Critics argue that the PHEV loophole undermines the environmental benefits these policies were meant to deliver, as plug-in hybrids still rely heavily on gasoline engines and often operate in conventional mode rather than electric-only driving.
This development highlights the ongoing tension between automotive industry concerns about market readiness and environmental advocates pushing for more aggressive decarbonization timelines. As the UK works toward its net-zero commitments, the effectiveness of current electric vehicle policies remains under intense scrutiny from both climate scientists and industry stakeholders.
The post UK Electric Vehicle Rules Weakened Despite Climate Concerns as PHEVs Loophole Creates Major Emissions Gap first appeared on EnviroLink Network.
![]()
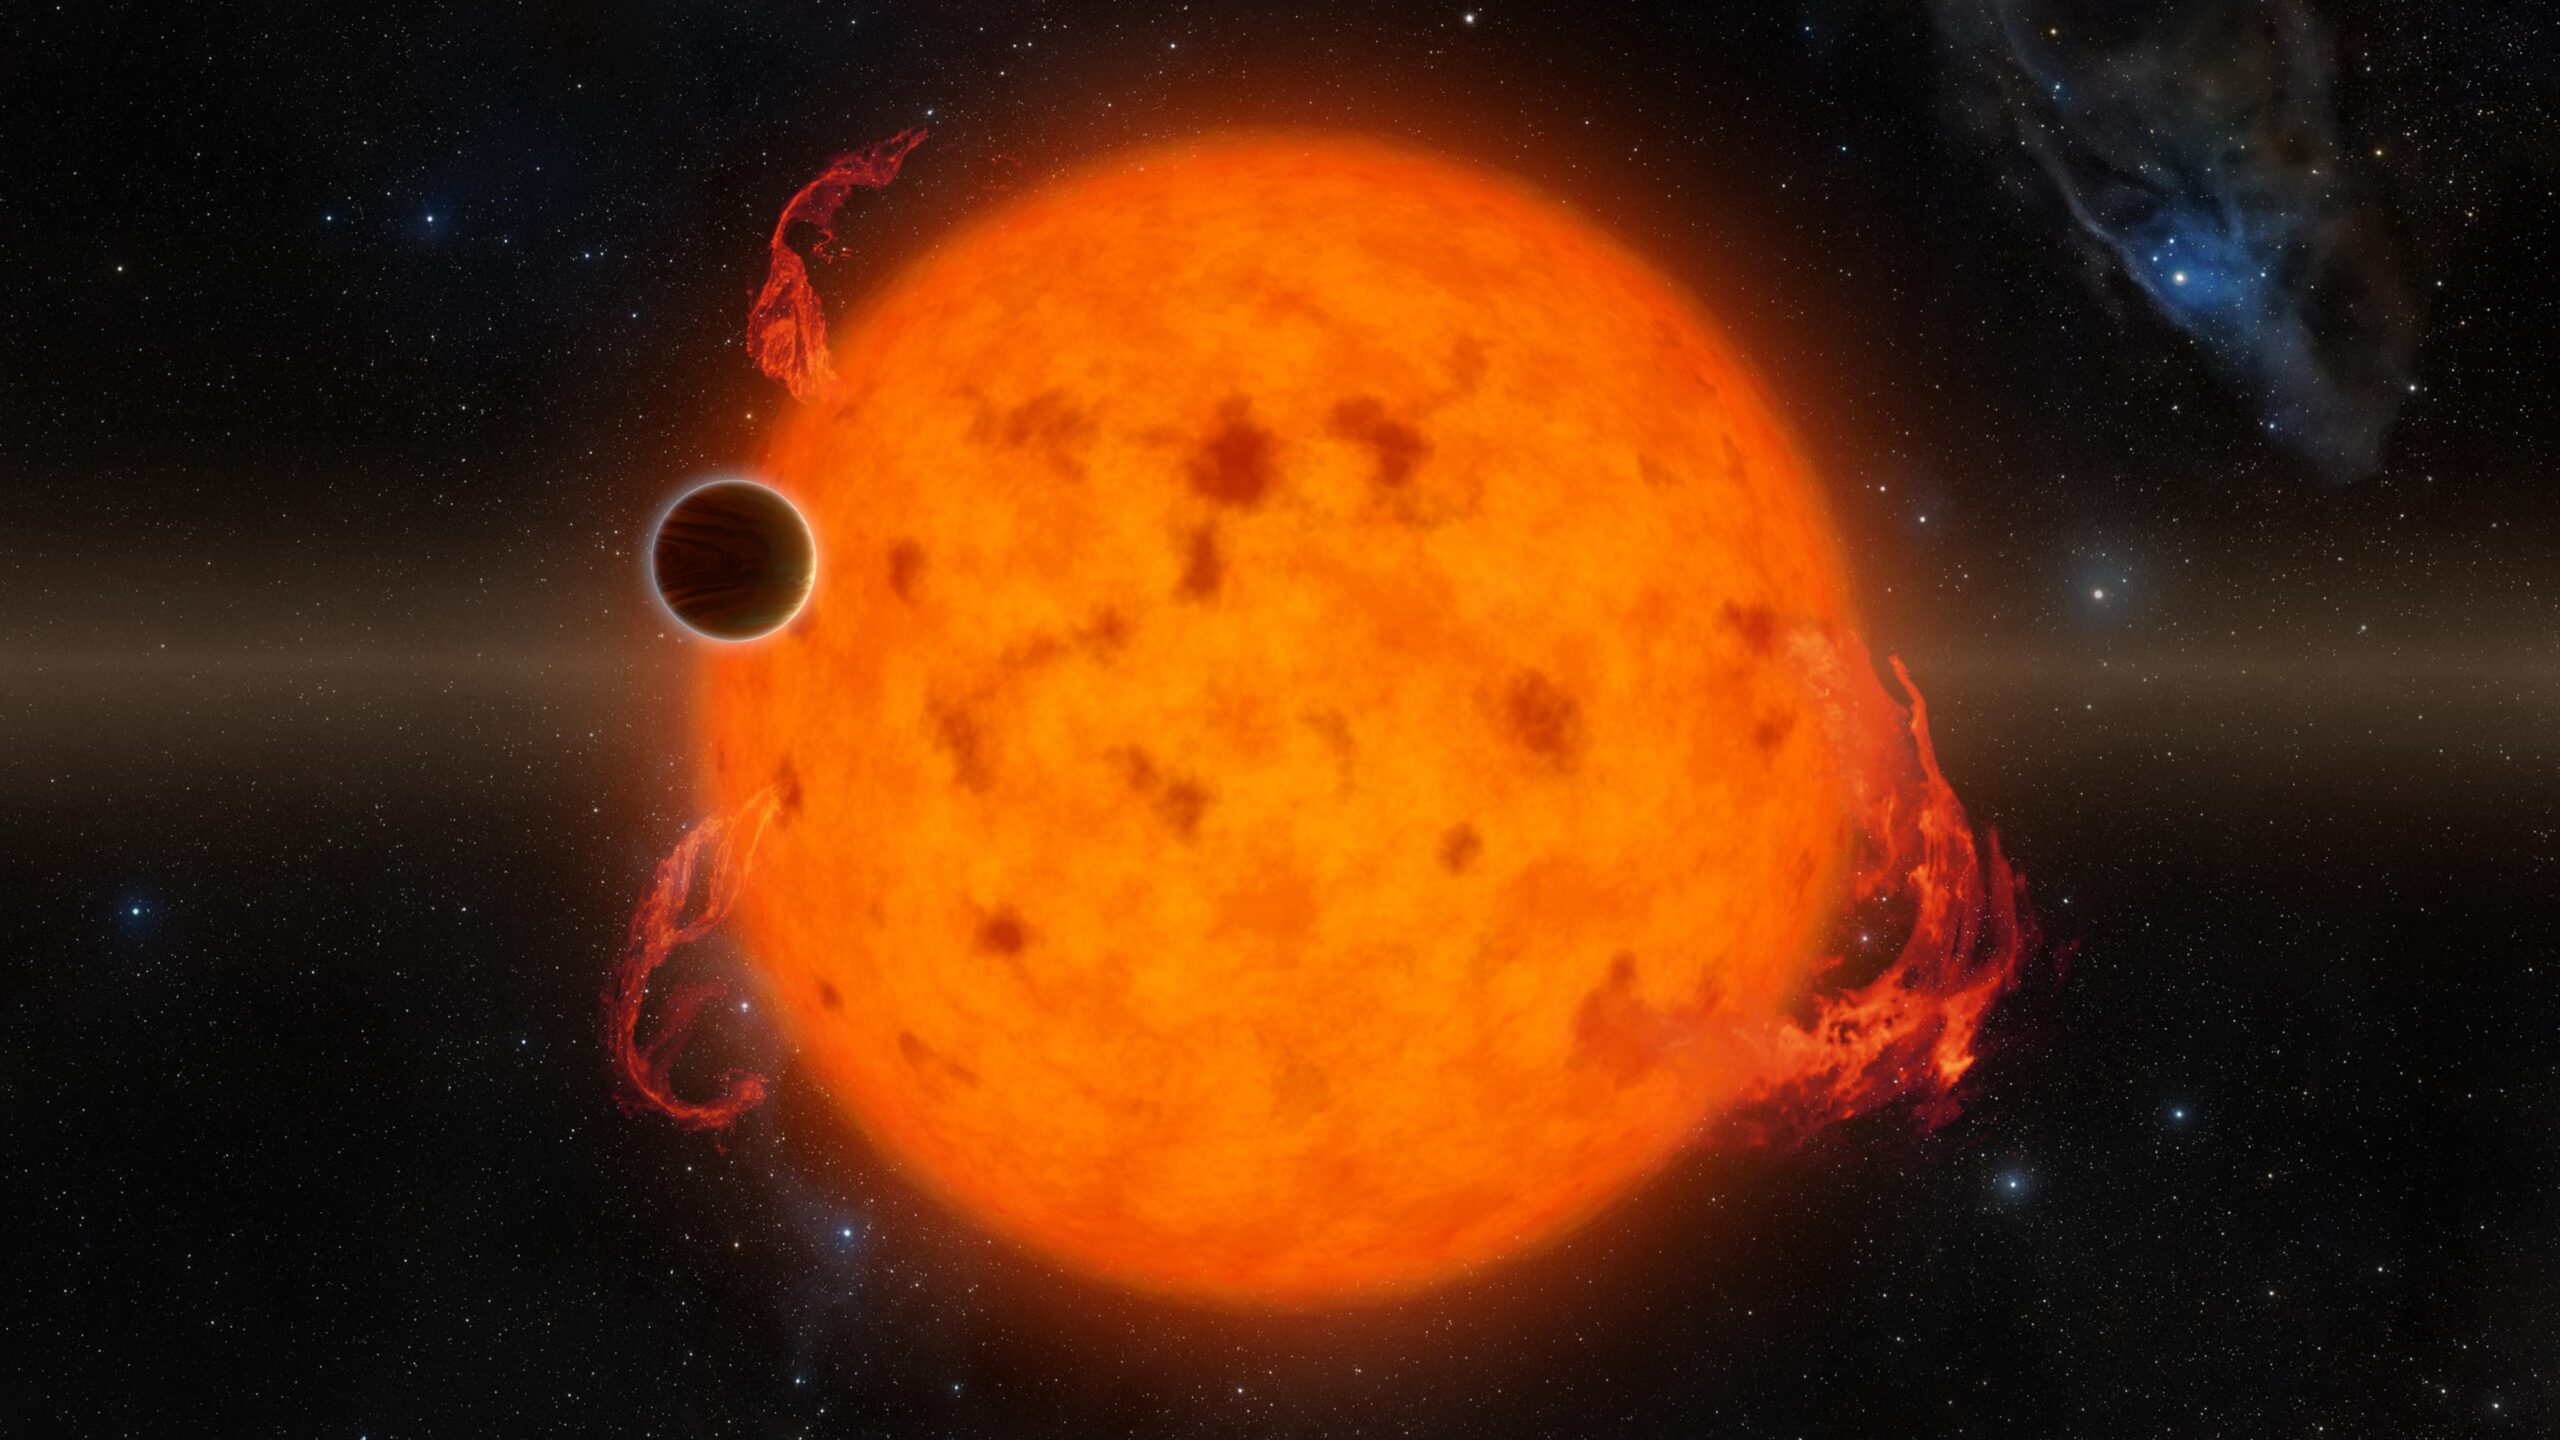
Planets that get too close to their host stars are liable to be engulfed and consumed. New research explores how to identify stars that have had a planetary snack.
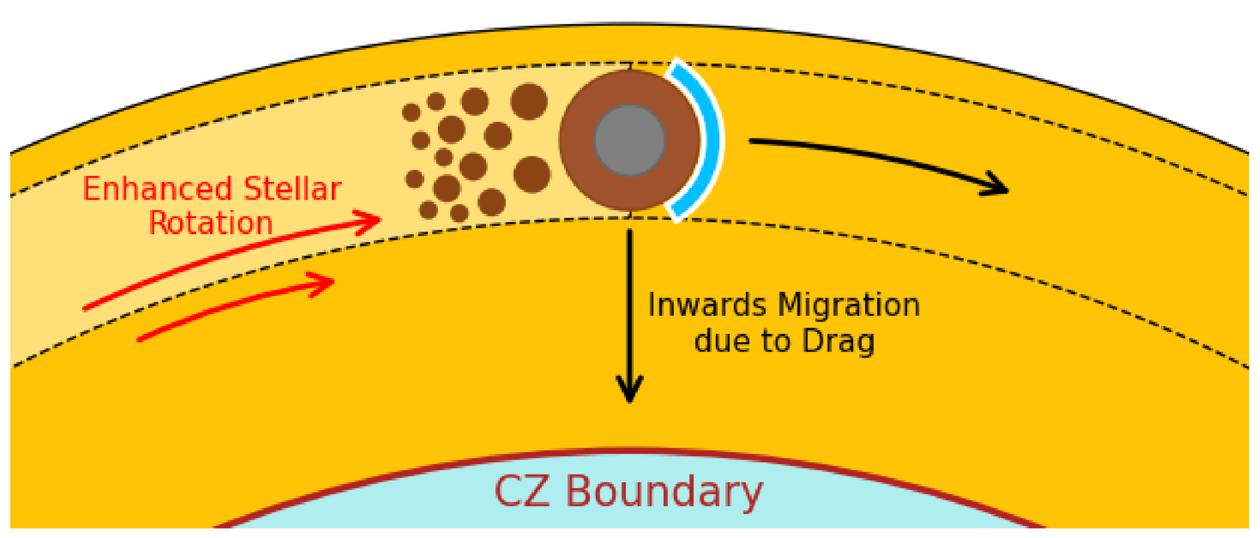
Being a planet that closely orbits its star is dangerous, and various dynamical processes can draw a planet inward past the point of no return. When a planet vanishes beneath the surface of its host, it eventually disintegrates within the star, its atoms mixing into the blazing stellar soup.
This outcome is likely extremely common across the universe, and researchers have begun to see evidence for it: stars that appear to have absorbed angular momentum from their planets, white dwarfs with uncanny metals in their spectra, and stars with chemical abundances that don’t match those of their siblings. Now, in a recent publication led by Kaitlyn Lane (Vanderbilt University), researchers seek to find observational signatures of planetary engulfment of rocky exoplanets by main-sequence stars.
Lane’s team focused on main-sequence stars in the range of 0.5 to 1.4 solar masses, using one-dimensional analytical models to determine which of these stars will most readily display signs of having engulfed a planet. They simulated the stars as they consumed either an Earth-like planet or a super-Earth with the same composition as Earth but 15 times its mass.
Diagram showing a planet being engulfed by its star and beginning to disintegrate before migrating inward. The boundary between the star’s outer convective zone (CZ) and inner radiative zone is shown. Click to enlarge. [Lane et al. 2026]
After that relatively lengthy phase, the process proceeds rapidly: as the planet inches deeper into its star, the drag forces grow stronger and the planet’s demise accelerates, with the planet disintegrating over the course of hours. In the last phase, the planet makes its final plunge and is destroyed in a half hour.
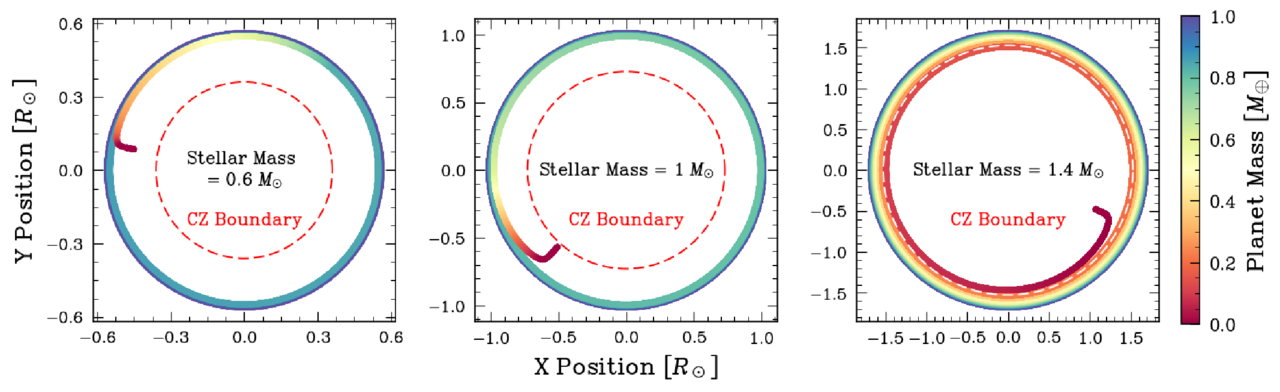
Lane’s team found that the planets tended to be destroyed fully within the outer convective layer of their stars, except in the case of the most massive stars studied here. For more massive stars, the outer convective zone is shallower than it is for the less massive stars, allowing a chunk of each planet to survive the passage through the convective zone to reach the radiative zone below.
The trajectories of three example cases, showing how the planet loses mass as it spirals inward. In the 1.4-solar-mass case, part of the planet survives to reach the radiative zone, but the shallowness of the star’s convective zone means that the disintegrated planetary material is easier to observe. Click to enlarge. [Lane et al. 2026]
While the authors acknowledge that there’s more work to be done — they plan to investigate the impacts of planetary engulfment on stellar structure more closely, for example — this work represents an important foray into identifying targets for future studies of stars that have eaten their planets.
“Observable Metal Pollution in Main-Sequence Stars: Simulations of Rocky Planets Engulfed by Stars in the 0.5 to 1.4 M⊙ Range,” Kaitlyn T. Lane et al 2026 ApJ 1003 67. doi:10.3847/1538-4357/ae5b9a
The post Now That’s Metal: How to Spot Stars That Have Swallowed Their Planets appeared first on AAS Nova.
![]()
The Antennae galaxies are a nearby pair of interacting galaxies, shown in optical light from the Hubble Space Telescope (left) and in infrared light from JWST (right) in the image above. Between the two galaxies’ bright nuclei, there is a vast and dusty molecular cloud complex that harbors a large number of massive young star clusters — and in a recent article led by Rupali Chandar (University of Toledo), researchers have worked to pin down exactly how many clusters are embedded within the dusty whorls of the Antennae galaxies. The team used JWST to search for emission from star clusters too thickly blanketed with dust to be visible in previous observations by Hubble. They ultimately identified 45 sources, 40 of which were seen for the first time in this study. These star clusters mostly inhabit the overlap region between the two galaxies, are less than 2.5 million years old, and each contain roughly 104–106 solar masses. To learn more about how JWST’s infrared capabilities unveiled young star clusters in these interacting galaxies, be sure to check out the full article linked below.
“Nowhere Left to Hide: Uncovering All of the Massive Young Embedded Star Clusters in the Antennae with JWST,” Rupali Chandar et al 2026 ApJ 1002 64. doi:10.3847/1538-4357/ae56e8
The post Featured Image: Massive Young Star Clusters, Revealed appeared first on AAS Nova.
![]()
Each Jupiter-size planet in the galaxy falls into one of three distinct categories: hot, warm, or cold. A new study suggests that despite the apparent differences between these populations, they may have all formed from the same underlying dynamical process: a game of pool played at planetary scales.
Though our solar system has only one Jupiter-size planet, elsewhere in the galaxy we have found three different species of these massive gas giants. Cold Jupiters closely resemble their namesake and orbit far from their host stars; hot Jupiters are the opposite and are found whipping around their stars on extremely close-in orbits. In between these are the warm Jupiters, which tend to orbit in the intermediate space between 0.1 and 1.0 au.
An artist’s depiction of a hot Jupiter. These planets orbit extremely close to their host stars, but likely got to their locations by scattering inward from more distant orbits. [NASA/JPL-Caltech]
Given these differences, it’s often thought that each of these populations arrived at its current location through different dynamical processes and that the history of the warm Jupiters is likely quite different from the history of the hot Jupiters. However, a new study led by Julia Esposito (Georgia Institute of Technology) has proposed an alternative view. Maybe these populations, though they appear different now, were all created by the same process: planet–planet scattering.
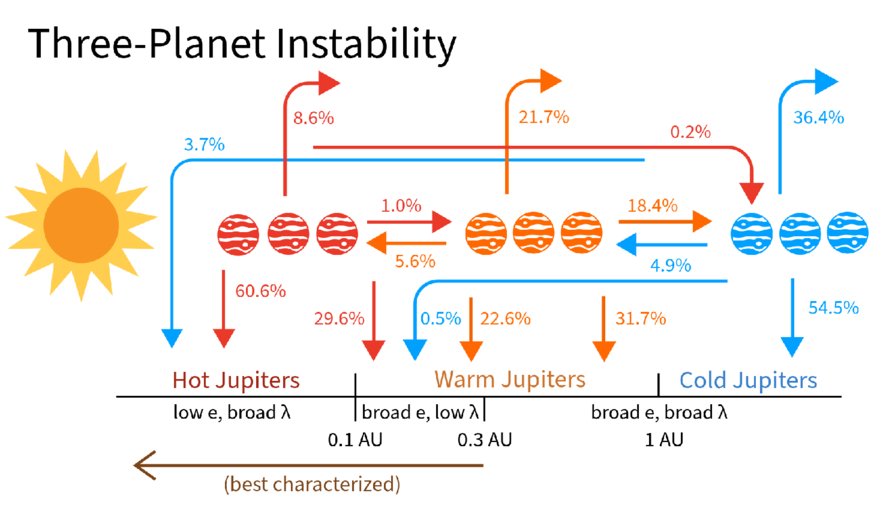
A schematic showing where different planets ended up as a function of where they scattered from during their evolution. Click to enlarge. [Esposito et al. 2026]
At the end of the simulation, the team surveyed the digital carnage. Almost every virtual system ended with only two planets after either ejecting one away from the star or having two planets collide. But, remarkably, the remaining two-planet systems looked tantalizingly similar to what we actually observe, with a mix of hot, warm, and cold Jupiters. Even more exciting, the end populations were highly correlated to where the violent scattering event took place.
For example, the warm Jupiters were almost all produced by “warm scattering” simulations, where the scattering took place between 0.1 and 1.0 au. The planets that survived the simulations and ended up as warm Jupiters matched all of the properties of the real warm Jupiter population: they had nearby companions, were moderately eccentric, and were mostly aligned with their stars. The hot Jupiters, meanwhile, were almost all produced by “cold scattering” events where the flybys happened far from the star and resulted in one planet hurtling inwards. These also matched all of the observed properties of real hot Jupiters.
The researchers concluded that planet–planet scattering can produce both the warm and hot Jupiter populations so long as you let the planets scatter from a variety of different distances. This exciting theoretical insight, if correct, would mean that astronomers could stop searching for different pathways to create each population. Happily, this model also provides testable predictions, and the authors lay out how the theory could be supported or disproven with additional data. Through virtual experiments like these, astronomers continue to build up an understanding of how the wide range of planetary architectures observed across the galaxy came to be.
“Unified Formation Channel of Hot and Warm Jupiters via Planet–Planet Scattering,” Julia Esposito et al 2026 ApJL 1003 L3. doi:10.3847/2041-8213/ae61b0
The post Playing Pool with Planets appeared first on AAS Nova.
![]()
Nature sometimes behaves in ways that are difficult to recreate in simulations. New research tackles the computational challenge of turbulent mixing and rules out a commonly assumed source of data–model disagreement.
What do Earth’s oceans, red giant stars, and white dwarfs have in common? These are all sites of thermohaline mixing, a form of turbulent mixing that takes place when there is a vertical gradient in both temperature and chemical composition. For example, in Earth’s oceans, water near the surface is warmer and saltier than water in the depths below, setting up an unstable situation prone to mixing.
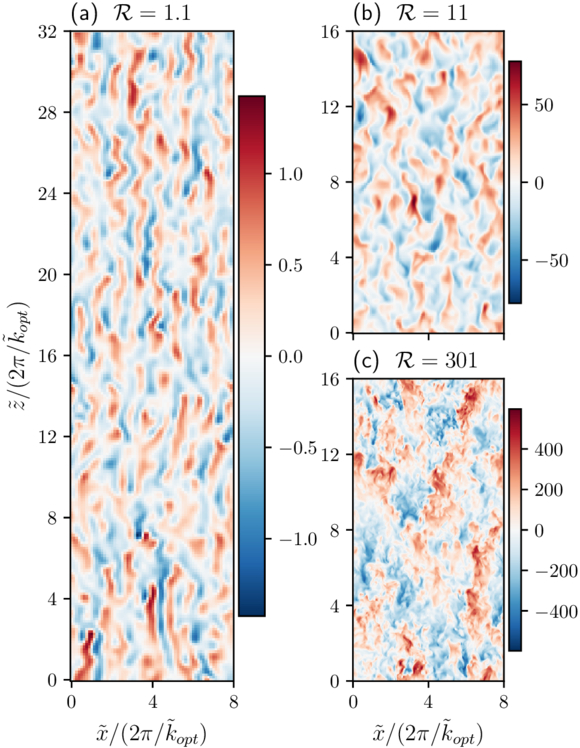
Examples of simulated thermohaline convection. These snapshots show the vertical velocity across a slice through the simulation volume. Click to enlarge. [Fraser 2026]
One of the most important parameters for modeling mixing is the Prandtl number, Pr, which is the ratio of viscosity to thermal diffusivity (in other words, a way of describing whether momentum or heat diffuses more quickly within a fluid). For stellar interiors, Pr is around 10−6, but computational limitations have prevented modelers from setting this value lower than around 10−2. When tensions between models and reality arise, this gap between simulated and realistic Pr values is often assumed to be the source of the mismatch.
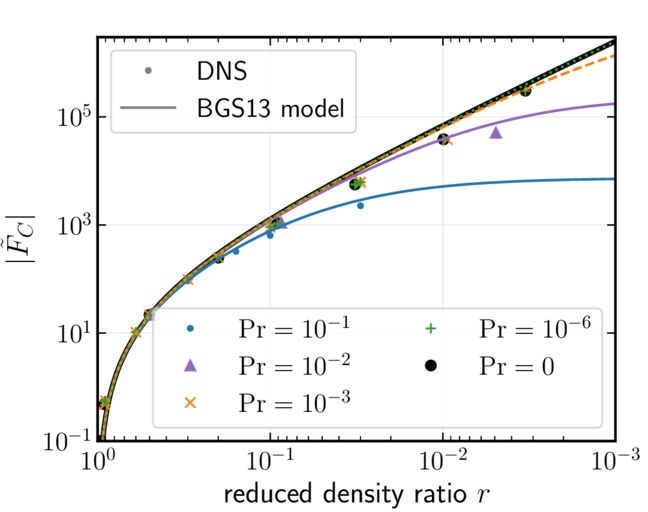
In a recent research article, Adrian Fraser (University of Colorado Boulder) aimed to test this assumption. Fraser carried out 3D simulations of thermohaline mixing, using a semi-implicit modeling technique that lowered the computational cost and allowed the simulations to probe Pr values of 10−1, 10−2, 10−3, 10−6, and 0.
Turbulent compositional flux as a function of reduced density ratio for the simulations from this work (DNS) and the benchmark model of thermohaline convection (BGS13). Click to enlarge. [Adapted from Fraser 2026]
Where does this leave modelers attempting to recreate the reality of stellar interiors? First, a silver lining of this investigation: Fraser found that setting Pr = 0 delivered nearly identical results to Pr = 10−6. This suggests that valid results can be attained in a much less computationally intensive way, since setting Pr = 0 lowers the complexity of the simulation. While simulations with Pr = 0 may not be appropriate for all scenarios, including systems with strong magnetic fields, it may provide a way forward in certain situations.
For modeling of red giants and white dwarfs, Fraser suggested that incorporating magnetic fields, stellar rotation, or additional sources of mixing may resolve the current discrepancies. In fact, some modeling work has shown that magnetic fields could entirely close the gap between observations and models for red giant surface abundances — suggesting that bringing models and observations into agreement may be within reach.
“Bridging the Prandtl Number Gap: 3D Simulations of Thermohaline Convection in Astrophysical Regimes,” Adrian E. Fraser 2026 ApJL 1001 L22. doi:10.3847/2041-8213/ae5796
The post Simulations of Turbulent Mixing Close One Gap but Open Another appeared first on AAS Nova.
![]()
How does environment shape a galaxy’s growth and evolution? This is the question explored in a recent study led by Gissel Montaguth (University of São Paulo). Montaguth’s team examined nearly 4,000 galaxies in low-mass, high-mass, and compact galaxy groups, as well as galaxies adrift in the field without belonging to a group. The sampled galaxies were classified as early-type, late-type, transition (generally disk galaxies with quenched star formation), or other (generally elliptical but with lingering star formation). The image above shows six transition galaxies from the sample, three of which show signs of past disturbances (top row). The team found that early-type and “other” galaxies were resilient to changes in environment, but late-type and transition galaxies could be affected by life in close groups. Late-type galaxies in compact groups tended to be somewhat smaller than their loosely grouped or field galaxy counterparts, while transition galaxies showed a significantly steeper stellar mass–size relation in group environments and smaller sizes in groups than in the field. This suggests that transition galaxies are strongly influenced by interactions, mergers, and processes like disk truncation. To learn more about the impact of environment on galaxy properties, be sure to check out the full article linked below.
“Galaxies Caught in Transition: The Role of Group Environment in Shaping the Mass–Size Relation in the Local Universe,” Gissel P. Montaguth et al 2026 ApJ 999 160. doi:10.3847/1538-4357/ae42ca
The post Featured Image: Galaxies Caught in Transition appeared first on AAS Nova.
![]()
Galaxies pull in and pump out gas as they form and evolve, but distinguishing between the two directions is tricky. A recent study used emission lines and dust absorption to try to pin it down.
Throughout their lives, galaxies churn gas into stars, stars fuse new metals, supernovae blow enriched material back out, and the cycle repeats. To maintain this process and sustain star formation, a galaxy must fuel up by accreting gas from its surroundings. However, catching galactic gas accretion has proven difficult — both emission from gas falling into the galaxy (inflows) and gas blown out by supernovae (outflows) can appear blueshifted or redshifted along an observer’s sight line, depending on if the flowing material is in front of or behind the galaxy.
While direct evidence of inflows has been identified in the Milky Way, only a few direct detections of inflowing gas in other galaxies exist due to the degeneracy of inflow and outflow emission-line features. Relying on additional absorption measurements, some studies have teased out inflows in other galaxies, but these star formation fuel pumps remain overwhelmingly evasive. The angle at which we observe a galaxy also limits our ability to detect both inflows and outflows, with face-on galaxies best oriented to detect these shifted spectral features. How then do we uncover this critical component of a galaxy’s evolution?
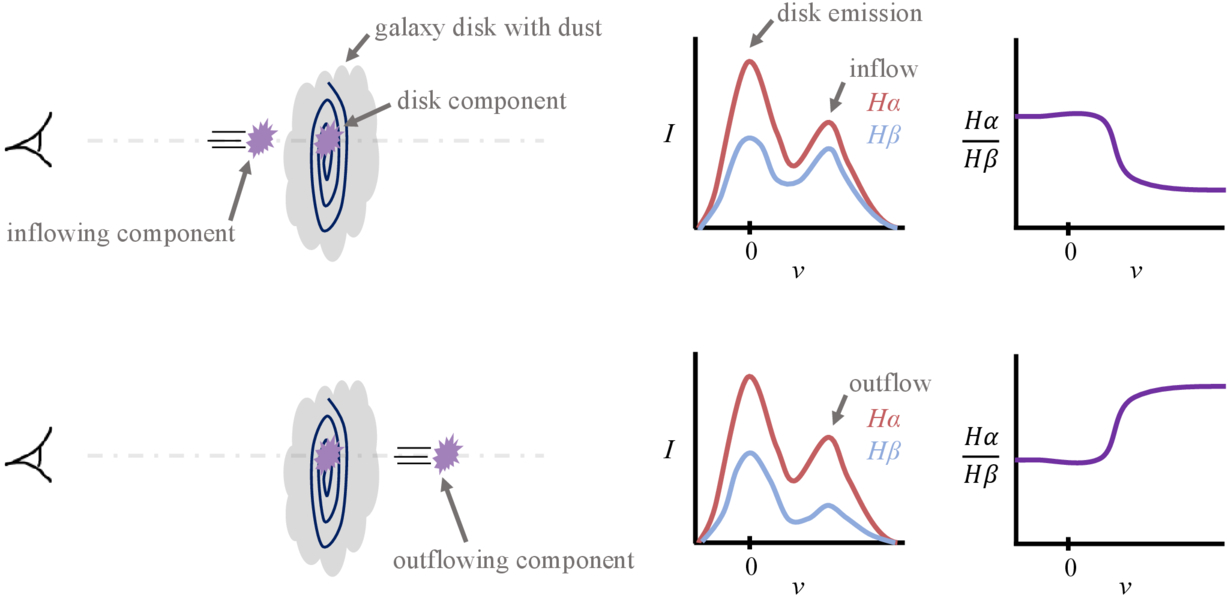
A diagram illustrating the degeneracy in emission spectra of galaxies, with the top panel showing an inflowing component and the bottom panel showing an outflowing component. While the Hα emission is similar, the Hβ emission is more affected by extinction due to dust in the galaxy’s disk, making it possible to identify inflow versus outflow based on the Balmer decrement. Click to enlarge. [Sitaram et al 2026]
Testing this idea, the authors performed a hydrodynamic simulation of an isolated, face-on Milky Way–like galaxy and tracked inflows and outflows over a billion years. From the simulation, they extracted mock spectral observations to measure the ionized gas motions and Hα and Hꞵ emission lines along different sight lines throughout the galaxy. Separating gas components into three categories — inflow, outflow, and in the disk — the authors found that dust extinction does cause noticeable differences in the Balmer decrement depending on a component’s location with respect to the disk.
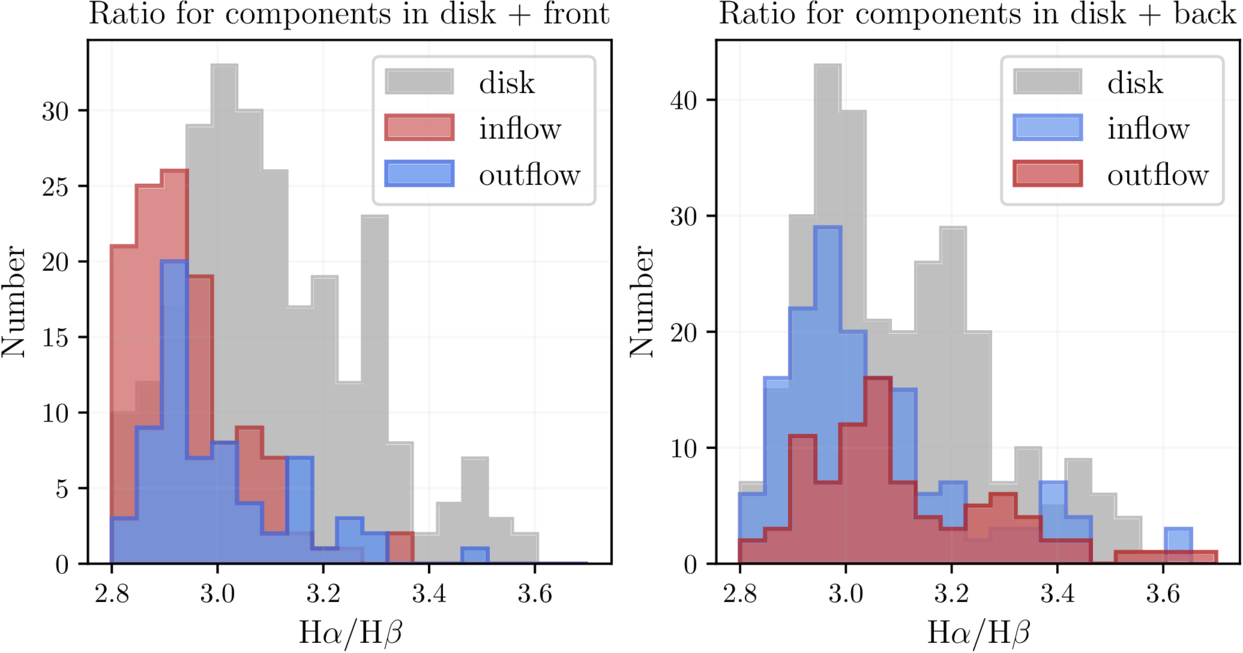
The distribution of Balmer ratios between different components in the interstellar medium and in front of the galaxy (left) and behind the galaxy (right). Material in front of the galaxy shows lower Hα/Hβ ratios. Click to enlarge. [Sitaram et al 2026]
What does this mean for identifying the inflows that provide galaxies with star-forming fuel? The authors reported that components in front of the galaxy — redshifted inflows and blueshifted outflows — tend to exhibit lower Hα/Hꞵ ratios compared to components behind the disk, aligning with the expectation that dust in the disk absorbs Hꞵ. In particular, these front inflows appear to be the most readily distinguished from gas in and behind the galaxy’s disk.
However, things get more complicated for gas behind the galaxy. Because the dust in the simulation is distributed nonuniformly in small clumps throughout the galaxy, it is difficult to distinguish between disk gas and gas behind the galaxy. While future simulations with improved dust modeling are necessary to resolve this issue, this study offers a useful method to distinguish inflow and outflow in dusty face-on galaxies.
“Identifying Signatures of Inflow onto Face-On Galaxies Using Balmer Decrement,” Meghna Sitaram et al 2026 ApJ 1001 87. doi:10.3847/1538-4357/ae5222
The post In or Out? Using Balmer Emission to Distinguish Inflows from Outflows appeared first on AAS Nova.
![]()
The Sun’s activity history, the sources of tiny jets, and how magnetic fields might impact space weather forecasts: today’s Monthly Roundup introduces a trio of recent research articles from the Astrophysical Journal that tackle hot topics in solar physics.
Since the 1970s, regular monitoring of the Sun’s magnetic field has allowed researchers to decipher the Sun’s behavior as it cycles through periods of low and high activity. But what resources exist for studying the Sun’s past behavior? To investigate the long-term behavior of the Sun, researchers reach for historical records of sunspots, which stretch back to the 1700s.
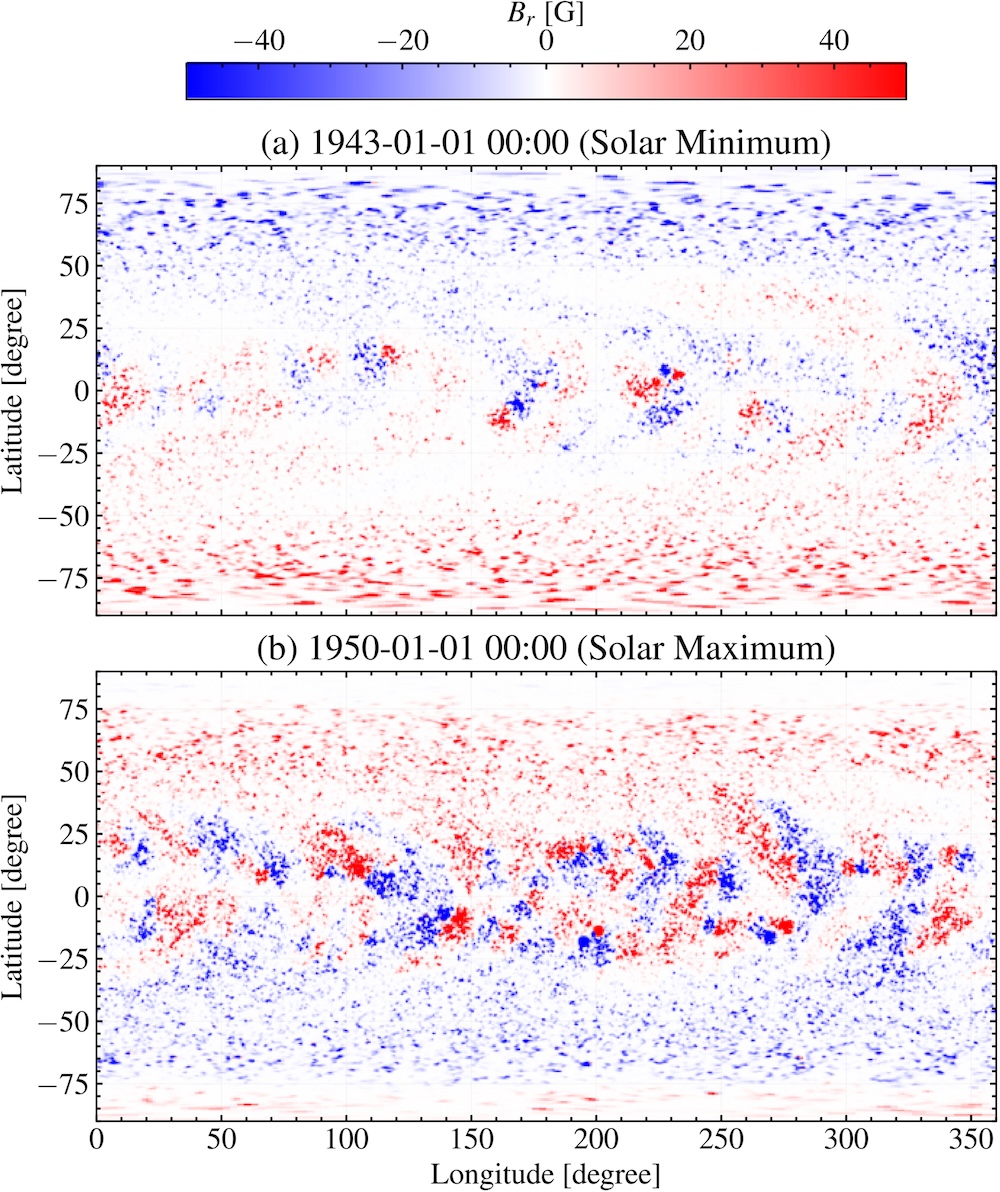
Example maps of the simulated photospheric radial magnetic field during a period of low (top) and high (bottom) solar activity. Click to enlarge. [Jha et al. 2026]
Jha and coauthors found that this method successfully reproduced the expected large-scale behavior of the Sun’s magnetic field across multiple solar cycles, such as the reversal of the polarity of the solar magnetic field near the peak of the activity cycle. While this work highlights the impressive results obtained from combining historical sunspot records with modern sunspot statistics, the team pointed out that this method cannot accurately reproduce all quantities because of the nonlinear nature of the underlying physics. Future work will refine the model further, and in the meantime, the team’s simulated historical magnetic field maps will be made publicly available.
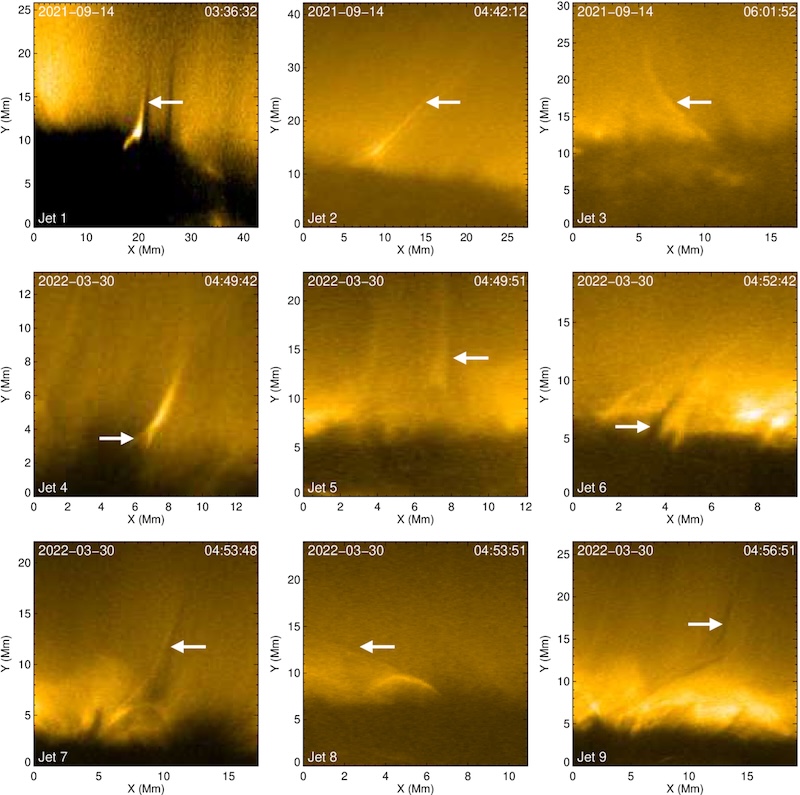
The Sun’s atmosphere is filled with an ever-shifting maze of magnetic field lines, which reconfigure and release pent-up magnetic energy in a process called magnetic reconnection. Magnetic reconnection can launch particles and heat plasma, and it’s thought to be responsible for driving jets on a variety of scales in the Sun’s tenuous outer atmosphere, or corona. Annu Bura (Indian Institute of Astrophysics; Pondicherry University) and coauthors investigated the physical origins of the smallest of these reconnection driven jets, picoflare jets, using data from the Extreme Ultraviolet Imager on board Solar Orbiter. Solar Orbiter has ventured within 0.3 au of the Sun, and its Extreme Ultraviolet Imager has returned exceptionally precise high-energy images of our home star.
Examples of jets identified in this study. You can see an animation of this figure. [Bura et al. 2026]
Using radiation magnetohydrodynamics simulations, the team explored the origins of their sample of jets. The simulations suggested that the bright features arose from hot, tenuous coronal plasma, while the accompanying dark features were due to cooler, denser plasma venturing upward from deeper in the Sun’s atmosphere, in the chromosphere. Overall, the simulations and observations support a picture in which picoflare-scale jets are driven by magnetic reconnection after magnetic flux emerges through the Sun’s surface. This echoes the formation route of larger coronal jets, suggesting that this process may apply to a wide range of physical scales.
The vast majority of our observations of the Sun have come from within a few degrees of the ecliptic plane, either from telescopes situated on Earth’s surface or from spacecraft that stuck close to the plane of our solar system. With rare but notable exceptions — the Ulysses spacecraft, which measured the Sun’s magnetic field and plasma environment from a near-polar orbit, and Solar Orbiter, which took the first-ever image of the Sun’s poles in November 2025 — the Sun’s poles have remained hidden from our instruments.
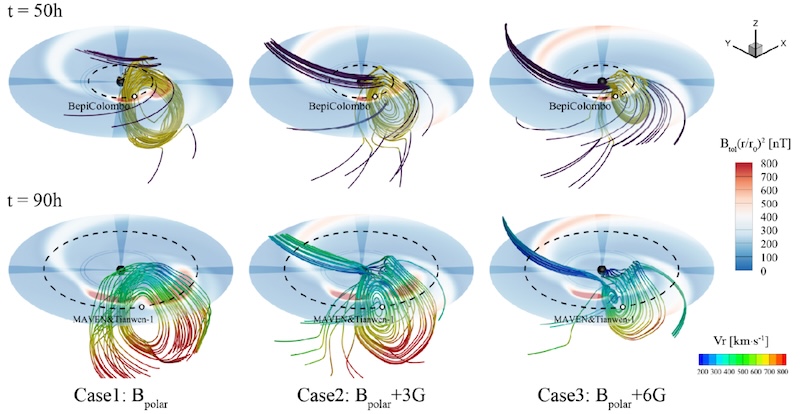
Our limited knowledge of the Sun’s polar magnetic field has consequences for our ability to model space weather events like coronal mass ejections. A team led by Xiao Zhang (Chinese Academy of Sciences; University of Chinese Academy of Sciences) has used numerical simulations to investigate how solar polar magnetic field conditions influence the propagation of a coronal mass ejection (CME) through the solar system.
Simulation results showing how the propagation and expansion of a CME are affected by the polar magnetic field strength. Click to enlarge. [Zhang et al. 2026]
“Historical Reconstruction of Solar Surface Magnetism from Cycles 1–24 Using the Synthetic Active Region Generator and the Advective Flux Transport Model,” Bibhuti Kumar Jha et al 2026 ApJ 997 279. doi:10.3847/1538-4357/ae279a
“On the Origin of Coronal Picoflare Jets,” Annu Bura et al 2026 ApJ 1000 94. doi:10.3847/1538-4357/ae48e6
“Influence of Solar Polar Magnetic Fields on the Propagation of Coronal Mass Ejections,” Xiao Zhang et al 2026 ApJ 1000 200. doi:10.3847/1538-4357/ae4c54
The post Monthly Roundup: Science of the Sun appeared first on AAS Nova.
![]()
Notice anything unusual about these galaxies? Each of the scenes above is crafted from observations from the Hubble Arp Galaxy Survey, which turned the talents of the Hubble Space Telescope toward 216 targets in the Arp and Arp–Madore catalogs. These catalogs contain galaxies that are visibly out of equilibrium, either caught in the middle of an interaction with another galaxy, sporting strange structures, or illuminated by brilliant starbursts. Julianne Dalcanton (Flatiron Institute; University of Washington), Meredith Durbin (University of Washington; University of California, Berkeley), and Benjamin Williams (University of Washington) designed the survey to create an archive of previously unobserved sources in these catalogs of peculiar galaxies. In addition to providing a new high-resolution view of these sources, the team hopes that the survey will serve as a launchpad for new investigations and complementary observations from facilities like JWST and the Atacama Large Millimeter/submillimeter Array. To learn more about the Hubble Arp Galaxy Survey and see more of the new images, be sure to check out the full article linked below.
“The Hubble Arp Galaxy Survey,” Julianne J. Dalcanton et al 2026 ApJS 283 25. doi:10.3847/1538-4365/adfc67
The post Featured Image: Disequilibrium on Display appeared first on AAS Nova.
![]()
Researchers tracked the tail of comet C/2023 P1 (Nishimura) as it interacted with a string of coronal mass ejections, leading to the first-ever quantitative analysis of a cometary tail detachment event.
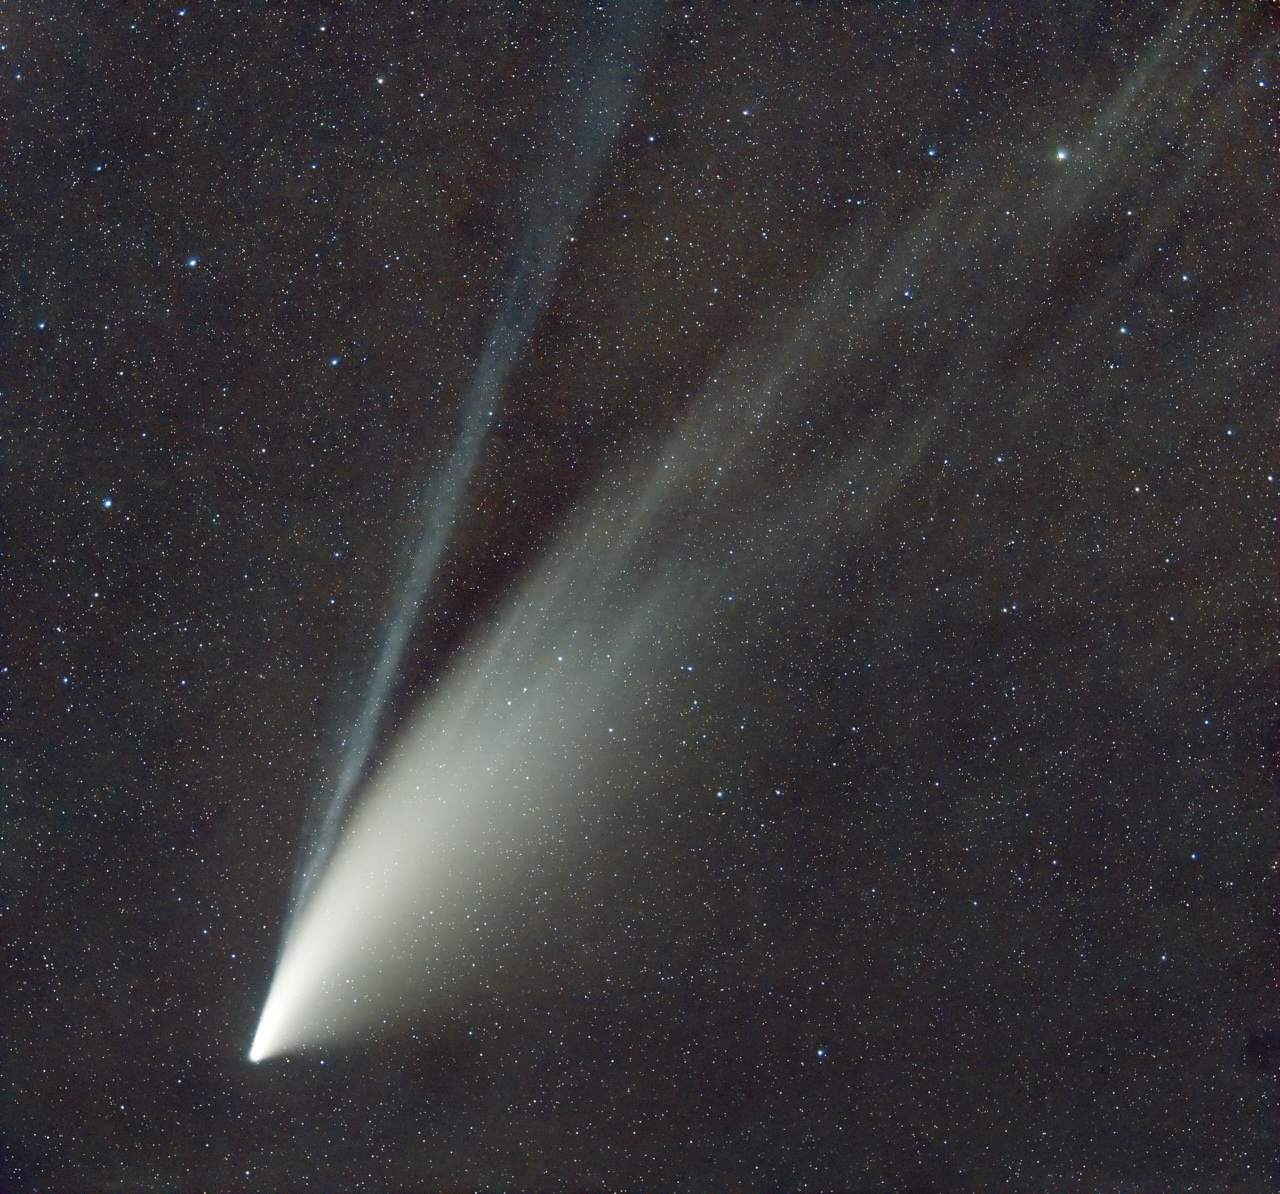
A photo of comet C/2020 F3 (NEOWISE) showing its narrow bluish ion tail and broader white dust tail. [Juan lacruz; CC BY-SA 4.0]
When comets journey into the inner solar system, they tend to do so sporting two tails: a dust tail that sweeps back from the comet along its curved trajectory and an ion tail that points away from the Sun, in the direction of the interplanetary magnetic field.
The ion tail, which forms when ultraviolet light from the Sun ionizes gas in a comet’s fuzzy coma, interacts with structures in the solar wind, causing it to shift, sputter, and sometimes even disconnect entirely. Now, for the first time, researchers have quantified the timescales involved when a comet loses — and regrows — its tail.
Shaheda Begum Shaik (George Mason University; US Naval Research Laboratory) and collaborators studied this phenomenon in observations of the comet C/2023 P1 (Nishimura) from 1 to 14 September 2023. In high-resolution images from the Solar Orbiter Heliospheric Imager, Shaik’s team analyzed the dynamics of C/2023 P1’s tail as the comet braved blustery solar wind conditions in the inner solar system.
In a two-week period, the comet underwent four separate tail disconnection events, in which the connection between the ion tail and the comet was severed. Each of these events coincided with the passage of a coronal mass ejection: a tangled mass of solar plasma and magnetic fields ejected from the Sun’s outer atmosphere.
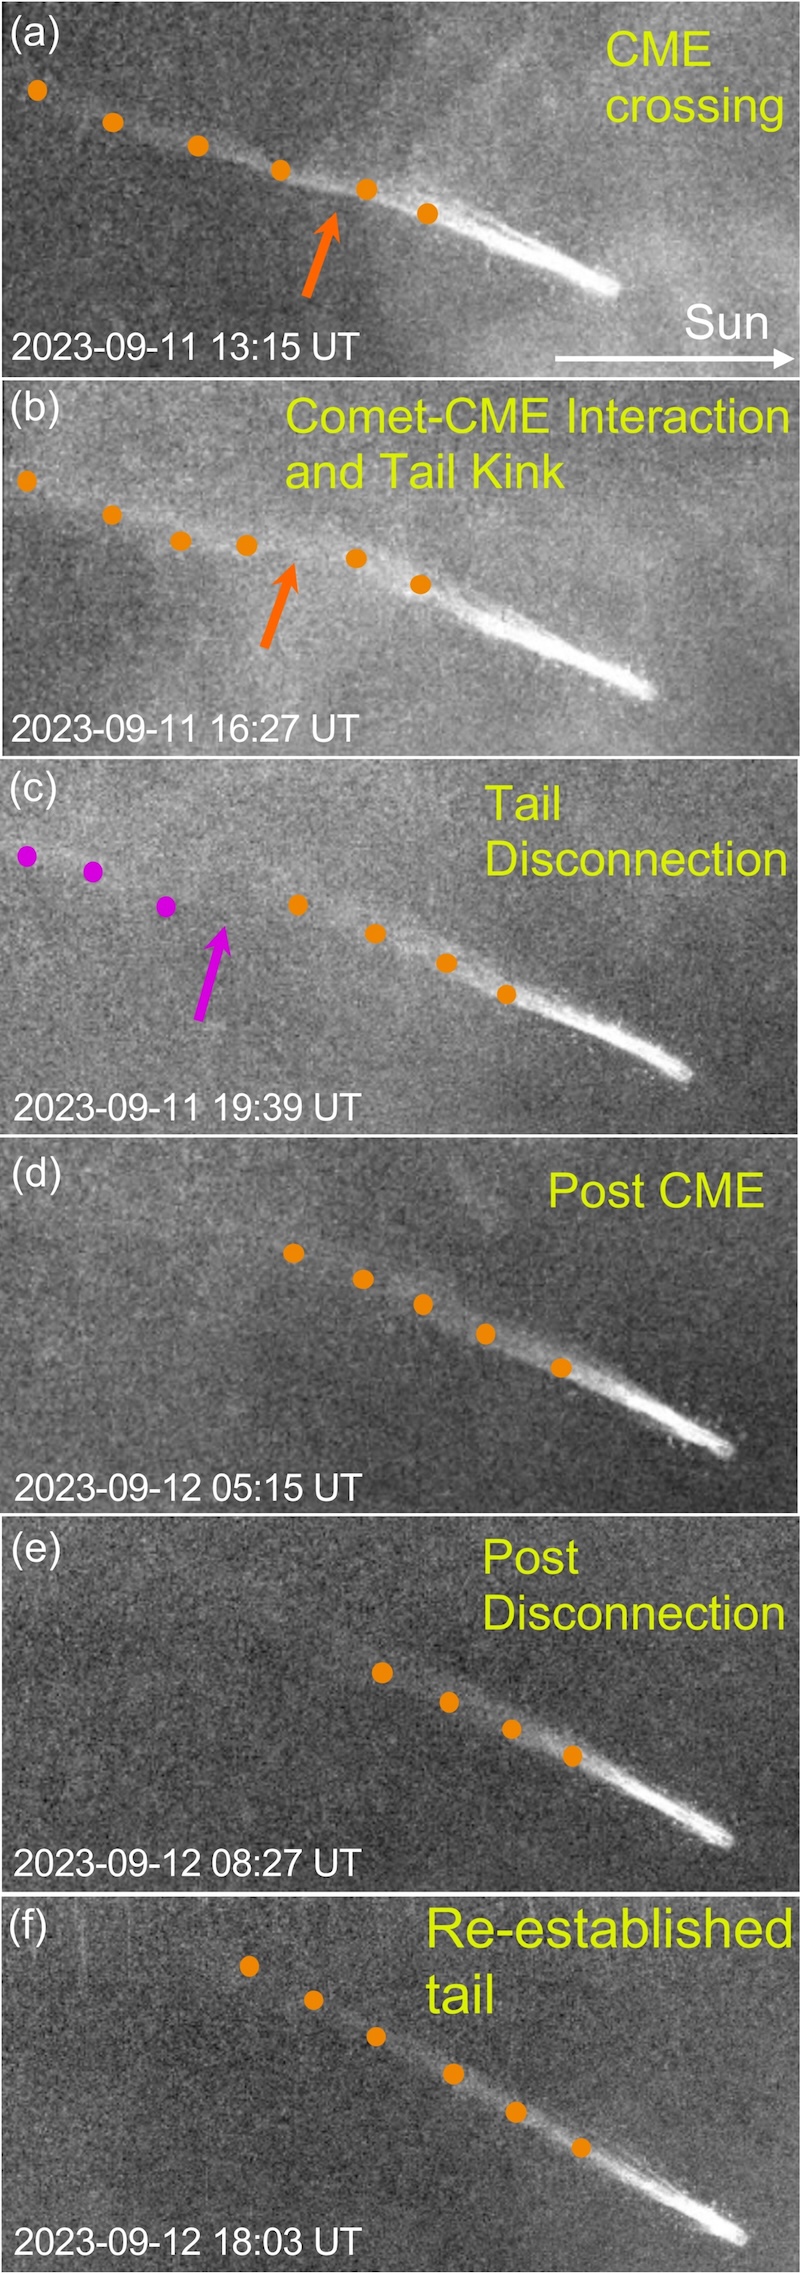
Solar Orbiter Heliospheric Imager observations of the 11 September 2023 tail disconnection event, which was driven by a passing coronal mass ejection (CME). [Shaik et al. 2026]
Focusing on the tail disconnection event with the highest-resolution and highest-cadence data, Shaik’s team observed constant small-scale fluttering of the ion tail, reflecting the buffeting of the tail by the solar wind. The tail then developed a kink, which the team speculated is due to compressed solar wind plasma piling up in front of an oncoming coronal mass ejection. The wide-field images show the coronal mass ejection advancing upon the comet and the comet’s tail seemingly being sliced in two.
The free-floating tail segment sped away from the comet at roughly 295 km/s, likely indicating that the tail became caught up in and was transported by the flank of the coronal mass ejection as it barreled past the comet. The timescale and geometry of the event suggest that the interaction of the coronal mass ejection’s magnetic field with the comet’s tail was responsible for the disconnection.
Over the following 24 hours, the comet’s tail slowly regrew at a rate of 86 km/s to its original length of 1.9 million kilometers. The rate of regrowth is likely determined by several factors, such as the rate at which the comet produces ions and the local magnetic field configuration. This work represents a first look at the quantitative behavior of a tail disconnection event, paving the way for future investigations of cometary behavior and a greater understanding of the complex magnetic and plasma environment of the inner solar system.
“The First Quantitative Study of Cometary Tail Regrowth Following a Coronal Mass Ejection-Driven Disconnection Event,” Shaheda Begum Shaik et al 2026 ApJ 999 60. doi:10.3847/1538-4357/ae3bdb
The post Comets Are Lizards: Watching C/2023 P1 Regrow Its Tail appeared first on AAS Nova.
![]()
The Lucy spacecraft, en route to its primary mission targets, zipped past the main-belt asteroid Dinkinesh and revealed its tiny satellite, Selam. New research examines the surfaces and histories of these small rocky worlds.
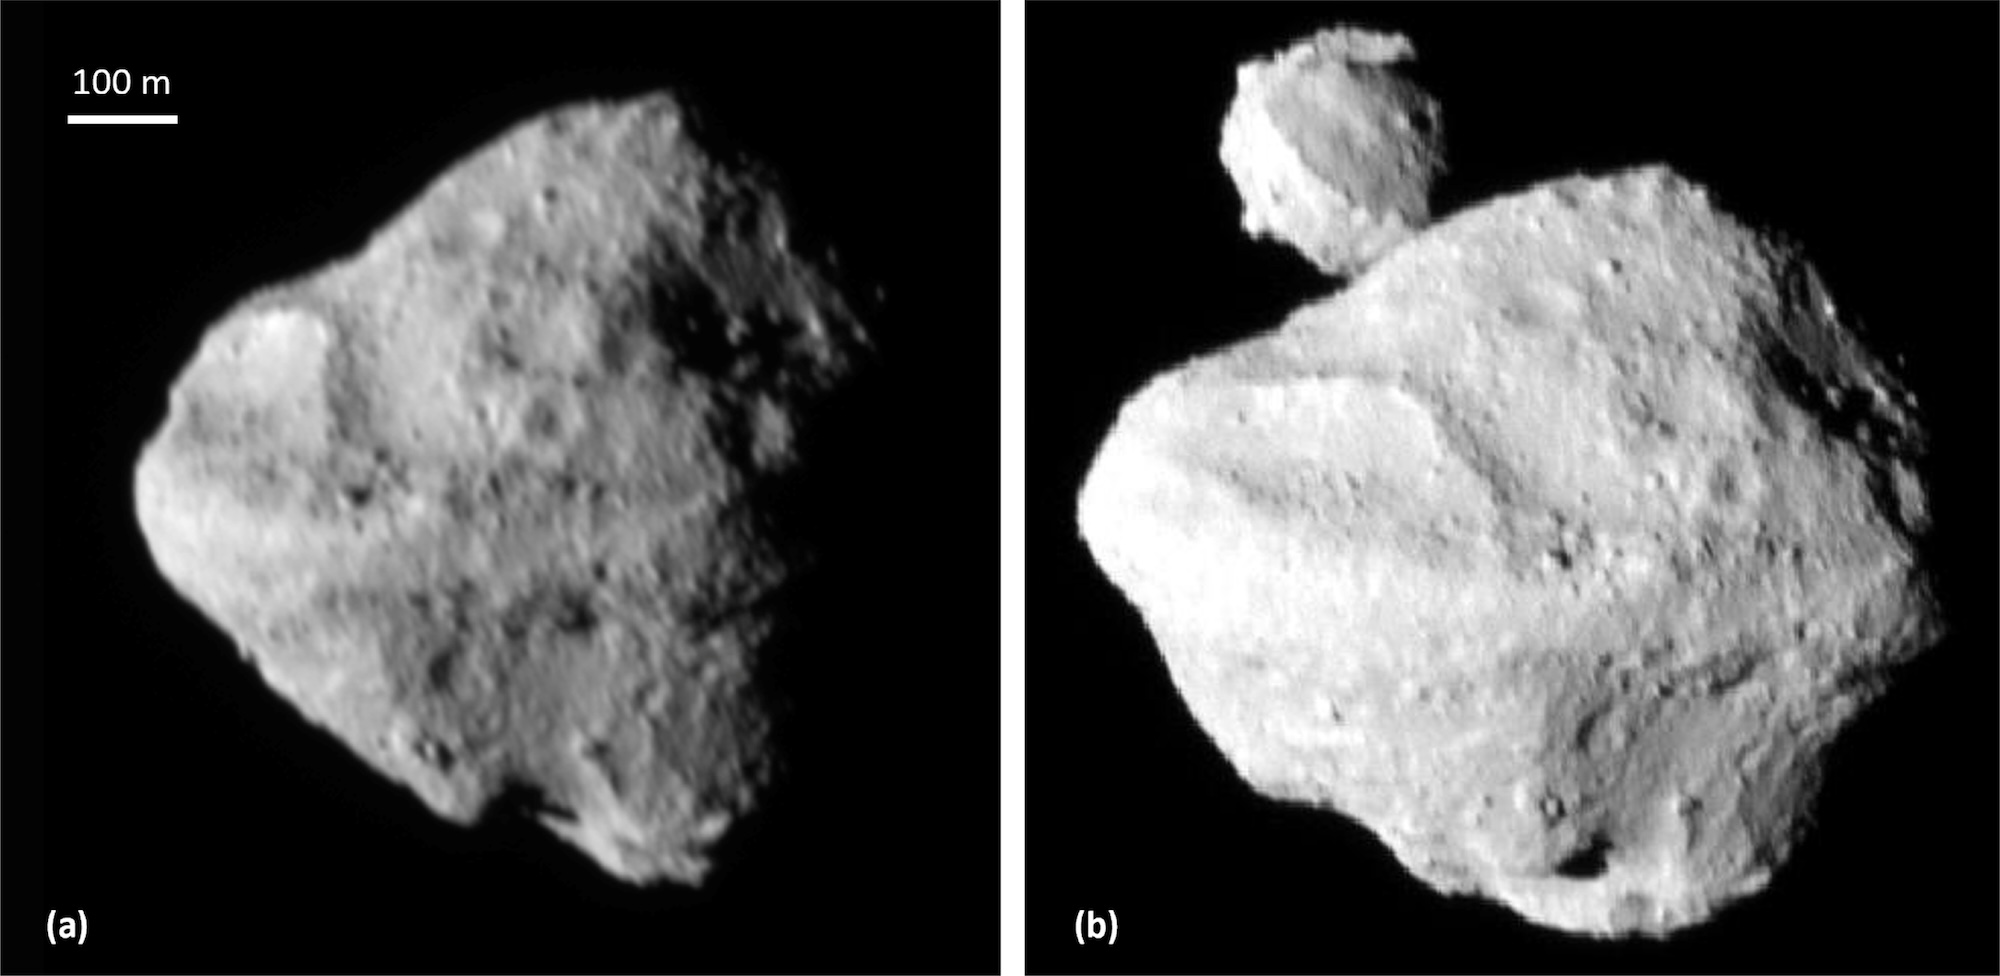
In 2021, the Lucy spacecraft embarked on a 12-year mission to study several Jupiter trojan asteroids, which share Jupiter’s orbit. The spacecraft won’t have its first encounter with a Jupiter trojan until 2027, but it hasn’t been idle during its long journey. In November 2023, Lucy performed a dress rehearsal of its trojan-encounter maneuvers during a flyby of a 738-meter-wide main-belt asteroid called (152830) Dinkinesh.
Two images of Dinkinesh from the Lucy mission. The second image features its satellite, Selam. [Bierhaus et al. 2025]
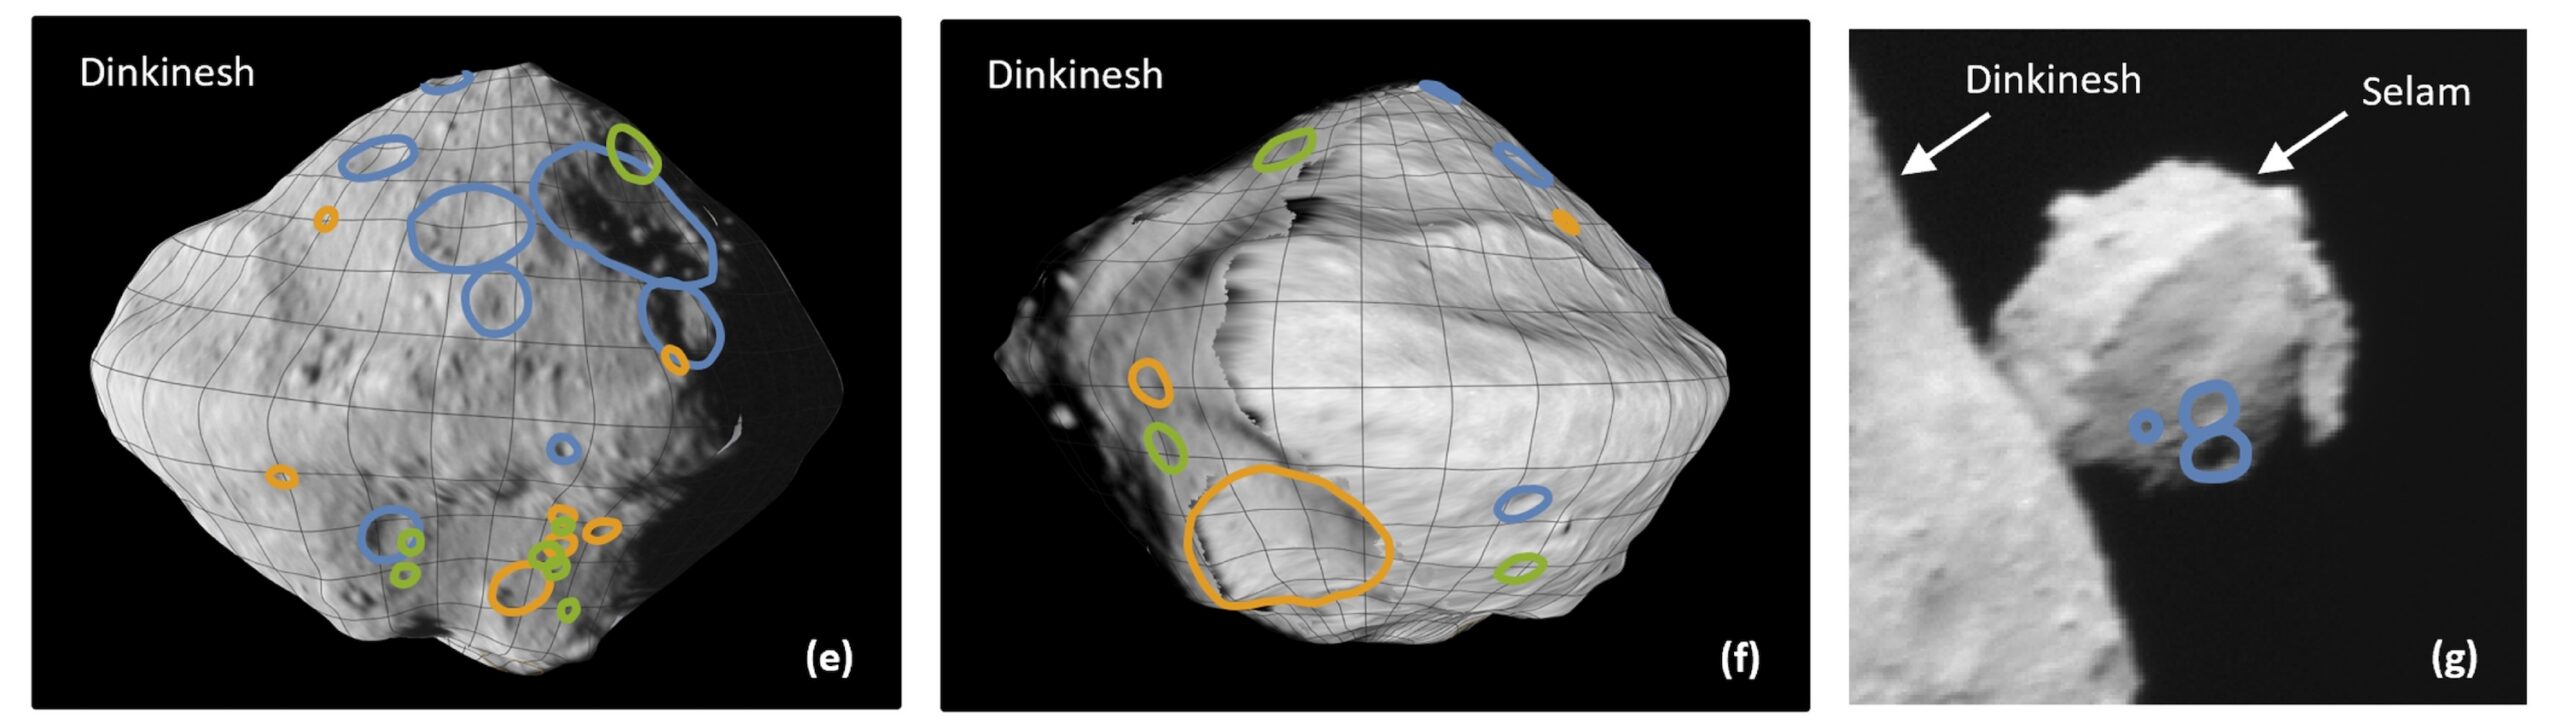
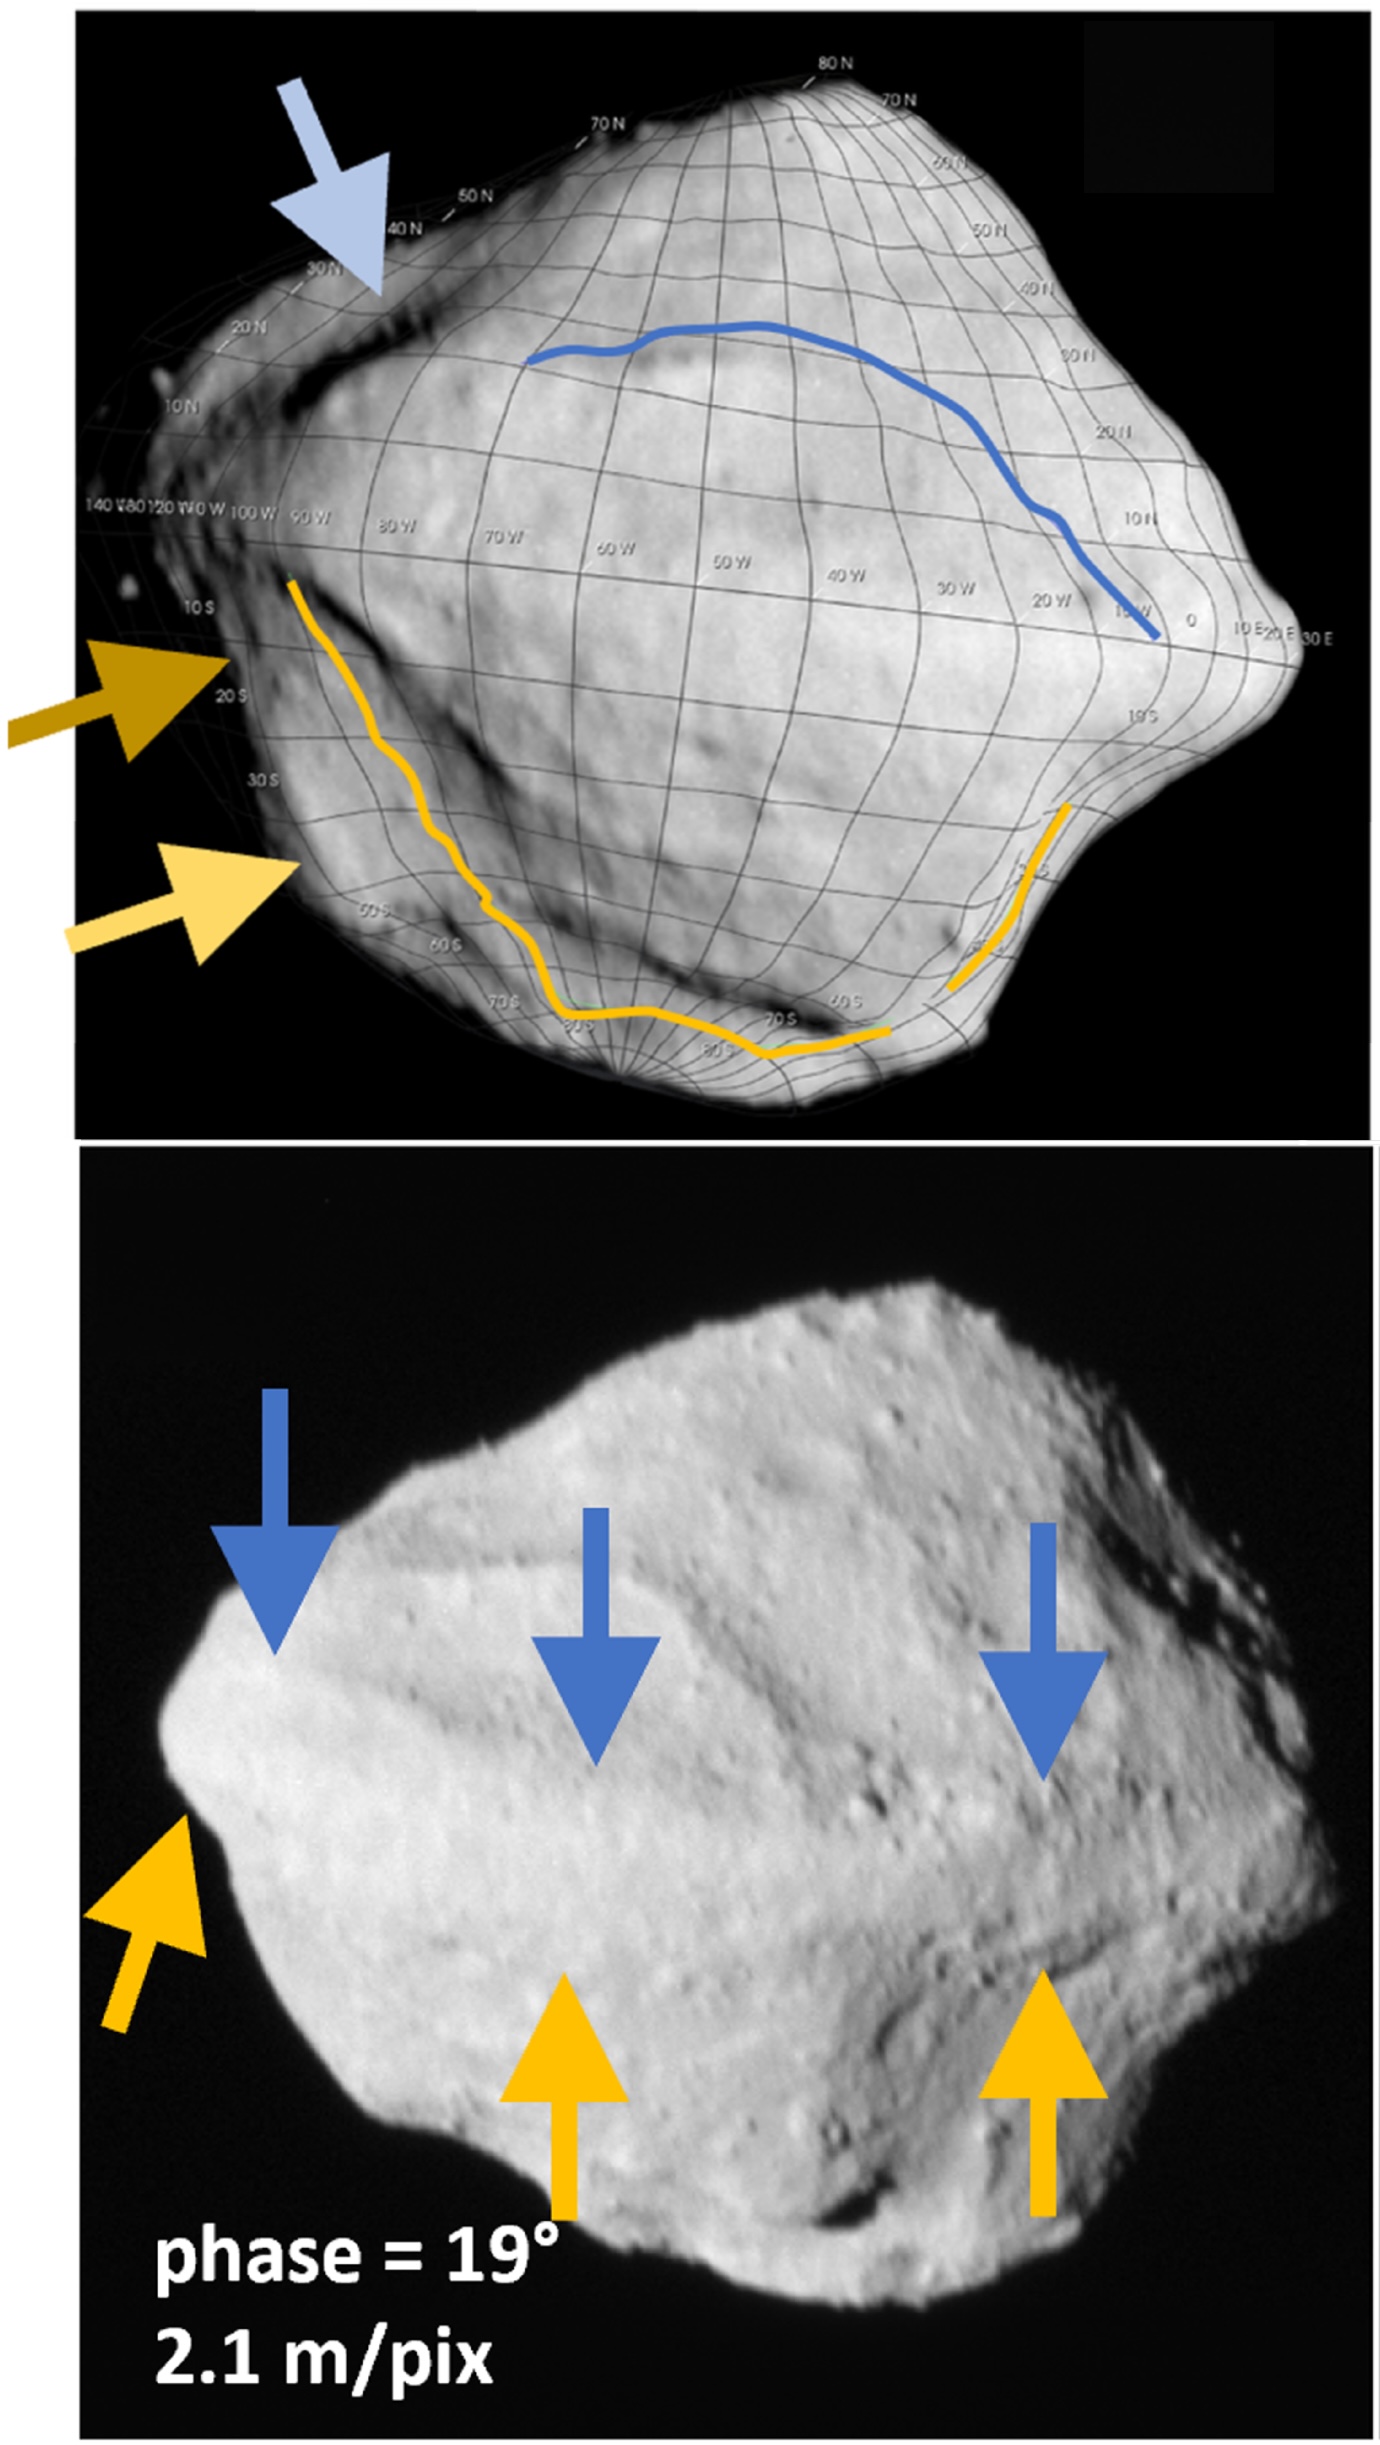
In a recent research article, Edward Bierhaus (Lockheed Martin Space) and collaborators analyzed Lucy flyby images to study the surfaces of Dinkinesh and Selam. The team analyzed global features like troughs and ridges and measured visible craters and boulders.
Locations of craters on Dinkinesh and Selam. The blue lines indicate the most confidently identified craters; orange and green lines mark craters identified less confidently. Click to enlarge. [Bierhaus et al. 2025]
The size–frequency distribution of Dinkinesh’s boulders, on the other hand, is somewhat steeper. This discovery may mean that S-type (stony) asteroids like Dinkinesh have different boulder size distributions than C-type (carbonaceous) asteroids.
An analysis of the collisional timescales in the main asteroid belt suggests that Dinkinesh is a fragment of a larger asteroid that was split apart at least once, though it’s not yet possible to say which parent body it might have come from. After splitting off from its parent asteroid, Dinkinesh appears to have been subjected to the Yarkovsky–O’Keefe–Radzievskii–Paddack (YORP) effect. This effect arises when sunlight falls on a small asymmetric asteroid, creating a torque that can alter its spin rate. In extreme cases, the YORP effect can crank up an asteroid’s spin rate so much that it sheds some of its surface material or flies apart altogether.
Locations of Sumak Fossa (top) and Fab Dorsum (bottom) indicated with arrows. [Adapted from Bierhaus et al. 2025]
With Lucy en route to its primary objective, there’s still much for us to learn from this mission about the small bodies of our solar system. In the meantime, be sure to check out the full article linked below, as there are far more details about Dinkinesh and Selam than could be included in this short summary!
“The Geology of a Small Main-Belt S-Class Binary Asteroid System: Dinkinesh and Its Contact Binary Satellite Selam as Observed by the Lucy Mission,” E. B. Bierhaus et al 2025 Planet. Sci. J. 6 299. doi:10.3847/PSJ/ae1968
The post Details on Dinkinesh and Its Surprise Satellite from the Lucy Mission appeared first on AAS Nova.
![]()
Editor’s Note: Astrobites is a graduate-student-run organization that digests astrophysical literature for undergraduate students. As part of the partnership between the AAS and astrobites, we occasionally repost astrobites content here at AAS Nova. We hope you enjoy this post from astrobites; the original can be viewed at astrobites.org.
Title: Supernova Ia Remnants with M-Dwarf Surviving Companions
Authors: Kuo-Chuan Pan (潘國全), Pilar Ruiz-Lapuente, and Jonay I. González Hernández
First Author’s Institution: National Tsing Hua University
Status: Published in ApJ
Type Ia supernovae are important tools astronomers use to measure distances in space. Despite their important role as “standardizable candles,” their origins remain hotly debated. It’s long been theorized that a Type Ia supernova can develop from one of two pathways: the single-degenerate channel or the double-degenerate channel. In the single-degenerate channel, a white dwarf and a non-degenerate star (such as a red giant or main-sequence star like our Sun) orbit each other in a close binary system. The white dwarf accretes material from the outer surface of the non-degenerate star until it reaches a critical mass and explodes. The double-degenerate channel begins instead with two white dwarfs orbiting each other. Most explosion mechanisms from this channel result in the complete obliteration of the secondary, less-massive white dwarf. However, one theoretical explosion mechanism, called the dynamically driven double-degenerate double-detonation (D6) channel, might allow the secondary companion star to survive an explosion from a double-degenerate Type Ia supernova.
Generally, due to the immense energy from a supernova explosion, we expect these surviving companion stars to be “kicked” away from the blasts at high velocities. Fortunately, astronomers have found evidence of these surviving companion stars. As covered in a previous Astrobite, three hypervelocity white dwarfs have been found in Gaia data and traced back to the locations of double-degenerate Type Ia supernovae. Given the prevalence of Type Ia supernovae, however, astronomers are led to question why we haven’t seen many more of these candidates. It’s additionally important to wonder what similar “runaway” companions might look like for the single-degenerate channel.
Recent observations by the Gaia spacecraft near the supernova remnant G272.2-3.2 show an M-dwarf star, MV-G272, with an unusually high velocity around 240 km/s and a trajectory tracing back to the center of the supernova remnant. Is it possible for this M dwarf to be the runaway companion to the remnant’s original supernova? The authors of today’s article look at simulations of potential companion stars from single-degenerate Type Ia supernovae and compare their results to this observed potential companion candidate.
Because this work focuses on the potential for M-dwarf companions, the authors explored a range of simulated companion-star masses and radii characteristic of M dwarfs: 0.5, 0.6, and 0.7 solar mass and 0.396, 0.454, and 0.483 solar radius, respectively. To make these models, they used the stellar evolution code Modules for Experiments in Stellar Astrophysics (MESA) to construct and evolve a number of simulated stars with these specifications.
After setting up the models in MESA, they used the magnetohydrodynamics code FLASH to perform 2D and 3D simulations of the supernova explosion and the subsequent impact of the exploding star’s ejecta (or hot material) on its M-dwarf companion. After the explosion and impact were modeled, the companion star’s evolution was further followed in MESA.
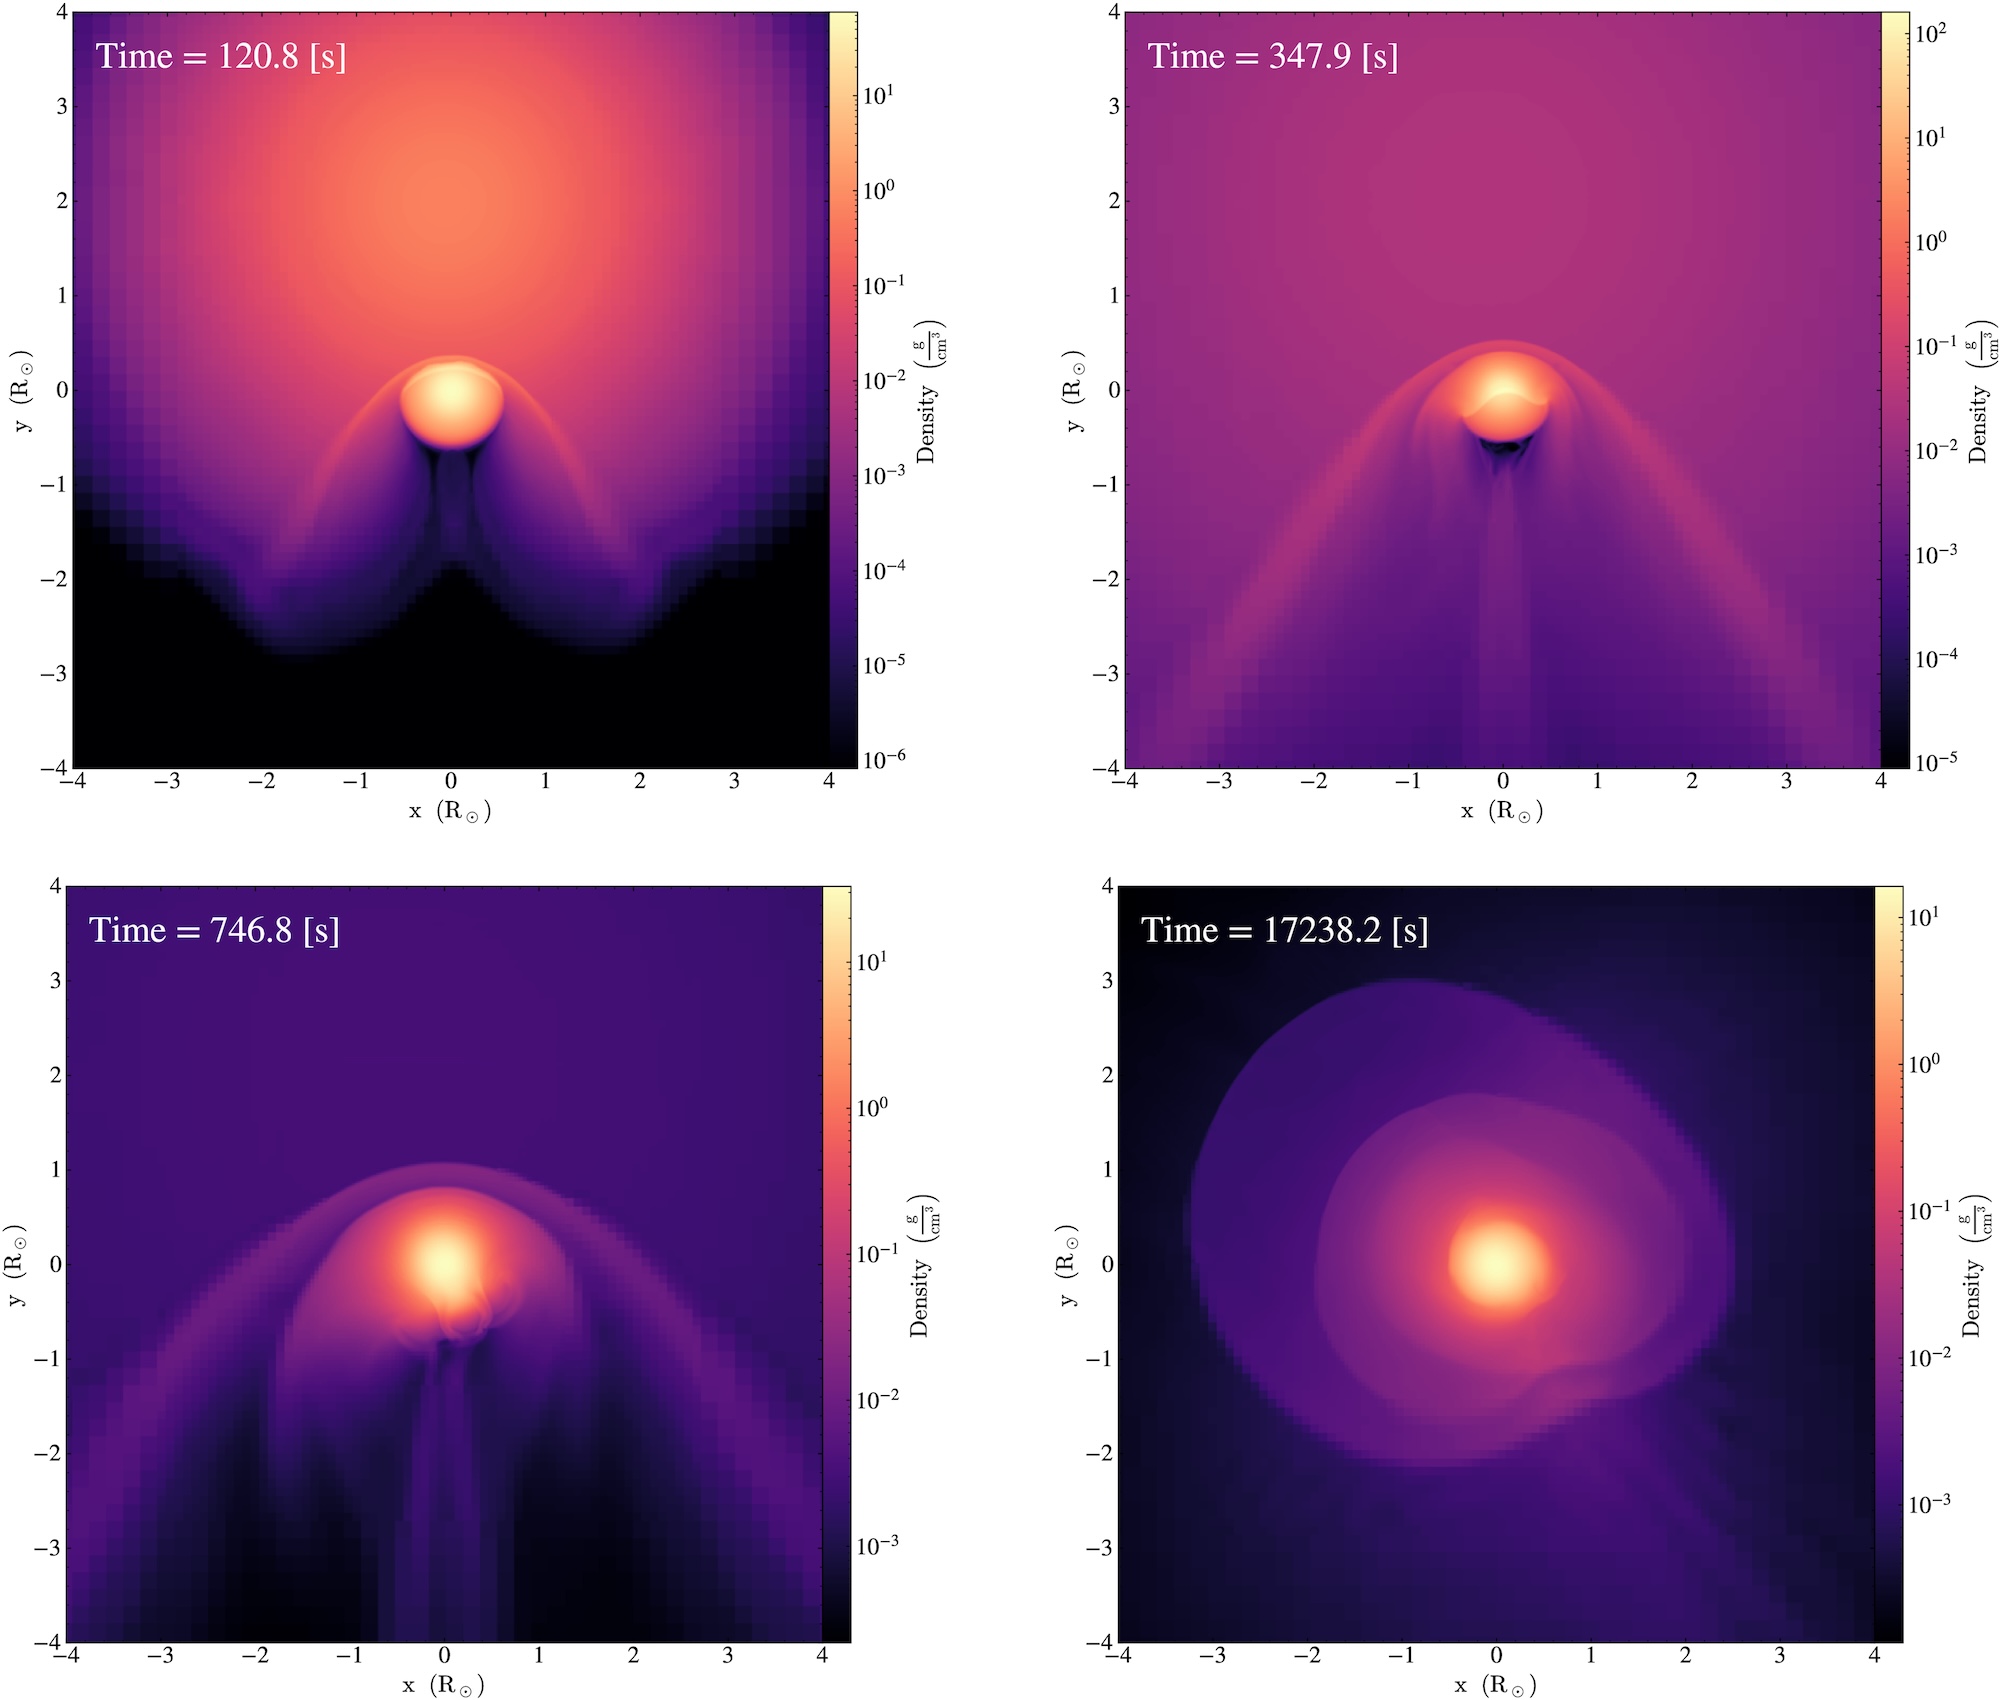
Figure 1 shows the density of the supernova’s ejecta, or exploding material, as it impacts the companion star. (You can think of this figure as if you were looking at the companion star out in space.) After roughly 100 seconds, you can see a bow shock develop around the top of the companion (or the “front” of the star) as it wraps around the companion. This impact causes significant compression of the companion star and rips away upwards of 50% the companion’s mass. The impact of this shock is what gives the companion star its “kick,” sending it hurtling through space.
Figure 1: Visual of the density of the companion star (center of each plot) and the supernova ejecta over time. In the top row of plots and the bottom-left plot, you can see the higher-density bow shock bent around the top (or front) of the companion star. In the bottom-right plot, you can see some of the supernova ejecta and unbound mass from the companion star settling around the companion star. [Pan et al. 2025]
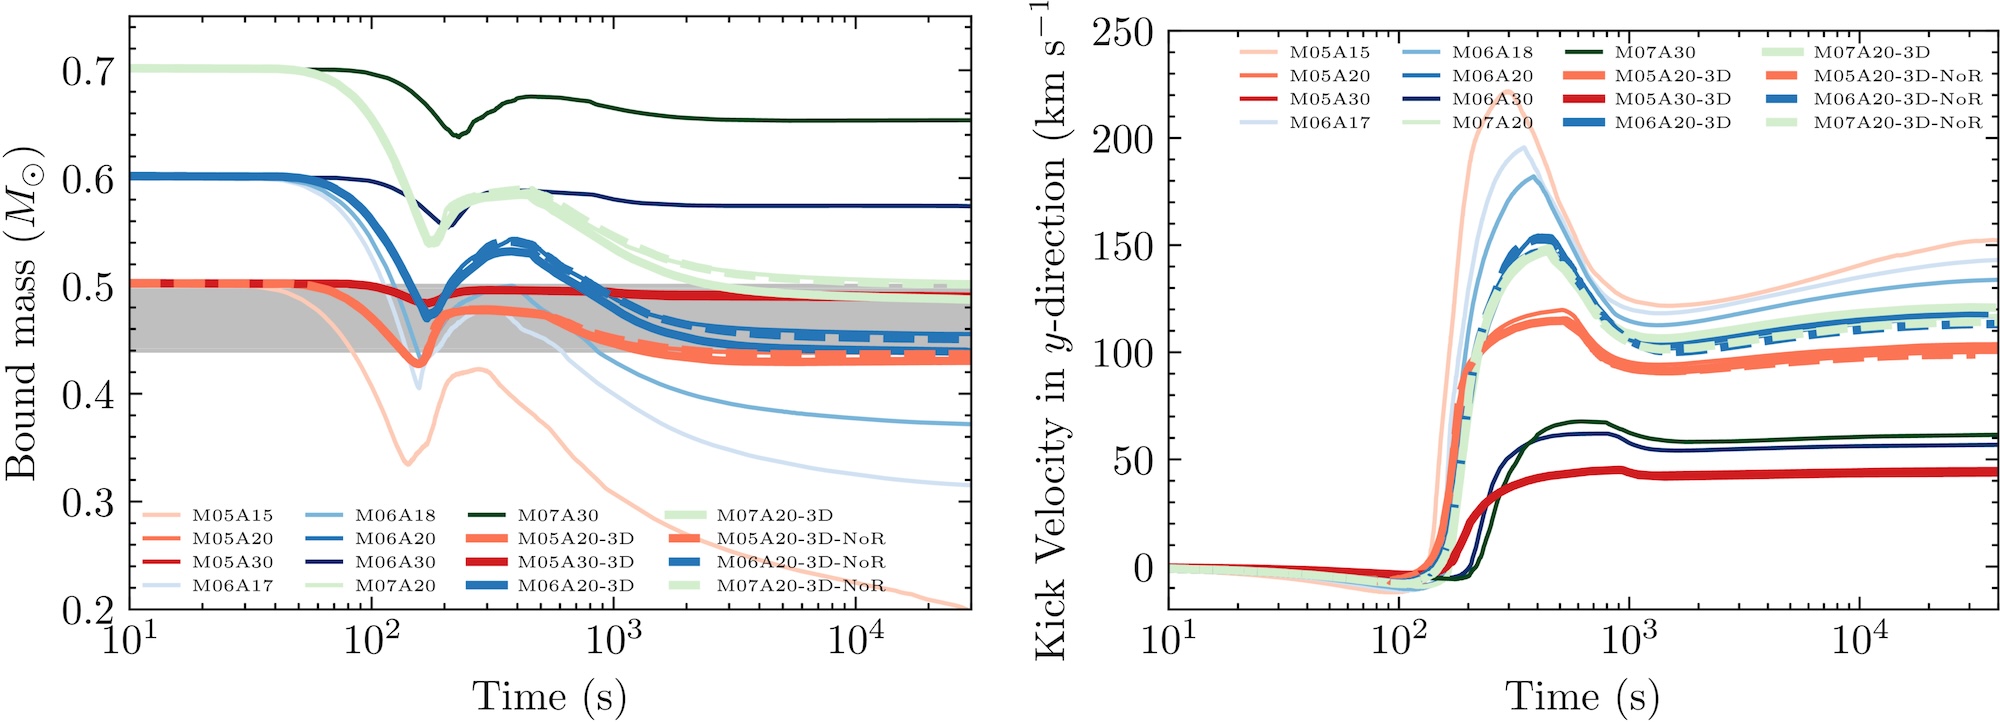
Figure 2: The different models shown in both plots indicate different initial masses and separation distances between the companion and the exploding star. Left: how the companion’s gravitationally bound mass evolves over time. The plot can be read left to right. The dip around 102 seconds indicates the impact of the supernova shock, which unbinds layers of the companion’s mass. Some of that mass becomes bound again to the companion after the shock passes. Right: how the companion star’s kick velocity changes based on initial mass and separation distance between companion and exploding star. The peak in values between 102 and 103 seconds indicates the impact, or “kick,” from the supernova. [Pan et al. 2025]
Notably, runaway companion stars of these Type Ia supernovae seem to retain information from the initial explosion. Given the final velocities of these companions, astronomers might be able to figure out the companion’s initial mass and trace back its trajectory to the system it originated from. Overall, the fact that MV-G272 has a trajectory that tracks back to the center of a supernova remnant makes it a good companion candidate. These results support the feasibility of M-dwarf runaway companions from single-degenerate Type Ia supernova systems. Now that we know what these companions might look like — and how fast they can be going — astronomers can hopefully better search for these high-velocity stars in the future.
Original astrobite edited by Catherine Slaughter.
About the author, Mckenzie Ferrari:
I’m currently a PhD student in the geophysical sciences program at the University of Chicago. While I now study the atmosphere and oceans of Earth, most of my previous research focused on simulations of Type Ia supernovae and galaxy formation and evolution. In my free time, I foster cats for a local organization, enjoy cooking, and can often be found running along Lake Michigan.
The post I Survived a Type Ia Supernova, and All I Got Was This Kick Velocity appeared first on AAS Nova.
![]()
Researchers show that the highly disrupted state of the Small Magellanic Cloud can be attributed to a long history of interactions with its neighbor, the Large Magellanic Cloud.
The Small Magellanic Cloud (SMC) is one of the largest and nearest satellites of the Milky Way. At a distance of just 200,000 light-years, the SMC has long been used as an accessible analog for low-metallicity star-forming galaxies in the early universe.
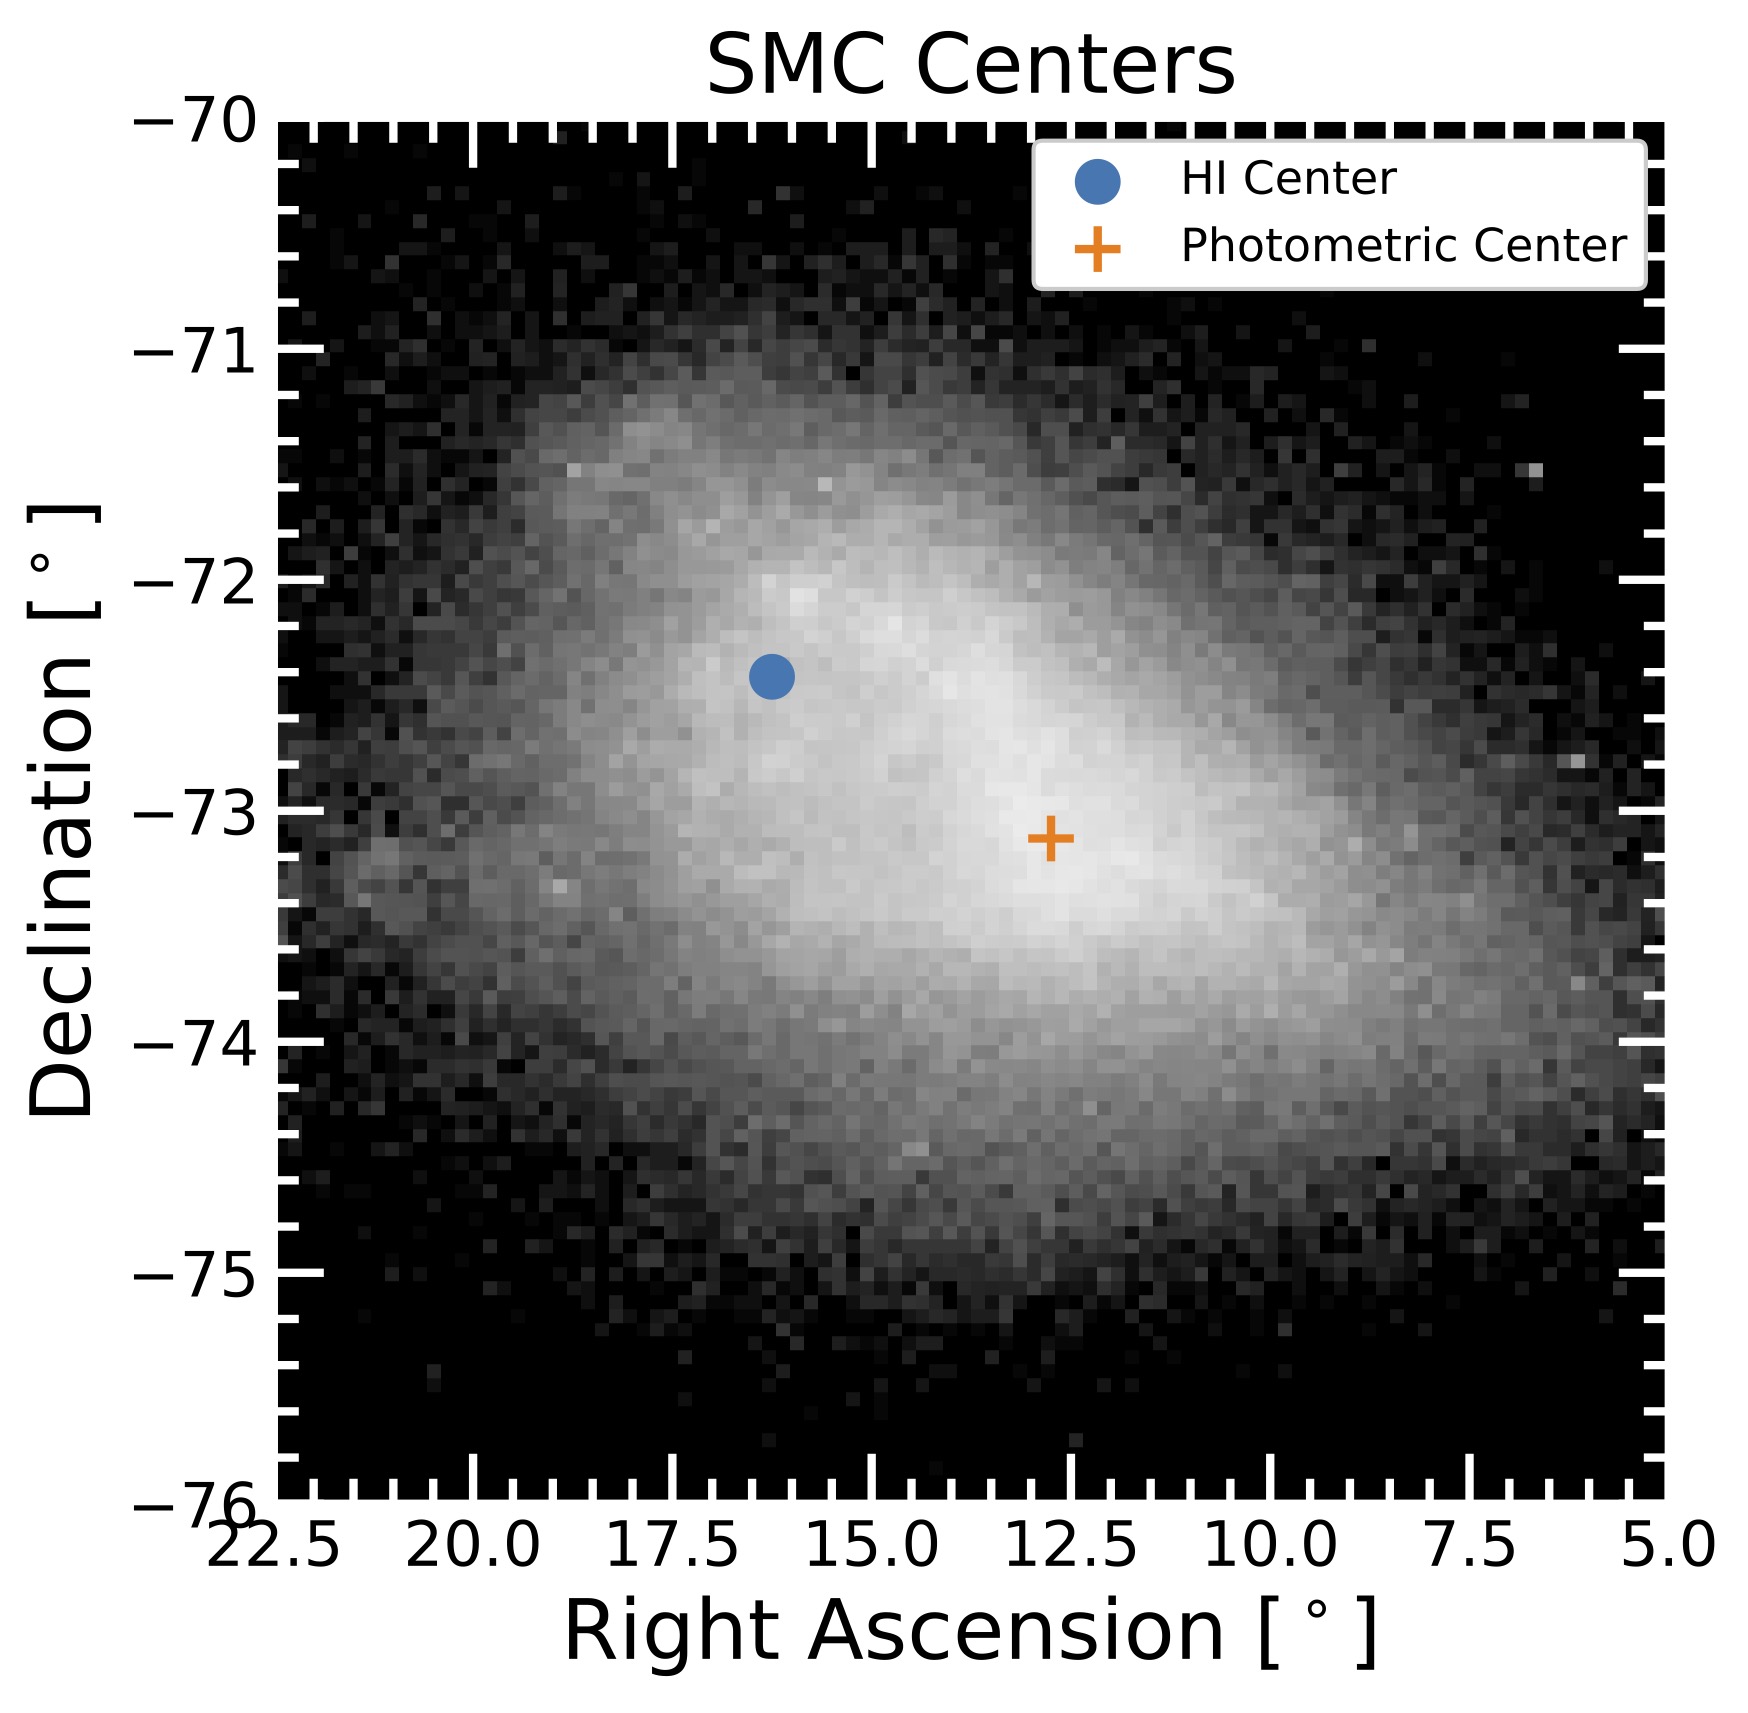
Locations of the SMC’s photometric center and hydrogen gas kinematic center. The two locations are separated by several thousand light-years. [Adapted from Rathore et al. 2026]
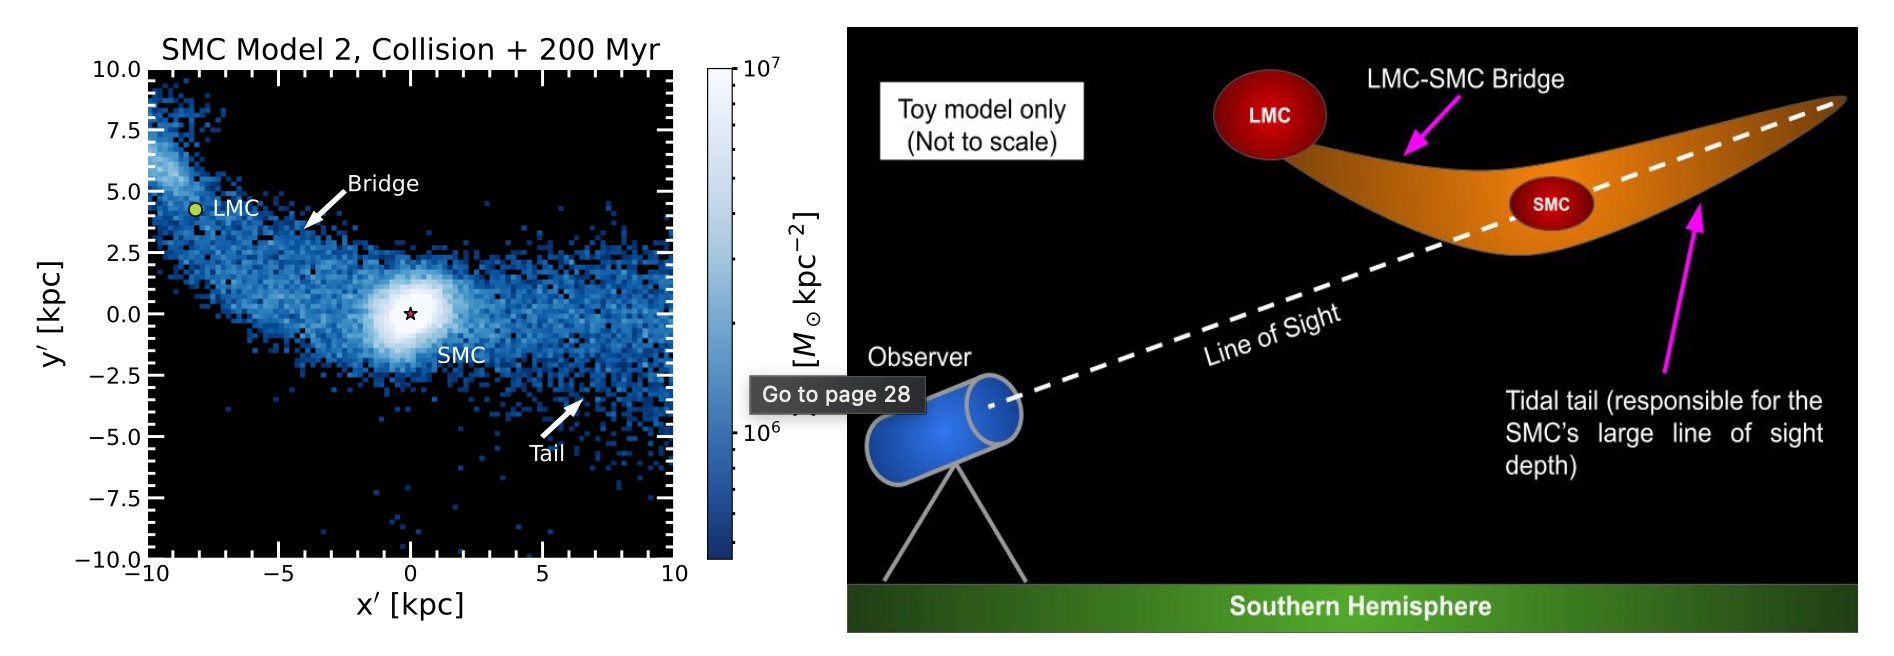
The source of this disequilibrium might be the Milky Way’s largest satellite, the Large Magellanic Cloud (LMC). As the SMC inches along its orbit around the Milky Way, it also engages in a gravitational dance with the LMC. These galaxies may be clumsy dance partners, with data suggesting a potential direct collision between the SMC and LMC within the past 200 million years.
To understand how a potential collision between the Magellanic Clouds might have impacted the present-day properties of the SMC, Himansh Rathore (University of Arizona) and collaborators used hydrodynamical simulations to explore the interconnected histories of the SMC, the LMC, and the Milky Way.
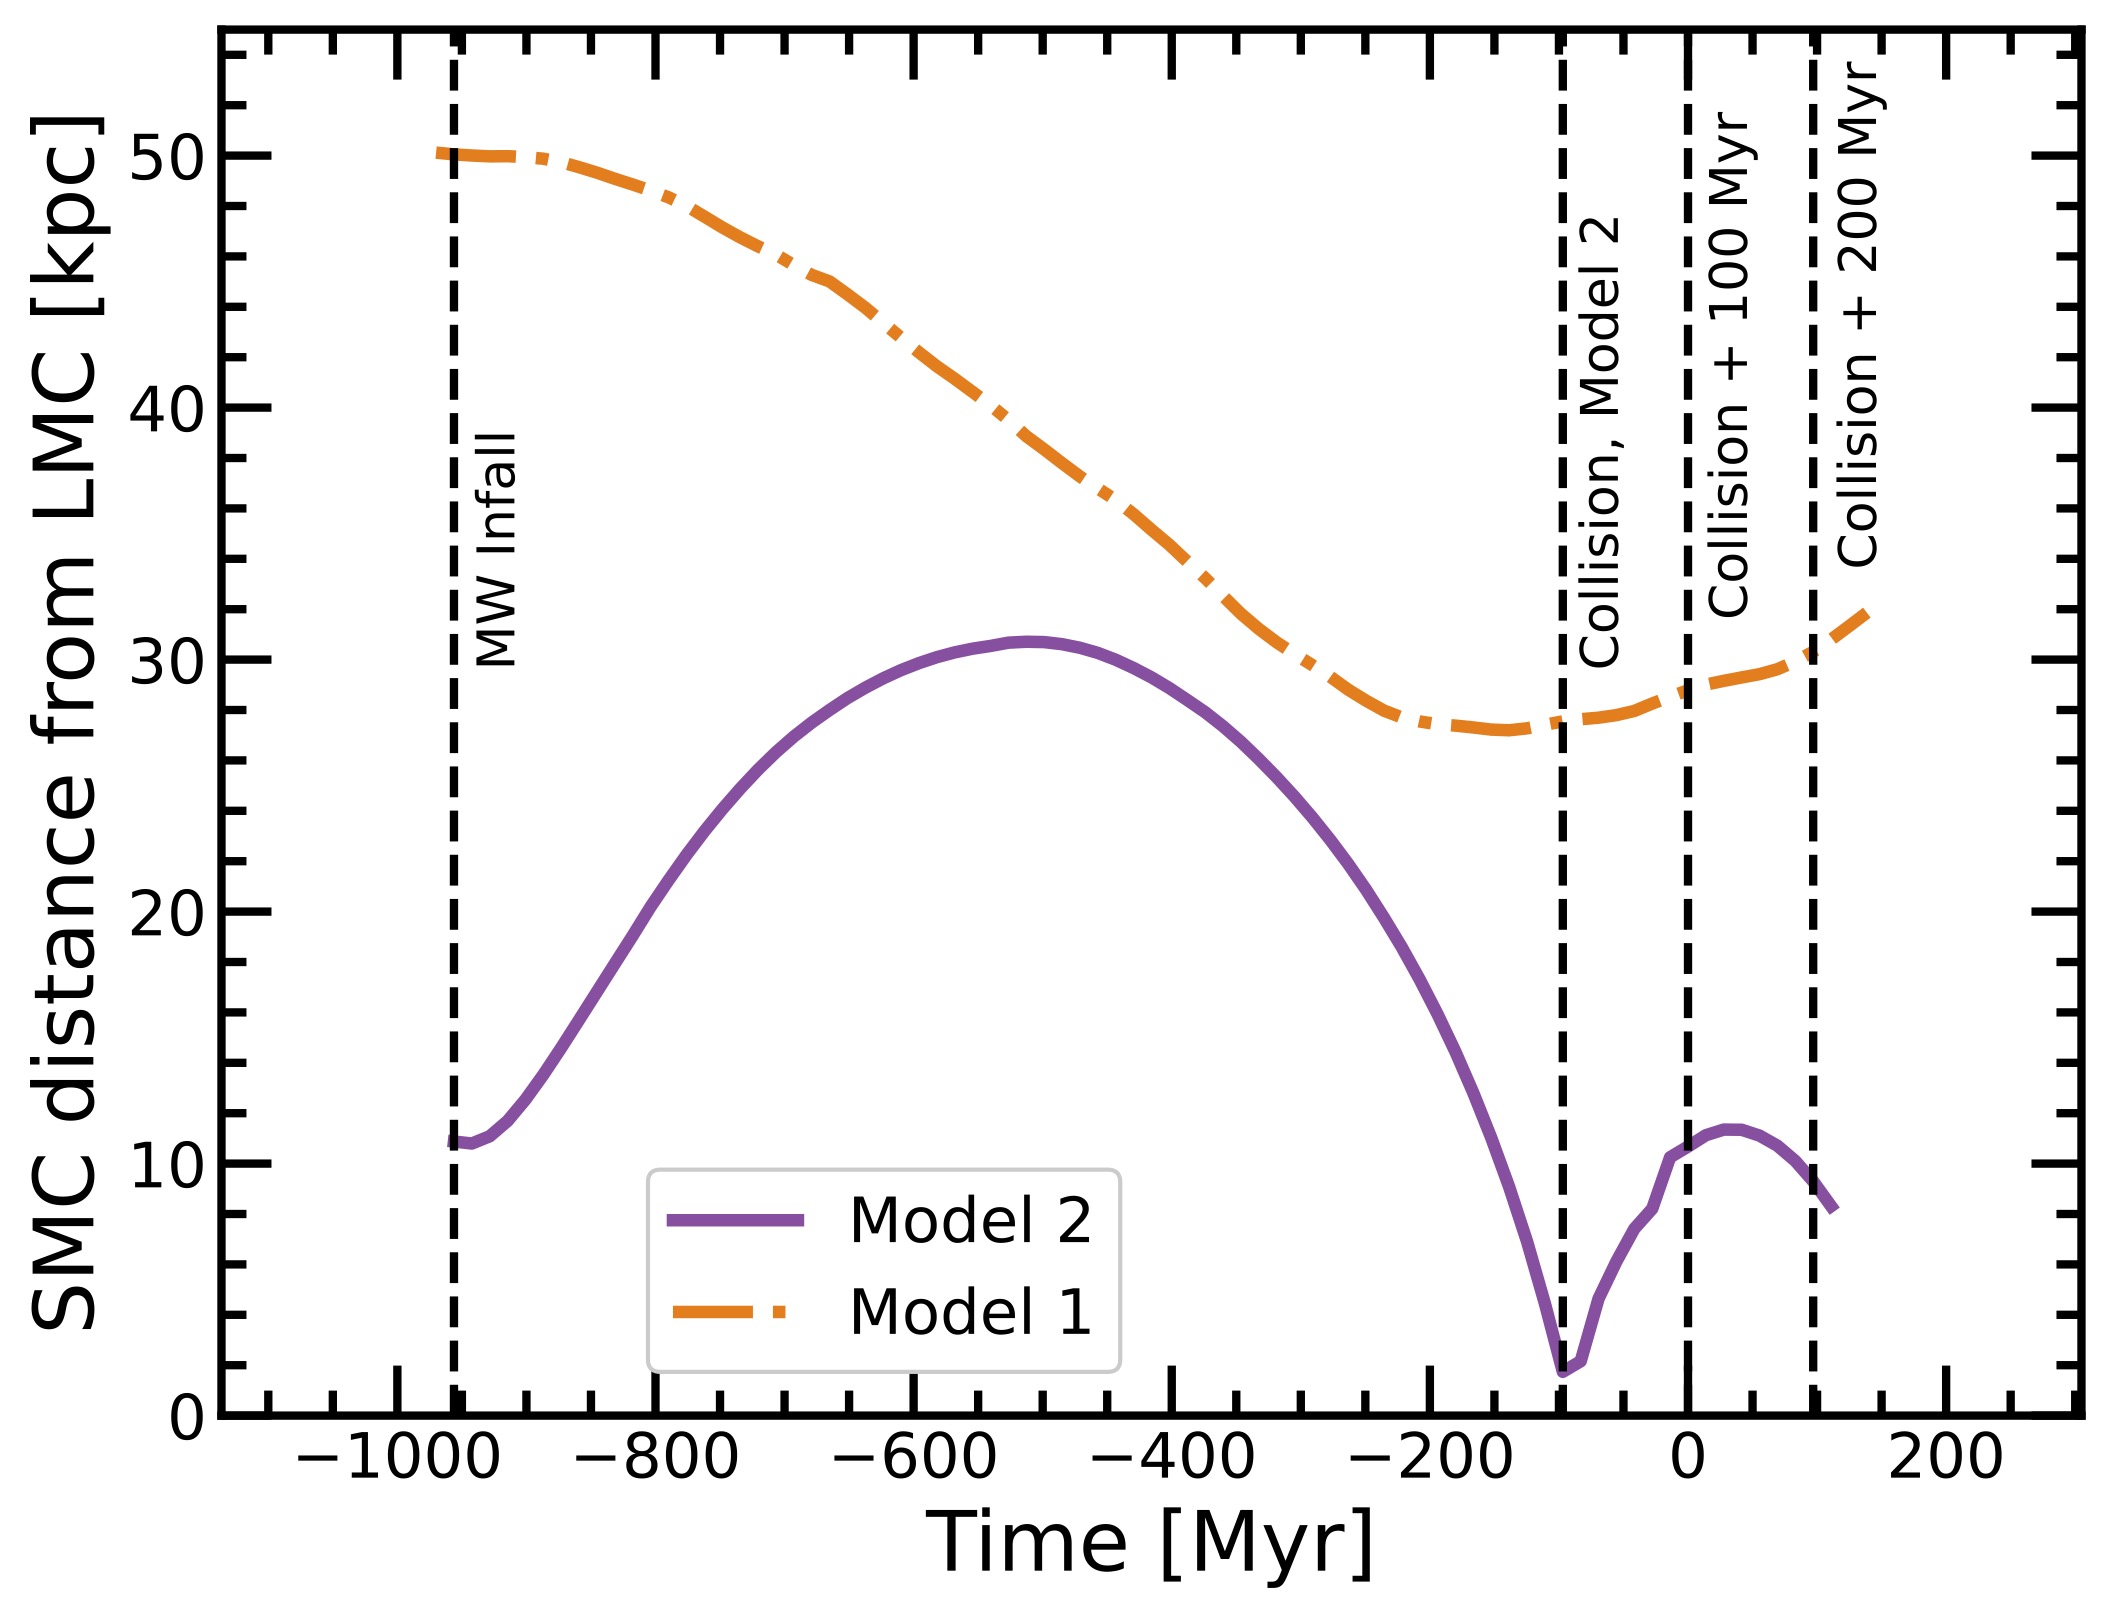
SMC–LMC separation over time in the control model (orange dot-dashed line) and the collision model (purple solid line). Click to enlarge. [Rathore et al. 2026]
Both of these model scenarios reproduced certain features of the SMC–LMC system, such as the bridge of gas that spans the distance between them. Only the collision scenario, though, can explain the apparent discrepancy between the SMC’s stars and gas.
Left: Simulated stellar density 200 million years post-collision. Right: A schematic of our likely perspective on the post-collision SMC–LMC system. Click to enlarge. [Rathore et al. 2026]
In terms of the galaxy’s rotation, only the stars nearest the SMC’s center rotate, while the rest move radially outward, swayed by the tidal pull of the LMC. This radial motion is also present in the galaxy’s gas. While previous work has interpreted the observed velocity dispersion of the SMC’s gas as a sign of rotation, Rathore’s team showed that radial expansion, viewed from an inclined angle, can mimic a rotational signature.
The team also showed that the gas is far more disturbed than the stars, reflecting the pressure exerted by the LMC’s gas when the two galaxies collided. This type of interaction can transform an irregular dwarf galaxy into an ellipsoidal or spheroidal dwarf galaxy — a transition that Rathore’s team argues is underway for the SMC.
Ultimately, these simulations demonstrate that the SMC is a profoundly disrupted galaxy, likely still reeling from a recent collision with its larger neighbor. Viewing the SMC through this lens is critical to understanding its role as an analog to early universe galaxies.
“A Galactic Transformation — Understanding the SMC’s Structural and Kinematic Disequilibrium,” Himansh Rathore et al 2026 ApJ 1000 50. doi:10.3847/1538-4357/ae4507
The post Disrupted Dwarf Galaxy: Investigating the History of the Small Magellanic Cloud appeared first on AAS Nova.
![]()
In September 2022, the Double Asteroid Redirection Test (DART) mission served as the first attempt at redirecting a near-Earth asteroid — an experiment testing humanity’s ability to fend off any threatening Earth-bound asteroids. A recent study presents the first 3D reconstruction of the impact ejecta, suggesting that the blown-out material is more complex than previous models considered.
The DART spacecraft intentionally smashed into Dimorphos, the small and unassuming moon of the larger asteroid Didymos. This space-based crash test aimed to determine if kinetic impactors like DART could successfully change an asteroid’s course through the solar system. Dimorphos’s orbit was indeed shortened by roughly 30 minutes, confirming that ramming an asteroid with a spacecraft could be a viable method of planetary defense. However, determining exactly how much an asteroid’s path will be altered is not necessarily straightforward. When a spacecraft collides with an asteroid, the impactor imparts momentum to the target, and any material excavated from the impact site can also alter the asteroid’s course.
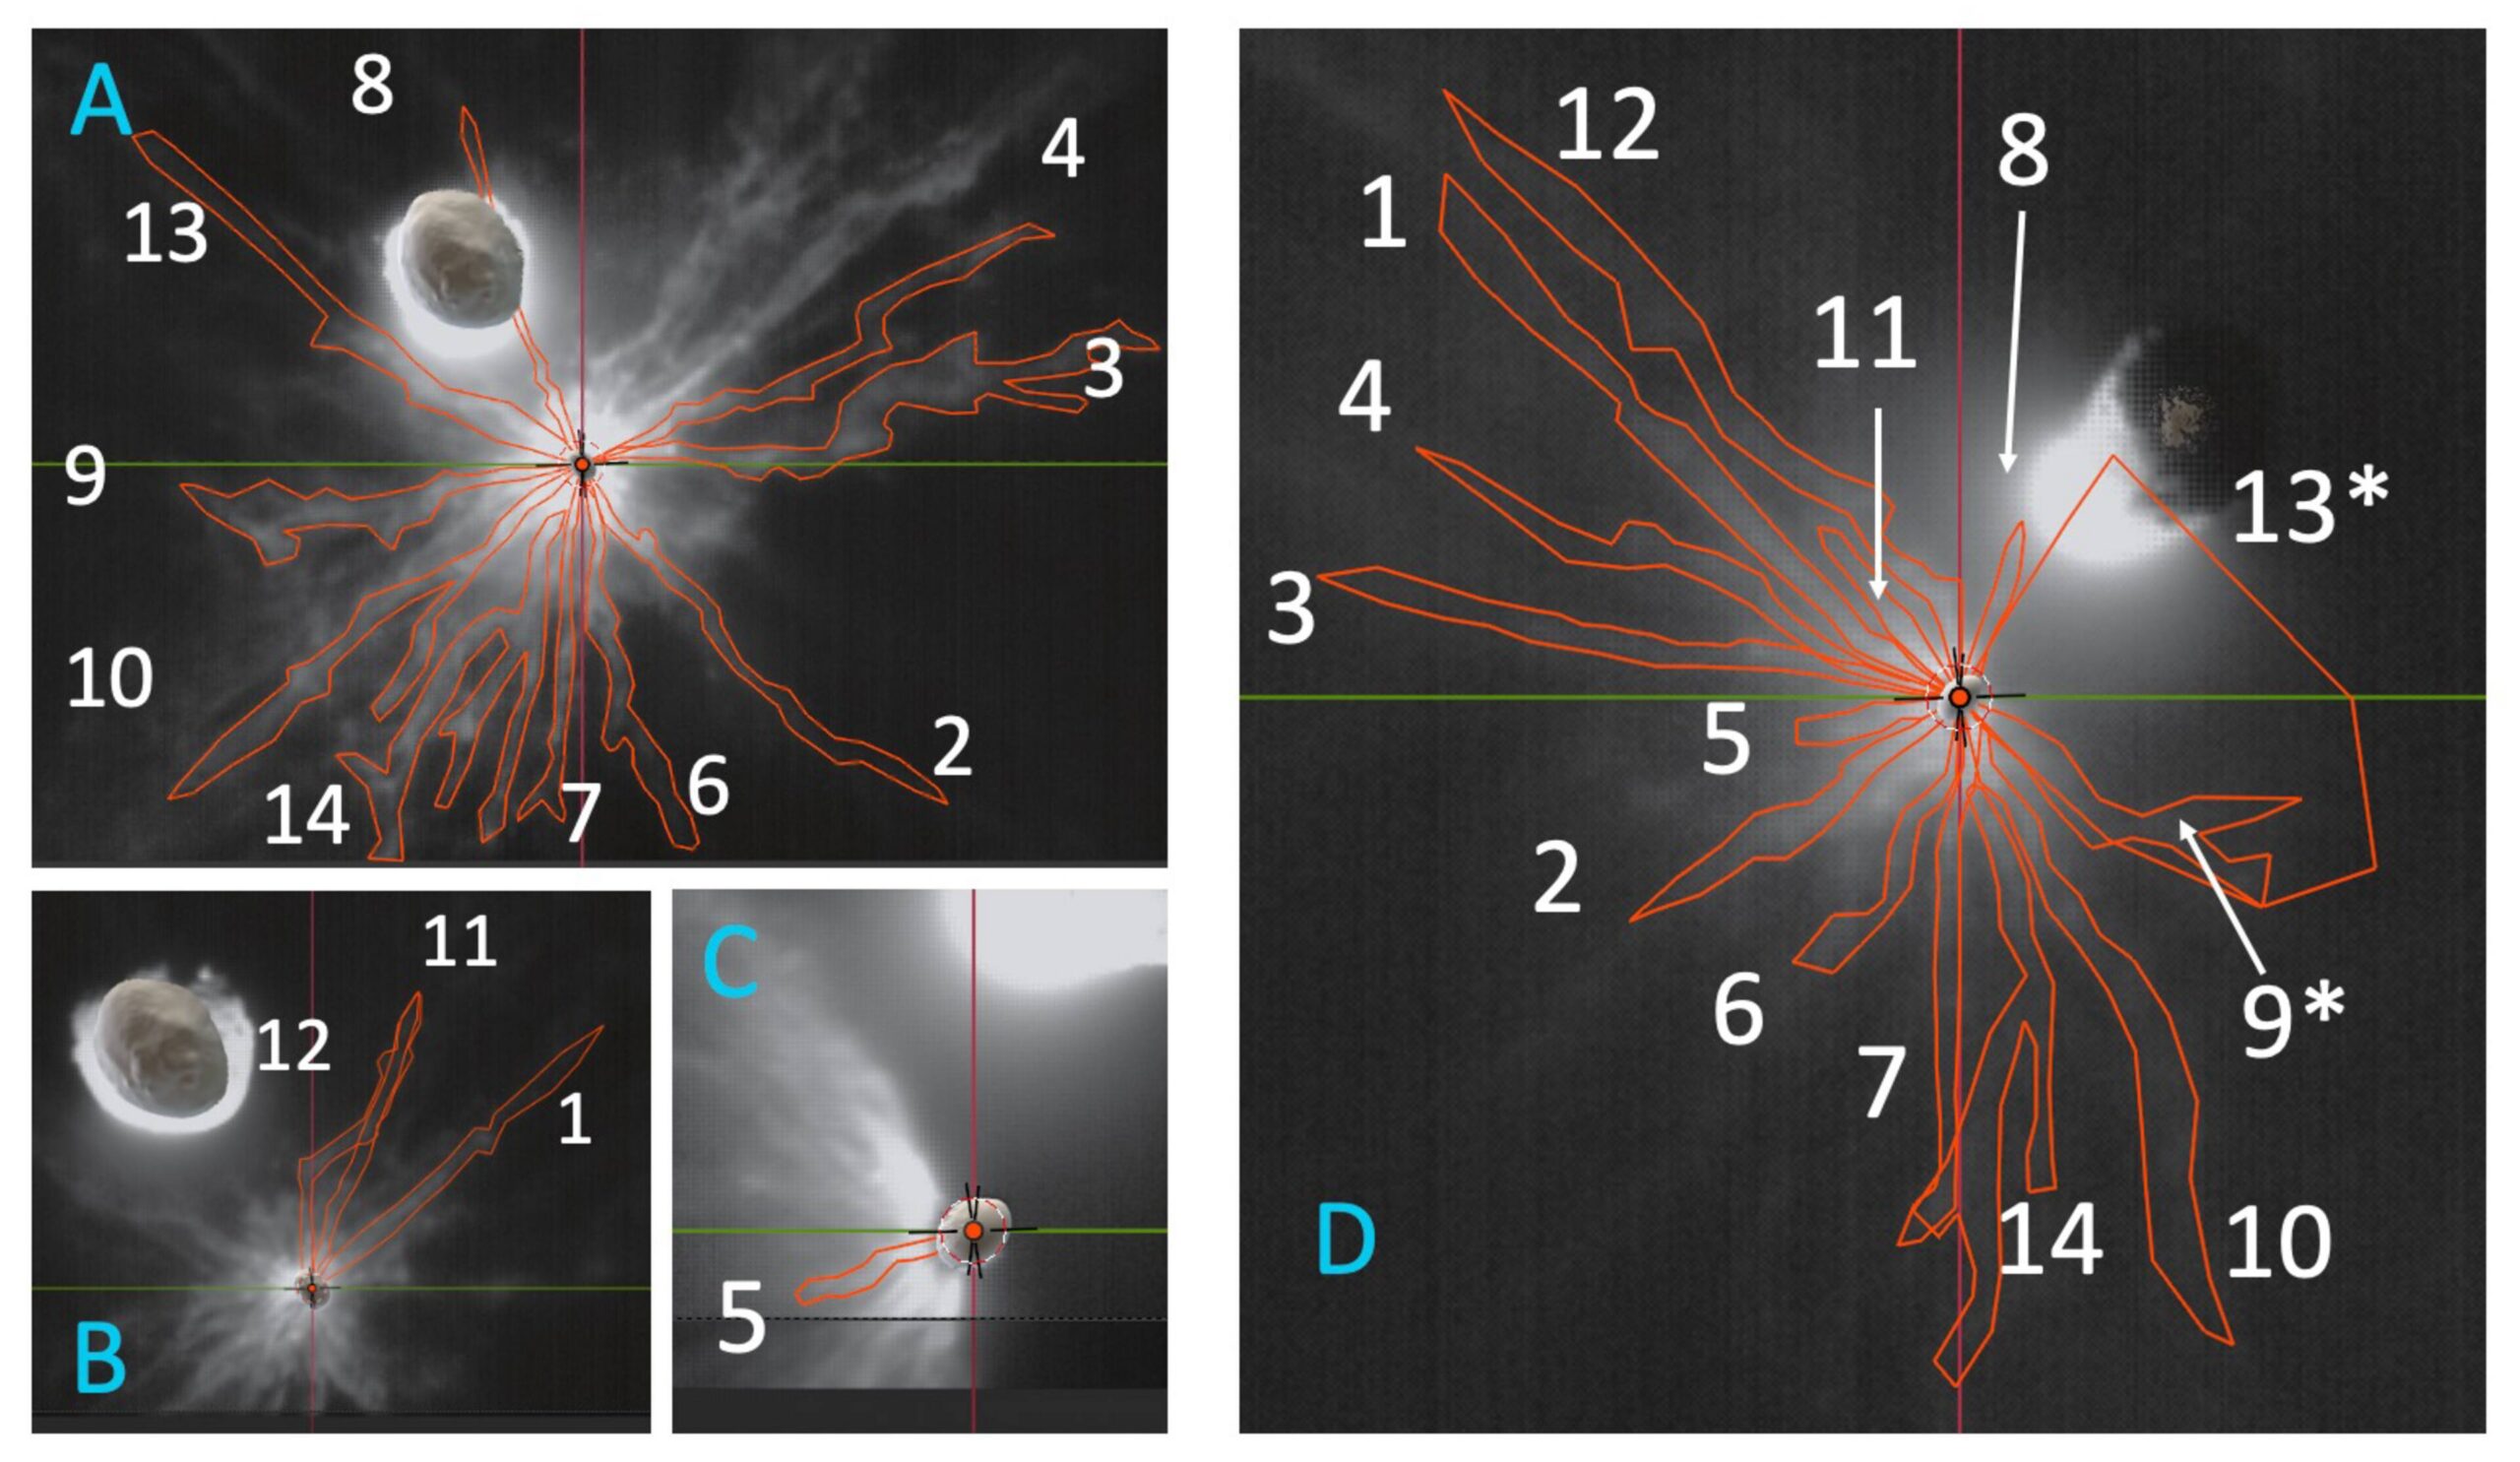
DART’s impact launched a significant spray of rubble, or what researchers call an ejecta curtain. The ejecta curtain is typically modeled as a cone, using a simple geometry to determine its contribution to momentum transfer. However, when looking closely at imaging taken soon after the collision, the real physical structure of the ejecta appears to be more complex. Untangling the true 3D distribution of the ejecta is necessary to understand how momentum was actually distributed among escaping ejecta, better estimate the total mass ejected from Dimorphos, and improve modeling of the Didymos system’s orbit after impact.
LICIACube images of the DART ejecta curtain with the 14 distinct features identified in this study outlined in red. Click to enlarge. [Deshapriya et al 2026]
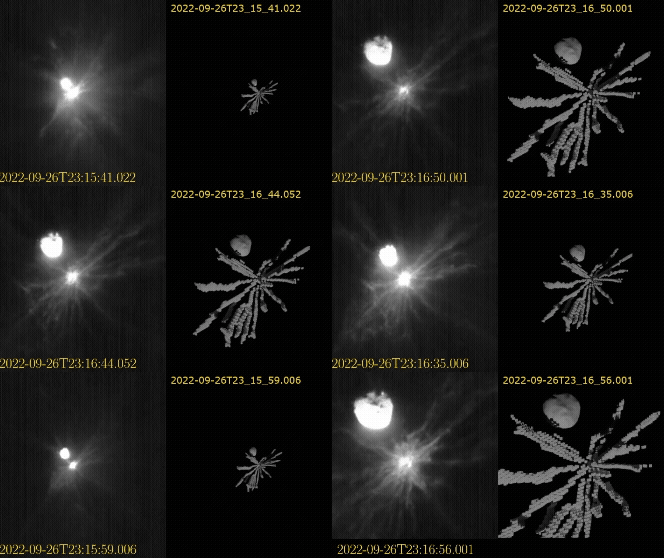
Seeking to better characterize the ejecta curtain, a team led by J. D. P. Deshapriya from Italy’s National Institute for Astrophysics used data from the Light Italian CubeSat for Imaging of Asteroids (LICIACube) that flew behind the DART spacecraft to capture images of the system shortly after the impact. After careful image handling to bring out diffuse and faint material, the researchers identified 14 distinct ejecta features across the flyby imaging. LICIACube viewed the aftermath both side on and face on, providing valuable 3D information about the distribution and motion of the ejecta.
Animation of the DART ejecta as the LICIACube spacecraft approached the impact. The left shows the images taken by the spacecraft, and the right shows the 3D model produced for the ejecta. Click to play animation. [Deshapriya et al 2026]
What does this mean for planetary defense? While simplified symmetric cone models provide helpful approximations for kinetic impactor missions, they do not fully capture the true complexity of the impact. This study shows that local variations in an asteroid’s surface and interior properties can directly influence the resulting ejecta distribution and motion. The true momentum imparted to the target asteroid depends heavily on the specific ejecta material, and these details inform how effective planetary defense missions can be in redirecting asteroids. Incorporating realistic, observation-driven ejecta distributions into modeling frameworks is essential to achieve reliable predictions for future planetary defense missions.
“3D Reconstruction of DART Ejecta at Dimorphos Reveals an Anisotropic, Filamentary Structure,” J. D. P Deshapriya et al 2026 Planet. Sci. J. 7 4. doi:10.3847/PSJ/ae2c64
The post Pulling Back the Curtain on DART Ejecta appeared first on AAS Nova.
![]()
Editor’s Note: Astrobites is a graduate-student-run organization that digests astrophysical literature for undergraduate students. As part of the partnership between the AAS and astrobites, we occasionally repost astrobites content here at AAS Nova. We hope you enjoy this post from astrobites; the original can be viewed at astrobites.org.
Title: The First Day of a Type Ia Supernova from a Double-Degenerate Binary
Authors: Gabriel Kumar, Logan J. Prust, and Lars Bildsten
First Author’s Institution: University of California, Santa Barbara
Status: Published in ApJ
Much like distance markers along the highway, Type Ia supernovae have long been used as distance indicators in space. These supernovae were originally theorized to form in binary systems. In this system, a white dwarf (a dense, collapsed remnant of a star) steals surface material from a non-degenerate star like our Sun and then explodes. Because of the initial conditions and properties of those two stars, the explosion would shine with the same intrinsic brightness regardless of the binary system’s location in space.
Research and observations, however, show that this is not entirely true; not all Type Ia supernovae are equally luminous. There are various theories regarding the different formation scenarios and explosion mechanisms that might create a Type Ia supernova. Developing ways to sleuth out the origins of these systems can be useful because it may tell us more about their luminosity.
One emerging theory of formation is the “double-detonation scenario.” In this case, two white dwarfs exist in a binary system. The more massive primary (the “accretor”) steals material from the less massive white dwarf secondary (the “donor”). After the primary steals the donor’s outer thin shell of helium, the helium surrounding the accretor detonates. This explosion induces a shock wave that travels into the dense core of the accretor and causes another detonation. The two detonations — one on the surface and one in the core — produce enough energy to explode the star into a supernova, a powerful stellar explosion. When the material from the exploding star reaches its companion star, it forms a mysterious, conical wake within the gaseous material, or “ejecta,” expelled from the accretor. This wake might be an important clue for distinguishing a supernova’s origins.
Since these explosions are incredibly powerful and would be difficult (and dangerous!) to perform in a lab, astronomers turn to computer simulations to model these events. Hydrodynamical simulations, in particular, are helpful for researchers because they model how fluids “flow” by solving complex equations that are too tricky to do by hand. (Remember that stars are just balls of gas, and hence fluid!) The authors of today’s article ran hydrodynamical simulations of the explosion and subsequent evolution of the ejecta from a double-detonation scenario.
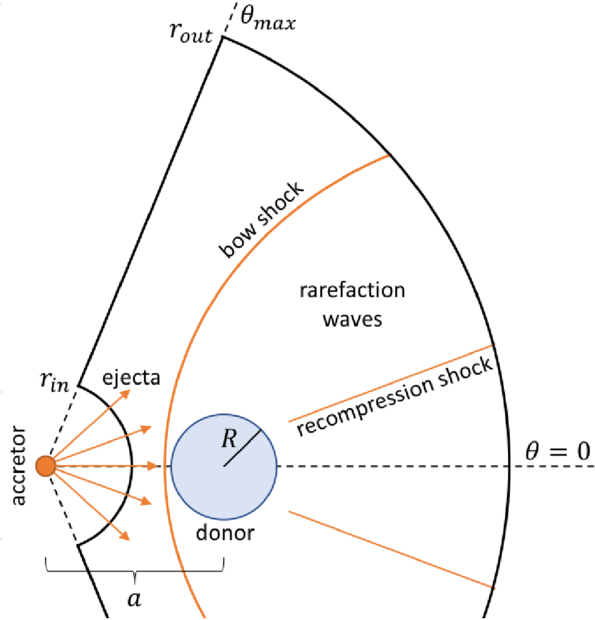
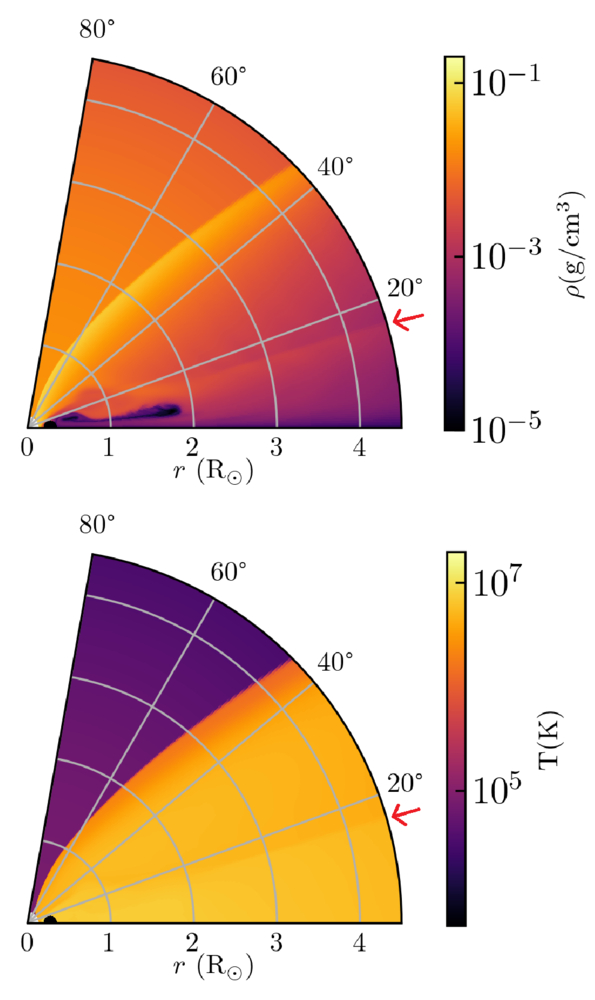
In the diagram of the team’s setup (see Fig. 1), you can see a “bow shock.” This shock is from the wave produced in the accretor’s detonation and is bowed since it bends around the donor star. This shock moves quickly through the cone of ejecta, modifies its structure, and leaves clues within the ejecta as it settles.
Figure 1: A visual schematic of the simulation setup. The accretor is the exploding star, which produces a “bow shock” from the detonation. The bow shock and recompression shock modify the structure of the ejecta, which fills the space between rout and rin. The ejecta is full of gaseous stellar material. [Kumar et al. 2025]
Figure 2: A visual “slice” of the ejecta surrounding the donor star just 200 seconds after detonation. The bottom-left corner (r = 0) has a faint white spot, indicating the donor. The density (top) and temperature (bottom) of the ejecta are shown. The faint line marked by the red arrow indicates the secondary shock from the explosion, highlighting changes in both density and pressure. [Kumar et al. 2025]
Figure 3: A slice of the simulation taken later, at 2 hours of simulation time. The ejecta in the shocked region has flown out farther than the ejecta in the unshocked region. Note that the horizontal scale has changed from Figure 2. [Kumar et al. 2025]
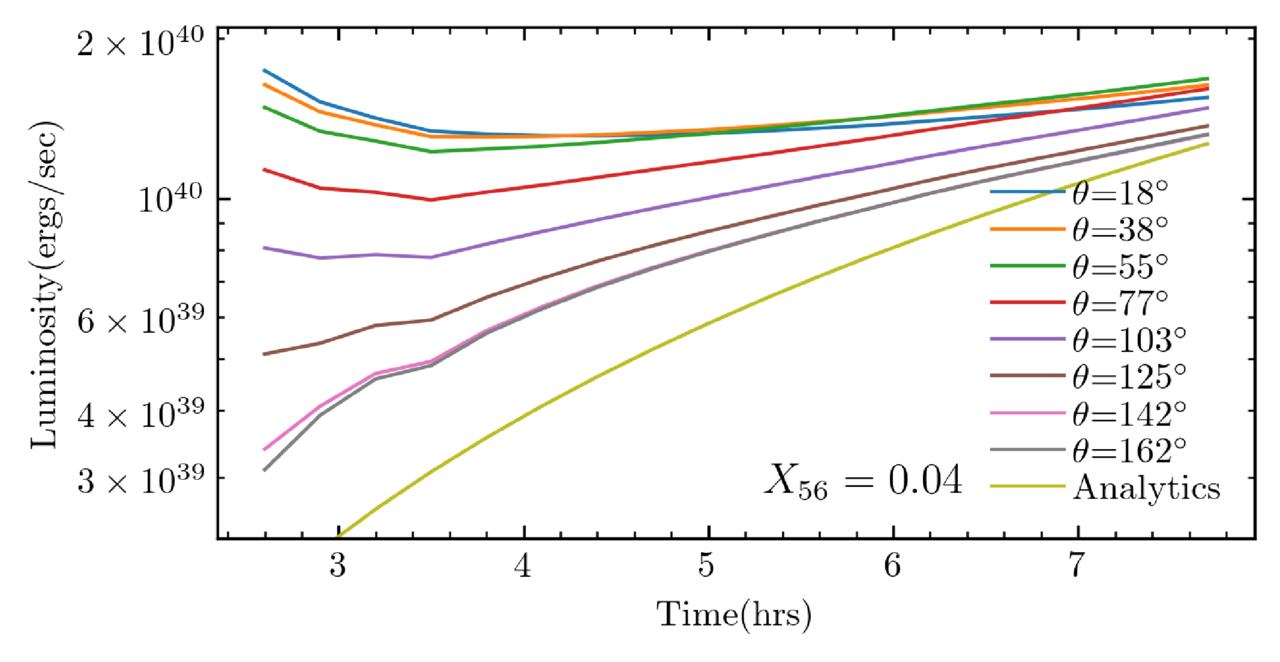
Figure 4: A comparison of luminosity vs. time over the course of 6 hours shortly after detonation. The different lines indicate different viewing angles from the axis of explosion. The line “Analytics” describes a light-curve prediction by Piro (2012) for a supernova that was not shock-heated. The luminosities for this model span almost one order of magnitude. [Kumar et al. 2025]
While there is always more work to be done, this work presents a first step at identifying double-detonation Type Ia supernovae from early observations. With an influx of observations from new observatories, like the Vera C. Rubin Observatory, we should expect to see many more early supernova detections.
Original astrobite edited by Ansh Gupta.
About the author, Mckenzie Ferrari:
I’m currently a PhD student in the geophysical sciences program at the University of Chicago. While I now study the atmosphere and oceans of Earth, most of my previous research focused on simulations of Type Ia supernovae and galaxy formation and evolution. In my free time, I foster cats for a local organization, enjoy cooking, and can often be found running along Lake Michigan.
The post Ia’m Just Getting Started: A Type Ia Supernova’s First Day appeared first on AAS Nova.
![]()
Editor’s Note: Astrobites is a graduate-student-run organization that digests astrophysical literature for undergraduate students. As part of the partnership between the AAS and astrobites, we occasionally repost astrobites content here at AAS Nova. We hope you enjoy this post from astrobites; the original can be viewed at astrobites.org.
Title: Episodic Feedback in Triple Active Galactic Nucleus Candidate SDSS J0849+1114 Revealed by Extended Ionized Gas
Authors: Xiaoyu Xu (许啸宇) et al.
First Author’s Institution: Nanjing University
Status: Published in ApJ
Galaxies are social creatures; they interact and merge (more astrobites talking about this are here and here)! When galaxies collide, the gravitational chaos acts like a funnel, driving massive amounts of cold gas toward the center. This gas rush has two major consequences: it triggers intense bursts of star formation (known as starbursts), and it feeds the central supermassive black holes, activating them as active galactic nuclei (AGNs).
But the story doesn’t end there. These powerful AGNs don’t just sit and feast on the gas. They launch high-velocity winds or jets that push back against the incoming gas, a process known as AGN feedback. (Read more about it in Astrobites here and here.) This feedback is thought to be the key mechanism by which supermassive black holes regulate their host galaxies, either by heating and expelling the gas (negative feedback, which starves star formation) or, in some cases, by compressing it (positive feedback, which promotes star formation).
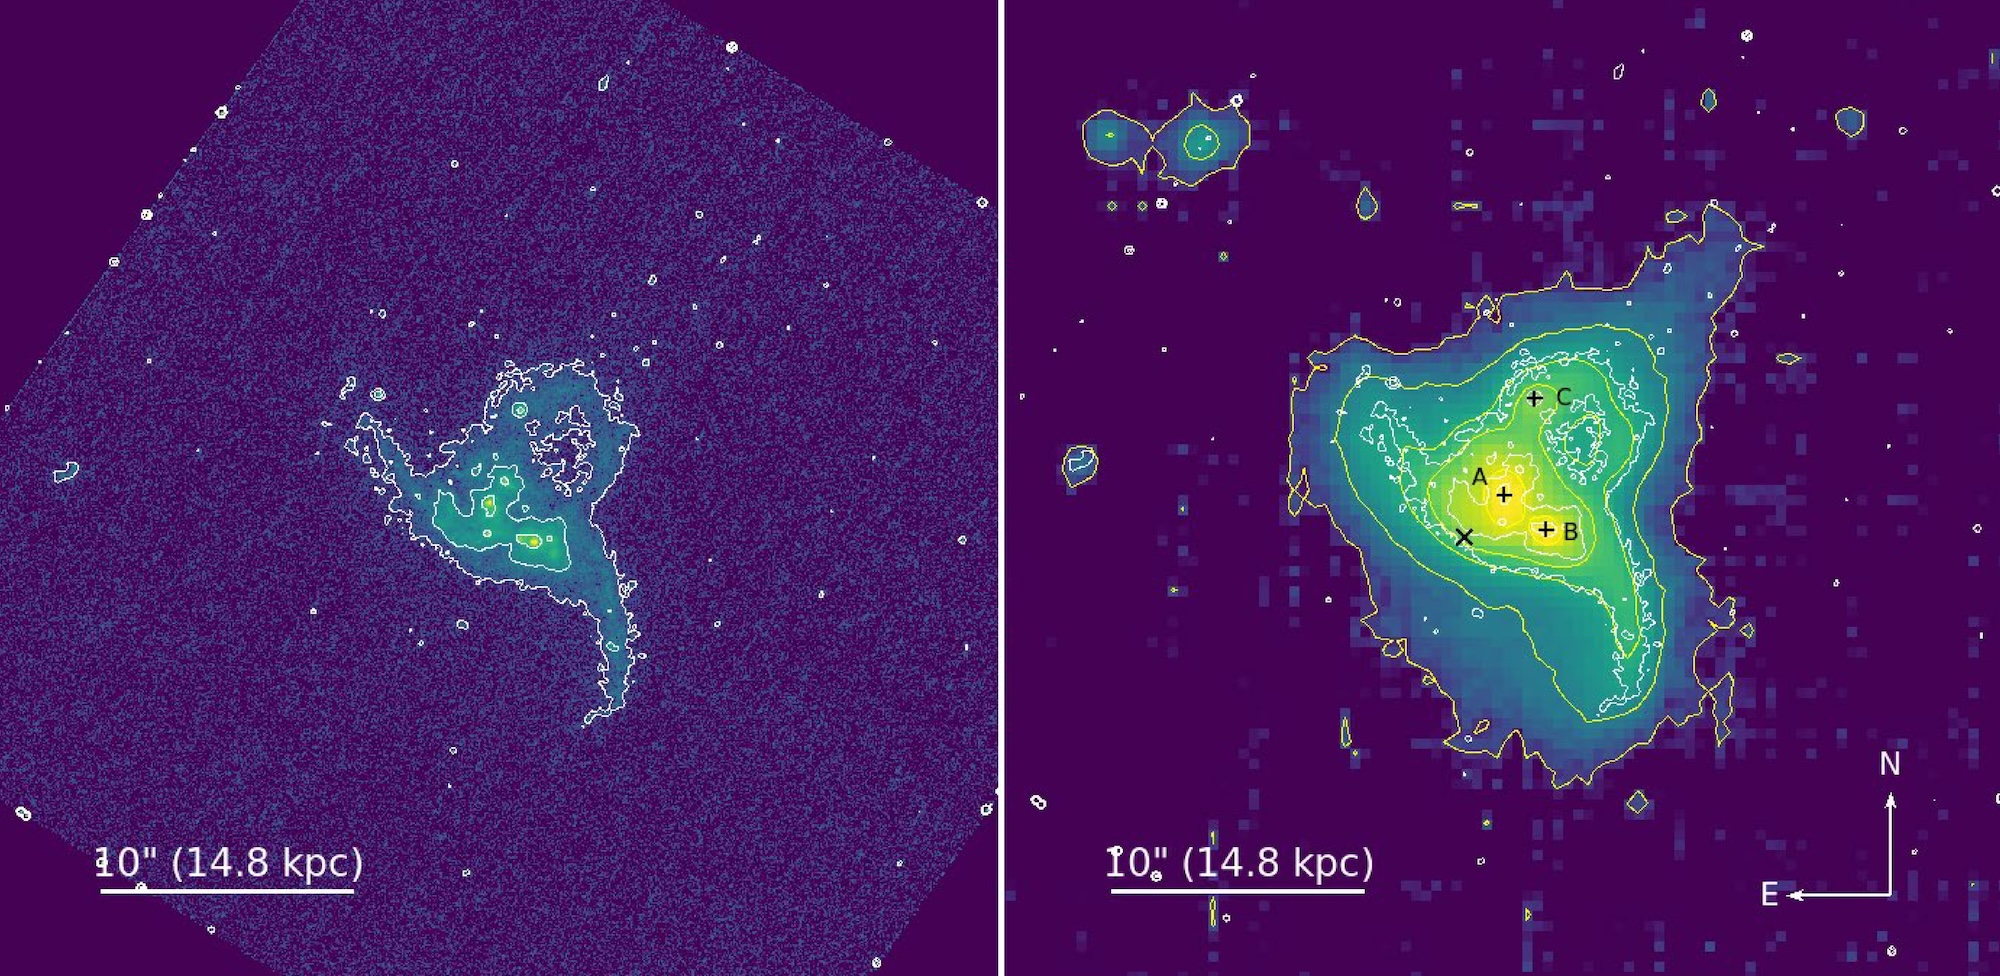
While binary AGNs (two AGNs in one merging system) are rare, finding systems with three AGNs in one system is fascinatingly rare. The galaxy SDSS J0849+1114 (J0849+1114) is one such system, featuring three Seyfert 2 AGNs, a type of active galaxy with a bright, compact nucleus whose spectrum shows only narrow emission lines, within a tight region of about 5 kiloparsecs (kpc) or 16,000 light-years. Studying this system gives us a front-row seat to how multiple black holes interact and regulate their host environment during a complex merger. Very Large Array observations reveal that nucleus A (see Figure 1) contains two jets, inner and outer. In contrast, nucleus C has one jet, providing further evidence for the presence of an AGN.
Figure 1: Left: Hubble Space Telescope image taken in ultraviolet light. Right: Optical image from the VLT/MUSE instrument. The three black holes, nuclei A, B, and C, are marked with black crosses. The white contours are from Hubble, like on the left, and the yellow contours are of the MUSE instrument. We can observe the complex and disturbed morphology resulting from the ongoing merger. [Adapted from Xu et al. 2025]
To understand the gas dynamics in J0849+1114, the authors used the Very Large Telescope (VLT) and its Multi-Unit Spectroscopic Explorer (MUSE) instrument. MUSE is an integral-field spectrograph, meaning it provides spectra for every single spatial pixel (or “spaxel”) across the field of view. This allows astronomers to map not just where the light is coming from, but how the gas is moving and what is causing it to glow, all resolved spatially across the galaxy.
The main technique employed was two-component Gaussian fitting of key emission lines like hydrogen alpha (Hα) and ionized oxygen ([O III]λλ4959,5007), which can be seen in Figure 2. The width of a Gaussian line (or its velocity dispersion) in a spectrum tells us how fast the gas is moving. A narrow line means the gas is relatively calm, with most of it moving at similar speeds. A broader line, on the other hand, means the gas velocities are more spread out — some parts are racing toward us, others away — indicating turbulence or outflows. By comparing the widths of different components, astronomers can separate quiet, rotating gas from the high-speed winds launched by the active black holes.
Figure 2: Zoomed-in spectra showing the Hβ and [O III] (left) and Hα, [N II], and [S II] (right) emission lines from the spot marked with an “X” in the MUSE image in Figure 1. The blue line shows the observed data, the orange line shows the best-fit model, and the two colored curves (light blue and red) represent the two components of the gas. The pink line shows the leftover differences between the data and the model. The First Component is narrow, representing gas that is relatively settled, often showing signs of rotation or slow movements associated with gravitational disturbances, like tidal tails (low velocity dispersion, σ1 ≤ 50 km/s). The Second Component is broad, representing highly turbulent or fast-moving gas, characteristic of powerful outflows or winds driven by the central AGNs (high velocity dispersion, σ2 > σ1). [Adapted from Xu et al. 2025]
The VLT/MUSE observations successfully characterized both the undisturbed (First Component) and turbulent (Second Component) gas across the system.
1. Galactic-Scale Tidal Tails
The slow-moving gas (First Component) revealed extended structures of ionized gas stretching over 10 kpc (33,000 light-years), and in some directions, even more than 15 kpc (49,000 light-years) away from nucleus A. These large, low-velocity gas clouds align well with features known as tidal tails: the stretched-out arms of gas and stars pulled away by the violent gravitational forces of the merger.
2. Two Distinct Outflows Driven by Radio Jets
The fast-moving gas (Second Component) clearly showed two distinct sites: outflows originating from nucleus A and nucleus C.
The most striking implication of this study relates to the timing of nucleus A’s activity. The presence of extended ionized gas far from the nucleus (in the tidal tails, >10 kpc or 33,000 light-years away) provides a fascinating glimpse into the AGN’s recent past.
The physical conditions of this distant gas were determined using emission line ratios ([O III]/Hα and [N II]/Hα) on the Baldwin, Phillips, and Terlevich (BPT) diagram. A BPT diagram uses emission line ratios to diagnose the energy source that ionizes the gas: star formation, AGN, or shocks. The BPT diagram of J0849+1114 indicates that an AGN currently photoionizes the gas.
By running sophisticated photoionization models, the scientists calculated how luminous nucleus A must have been to ionize the gas currently found 10–15 kpc (33,000–49,000 light-years) away. They discovered that this required nucleus A to be 20–100 times more luminous than it currently is! Since light takes time to travel, and the ionized gas quickly recombines (on timescales of less than 100 years for this gas), this luminous phase must have ended very recently, approximately 30,000–50,000 years ago. This is a long time for us, but just a blink of an eye on cosmic timescales.
By integrating the findings across different wavelengths and timescales, the current faint luminosity state, the past luminous state inferred from the distant gas, and the presence of radio jets of different ages, the authors propose a model of episodic AGN feedback in nucleus A:
J0849+1114 is not just a statistical anomaly as a triple AGN candidate; it serves as a crucial case study demonstrating the powerful and rapid effects of AGN feedback. High-resolution observations confirm that violent galaxy mergers trigger both powerful outflows and episodic bursts of extreme luminosity. Crucially, these outflows clear the gas and cause the central supermassive black hole to quickly fade from a luminous quasar phase to a quiet, low-accretion state within tens of thousands of years. This system provides strong, spatially resolved evidence that AGN feedback rapidly suppresses accretion onto the supermassive black hole and shapes the host galaxy on kiloparsec scales during the chaotic drama of galactic mergers.
Original astrobite edited by Lindsey Gordon.
About the author, Sowkhya Shanbhog:
I am currently a first-year PhD student at Scuola Normale Superiore in Pisa, Italy, where I am focusing on studying high-redshift quasars. Prior to this, I completed a dual BS-MS degree at the Indian Institute of Science Education and Research in Pune, India. Now, I am eager to expand my involvement in science communication and outreach initiatives. I have recently developed an interest in cooking, particularly since moving to a new city. I find solace in listening to music during my leisure time.
The post A Triple Black Hole System Caught in the Act of Self-Quenching appeared first on AAS Nova.

![]()
Traversing the galaxy from places yet known, a few interstellar objects have taken a quick dip into our solar system. These objects have inspired a frenzy of questions regarding their origins and paths that led them here. A recent study took to nearby planet-forming stellar systems as possible launching posts.
As 3I/ATLAS was first spotted entering the solar system in July 2025, all eyes turned to the curious interstellar visitor. Just the third interstellar object astronomers have observed, 3I/ATLAS joins 1I/ʻOumuamua (2017) and 2I/Borisov (2019) in capturing our attention and igniting many questions regarding their origins and journeys to our corner of the Milky Way. While astronomers have characterized these objects’ compositions, sizes, and paths through the solar system, the mechanisms by which these objects leave their origin systems and travel the galaxy before arriving here are not well constrained.
These three large bodies are just part of the interstellar material visiting the solar system — spacecraft have detected an influx of small interstellar dust particles, and while not yet directly confirmed, interstellar meteoroids burning up in Earth’s atmosphere are possible. This loose material likely originates in dusty, planet-forming disks (debris disks) around stars — rubble kicked out into interstellar space, sending chemicals, organic compounds, and perhaps even the precursors of life to other nearby systems. Understanding the origins and trajectories of such material will allow us to investigate planet formation and how developing systems may impact their environments.
Debris disks offer ideal testbeds for tracing small bodies and dusty material through the galaxy. Interactions with large planets in debris disks can launch loose material like planetesimals and dust into interstellar space. To explore how debris disks may drive interstellar visitors to our solar system, Cole R. Gregg and Paul A. Wiegert (The University of Western Ontario) simulated how much material the 20 nearest debris disks would contribute to the interstellar object population of our solar system.
Arrival direction on the sky for particles that reach the solar system from the 20 debris disks studied here. The arrival locations for 1I/ʻOumuamua, 2I/Borisov, and 3I/ATLAS are shown for comparison. Click to enlarge. [Gregg and Wiegert 2025]
Trickier to spot, smaller meteoroids (≥200 microns) that would appear as meteors in Earth’s atmosphere are also expected. The only way to observationally confirm interstellar origins for meteors is based on how fast they are moving relative to the material in our solar system, or their excess velocities. Based on the simulations, many of these smaller particles have low excess velocities, making them observationally difficult to distinguish from bound solar system objects.
Zoomed-in view focusing on the direction where 1I/ʻOumuamua entered the solar system. The interstellar object falls near the arrival directions of particles from HD 38858 and HD 166. Click to enlarge. [Gregg and Wiegert 2025]
Where are the expected interstellar meteoroids? Current meteor detectors including the Canadian Meteor Orbit Radar (CMOR) and the Global Meteor Network (GMN) search the sky for incoming material. While the simulations predict hundreds of meteoroid-sized particles from each debris disk currently in the inner solar system, the small collecting area of CMOR and the limiting size of grains detectable by GMN statistically require decades of observations to detect even a single interstellar meteoroid. Thus, the lack of detections thus far is not surprising, but with advanced instrumentation, discoveries of more interstellar particles and objects are imminent.
“A Catalogue of Interstellar Material Delivery from Nearby Debris Disks,” Cole R. Gregg and Paul A. Wiegert 2025 PSJ 6 309. doi:10.3847/PSJ/ae284f
The post We Have Visitors: Interstellar Material from Nearby Debris Disks appeared first on AAS Nova.
![]()
Editor’s Note: For the remainder of 2025, we’ll be looking at a few selections that we haven’t yet discussed on AAS Nova from among the most-downloaded articles published in AAS journals this year. The usual posting schedule will resume January 2nd.
Red ellipses overplotted on the first eight rings identified with Hubble in the Bullseye galaxy. Click to enlarge. [Pasha et al 2025]
Galaxy mergers and interactions are commonplace in the universe, but it is very rare for a dwarf galaxy to strike right through a large galaxy’s core. When this does happen, the collision sends shock waves through the impaled galaxy, sweeping gas and dust outward and forming rings where star formation can occur (hence the name, collisional ring galaxy). These galaxies are valuable sites to explore galactic structure and evolution as well as provide a unique case to study galaxy mergers and interactions. Previously discovered collisional ring galaxies have at most two or three rings, so when Pasha and collaborators found the stunning nine in the Bullseye, it was clear they caught something significant.
Why does the Bullseye have so many rings? Theoretical studies of these head-on collisions predict that many rings will form and travel outward after the initial crash; however, the rings tend to dissolve after only a few hundred million years. Catching this collision only 50 million years after it happened means we are witnessing the earlier stages of the Bullseye’s evolution. This lucky discovery not only confirms theoretical predictions for collisional ring galaxies, it also may be a clue to how another unique galaxy type, giant low-surface brightness galaxies, originate. Given the wispy ring material found at very large radii from the Bullseye, the authors suggested that collisional ring galaxies may evolve into giant low-surface brightness galaxies as they expand outward and fade. Further investigation and a larger sample of collisional ring galaxies are necessary to confirm this hypothesis, but the Bullseye provides interesting and critical observational evidence of these predictions for the first time.
Imad Pasha et al 2025 ApJL 980 L3. doi:10.3847/2041-8213/ad9f5c
The post Selections from 2025: The Nine-Ringed Bullseye Galaxy appeared first on AAS Nova.