Curiosity Blog: Sols 4913-4919: Planetary explorers, freewheeling to the Yardang unit!
Navcam image from sol 4916 showing the rough drive direction. The yardang unit can be seen as a series of pale coloured hills in the centre of the image, at the very back.
NASA/JPL-Caltech
Written by Catherine O’Connell-Cooper, APXS Strategic Planner and Payload Uplink/Downlink Lead, University of New Brunswick, Canada
Earth planning day: Friday, June 5th, 2026
In a very broad sense, Curiosity has two modes of doing science – one centred around a defined science campaign (such as the recent boxwork campaign) and the other as we move between campaigns. During a science campaign, with a very defined start and end location, every image and every workspace is carefully choregraphed to make sure we hit all of our science goals for the campaign. This is a lot of pressure!
But in between campaigns, the emphasis moves to driving towards the next major campaign. Our next major stop is the yardang unit, a series of intriguing wind sculpted, pale coloured hills which you can just see in the distance in the cover image for this blog. The rover planners (RPs) sometimes make our drives as long as they can and we drive as far as we can go, other times we stop a little short to look at interesting looking workspaces as we go. As part of the APXS team, I loved being part of the boxwork campaign and getting all the information we needed there … but as a geologist, there is something very special about this kind of exploring, the sense of being a planetary explorer, ambling along to see what the rocks will show us.
So we continue southwards, trundling over laminated bedrock which varies from predominantly pale coloured laminated bedrock to bands with abundant thin flaky, darker coloured, layers and patches. Some of the rocks stick out at strange angles, which make planning drives more challenging. This past week there has been abundant dark layers interbedded with the more dominant pale coloured rock, both in place and in fragments around the workspace. APXS and MAHLI characterized some of this darker material, for example at “Rio Bio Bio” and “Placilla de Caracoles” and some of the paler material at the brushed targets “La Primavera” and “Los Quemados.” ChemCam also analyzed both types of rocks along the way.
We are busily acquiring Mastcam and ChemCam LD-RMI (“Long Distance Remote Micro Imager”) images of everything even remotely interesting – and there are lots and lots of cool features around here. The wide open landscape here allows us to image features from several different angles and distances, such as “Mira Flores,” a small erosional outlier seen from a distance in this image and closer up here. Another great example is the “Kimsa Chata” trough which shows some amazing sedimentary structures, which may help us to determine if this was a desert or a lake or maybe something in between, such as a desert with some water moving through.
The Environmental Theme Group continues to populate each plan with environmental monitoring activities. Activities varied from dust devil monitoring in Gale crater to looking at levels of dust in the skies overhead. The weekend drive is planned to take us further into that drive distance shown in the cover image, to an area where the contrast between dark and light bedrock is more pronounced, and just beyond that, to an area which looks very smooth, with no jutting out blocks. From where we sit today, its impossible to say what it is but that is the fun of exploring – who knows what we will find? Stay tuned to find out over the coming weeks.
NASA has selected multiple small businesses for the Western Regional Multiple Award Construction Contract, which supports a broad range of facility enhancement, modernization, and sustainment work at NASA’s Armstrong Flight Research Center in Edwards, California, NASA’s Ames Research Center in California’s Silicon Valley, and other federal agencies in the region.
The contract provides general construction, modification, maintenance and repair, and demolition services, as well as new construction of buildings and facilities that incorporate Leadership in Energy and Environmental Design practices and building information modeling to support efficient and sustainable project execution.
The indefinite-delivery/indefinite-quantity, firm-fixed-price contract is a follow-on to the agency’s previous regional construction contract and has a potential value of $450 million over a five‑year period.
Contract awardees are:
Abide International Inc.
Able Heating and Air Conditioning
Anderson Burton Construction Inc.
Anna Lisa Luna Construction
Barkley Andross Corporation
Bibro Construction Company Inc.
CM Construction Services
CMS Construction Inc.
FASONE
G‑1 Lead Builders JV LLC
Gideon USA
Good‑men Roofing & Construction Inc.
Groundlevel Construction Inc.
IPI Construction Inc.
Innovative Project Solutions Inc.
Ironwood Commercial Builders Inc.
J.I. Garcia Construction Inc.
JG Contracting
Lead Builders Inc.
Martinez Construction Services
MX Construction Inc.
OCS Construction Services Inc.
Patricia I. Romero Inc., doing business as Pacific West Builders
Gustav Keoni, doing business as Precision Construction
Prime MIK JV LLC
Spectrum Builders and Renovations Inc.
Sea Pac Engineering Inc.
Sergent Construction
Souza Construction Inc.
TLI Construction Inc.
For more information about NASA and agency programs, visit:
By Erica McNamee of NASA’s Goddard Space Flight Center in Greenbelt, MD
As a kid, you were always taught to hold tight to balloons—tie them around your wrist, even, to keep them close. This week, a group of a dozen undergraduate students participating in NASA’s 2026 Student Airborne Research Program (SARP), unlearned old balloon-wrangling habits—and let go.
Their purpose: to collect data about the atmosphere with the help of a weather balloon. For this fieldwork day, in a windy area on the Texas Gulf Coast, the group released an ozonesonde, a small instrument attached to a weather balloon that measures ozone concentrations as it rises through the atmosphere.
“I’ve never done any atmospheric fieldwork outside like this, so this has been an awesome new opportunity for me,” said Marin Stevens, SARP intern and chemistry student from the University of Colorado at Colorado Springs.
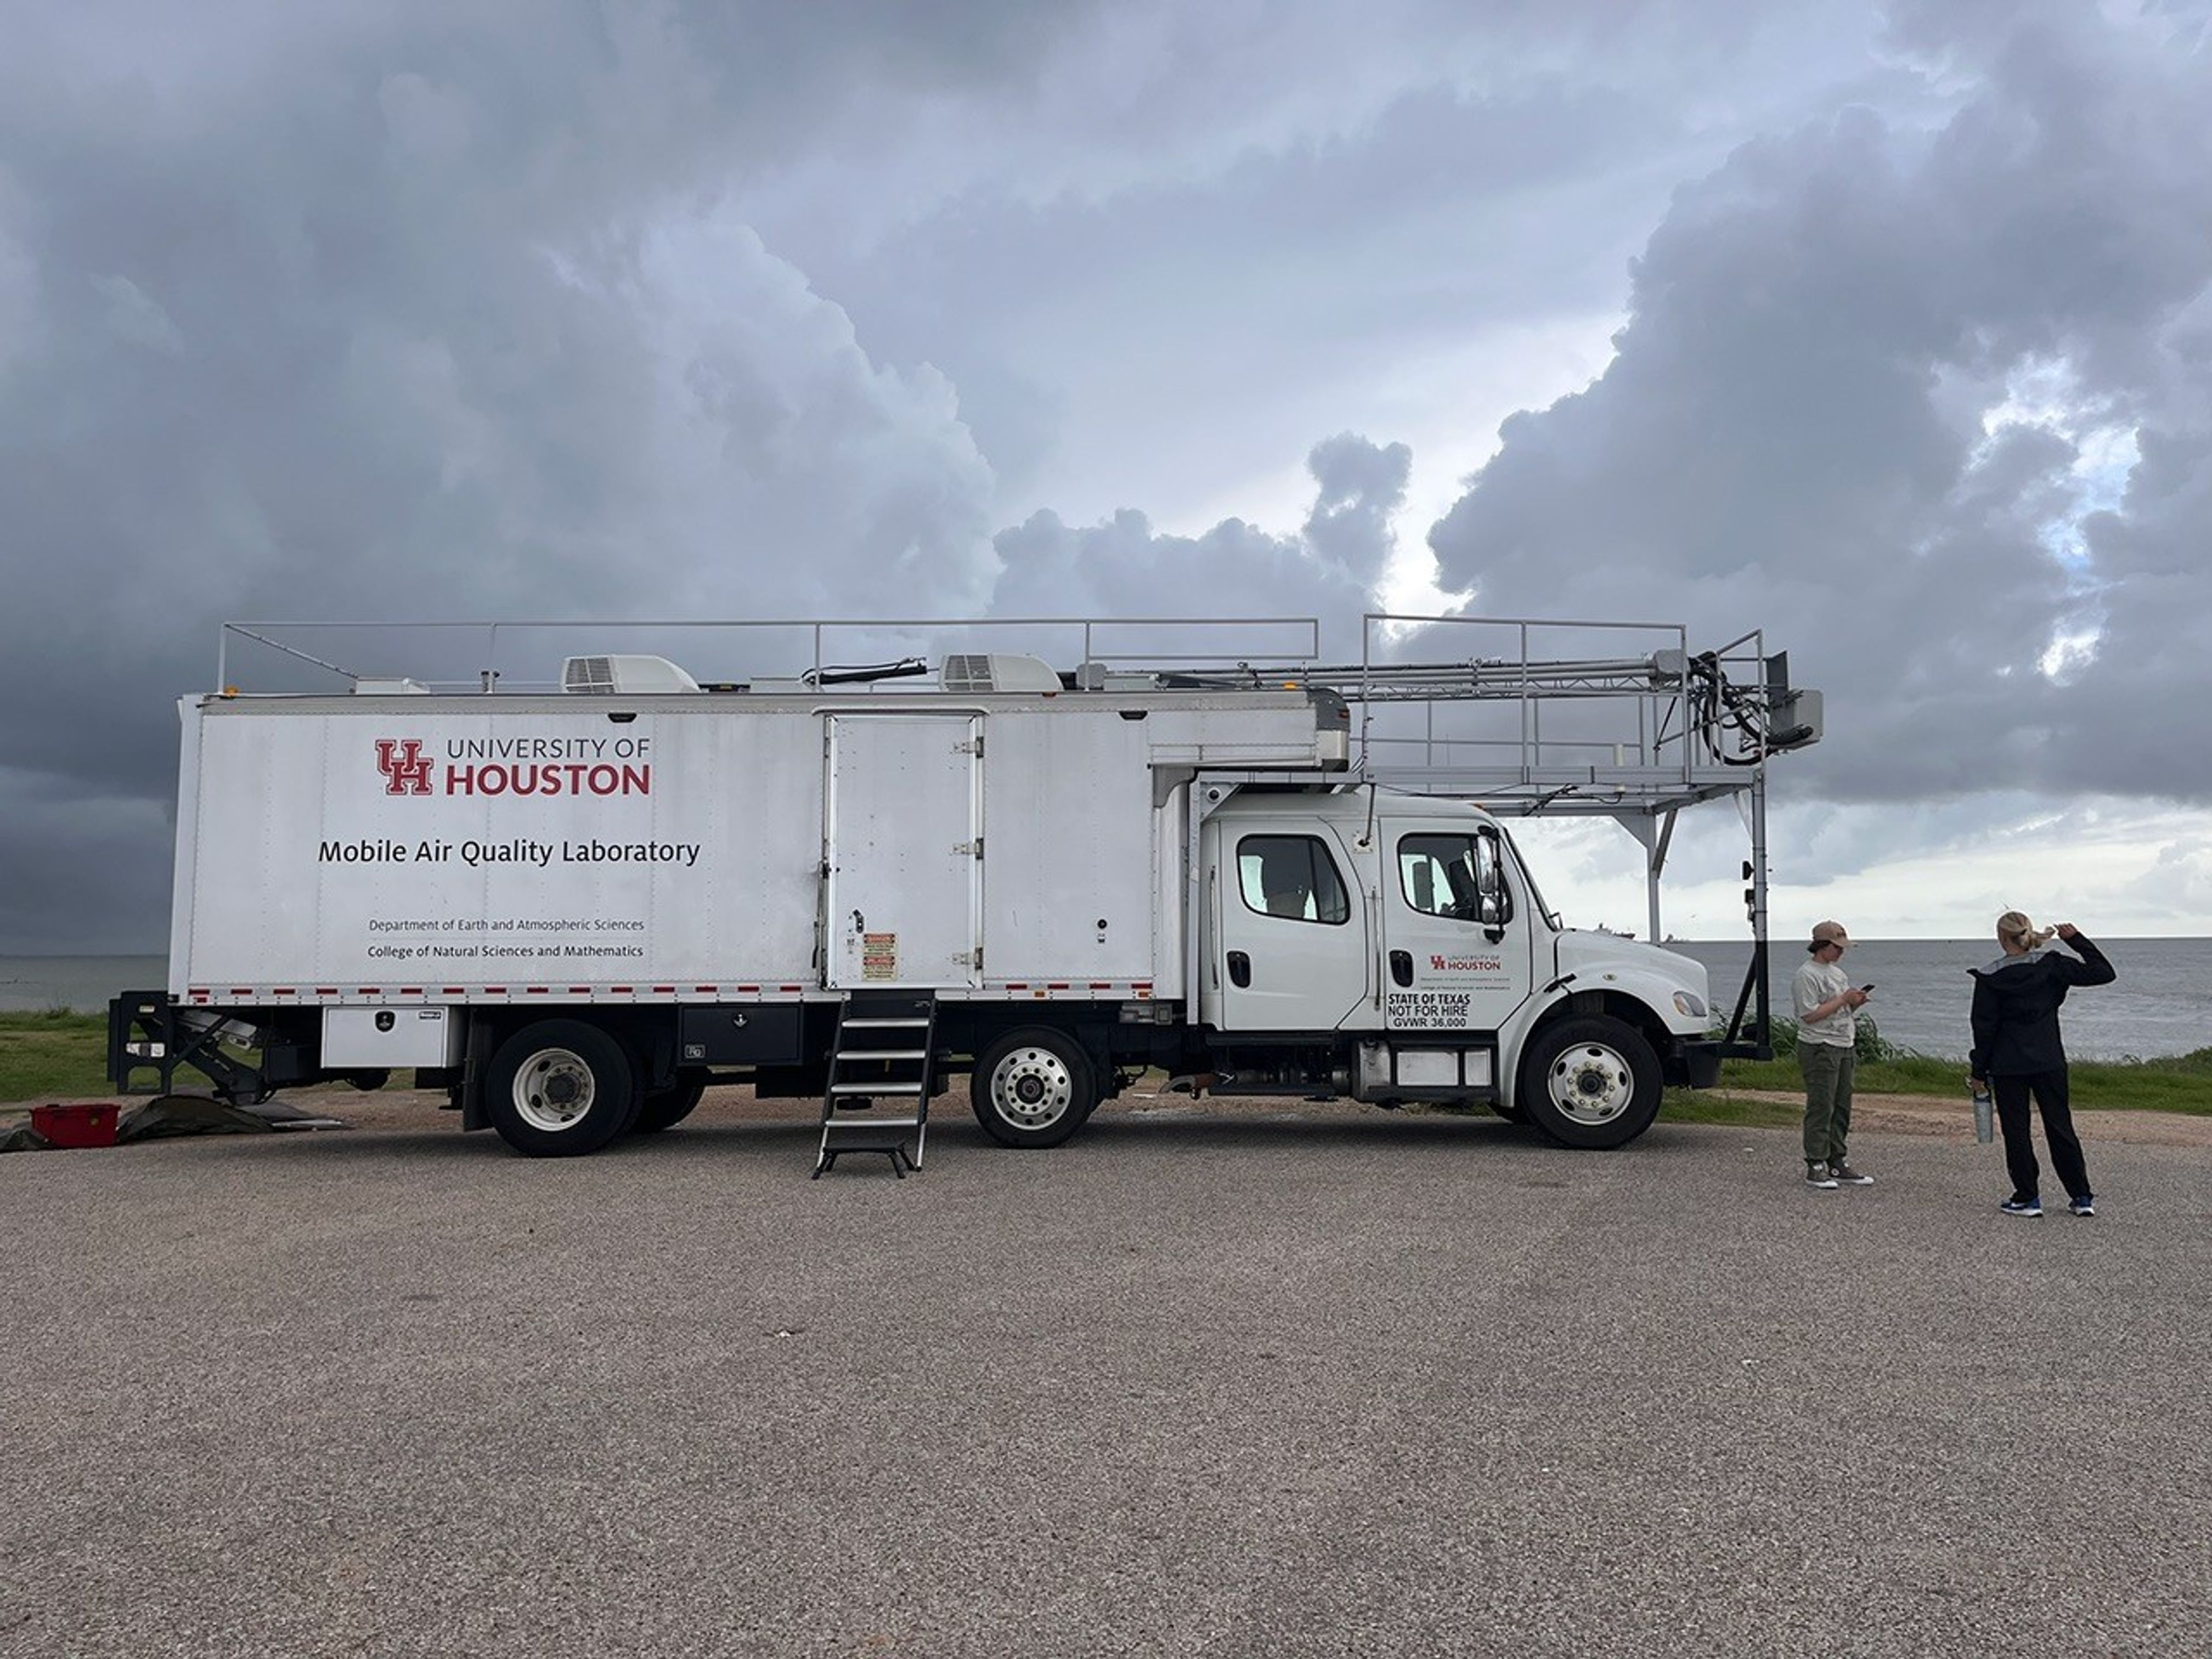
With the support of program mentors and faculty, and aboard the University of Houston’s Mobile Air Quality Laboratory (MAQL), the SARP interns participated in every step of the process.
The Mobile Air Quality Laboratory (MAQL) stands ready for some fieldwork.
NASA/Erica McNamee
Let’s set the scene: About 45 minutes away from this year’s SARP home base at the Lone Star Flight Museum in Houston, the MAQL drove down the Texas City Dike, a long strip of land jutting into the Texas Gulf Coast—an open space perfect for releasing the weather balloon. Among the 45 total students in the program, this group was assigned to meet the mobile lab at the balloon release location at 8 a.m. Central Time, just after a rainstorm rolled through.
Inside the lab, the students prepared ozonesondes for takeoff, completing the final steps that include measuring and pipetting cathode and anode solutions into the instrument cells attached to the sensor and testing each instrument’s response and baseline.
Outside the mobile laboratory, gusts of wind made it difficult to keep the balloon still while it was being filled with helium. Four students donned leather gloves to minimize oils from their fingers touching the balloon, which can make it pop faster after deployment. They wrangled the balloon while faculty advisor Travis Griggs, instructional assistant professor of atmospheric science from the University of Houston, filled it.
SARP students prepare the weather balloon for takeoff by filling it up with helium, while making sure it doesn’t pop or fly away.
NASA/Sofie Bates
Five students worked together to keep the balloon from flying away as they strung it to the ozonesonde, protected in a small foam container.
After confirming the launch location, time, and expected flight path with the Federal Aviation Administration (just a phone call away), it was time to set the weather instrument free.
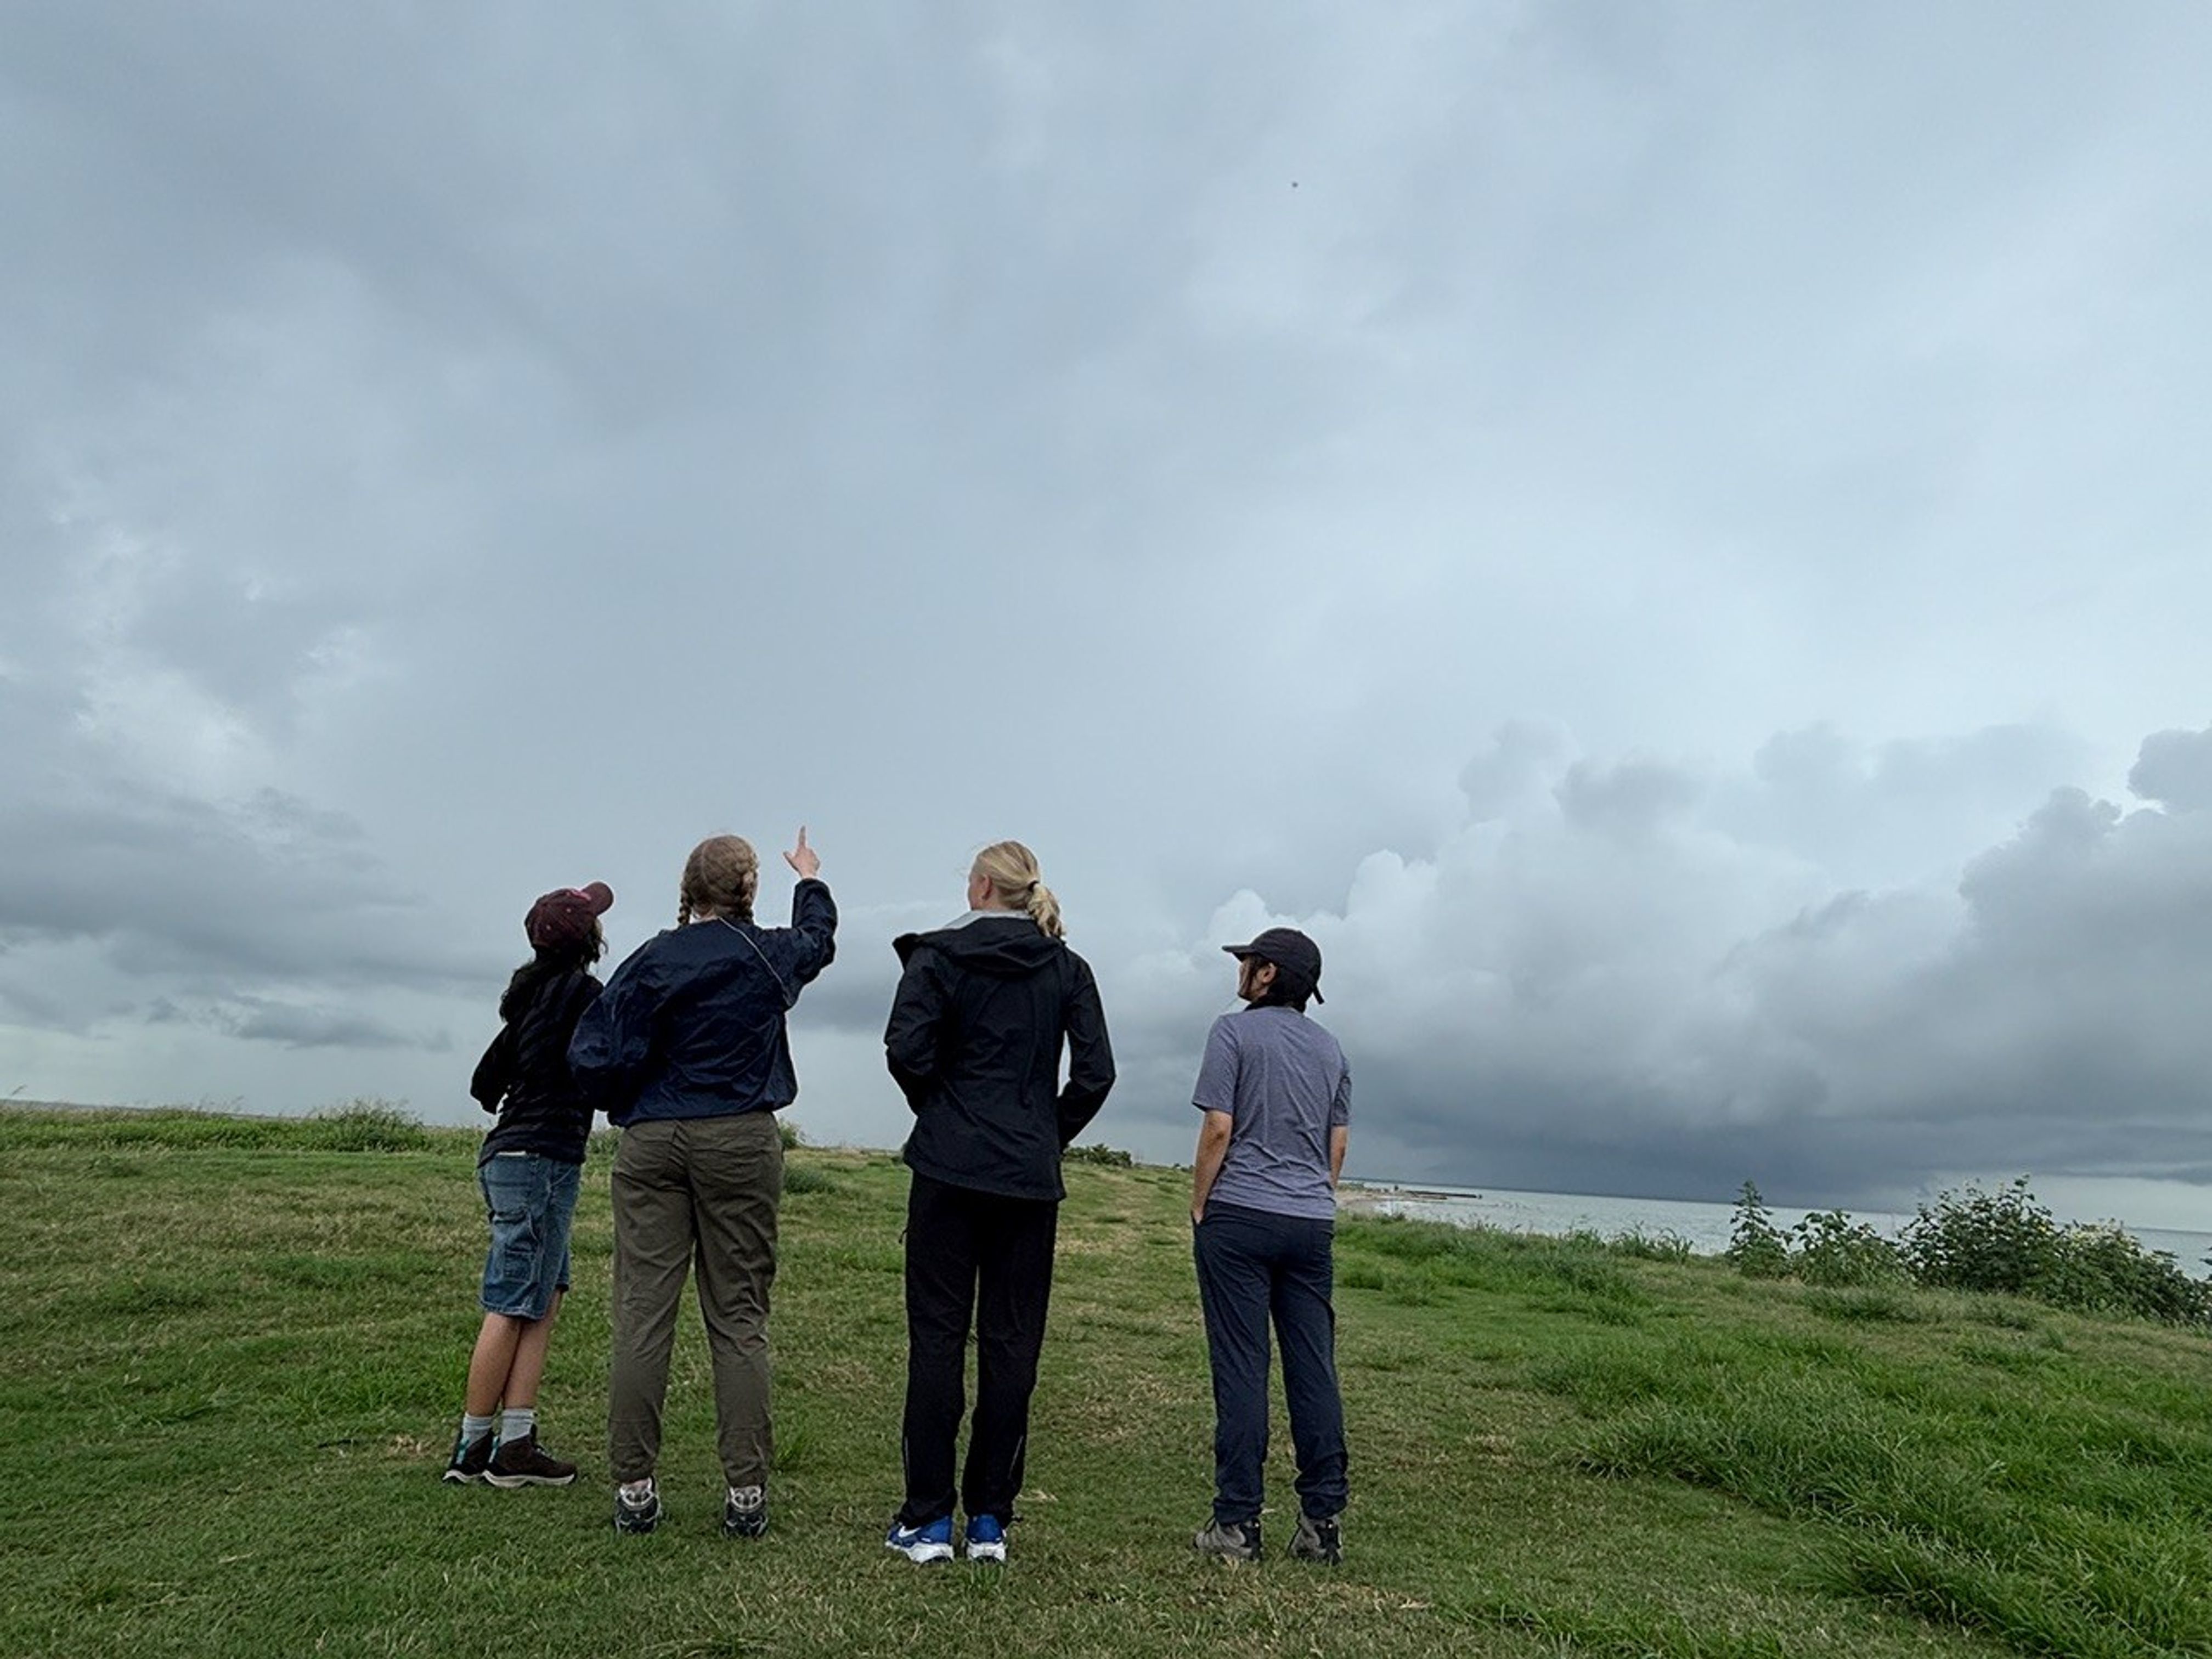
Even though it’s hard to see, there’s a tiny dot up in the sky—that’s the weather balloon! These students are admiring their work, watching their science experiment float up into the atmosphere to collect data.
NASA/Sofie Bates
“It was like a fight to stay on the ground, with the balloon whipping around in the wind,” said Zayna Haider, SARP intern and atmospheric and climate science student from the University of Washington. “It just flew away as soon as we let it go.”
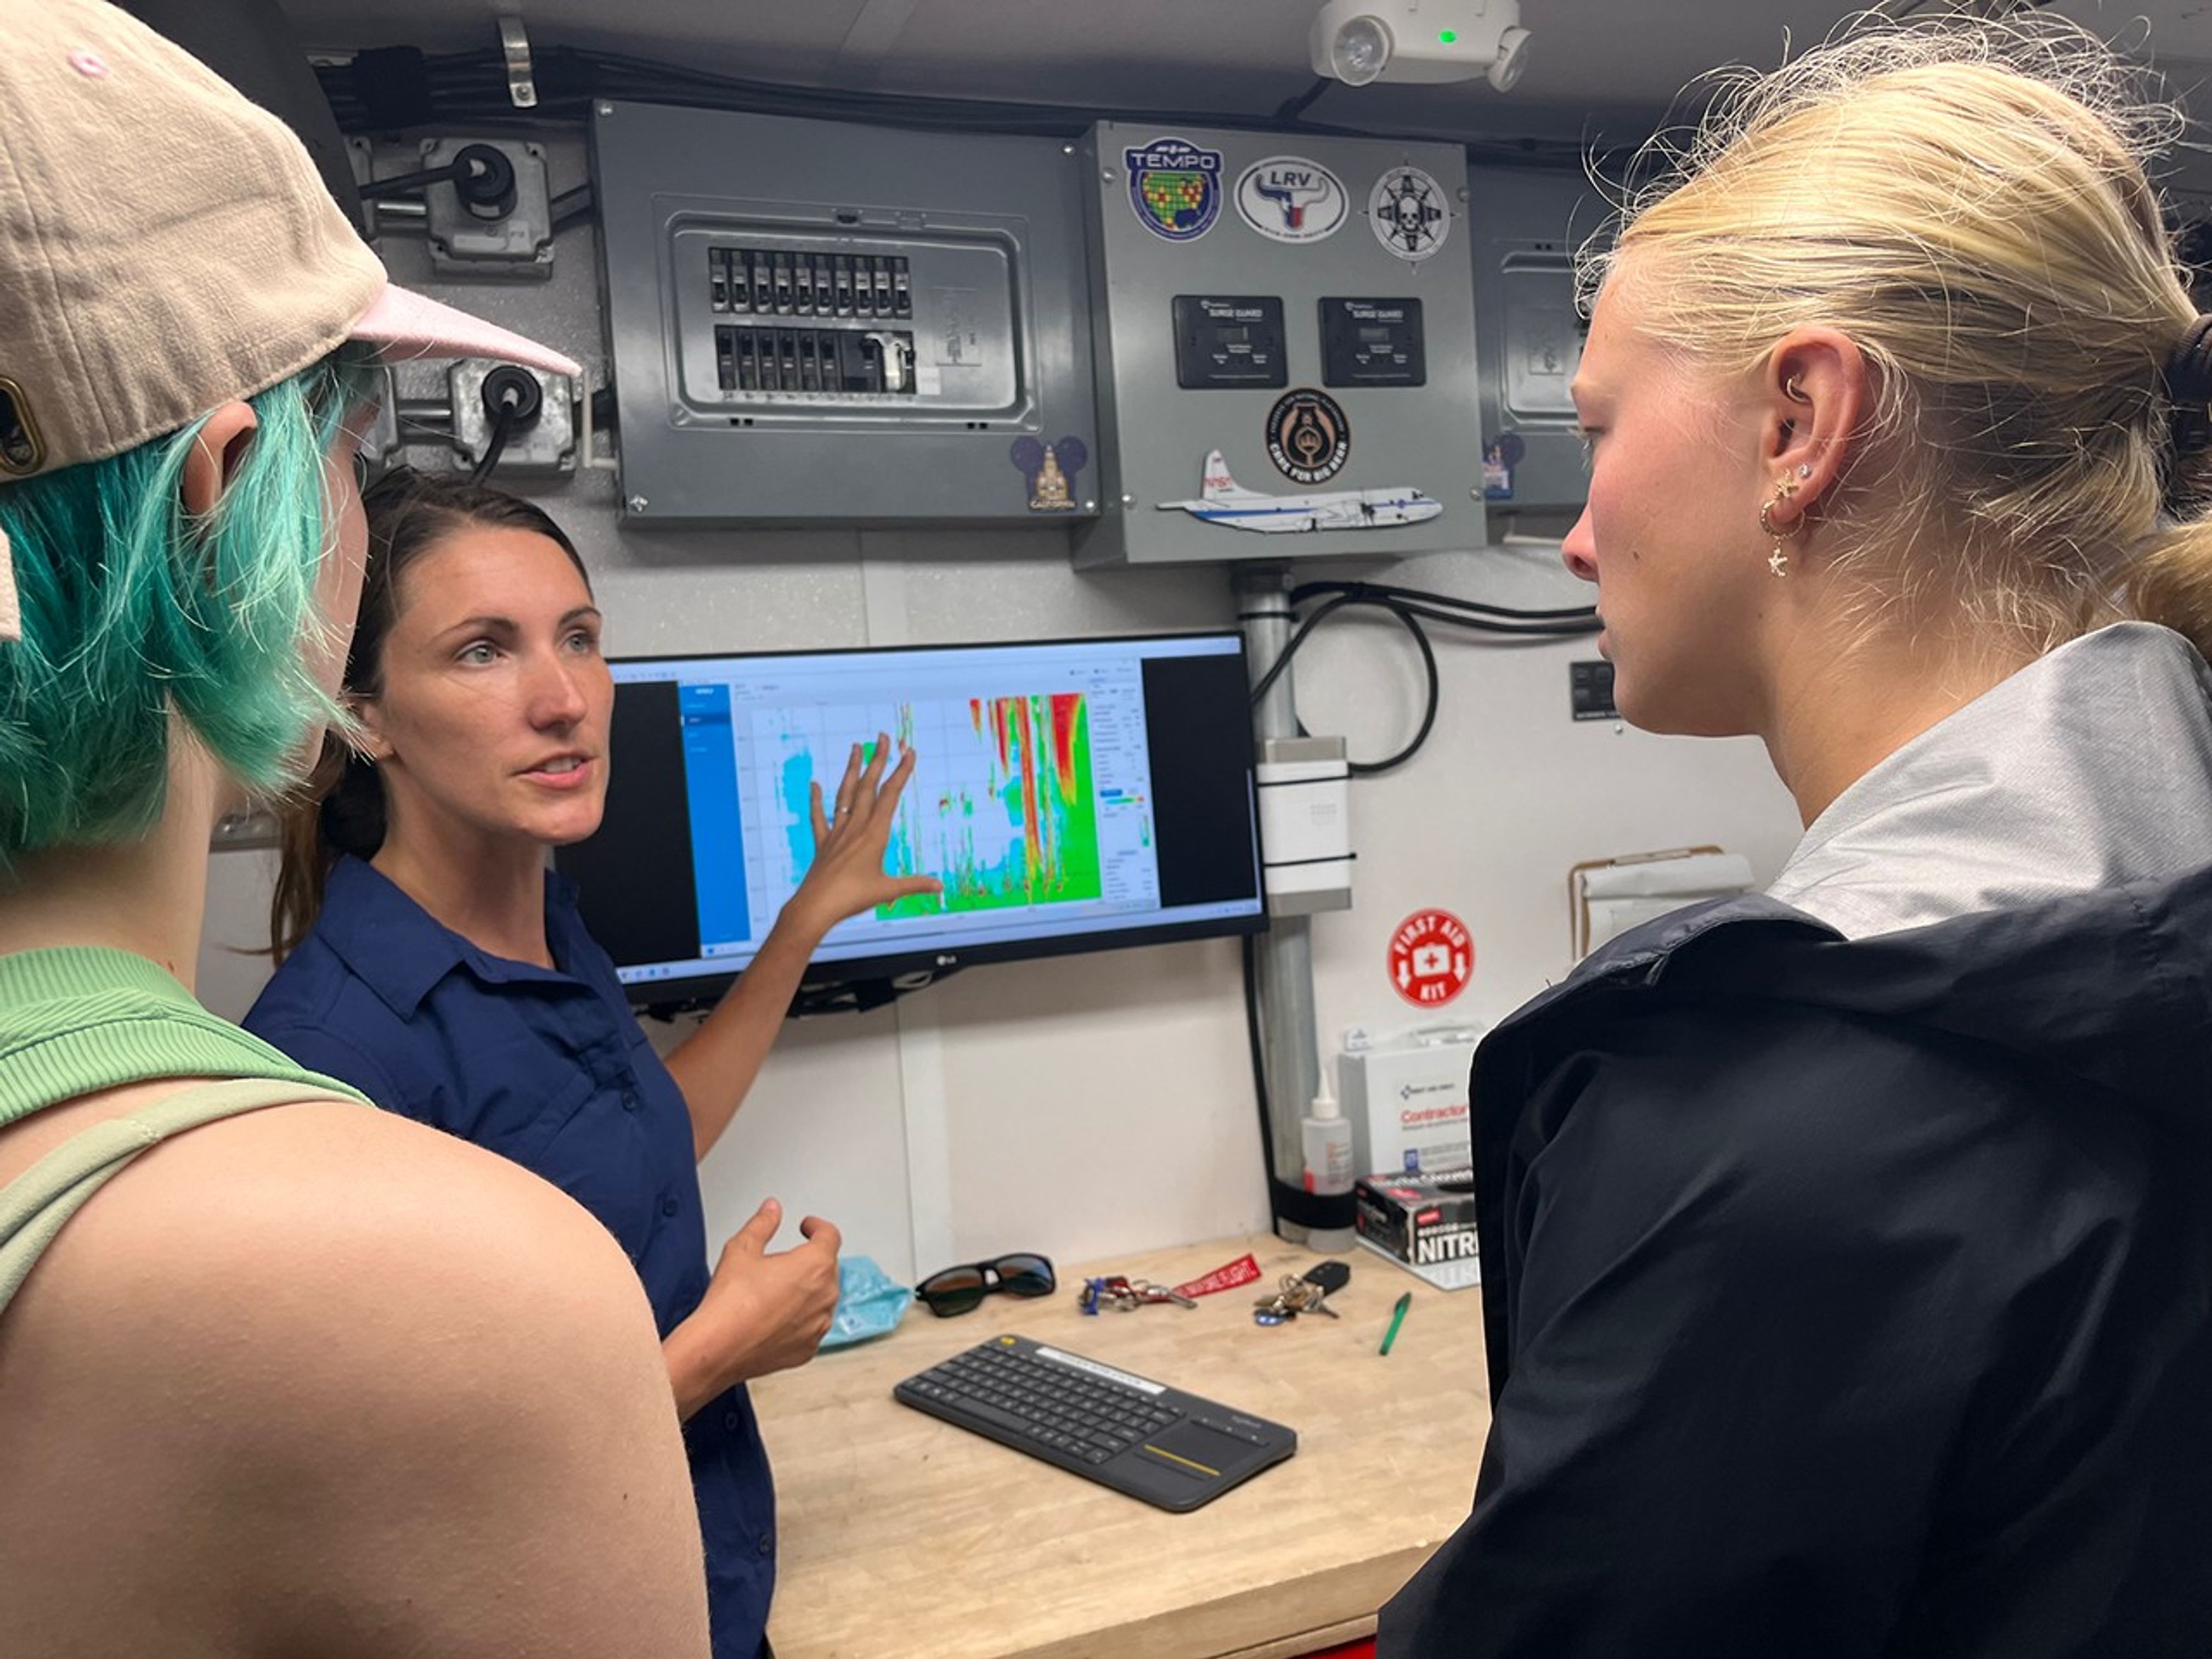
But the work had only just begun. The students huddled back inside the MAQL, monitoring data as long as the balloon kept sending it—until it popped or landed, whichever came first. Throughout the day, they repeated this process with two other balloons.
Students inside the Mobile Air Quality Laboratory reviewed the data from the weather balloon they had just launched.
NASA/Erica McNamee
This day gave many SARP participants, just starting their science careers, their first glimpse at hands-on fieldwork that reached the edges of the atmosphere. Next, they would use this data and what they learned from the experience for their end-of-internship research presentation.
“This is beyond what I ever thought it could be,” Stevens said. “I’m super excited for the next seven weeks.”
Transforming NASA’s trusted Earth science into powerful business intelligence
Earth Science Private Sector Engagement
NASA Earth science data, tools, and expertise drive economic innovation by providing industry with trusted insights to accurately forecast risk, optimize operations, and advance next-generation business solutions. By connecting, informing, and partnering with businesses, NASA’s Private Sector Engagement Office unlocks new opportunities to reinforce the use of Earth observations in existing markets and broaden adoption across emerging industry sectors, empowering organizations to build powerful and resilient solutions for the future.
INNOVATE is NASA’s innovation funding program designed to accelerate the translation of Earth science into real-world applications. Selected teams receive access to NASA funding, data, and expertise to develop solutions that address commercial and societal challenges. This opportunity is open through August 31, 2026.
Investigators & Partners: NASA Goddard Space Flight Center; University of Wisconsin-Milwaukee; University of Colorado; University of Wisconsin-Madison; University of Connecticut; Swiss Re; Munich Re; Eversource
An AI-powered flood intelligence platform that combines NASA Earth observations with advanced modeling to deliver real-time flood forecasts and impact assessments, including Federal Emergency Management Agency and NOAA end users.
Designed with insurers and utilities to improve disaster response, risk management, and resilience.
Operational Risk Forecasting for AI Infrastructure
Investigators & Partners: NASA Goddard Space Flight Center; Universities Space Research Association; Meta; Uptime Institute; Open-IX
A first-of-its-kind system that uses NASA Earth observations to forecast operational risks to data centers, power systems, and water resources up to 14 days in advance.
Helps critical infrastructure operators anticipate disruptions before they occur.
Fire & Risk Modeling for Property Insurance
Investigators & Partners: National Science Foundation; National Center for Atmospheric Research; Mercury Insurance
A next-generation wildfire risk platform combining NASA Earth science, physics-based modeling, and AI to improve insurance underwriting and community resilience.
Developed with industry partners to better understand and manage growing wildfire risks.
Next-Generation Food Security Early Warning System
Investigators & Partners: Space Science Institute; Chapman University; World Food Program; Microinsurance Catastrophe Risk Organization
An advanced agricultural monitoring system that uses NASA Earth observations to detect food security risks months before traditional warning systems.
Supports insurers, humanitarian organizations, and agribusinesses with earlier, more actionable insights.
AI-Powered Wildfire Risk Intelligence for Utilities
Investigators & Partners: NASA Jet Propulsion Laboratory; OpalAI; Pacific Gas & Electric; Los Angeles Department of Water & Power
An AI-enabled wildfire intelligence platform that helps utilities identify asset-level wildfire risks and improve operational decision-making.
Designed to reduce outages, strengthen grid resilience, and protect communities.
Early Warning & Transparency for Forest Supply Chains
Investigators & Partners: NASA Goddard Space Flight Center; University of Maryland; Science Systems and Applications Inc.; Chainparency
A NASA-enabled monitoring and forecasting platform that helps forestry and wood-product industries track forest health, detect emerging risks, and improve supply chain transparency.
Supports more resilient and sustainable forest management at scale.
How NASA Helps Industry
How NASA supports agribusiness
Every day, farmers, food companies, and agricultural producers rely on timely, trusted information to manage their crops, land, water, and supply chains. NASA develops technology and missions to observe agricultural landscapes from space, informing optimal time and location for planting, monitoring of plant growth, best times for harvest, and market readiness assessments. U.S. and international partners use this information to support food security, stabilize markets, and strengthen productive farming.
From space, NASA tracks soil moisture, groundwater, crop condition, water use, heat stress, precipitation, and land change, while also supporting field-level tools and trusted partnerships with producers and agricultural organizations. By transforming satellite data into practical insights, NASA helps agribusiness to anticipate challenges, improve productivity, manage vital resources, and safeguard food systems.
The NISAR (NASA-ISRO Synthetic Aperture Radar) satellite captured an image of northeastern North Dakota on Aug. 23, 2025. The darker agricultural plots are plowed and unplanted fields, while the lighter colors represent the presence of pasture or crops. Circular patterns indicate the use of center-pivot irrigation.
NASA JPL
How NASA helps energy & utility companies
Energy providers, utilities, and infrastructure operators need trusted Earth information to plan for demand, protect assets, and keep essential services reliable. NASA Earth science supports decisions related to solar and meteorological resources, extreme heat, wildfire, air quality, flooding, drought, and land movement.
The Prediction Of Worldwide Energy Resources (POWER) project provides solar and meteorological data used by energy, building, and infrastructure communities. NASA Earth insights also help utility companies understand risks to grids, water systems, pipelines, and other critical assets and the Agency engages with partners such as the Center for Weather Innovation, Smart Energy and Resilience to advance Earth observation capabilities for the energy sector. Through data, training, stakeholder engagement, and partnerships, NASA equips energy and utility leaders with trusted information to strengthen resilience and support reliable operations.
This Black Marble data visualization shows how nighttime light changed year over year between 2014 and 2022 around the globe. Derived from satellite imagery taken daily over the past decade, golden areas featured brightening, purple areas featured dimming, and white areas experienced both kinds of changes.
NASA Scientific Visualization Studio
How NASA supports insurance & reinsurance
Insurance and reinsurance organizations depend on trusted information to understand hazards, price risk, support claims, and plan for changing risk exposure. NASA Earth science provides observations, models, and long-term records that help characterize events such as wildfire, flood, heat, drought, storms, land change, and infrastructure impacts.
NASA is engaging with the insurance and reinsurance community to better understand where Earth observations can support underwriting, catastrophe modeling, parametric products, claims response, and resilience planning. By participating in pre-competitive industry coalitions like the Center for Innovation in Risk, Catastrophes, and Decisions, as well as sector trainings and industry engagement, NASA helps insurers and reinsurers connect trusted Earth science with the decisions that shape risk, affordability, and recovery.
After unleashing dozens of destructive tornadoes, a slow-moving storm system dumped heavy rain across the U.S. Midwest and Southeast in early April 2025. A break in the clouds on April 7, 2025, revealed widespread flooding, shown in this image acquired by the Visible Infrared Imaging Radiometer Suite on the NOAA-21 satellite.
NASA Earth Observatory
How NASA helps the finance sector
Financial institutions, investors, and analysts need reliable information to understand physical risk, market exposure, and long-term change. NASA Earth science provides trusted data and models that help organizations to assess risk across assets, portfolios, and supply chains, including wildfire, heat, flood, land change, and infrastructure impacts.
NASA’s engagement with the finance sector focuses on helping users move from awareness to application, identifying relevant datasets, understanding uncertainty, and connecting Earth observations to real business decisions. Through training, collaborative sessions, and sector partnerships, NASA is working to make Earth science more accessible to financial decision-makers seeking trusted, science-based insights.
This screen capture from FIRMS shows Landsat active fire imagery of the Double Creek Fire in Oregon on September 10, 2022. The Landsat Active Fire and Thermal Anomalies product is generated from the Landsat Operational Land Imager (OLI).
NASA LANCE
How NASA helps mining and exploration
Mining and exploration companies rely on trusted geoscience information to understand landscapes, manage risk, and make decisions across the mineral resource life cycle. NASA Earth science observations can support characterization of terrain, land cover, water resources, surface change, environmental conditions, operational risks, and long-term landscape dynamics.
NASA is engaging with the mining and exploration community to better connect Earth observations with industry needs, from early exploration and resource assessment to operations, closure, and reclamation. Through participation in pre-competitive industry efforts such as the Center to Advance the Science of Exploration to Reclamation in Mining, as well as broader technical exchange and stakeholder engagement, NASA helps bring trusted data, models, and Earth system science into decisions that support responsible resource development.
Various minerals are revealed in vibrant detail in this sample mineral map of Cuprite, Nevada, following processing of imaging spectrometer data.
USGS
FEbruary 2026
Industry Summit Report
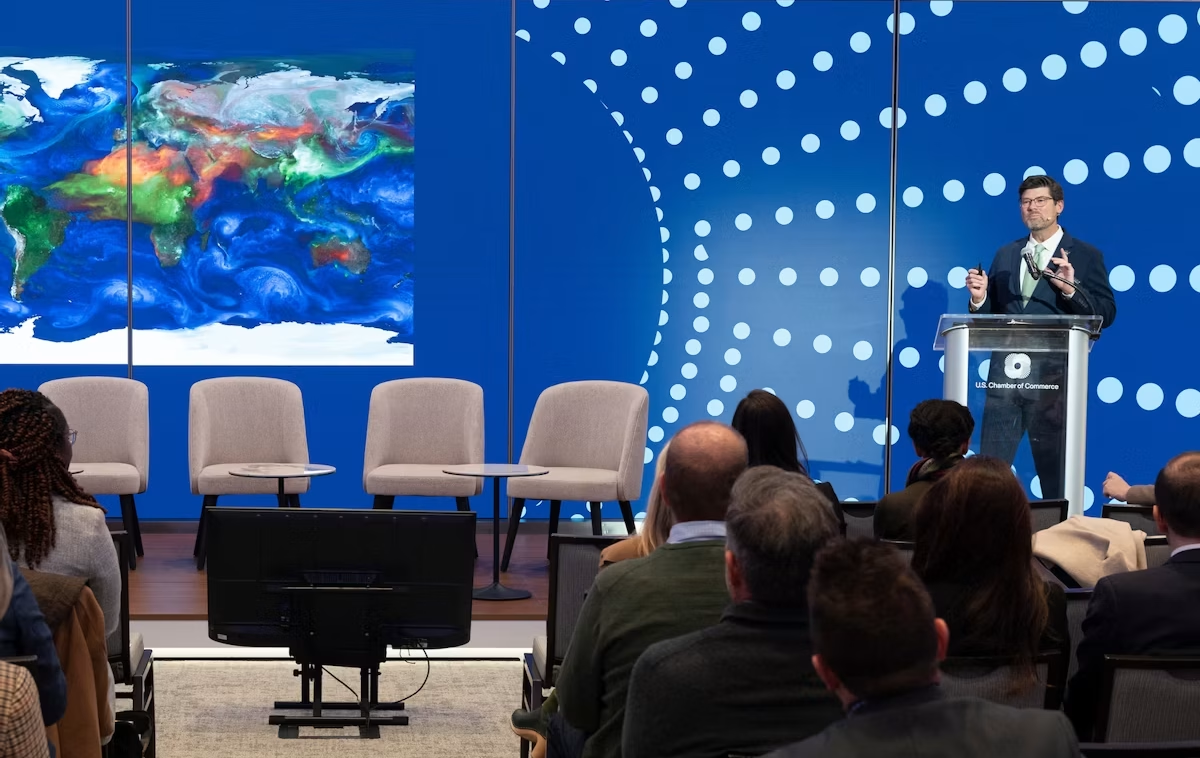
The NASA Earth Science Industry Summit, hosted by the U.S. Chamber of Commerce on February 2, 2026, served as a strategic forum to explore how NASA’s Earth Science enterprise contributes to the engines of the American economy and how public and private sectors can work together to unlock greater opportunities in Earth observation.
Explore the summary report for key reflections and takeaways, representing the perspectives of more than 180 participants across finance, insurance, agriculture, energy, utilities, and more.
Earthdata is your gateway to find, access, visualize, and download NASA Earth science data. Browse the data catalog, search by topic, discover learning resources including tutorials and trainings, and more.
NASA's Applied Remote Sensing Training Program (ARSET) teaches users how to use remote sensing data for a range of applications. ARSET trainings are available for all levels of experience at no cost, both in person and online.
The Fire Information for Resource Management System (FIRMS) tracks active fires and hotspots worldwide to support response, risk monitoring, and operational awareness.
Flood Water Monitoring
NASA’s Land, Atmosphere Near real-time Capability for Earth observation (LANCE) provides near real-time flood products, showing flooding and surface water changes to support exposure, claims, and resilience planning.
Economic & Human Activity
Night-time lights, visible with NASA’s Black Marble products, are used to monitor economic indicators, human activity, outages, infrastructure disruptions, and disaster recovery.
Heat & Temperature Insights
The ECOsystem Spaceborne Thermal Radiometer Experiment on Space Station (ECOSTRESS) instrument detects surface heat, crop water stress, urban heat, and thermal conditions affecting assets and operations.
Land Surface Change & Risk
The OPERA Surface Displacement (DISP) product suite identifies land surface movement from processes such as sinkholes, earthquakes, and landslides, supporting risk assessment for infrastructure and critical assets.
Long-Term Risk Projection
NASA Earth eXchange Global Daily Downscaled Projections (NEX-GDDP) provides historical baselines and future climate scenarios for asset, portfolio, and resilience planning.
Partnerships & Collaboration
NASA offers 60 years of experience in advanced engineering and testing capabilities, cutting edge research and technology development, as well as unique assets such as land, facilities and laboratories for use by commercial industries, academic institutions, U.S. government agencies and international entities.
Partnerships Front Door
Discover how NASA works with industry, academic, and non-profit partners to advance mutual goals through through strategic, non-procurement partnerships.
Eligible organizations that incorporate NASA data into their products, services, or research can gain significant value by displaying the NASA Data Insignia.
Katalyst Space’s LINK robotic servicing satellite awaits encapsulation inside a Northrop Grumman Pegasus XL on June 8, 2026, at NASA’s Wallops Flight Facility in Virginia. The rocket will carry LINK to space for an attempted orbital boost of NASA’s Neil Gehrels Swift Observatory.
NASA/Ron Beard
Engineers completed installation of Katalyst Space’s LINK robotic servicing spacecraft into a Northrop Grumman Pegasus XL rocket on Tuesday, June 9, at NASA’s Wallops Flight Facility in Virginia. Launch is anticipated later this month.
Our planet’s atmosphere creates drag for spacecraft in low Earth orbit, gradually reducing their altitudes if they don’t have propulsion systems to counteract the effect.
Recent solar activity magnified this effect on Swift, and its orbit decayed faster than anticipated.
Katalyst’s Hunter Robertson prepares LINK ahead of it being attached to the Pegasus XL inside the Horizontal Integration Facility at NASA Wallops on June 6, 2026.
NASA/Ron Beard
Based on the orbital and programmatic needs of the mission, Katalyst selected the air-launched Pegasus XL as the best means of reaching the observatory in time to perform the boost maneuver.
Northrop Grumman will launch the rocket using Stargazer, its modified L-1011 aircraft.
Next, Northrop Grumman engineers will attach Pegasus XL to Stargazer, which will carry it from NASA Wallops to Kwajalein Atoll, part of the Republic of the Marshall Islands in the South Pacific Ocean, for launch.
Submit your abstract for “Advancing Weather and Environmental Science Through NASA and NOAA Commercial Satellite Data Programs,” a joint session hosted by NASA’s Commercial Satellite Data Acquisition (CSDA) program, in partnership with the NOAA National Environmental Satellite, Data, and Information Service (NESDIS) Commercial Data Program (CDP).
The session is part of the 23rd Symposium on Operational Environmental Satellite Systems, which will take place at the 2027 American Meteorological Society (AMS) Annual Meeting January 10-14 in Denver, Colorado. It will examine the growing capabilities of commercial Earth observation providers that are creating new opportunities to advance weather research, operational forecasting, and environmental science applications.
NASA’s CSDA program and NESDIS’s CDP collaborate to expand federal access to commercial satellite data and accelerate its use in both research and operational applications.
The CSDA program supports the scientific community by evaluating and acquiring diverse commercial datasets, including optical, Synthetic Aperture Radar, Global Navigation Satellite System Radio Occultation and Reflectometry, methane, precipitation, and Digital Elevation/Terrain Models for modeling, hazard monitoring, climate studies, and applied research.
Similarly, the CDP operationalizes commercial space-based environmental data, with demonstrated impacts from assimilated observations in weather forecasting and space weather applications. It also conducts pilot projects and transitions the piloted data to operations.
Together, the CSDA and CDP strengthen the nation’s weather enterprise by enabling innovative research, closing observational gaps, and integrating commercial data into real-world forecasting and decision support applications.
To submit an abstract or for additional information about the abstract submission process, visit the symposium’s website.
The aurora australis crowns Earth’s atmosphere above the Indian Ocean as the Canadarm2 robotic arm extends from a power and data grapple fixture attached to the Harmony module.
NASA/Chris Williams
Scientific hardware installations and biomedical monitoring topped the research schedule aboard the International Space Station on Wednesday. The Expedition 74 crew members also adjusted a spacesuit to prepare for a spacewalk and explored space physics to round out their day.
A series of shoebox-sized CubeSats will soon be deployed outside the Kibo laboratory module into Earth orbit for public and private research. One of the satellites, Hokushin-1 CubeSat, will test space technologies such as radio frequency, propulsion, and solar arrays. NASA flight engineer Jack Hathaway finished installing a small satellite orbital deployer, packed with the CubeSats, into Kibo’s airlock where it will soon be placed in the vacuum of space and grappled by the Japanese robotic arm. The deployer will be maneuvered with the robotic arm and positioned away from the orbital outpost to safely release the tiny satellites into Earth orbit.
Onboard the orbital outpost are a variety of research freezers—large, small, portable, and permanent—that house and preserve station research samples for analysis both on Earth and in space. One of them, a smaller glovebox freezer, is being installed inside Kibo’s Life Science Glovebox (LSG) by NASA flight engineer Jessica Meir for upcoming experiment operations. The freezer’s location inside the LSG allows the samples to be stowed and frozen immediately after processing to prevent degradation and preserve integrity during sensitive biology research.
Meir also assisted flight engineer Sophie Adenot of ESA (European Space Agency) as she set up wearable devices for a pair of biomedical tests on Wednesday. Adenot first measured her blood pressure to calibrate the PhysioTool technology demonstration gear. Next, she wore head and body sensors that measured her brain oxygen and blood flow levels as she performed cognitive and mental tasks on a computer. Researchers are testing the portable device onboard the station to potentially monitor crew health on missions to the Moon, Mars, and beyond.
Meir also had time to help NASA flight engineer Chris Williams pack cargo inside a SpaceX Dragon cargo spacecraft that will undock from the Harmony module’s forward port and soon return to Earth. Williams then maneuvered into the Quest airlock and adjusted a spacesuit’s legs, arms, and helmet, then ensured the suit’s switches and valves were correctly configured ahead of an upcoming spacewalk.
On May 27, during routine operations of the International Space Station’s Canadarm2, the system demonstrated an elevated motor current in a wrist joint and arm motion did not occur as expected. NASA worked alongside CSA (Canadian Space Agency) to understand the issue and determined a spacewalk will be required to replace the joint using a spare already aboard the orbital complex. The Canadarm2, which is designed to be repaired in orbit, is in a safe configuration and standard operations using the arm have been paused. In the coming weeks, NASA will host a news conference to discuss the repair and preview the planned Tuesday, June 30 spacewalk. NASA will share more on the spacewalkers closer to the activity.
Roscosmos cosmonauts Sergey Kud-Sverchkov and Sergei Mikaev joined each other and explored space physics in the Zvezda service module. The duo observed how two different sized spheres drift freely in microgravity with no pushing movement from the crew. Results may lead to the design of newer space tools, improved robotics, and a deeper understanding of crew motion. Roscosmos flight engineer Andreu Fedyaev focused primarily on maintenance testing computer operations, cleaning ventilation systems, and transferring water between station tanks.
Finally, the space station is orbiting higher today after the Progress 95 cargo spacecraft fired its thrusters for over eight minutes early Wednesday raising its altitude by 1.9 miles. This adjusts the orbital outpost’s altitude ahead of the launch and docking of the Soyuz MS-29 crew spacecraft planned for mid-July.
NASA Equips Astronauts, Industry with Robotic Intelligence
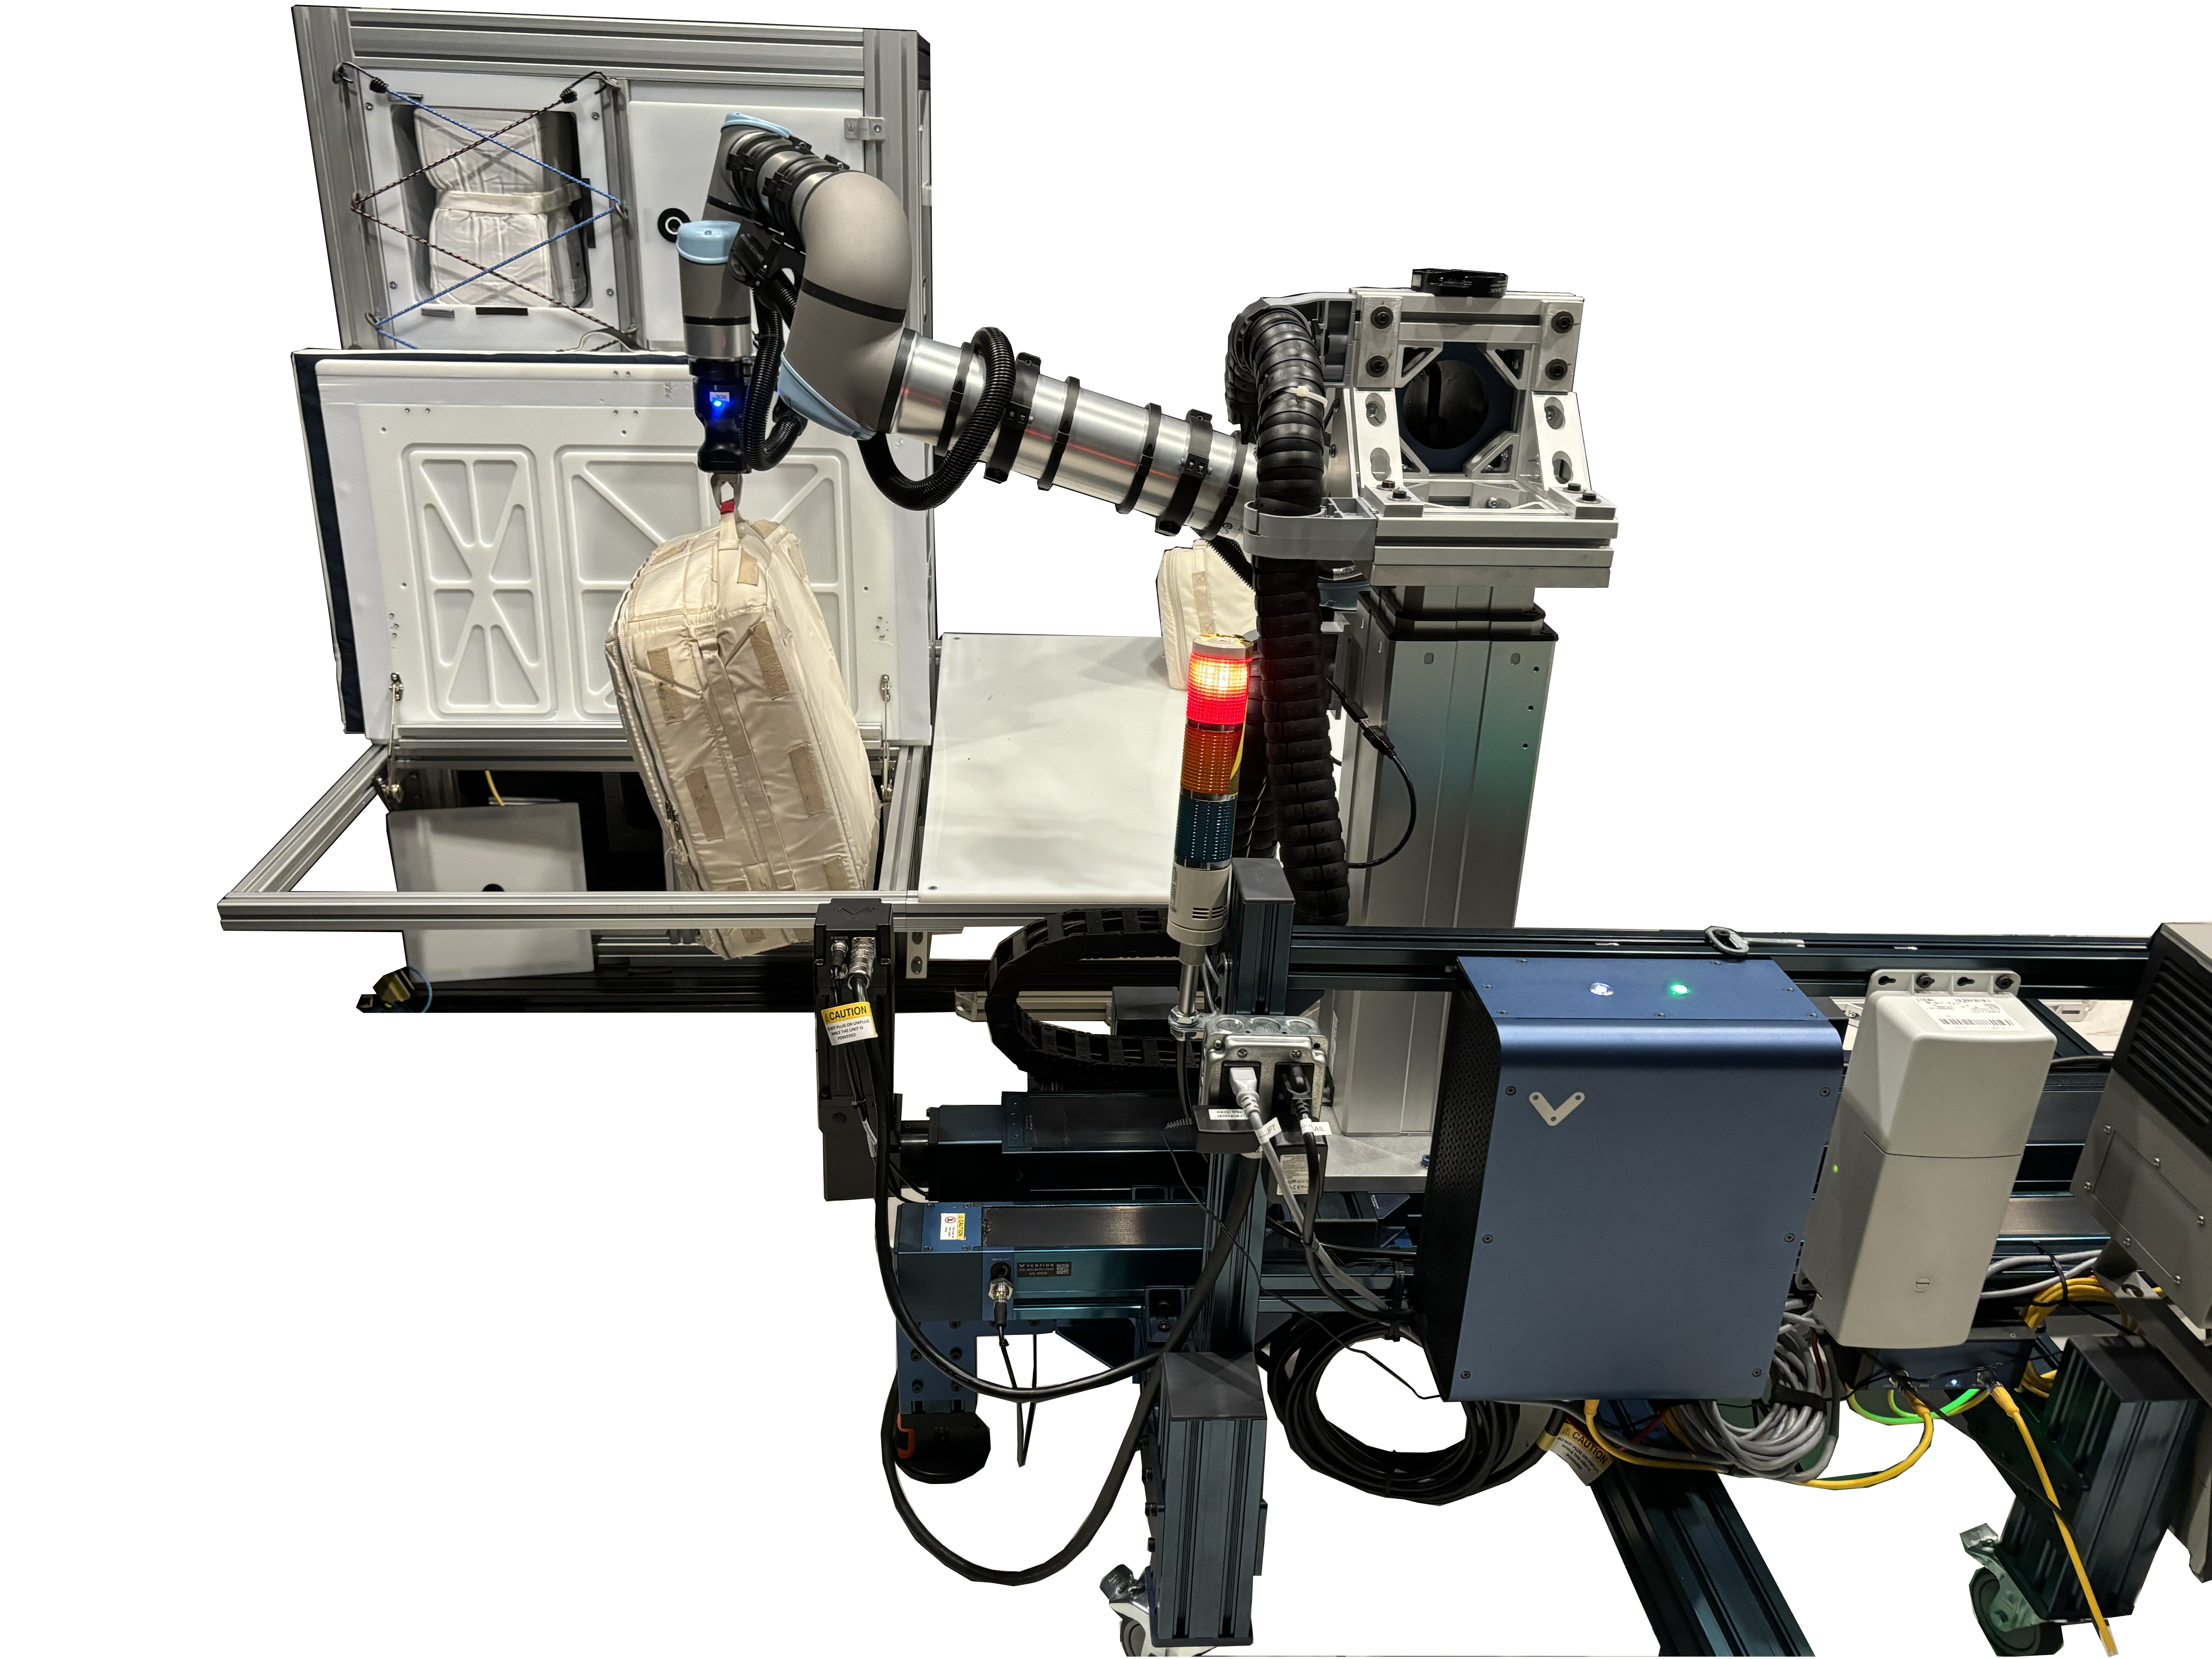
In the Integrated Mobile Evaluation Testbed for Robotics Operations facility at Johnson Space Center, PickNik robotic control software proved its prowess in tasks like passing cargo transfer bags through a hatch and placing them in storage bins, in anticipation of work NASA would like robots to carry out during the later Artemis missions.
Credit: NASA
As NASA plans long-term missions on the Moon, the agency could use robots to perform routine tasks, allowing crew members to dedicate more time to science and exploration. However, robotic motion control requires complex technology and advances in features like robotic decision-making and object recognition.
These are the challenges a Boulder, Colorado-based robotics company is teaming up with NASA to overcome.
PickNik Inc. recently worked with Shaun Azimi, who leads the Dexterous Robotics team at NASA’s Johnson Space Center in Houston, and other agency roboticists. The team tested software that enabled a robotic arm to recognize a spacecraft hatch, then turn the latch, grasp the handle, and open the door. The arm then was able to transfer cargo bags between the hatch and a bin.
The work was carried out in NASA Johnson’s new Integrated Mobile Evaluation Testbed for Robotics Operations with funding from NASA’s Small Business Innovation Research program.
PickNik designed and refined the robotic software, called MoveIt Pro, with support from early government investments. Commercially released in 2023, MoveIt Pro has found a significant customer base.
Automotive company BMW is using the software on its robotic assembly lines. A company called Lightspeed is using MoveIt Pro to program huge robotic arms that build modular “panels” for constructing affordable housing. Another company, known as Hivebotics, used MoveIt Pro to automate its flagship product, a cleaning robot.
Ezra Brooks, principal software engineer at PickNik, said the 35-person company might not have a product without NASA’s early support. Robotic software requires years of research and development to refine algorithms and create a commercial product. NASA enabled much of that foundational work.
NASA’s technological advancements unlock key capabilities for missions at the Moon and beyond while benefiting commercial industries on Earth. For 50 years, NASA has documented the everyday benefits of space technology through the agency’s Spinoff publication. To learn more about the project, visit: https://go.nasa.gov/49CNSi7
The final booster motor segments for NASA’s SLS (Space Launch System) rocket that will help propel Artemis III astronauts on their journey to space shipped from Northrop Grumman’s Railyard Shipping Facility in Corinne, Utah on June 2. The eight booster motor segments are on their way to NASA’s Kennedy Space Center in Florida where they will form the SLS rocket’s twin, five-segment solid rocket boosters, which produce more than 75% of the total thrust at liftoff.
Dear Astrophysics Strategic Technology & Research Accelerator (ASTRA) community members-
As we prepare for our Ad ASTRA Community Science workshop, we are writing to share important updates regarding the agenda structure and instructions for abstract submissions.
The Community Science (Ad ASTRA) Workshop is organized by the NASA Astrophysics Division to engage the community in identifying future large, strategic astrophysics missions. Structured over three thematic days—Science, Capabilities and Implementation, and Community Discussion—the workshop provides a comprehensive framework to connect scientific priorities with technological readiness and mission implementation. Across all three days, plenaries, panels, breakout sessions, and poster contributions are designed to maximize community interactions and discussion. The outcomes of the workshop will help NASA prioritize mission concepts and shape a balanced, forward-looking astrophysics portfolio that is consistent with the Astro2020 recommendations and existing and future science gaps.
To best serve the community and facilitate meaningful collaboration, we are splitting the mission concept presentations into two distinct focuses: Science on Day 1, and Capabilities and Implementation on Day 2. We are relying on you—the concept teams and the broader community—to submit abstracts for both days. We are also offering the option to present mission concepts as posters, and will offer the opportunity to present as posters any abstracts for which there is insufficient room in the parallel sessions.
Please review the detailed agenda structure and submission guidelines below:
Day 1: Science Focus
Science Questions: Day 1 will focus on open science priorities and questions from strategic documents (Astro 2020 Decadal Survey, Enduring Quests – Daring Visions from 2014) and more recent science questions that the mission concepts submitted to ASTRA will address.
Abstract Submission: Presentations for Day 1 are not restricted to mission concept team members. We strongly encourage other scientists in the community to submit abstracts presenting important science questions and to use this opportunity to connect with concept teams.
Breakout Sessions: These sessions will be organized by science themes (Compact Objects and Energetic Phenomena, Cosmology, Galaxies, Exoplanets & Astrobiology, Stars and Stellar Populations). Moderators will present a summary of the panel discussions at the end of Day 1.
Day 2: Mission Concepts – Capabilities and Implementation
Focus: Day 2 is focused on implementation, capabilities, and technologies (software and hardware) relevant to the ASTRA submitted mission concepts. A summary of the Innovation for Astrophysics Missions Workshop (May 2026) will inform discussions regarding industry and other capabilities and opportunities that may be leveraged.
Breakout Sessions: These sessions will be organized by capability groups, which will be determined once the submitted mission concept documents are reviewed.
Format & Goals: Breakout sessions will feature a mix of presentations and flexible discussion. The goal is for teams with concepts at varying maturity levels to collaborate, find commonalities, and strengthen their respective capability groups.
Abstract Submission Note: Teams may submit multiple abstracts for these sessions if their concept spans different capabilities (e.g., requiring both UV and X-ray technologies).
Day 3 & Workshop Outcome
A primary goal of this workshop is to refine a draft “science-to-capabilities” matrix, which will be built using inputs from your submitted ASTRA mission concept documents. During the Day 1 and 2 breakout sessions, moderators will capture key discussion points to present during end-of-day summary panels. On Day 3 of the workshop, we will hold a plenary discussion to recap the week and collaboratively revise the “science-to-capabilities” matrix. Together as a community, we will add, refine, and prioritize science questions, mapping them to mission concepts.
Key Upcoming Dates:
24 June 2026: Abstract submission deadline (link). If you have already submitted an abstract and would like to modify it based on the guidelines above, please delete your previous contribution and send another submission.
The ASTRA initiative (linked below) will promote new strategic mission concepts for astrophysics. We would like to encourage you to think about new strategic mission concepts for the coming decades of astrophysics. Please join us for a community webinar next Wednesday, June 10, 12:00 – 1:00 pm ET ( 9:00 – 10:00 am PT) where we will discuss ASTRA.
As part of ASTRA, the Community Science (Ad ASTRA) Workshop will take place 1-3 September 2026 in Pasadena. New concept ideas will be discussed at this event.
To join the ASTRA initiative, mission concept template is now available (linked below). There are also instructions for submission. Submitted concept ideas will be discussed at the September workshop.
The IRSTIG will host a community brainstorming session from 1-3pm ET / 10am – 12pm PT. We understand this is short notice, however given the rapidly approaching ASTRA workshop abstract deadline (June 24th) and ASTRA mission concept template submission deadline (June 26th), we feel that this coming Friday is our best opportunity to rally the IR community. As such, we will be holding an open-invite brainstorming session to help energize and organize the community. This will be a rather freeform meeting to allow for flexibility, but a rough schedule is as follows:
We will begin at 1pm ET/ 10am PT with a brief introduction to the ASTRA initiative and our charge in developing concepts from Peter Kurczynski, Chief Scientist of the NASA Cosmic Origins Program Office.
Following this, we will open the floor to any member of the community to present a 3 slide / 2min pitch of a mission pre-concept (i.e. does not have to be a fully formed idea). This could look like one or more interesting science questions that you are looking for collaborators to help build into a well-founded mission concept, to a cutting edge technology that could be infused into or enable a future IR mission and you’d like science investigators to help develop, to a concept that has been already submitted to a competitive mission selection process. The goal here is to bring the community together and encourage a breadth of ideas so that community members may figure out where they can contribute and participate in the ASTRA process.
Following these pitches, we would open the floor for a discussion of the recurrent and over-arching science theme drivers that motivate cosmic origins mission development, distilling the outcome into broad topical/mission bins.
In the last ~hour, we will enable breakout rooms around these topics so that community members can self-organize. The goal here is to form small teams that will eventually complete and submit an ASTRA initiative mission concept template found here.
Meeting connection information will be provided prior to Friday. Please feel free to share amongst your colleagues and students, our community benefits from a diversity of ideas. We hope to see you there!
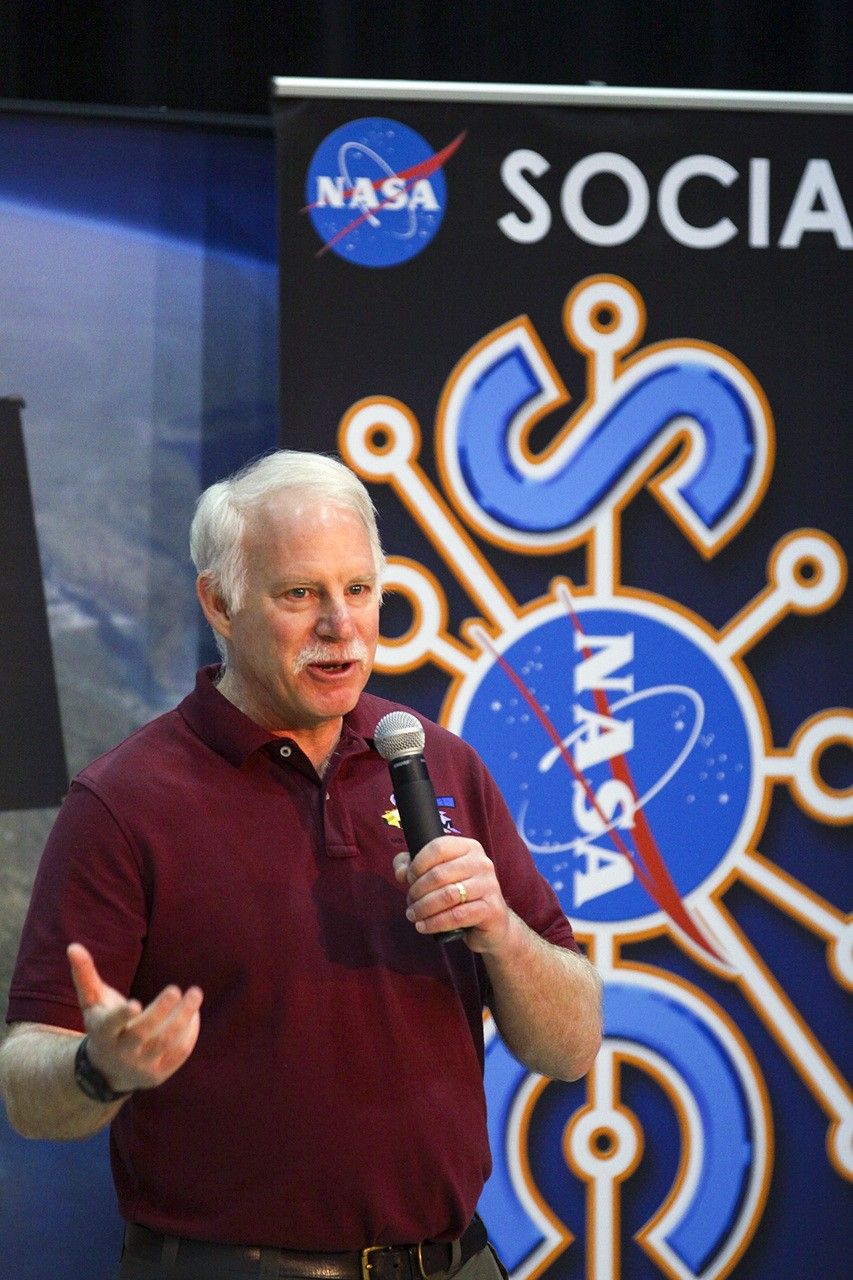
Irons, now an emeritus scientist at NASA Goddard Space Flight Center, played an integral role in shaping the Landsat program into what it is today. He served as deputy project scientist for Landsat 7 before taking over as project scientist for Landsat 8. From the earliest days of Landsat 8—then called the Landsat Data Continuity Mission (LDCM)—all the way through launch and operation, Irons worked across the agency and with colleagues at the USGS to ensure that Landsat continued providing critical data to researchers around the world. He championed rigorous calibration standards and fought to keep the thermal band on Landsat 8. Now, with projects like OpenET relying on evapotranspiration data derived from Landsat thermal imagery, the strength of his vision has only become more apparent.
Irons also served as the director of NASA Goddard’s Earth Science Division during the turbulent early days of the COVID-19 pandemic. Contending with global disruption, he prioritized making sure that everyone had the support that they needed to continue doing great work. As a leader and a scientist, Irons left a legacy of collaboration and innovation that lives on today.
We checked in with Irons about his role in Landsat’s history, what it takes to be a good leader, and winning the Pecora award:
NASA missions are so collaborative. Are there mentors, colleagues, or teams that you would want to share this recognition with or give special mention to?
One reason I feel so honored is that prior recipients have been my supervisors, mentors, role models, and colleagues whose work I admired and who inspired me. There’s a long list of people who have been recipients, and I am very honored to be added to that list.
There are also many people who have not yet been recognized who are very deserving. I’ve written letters of support for others, and I hope I’m called on again because there are more people who deserve recognition than there are awards to give out.
One of the things highlighted in the Pecora Award announcement was your commitment to the long-term continuous data record of Landsat. Looking at the Landsat program, why is this continuity so critical for Earth science today?
Data continuity is the backbone of the Landsat program. We are looking for change over time. When we talk about climate change and the impact of humans on the land surface, those changes are multi-decadal. We wouldn’t be able to understand, characterize, and monitor those changes without a continuous data record.
And it’s really important that the data record is well-calibrated. When we see changes between data from one Landsat sensor relative to another, we need to be confident that it’s a change occurring on the Earth, not a change in the performance of the sensors.
That’s another major contribution cited in your award: how much you pushed for rigorous data calibration and quality assurance. How did you establish those processes, and how did that make Landsat the gold standard of satellite data?
Early in my career, I got in trouble over calibration. NASA was flying an airborne sensor called the Thematic Mapper Simulator, intended to anticipate the capabilities of Landsat 4 and 5. But the operators kept changing the radiometric gain in-flight to maximize the dynamic range. I told NASA Headquarters that we couldn’t compare that data to the actual Thematic Mappers if they kept changing the gain—it wasn’t the same radiometry! The HQ manager got really upset, but I weathered the storm and stuck to my guns.
Later, when Landsat 4 and 5 were returned to the U.S. government from private operation, there had been no real calibration since launch. I advocated for a ground system component at USGS EROS to perform calibration. I didn’t build it, but I did advocate for USGS to hire a brilliant guy named Jim Storey, who developed the software for the precise geolocation of pixels in the data.
When I became Landsat 8 Project Scientist, we needed a pre-launch calibration lead. I advocated for Brian Markham. Brian just did a remarkable job ensuring the calibration of the Operational Land Imager (OLI) and its cross-calibration with previous instruments. He was modest, humble, and built a highly effective team across private industry and agencies.
Another important part of your legacy was the effort to ensure that thermal-infrared measurements continued onto Landsat 8. Why was retaining those measurements so important?
Back when USGS charged for data, the use of thermal data was minimal. Some well-respected papers even claimed it wouldn’t be possible to use thermal data to estimate evapotranspiration rates. Based on that, the Director of Earth Sciences at NASA HQ was convinced that the thermal capability wasn’t providing a return on investment.
But while this debate was ongoing, people began developing methodologies for estimating evapotranspiration and water consumption using thermal data—prominently Martha Anderson at the USDA, and researchers at the University of Idaho. It became crucial for monitoring agricultural water use in the West, and was even used in adjudicating water rights. It was also useful for cloud detection and fire monitoring.
I felt strongly that dropping the thermal capability was inconsistent with our directive to continue the Landsat data record. However, due to time pressures and budget constraints, the decision was initially made to fly Landsat 8 without a thermal instrument. But then, when our schedule was pushed back by an independent review board, a window opened up. Center Director Ed Weiler, who had moved to HQ, supported putting a thermal sensor on the payload. Kathy Richardson and engineer Fernando Pellerano were assigned to build it on an incredibly tight schedule, and they did an unbelievable job.
Now, deriving evapotranspiration rates for water consumption is considered essential. Ironically, for Landsat 9, NASA HQ even briefly considered launching a satellite with only a thermal sensor!
You were the Project Scientist from the earliest days of the Landsat Data Continuity Mission (LDCM) all the way through the Landsat 8 launch and beyond. What was the biggest challenge you faced during its development?
There were a lot of problems. Laughs. Because of the Land Remote Sensing Policy Act of 1992, the government was exploring commercial data buys for the follow-on mission. NASA spent five painful years attempting to implement LDCM as a commercial data buy. Only one company ultimately responded to the RFP, and it wasn’t a good deal for NASA, so it was rejected.
Then we were directed to put the Landsat sensor on an NPOESS platform (combining civilian and military weather satellite requirements). That platform wasn’t technically suitable, and the program ultimately fell apart.
Finally, the Office of Science and Technology Policy directed us to launch a free-flyer. Bill Ochs took over as project manager, and he deserves so much credit for the success of Landsat 8. He essentially rescued the project and put it on a path to success.
Reflecting on the partnership between USGS and NASA, how did you help build that, and what makes long-term interagency collaboration possible?
Darrell Williams and I worked very hard to establish a good relationship between NASA Goddard and USGS EROS. I took many trips to Sioux Falls. With Landsat 7, the EROS Center Director at the time, Don Lauer, brought in new people with great experience, like Jim Storey, Doug Daniels, and Jim Nelson. They developed the geometric rectification software for Landsat 7, and by the time we worked on Landsat 8, they had the right people in place to develop the whole data processing system. And we all got along really well with them. We still keep in touch with a number of them and consider them friends.
With Landsat 10 on the horizon, are there emerging applications or discoveries you’re excited about?
Yes. A major emerging capability is using Landsat data in concert with other systems, like ESA’s Sentinel-2, or with LIDAR and radar for 3D forest mapping. The community has asked for more frequent observations, especially more frequent thermal observations to measure water consumption more precisely without extrapolating over long gaps during the growing season.
There’s also great interest in using Landsat for water quality assessment, combining it with the PACE mission to monitor coastal and inland water quality. And tracking glacial velocities, glacial retreat, and even population displacement in conflict regions are all expanding areas. Landsat is truly foundational.
What was your biggest takeaway about leadership from your role as Director for the Earth Science Division at Goddard?
I was asked to step up after my predecessor, Piers Sellers—who was an absolute superstar—passed away. My main goal was simply to create an environment where the highly diverse researchers within the division could be successful. I wanted to minimize bureaucratic hindrances so they could focus on their work.
What I learned is that there is a limit to authority. Dictating doesn’t work. You have to lead, engage people, bring them into discussions, and get their buy-in. I used to joke that the job was like working with 1,400 valedictorians! It’s a high-achieving, dedicated group. My challenge was sometimes just reminding them to respect the work of the person down the hall, because people can get so fiercely focused on their own research.
My primary goal during my tenure was to provide stability, especially since it spanned what was then the longest government shutdown in history, followed by the COVID-19 pandemic. I was incredibly impressed by how productive the division remained through a complete disruption in how they worked.
What is the most important piece of advice you would give to young scientists?
Persistence. Persistence in pursuing your interests is critical. The only reason Landsat 8 was a success was that we persisted through several failed attempts to reformulate the program, schedule challenges, and budget uncertainties.
Funding and mission success aren’t entitlements based on your name or reputation. You have to work hard, keep putting forward proposals, do good work, and persist through rejections. If you really believe in what you’re doing, Goddard is a great place to work. You can get a lot done. But it takes persistence.
This interview was condensed and lightly edited for clarity.
NASA Webb Finds Strongest Evidence Yet for ‘Black Hole Stars’
While the primary purpose of NASA’s James Webb Space Telescope’s observations of galaxy cluster Abell S1063 was to look for a certain population of stars, scientists obtained a detailed spectrum of GLIMPSE-17775 from the dataset. This little red dot is located behind Abell S1063.
Credits: Image: NASA, ESA, CSA, Vasily Kokorev (UT Austin); Image Processing: Alyssa Pagan (STScI)
The complex puzzle known as little red dots has become more complete since their initial discovery by NASA’s James Webb Space Telescope in 2022. Now a particular little red dot’s spectrum is helping connect many of the pieces.
A team of astronomers led by Vasily Kokorev at the University of Texas at Austin identified the lucky dot in question: GLIMPSE-17775. By carefully analyzing the dot’s spectrum captured by Webb — the deepest spectrum to date of a little red dot — the research team has identified multiple lines of evidence, all of which support the interpretation that GLIMPSE-17775 is a supermassive black hole enveloped in a dense cocoon of partially ionized gas, a model referred to as the BH* (black hole star) scenario. A paper describing the results was published today in The Astrophysical Journal.
“I think part of the scientific community is converging on a singular picture — that little red dots can be explained by black hole star models. But none of the previous little red dots have all of the pieces of evidence in the same place,” said Kokorev, lead author of the study. “With GLIMPSE-17775 we can test these models because of how deep and amazing this source’s spectrum is.”
Image: Abell S1063 with Pullout of GLIMPSE-17775 (NIRCam Image)
While the primary purpose of NASA’s James Webb Space Telescope’s observations of galaxy cluster Abell S1063 was to look for a certain population of stars, scientists obtained a detailed spectrum of GLIMPSE-17775 from the dataset. This little red dot is located behind Abell S1063.
Image: NASA, ESA, CSA, Vasily Kokorev (UT Austin); Image Processing: Alyssa Pagan (STScI)
Connecting puzzle pieces
Soon after Webb first began science operations, it discovered a new, mysterious type of object in the very early universe – abundant red objects that emerged about 600 million years after the big bang. Scientists have explored multiple explanations for these little red dots, including the black hole star scenario.
A set of fortunate circumstances brought about this new, elaborate spectrum of a little red dot. The little red dot that would come to be known as GLIMPSE-17775 was fortunately included in Webb’s imaging and spectroscopy efforts for a project that sought to look for Population III stars and faint galaxies in galaxy cluster Abell S1063. This little red dot is more distant than the galaxy cluster and magnified by gravitational lensing. (GLIMPSE-17775 has a cosmological redshift of 3.5, meaning it existed about 1.8 billion years after the big bang.)
While Webb provided a 30-hour spectrum of the little red dot, the effect of gravitational lensing made it equivalent to 80 hours of telescope time. This combination of Webb’s infrared sensitivity and nature’s own “magnifying glass” amplified the amount of detail that could be gleaned from GLIMPSE-17775. The result was more than 40 spectral lines from this small, red source, which is the most detailed little red dot spectrum to date.
“When we saw the spectrum for the first time, it was like having all the pieces of a puzzle scattered on the floor,” said Kokorev. “We picked up each piece of the puzzle, measured the lines, and started combining the different pieces into a mosaic. Maybe a few pieces looked like nothing at first, but then a couple of them came together, and we realized that there was something there.”
The spectroscopic data collected by Webb contains multiple lines of evidence that support the interpretation that little red dot GLIMPSE-17775 is a black hole star: a rapidly accreting, or growing, black hole enveloped in a dense gas cocoon, which is reprocessing the light emitted from near the black hole and producing the features seen in the spectrum.
Image: Evidence of a ‘Black Hole Star’
NASA’s James Webb Space Telescope captured the deepest spectrum to date of a little red dot. More than 40 spectral lines have been discerned from the data, many of which independently support the theory that GLIMPSE-17775 is a black hole enshrouded by a hot, dense gas cocoon.
Illustration: NASA, ESA, CSA, Vasily Kokorev (UT Austin); Designer: Leah Hustak (STScI)
Lines of evidence
Among the 40-plus lines that the team detected in GLIMPSE-17775’s spectrum were various independent indicators that all align with the BH* scenario. For example, the team found that many of the spectral lines, such as hydrogen, oxygen, and helium, do not fit a simple model of a rotating gas cloud. Instead, the best fit model includes a broadening effect known as electron scattering, a telltale sign that a dense, layered gas cocoon is enshrouding this source.
The strength and ratios of certain lines to each other, most notably the 16 iron lines that compose what the team has dubbed an “iron forest” and certain oxygen lines, require a high-energy source to produce them, like a rapidly accreting black hole. Additionally, astronomers noted the fluorescence and absorption of helium in the spectrum, both of which individually suggest that there is a dense medium enveloping a powerful source.
The BH* scenario not only fits GLIMPSE-17775; it also accounts for why most little red dots are faint in X-rays, since any such emission is likely absorbed by the dense gas cocoon.
One missing element of the GLIMPSE-17775 puzzle piece is the part of the spectrum that would reveal what’s known as a Balmer break, or a strong dip in the emitted light that’s a signature characteristic of little red dots. To build a more comprehensive understanding of this little red dot, the team incorporated ancillary data from two observing programs that used NASA’s Hubble Space Telescope: the Frontier Fields and BUFFALO (Beyond Ultra-deep Frontier Fields And Legacy Observations) programs.
The Webb and Hubble data together help explain why the Balmer break is weaker than what typically is found in other little red dots: A giant host galaxy is surrounding GLIMPSE-17775. Although a little red dot’s host galaxy is not something that has been usually seen at such scale before, it isn’t inconsistent with the dense gas cocoon model. The black hole star model of little red dots attributes excess blue light to stars in the host galaxy.
When Webb first discovered little red dots, some researchers thought these objects had “broken cosmology,” unsure how galaxies could have grown so big so quickly in the early universe to account for all this light coming from their stars. However, the team believes the GLIMPSE-17775 puzzle piece fits nicely in the existing framework of the universe’s evolutionary history, because black hole masses don’t need to be as high in order to explain the broad emission lines.
“Everything fits, nothing is broken, and I think that makes the puzzle that is our universe even better,” said Kokorev. “Looking ahead, I’m eager to dive deeper and learn about what is powering the central engines of little red dots. While we think it’s a black hole, there are some other interesting theories being proposed, which is exciting. Maybe in a year or two, we’ll have the final answer to what powers these sources.”
The James Webb Space Telescope is the world’s premier space science observatory. Webb is solving mysteries in our solar system, looking beyond to distant worlds around other stars, and probing the mysterious structures and origins of our universe and our place in it. Webb is an international program led by NASA with its partners, ESA (European Space Agency) and CSA (Canadian Space Agency).
The following sections contain links to download this article’s images and videos in all available resolutions followed by related information links, media contacts, and if available, research paper and Spanish translation links.
Related Images & Videos
Abell S1063 with Pullout of GLIMPSE-17775 (NIRCam Image)
While the primary purpose of NASA’s James Webb Space Telescope’s observations of galaxy cluster Abell S1063 was to look for a certain population of stars, scientists obtained a detailed spectrum of GLIMPSE-17775 from the dataset. This little red dot is located behind Abell S1063.
Evidence of a ‘Black Hole Star’
NASA’s James Webb Space Telescope captured the deepest spectrum to date of a little red dot. More than 40 spectral lines have been discerned from the data, many of which independently support the theory that GLIMPSE-17775 is a black hole enshrouded by a hot, dense gas cocoon.
GLOBE Mission Earth Educators Participate in Land Cover Community of Practice
During the 2025-2026 school year, educators from the NASA Science Activation Program’s GLOBE (Global Learning and Observation to Benefit the Environment) Mission Earth projectparticipated in a specialized Community of Practice led by NASA Langley Research Center to refine how students interact with NASA’s land cover data (MODIS, Landsat, and Sentinel-2). Their collaboration focused on four key areas:
Data Collection: Improving the process of making and submitting land cover observations to NASA using the GLOBE Observer App.
Curriculum Integration: Identifying connections between land cover observations, satellite data, and classroom learning.
Student Research: Brainstorming potential land cover research topics/questions for students.
Validation: Providing expert feedback on the satellite comparison process.
Through GLOBE, communities can contribute meaningful environmental data to a long-term data record. When participants make observations of land cover via GLOBE Observer, the team at NASA Langley compares their observation with satellite data for a similar time and location and sends a satellite comparison email, which includes a data table that shows how their GLOBE observation and the corresponding satellite data compare.
Key Community of Practice Findings: The Community of Practice included a total of 14 educators, with six actively collecting land cover observations with their students using the GLOBE Observer app. These land cover observations were collocated to MODIS, Landsat, and Sentinel-2 data with educators receiving a satellite comparison email.
Within the scope of this Community of Practice, 10 of the educators developed student research plans for the 2026-2027 school year focused on land cover data, addressing questions such as:
How does land cover affect surface temperature?
How has land use changed over time for our local area?
How does land cover differ for locations (such as other schools) at the same latitude but different longitudes?
How do different land covers impact flooding?
The educators were extremely excited to have the opportunity to interact and learn from each other as a community, as well as to connect with NASA subject matter experts. Based on lessons learned from the Community of Practice, the team has a better understanding of how NASA land cover data can be incorporated in the classroom, what types of research questions educators might present to their students, and resources that could be developed to assist educators in the implementation of their research plans.
Within the scope of the Land Cover Community of Practice (COP), educators were asked to provide feedback for the GLOBE Mission Earth GLOBE Nature Notes Guide that was developed by the NASA Langley team, leveraging the Nature Note model created by the NASA Science Activation program’s Learning Ecosystems North East (LENE) project, which is led by the Gulf of Maine Research Institute. The GLOBE Nature Notes aligned with GLOBE protocols were developed to assist educators in integrating the Nature Notes process with their students’ GLOBE observations. One of the COP educators is currently developing an example of a land cover GLOBE Nature Note that will be shared with the GLOBE and NASA Science Activation community, once completed.
Educators can join the GLOBE Program and contribute observations of Land Cover and other environmental conditions by downloading the GLOBE Observer app and learning more about Land Cover.
Sample of a NASA GLOBE Observer satellite comparison table that gets emailed to a participant after submitting a land cover observation. (NASA Langley GLOBE Mission Earth Science Activation project team).
NASA GLOBE Observer
GLOBE Mission Earth is supported by NASA under cooperative agreement award number NNX16AC54A and is part of NASA’s Science Activation Portfolio. Learn more about how Science Activation connects NASA science experts, real content, and experiences with community leaders to do science in ways that activate minds and promote deeper understanding of our world and beyond: https://science.nasa.gov/learn/about-science-activation/.
A compact, multifrequency radar built by a team at NASA’s Jet Propulsion Laboratory will make it easier to collect information about dynamic cloud systems. Called CloudCube, this new instrument simultaneously probes the atmosphere with three radar signals, spanning 36 to 240 GHz, for optimized sensitivity to a wide range of water droplet and ice particle sizes.
Figure 1: A prototype of CloudCube’s G-band channel was installed at Cape Grim, Tasmania, as a guest instrument for the Department of Energy’s Cloud and Precipitation Experiment at Kennaook (CAPE-K)
Credit: Raquel Rodriguez Monje / JPL
Built with funding from NASA’s Earth Science Technology Office Instrument Incubator Program, CloudCube transmits and receives Ka-, W-, and G-band signals, making it the first compact radar system capable of simultaneously probing meteorological targets at wavelengths spanning approximately one to ten millimeters. Researchers will be able to combine information from the three signals to learn more about the initiation and evolution of precipitation, as well as cloud microphysics and radiative properties.
“We’re making a low-power, low-mass instrument to facilitate new cost-efficient missions for atmospheric observations. Building a multi-frequency radar, especially at G-band, is very novel,” said Raquel Rodriguez Monje, a systems engineer at JPL and principal investigator for CloudCube.
Each of CloudCube’s three signals observes a different element of cloud physics. Ka-band radar signals are ideal for collecting precipitation profiles; W-band radar signals are preferred for measuring cloud particles that give rise to precipitation; and G-band radar signals, which have never been collected from a space-based instrument, are ideal for measuring ice and liquid water content inside very light clouds (a paper describing this measurement can be found here).
Probing the atmosphere simultaneously with three signals allows researchers to collect data on all these cloud features at once, which is valuable for improving weather forecasts and especially climate modeling. CloudCube leverages innovations in millimeter-wave hardware to pack three radar modules–one for each signal–within a single compact system.
Figure 2. A photo of the radar electronics for CloudCube’s compact G-band radar. Producing G-band radar signals requires a large amount of energy, and CloudCube is one of the first instruments to produce those signals effectively from a compact platform.
Credit: Raquel Rodriguez Monje / NASA JPL
One CloudCube innovation concerns the specialized components required to transmit G-band power from a compact, low-power instrument. The detection of cloud signals requires high transmit power, which CloudCube achieves by combining the outputs of multiple high-efficiency frequency-multiplication devices that allow the instrument to generate hundreds of milliWatts at 240 GHz. Another innovation of CloudCube is that it was designed to use as few radio frequency components as possible to reduce its mass and power consumption, which could lower the cost of future Earth-observing orbital instruments.
Flying an instrument equipped with G-band radar in space will be a new capability and will allow researchers to achieve greater spatial resolution and sensitivity in the study of cloud microphysical processes.
“Basically, we’re weighing clouds using these combinations of frequencies in a way that we couldn’t do before we had the G-band,” said Matt Lebsock, a researcher at JPL and co-investigator for CloudCube.
The instrument has been tested in the field. A ground-based prototype of CloudCube’s G-band channel operated continuously for 11 months during the Department of Energy’s Cloud and Precipitation Experiment at Kennaook (CAPE-K) campaign. CloudCube also participated in the Eastern Pacific Cloud Aerosol Precipitation Experiment, a ground campaign sponsored by the Department of Energy. A paper describing the results of that experiment can be foundhere.
Most recently, CloudCube successfully operated all three frequency bands from NASA’s Gulfstream III aircraft and collected its first airborne observations of snowfall as part of the North American Upstream Feature-Resolving and Tropopause Uncertainty Reconnaissance Experiment campaign—a NASA-funded campaign designed to improve forecasts of high-impact winter weather. The CloudCube team is currently calibrating and processing the data for public release.
For additional details, see the entry for this project onNASA TechPort.
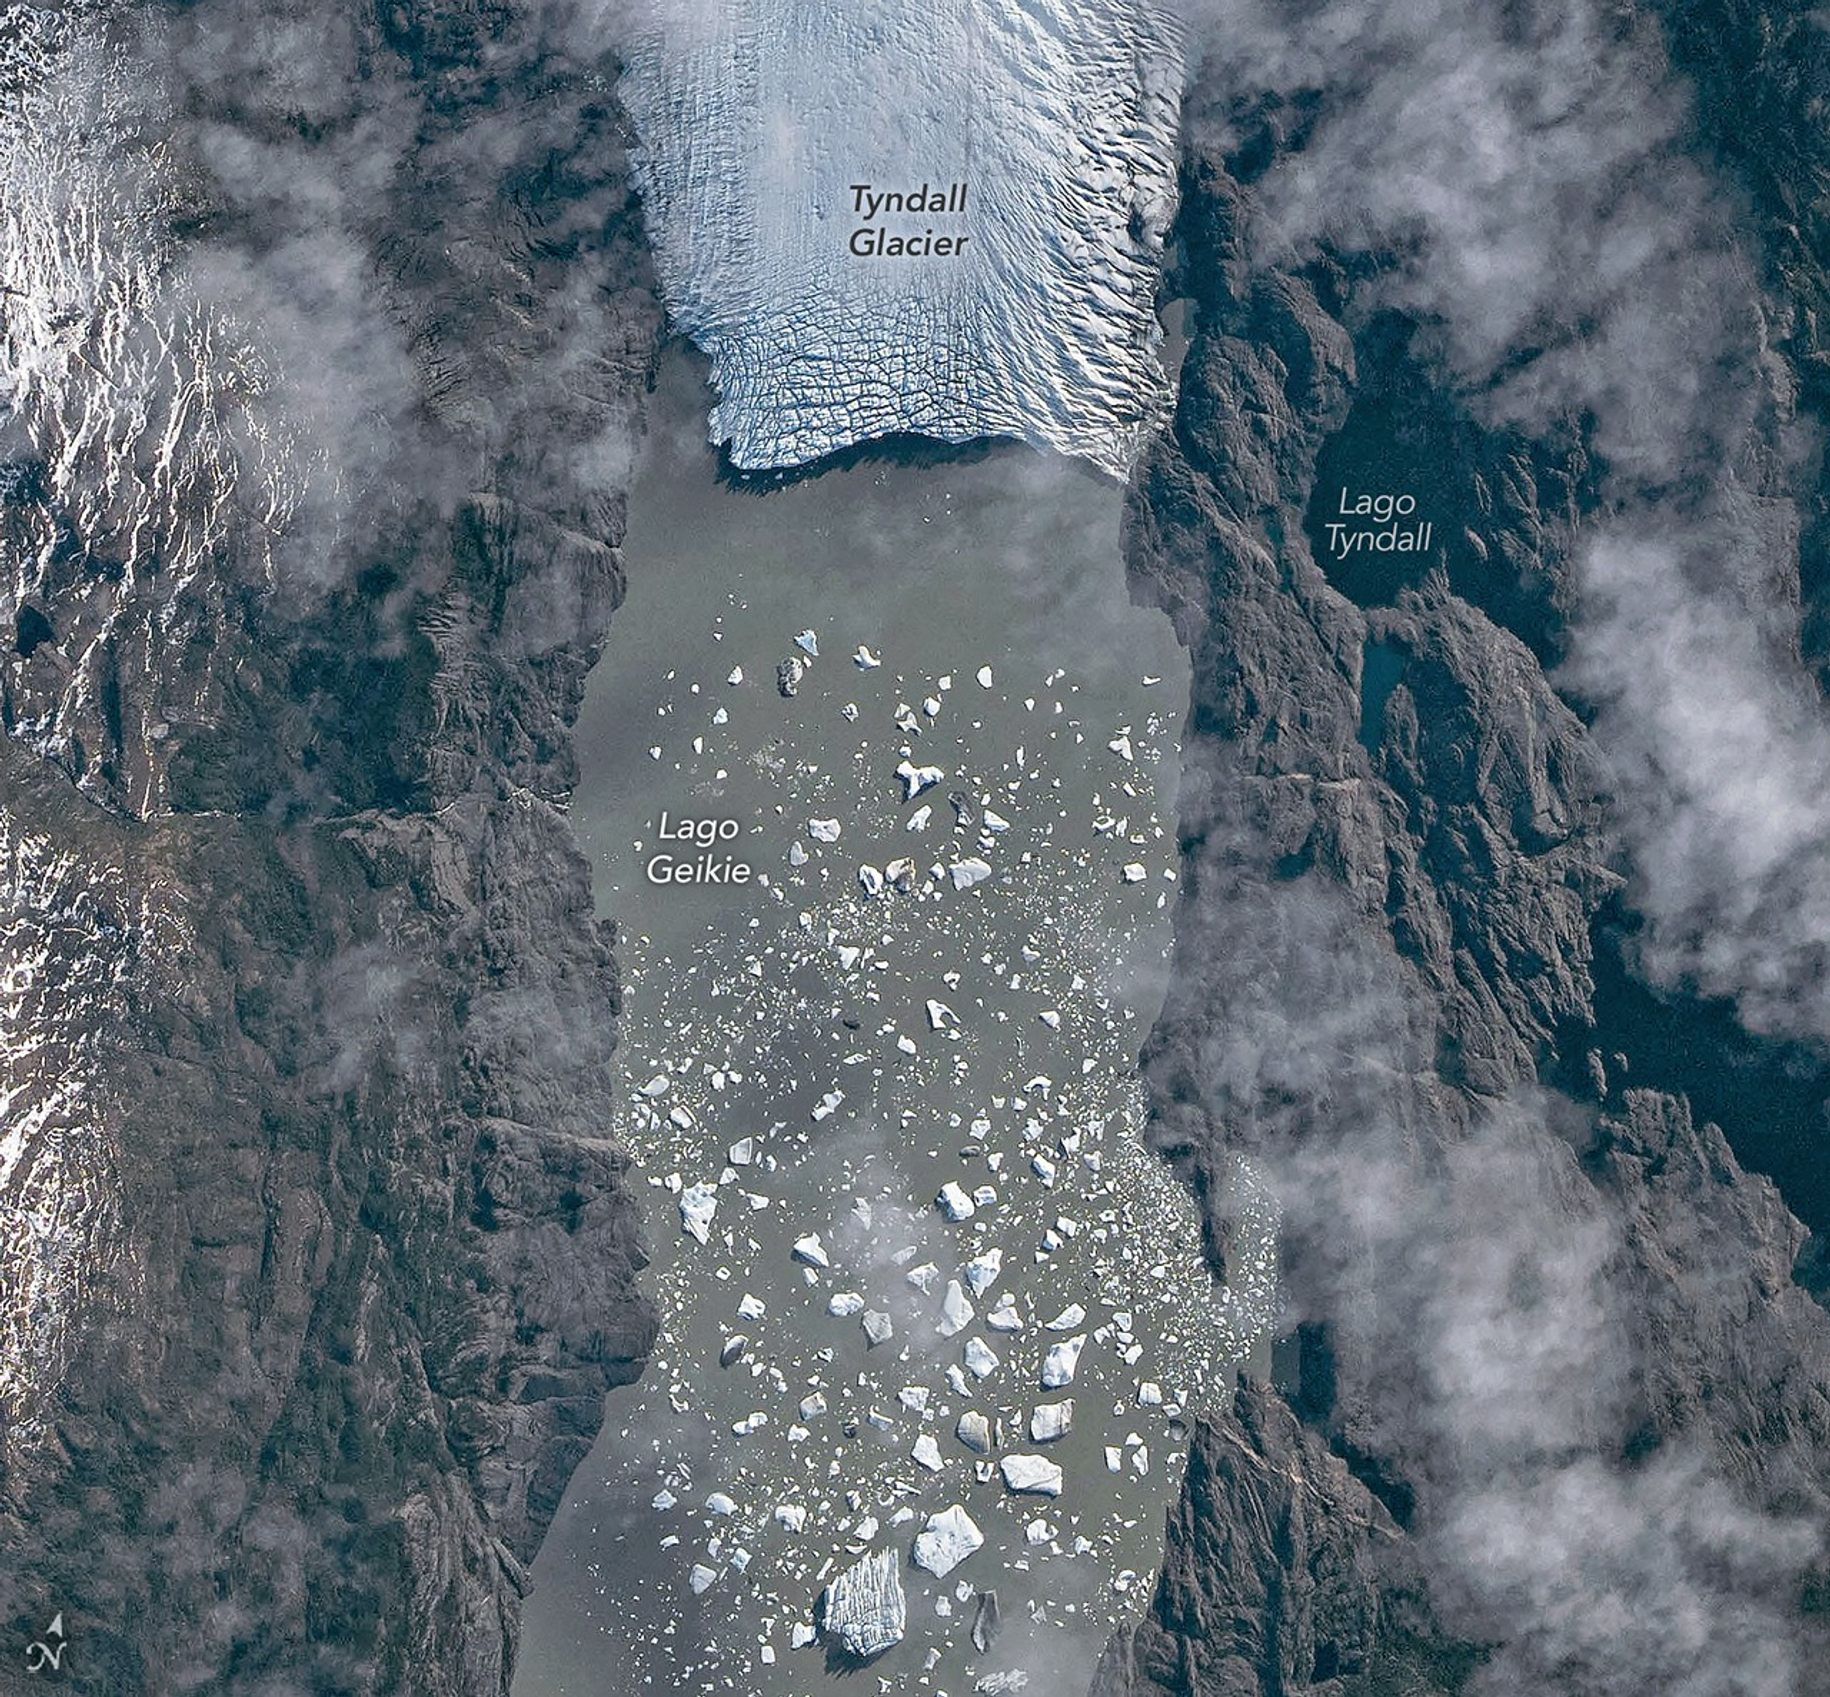
The Southern Patagonian Icefield is the largest expanse of ice in the Southern Hemisphere outside of Antarctica. The mass of glacial ice extends hundreds of kilometers along the spine of the Andes, feeding dozens of dynamic outlet glaciers that grind their way down from higher elevations. Many of these rivers of ice terminate in the sea or in proglacial lakes.
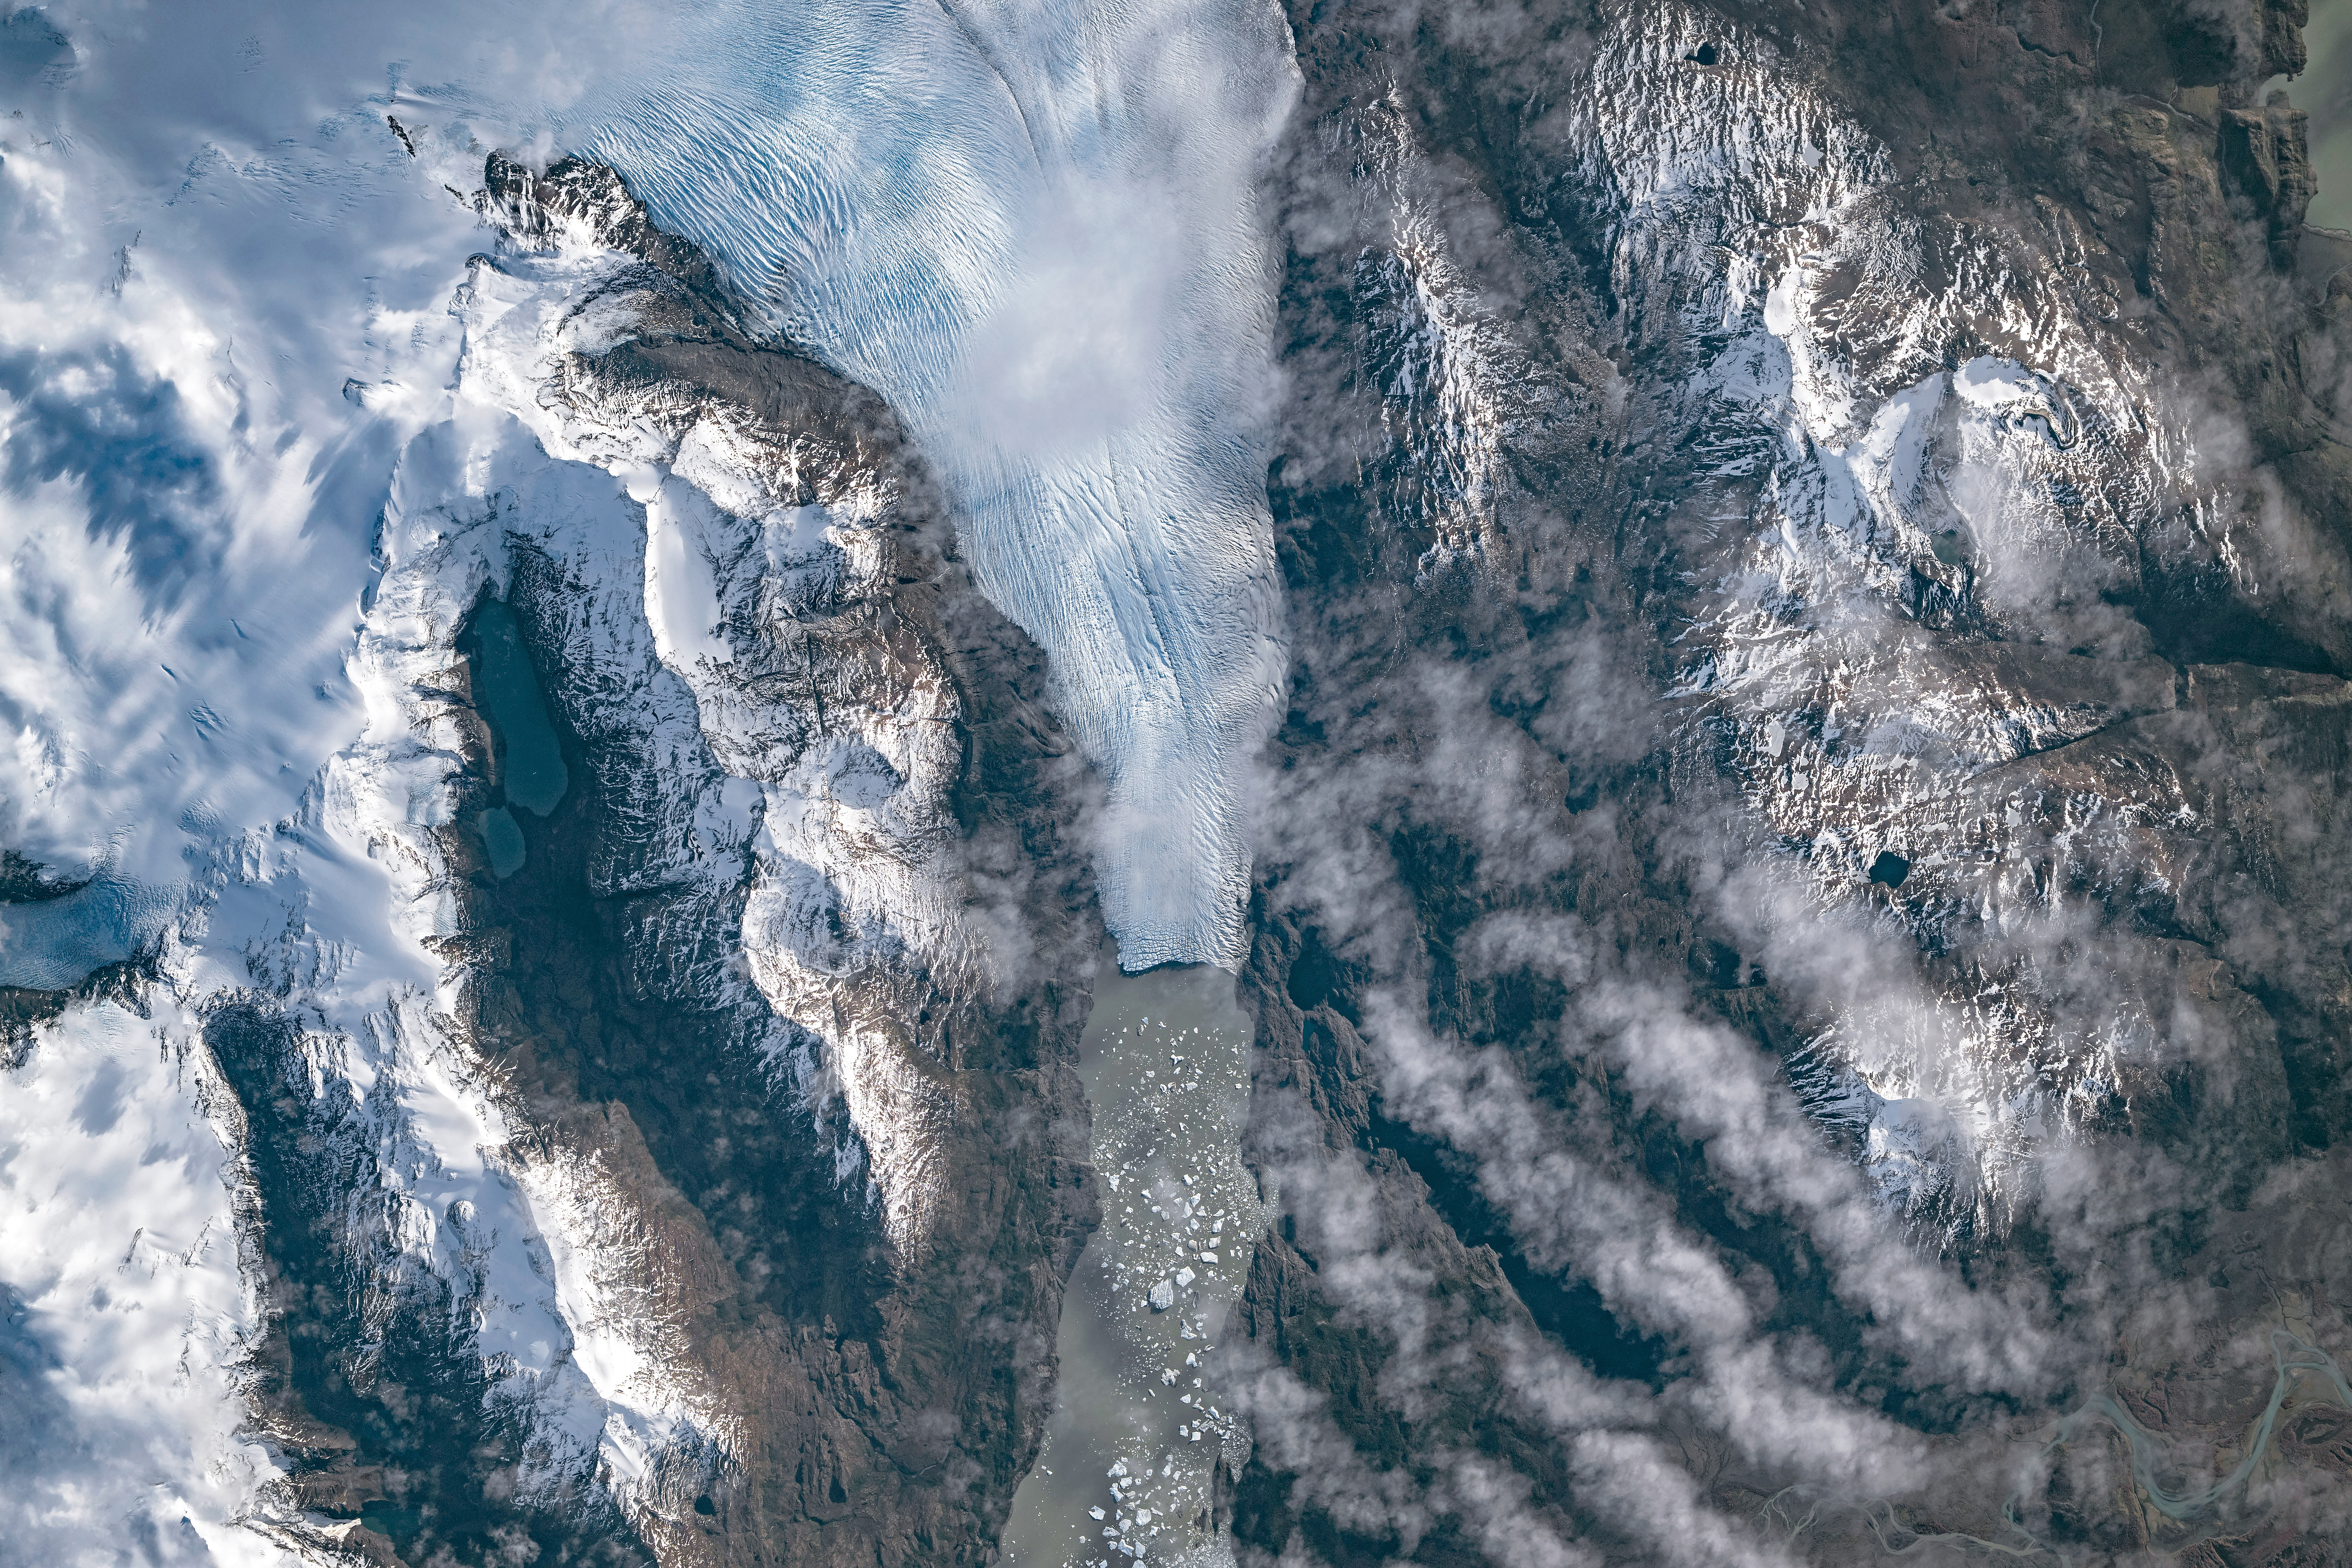
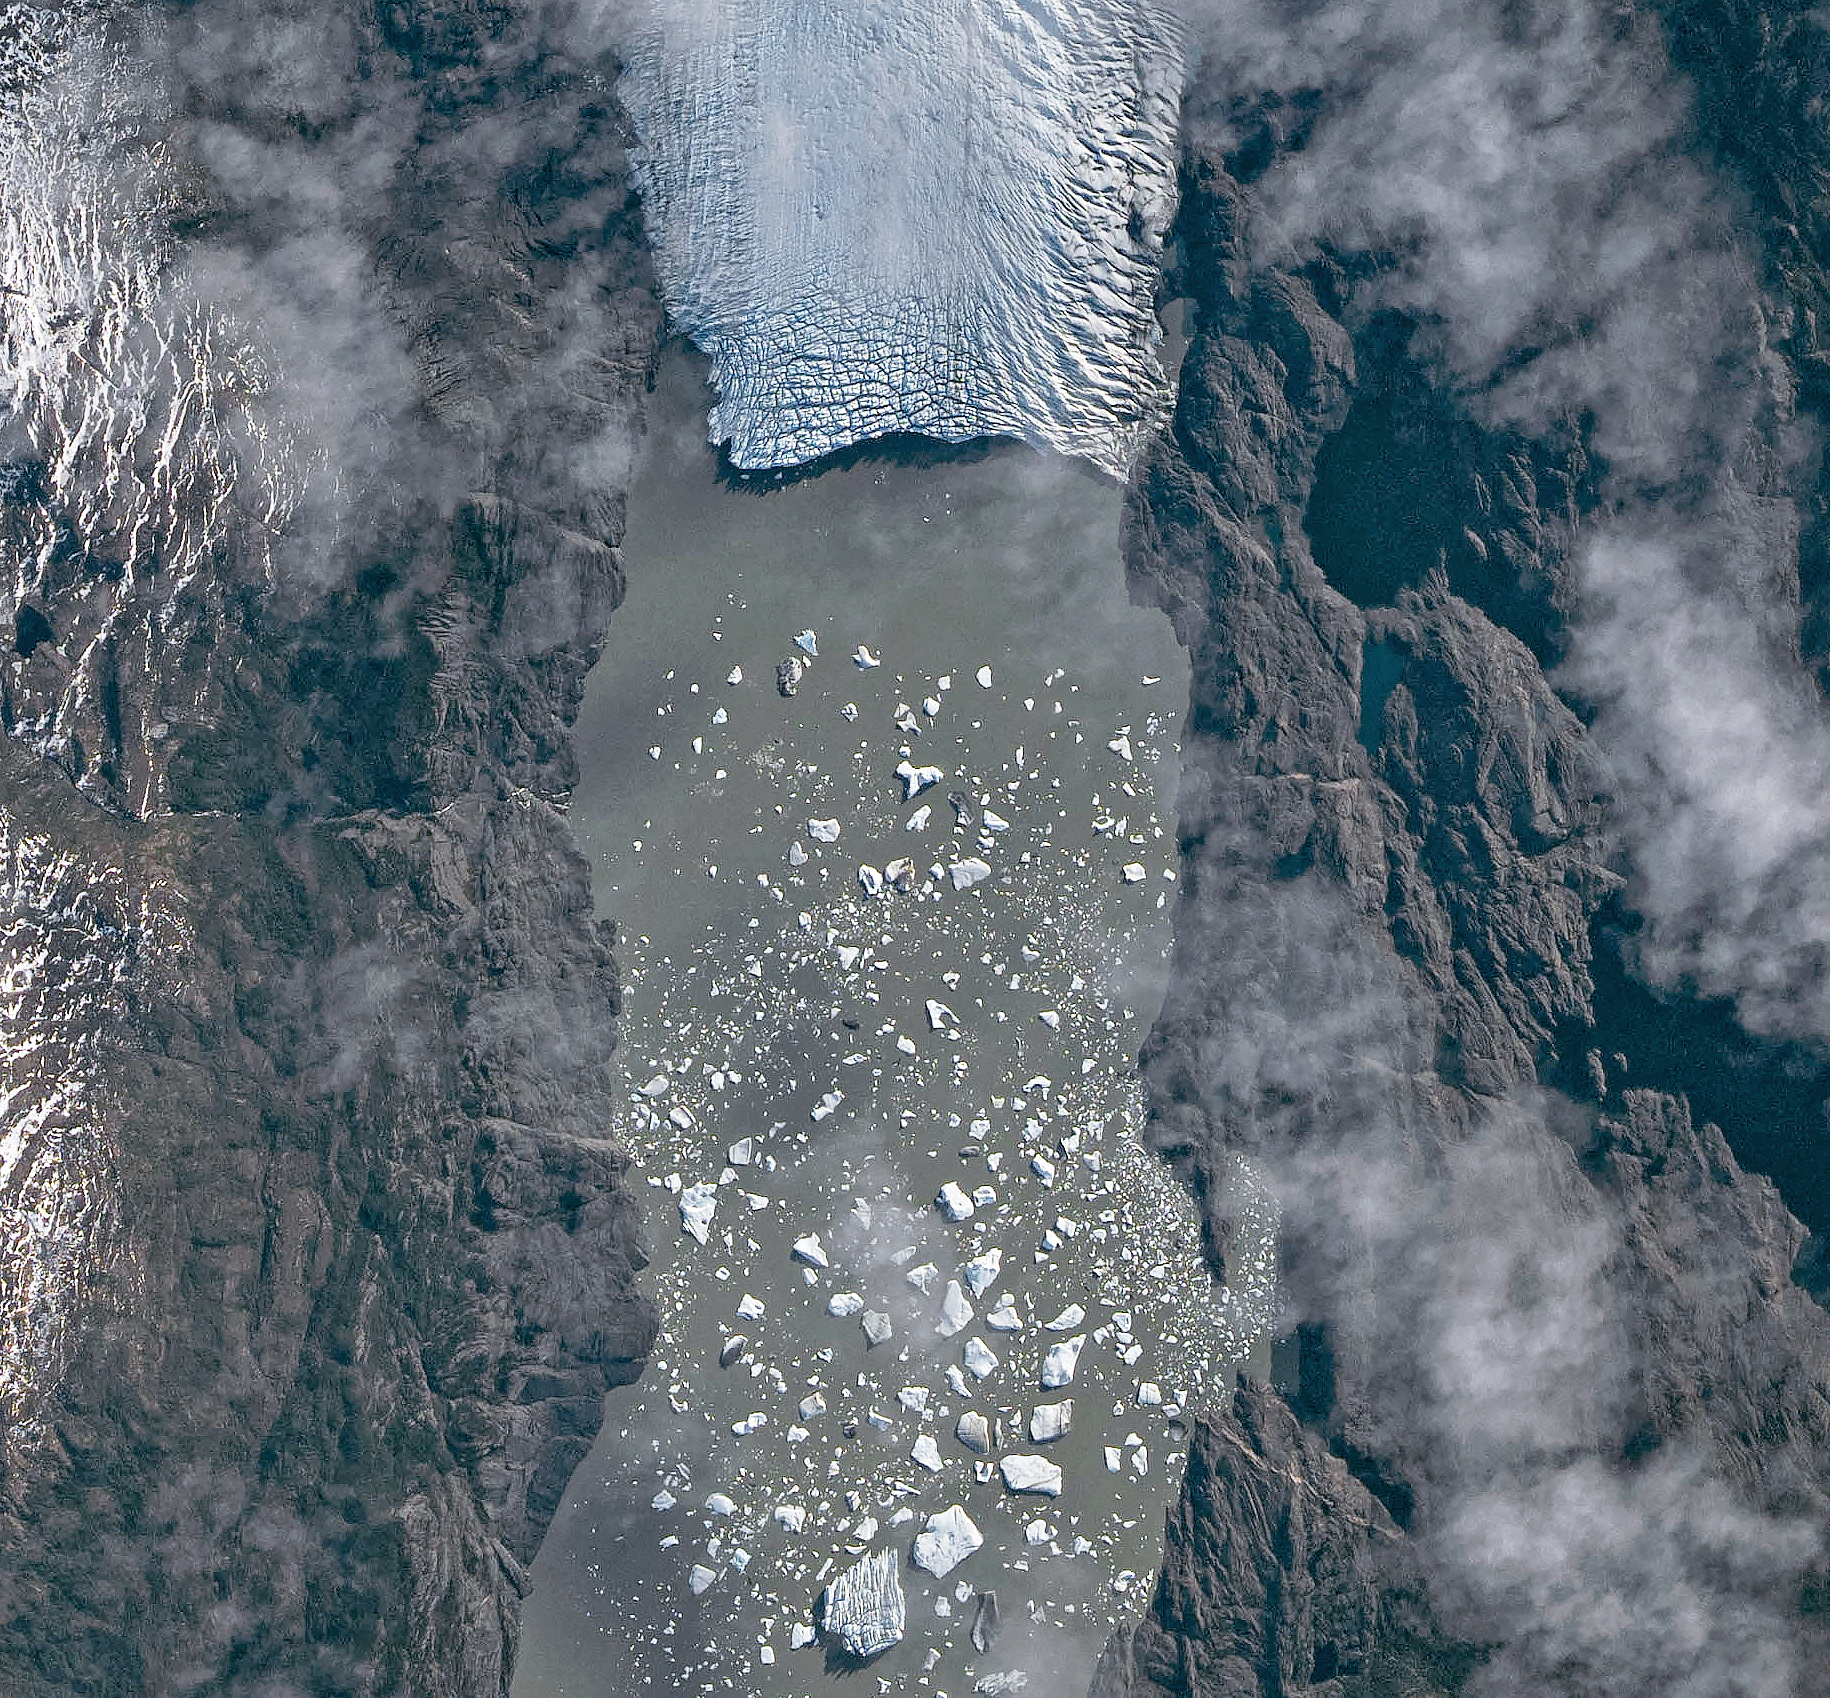
An astronaut aboard the International Space Station photographed one of these glaciers—Tyndall Glacier in southern Chile—through a layer of ethereal clouds on May 10, 2026. Fragments of ice that had calved off its terminus were visible floating on Lago Geikie.
Like most Patagonian glaciers, Tyndall has been shrinking since the end of the Little Ice Age about 150 years ago. Lago Geikie formed at Tyndall’s terminus around 1940, according to glaciologist Mauri Pelto of Nichols College, and gradually expanded as the ice retreated. Part of the glacier previously terminated in Lago Tyndall to the east, but thinning ice cut off that outlet by 2010, Pelto said. (The ice’s retreat also exposed bedrock along its eastern edge that contains scores of ichthyosaur fossils.)
Along with thinning, ice calving off the glacier’s front has reduced its volume. Tyndall has lost 2.2 kilometers (1.4 miles) in length since November 2022, Pelto said, following about a decade of limited retreat with considerable thinning. A significant calving event in March and April 2023 contributed to the recent uptick in ice retreat. During that time, satellites observed several large icebergs breaking away from Tyndall’s terminus.
Austral autumn in 2026 was a time of active calving retreat at Tyndall (and some neighboring glaciers), Pelto said, albeit more incremental than three years prior. “The substantial crevasses crisscrossing the glacier near the calving front lead to many smaller icebergs,” he said. On the other hand, larger tabular icebergs tend to form when there are fewer deep crevasses near the terminus and the glacier’s ice is thinner.
May 10, 2026
The ice cliff at the terminus casts a substantial shadow, which can help scientists estimate the height of the glacier’s front. Pelto’s calculations, using information about the Sun’s position provided with the image, indicate that Tyndall’s front loomed 30–40 meters (100–130 feet) above the lake surface in May 2026. Observations from orbit, including astronaut photographs, can help scientists monitor and understand glaciers in remote regions where ground-based observations are scarce.
As for what comes next for Tyndall, Pelto expects many more small icebergs to continue breaking off, given the heavily crevassed appearance of the calving front. “Look for a burst of iceberg production next fall.”
Astronaut photograph ISS074-E-582898 was acquired on May 10, 2026, with a Nikon Z9 digital camera using a focal length of 560 millimeters. It is provided by the ISS Crew Earth Observations Facility and the Earth Science and Remote Sensing Unit at NASA Johnson Space Center. The image was taken by a member of the Expedition 74 crew. The image has been cropped and enhanced to improve contrast, and lens artifacts have been removed. The International Space Station Program supports the laboratory as part of the ISS National Lab to help astronauts take pictures of Earth that will be of the greatest value to scientists and the public, and to make those images freely available on the Internet. Additional images taken by astronauts and cosmonauts can be viewed at the NASA/JSC Gateway to Astronaut Photography of Earth. Story by Lindsey Doermann.
A suborbital rocket is scheduled to launch from NASA’s Wallops Flight Facility in Virginia during a window extending from June 10 – 16, 2026. No real-time launch status updates or livestream will be available.
This March 2026 aerial photograph shows the coastal launch range at NASA’s Wallops Flight Facility on Virginia’s Eastern Shore. Wallops is the agency’s only owned-and-operated launch range.
Courtesy Patrick J. Hendrickson; used with permission
NASA Wallops provides services such as vehicle tracking, data telemetry, and range safety from NASA’s only owned and operated launch range to ensure successful missions operations for the agency, commercial partners, and other government agencies.
10 June 2026 12:00pm – 1:00pm ET 9:00am – 10:00am PT
Community
Cosmic Origins
Type
Seminar
The ASTRA Initiative
Speaker
Jessica Gaskin
The ASTRA initiative will promote new strategic mission concepts for astrophysics, see here. We would like to encourage you to think about new strategic mission concepts for the coming decades of astrophysics.
As part of ASTRA, the Community Science (Ad ASTRA) Workshop will take place 1-3 September 2026 in Pasadena. New concept ideas will be discussed at this event.
To join the ASTRA initiative, mission concept template is now available, see here. There are also instructions for submission. Submitted concept ideas will be discussed at the September workshop.

 Login