❌

Reading view

Ancient Romans Were Obsessed With This Remarkable Herb – Then It Vanished Forever

Julius Caesar Augustus StatueSilphium was an extinct Libyan plant renowned for contraception, medicine, and trade. Its disappearance remains a historical mystery, and scientists continue searching for surviving descendants. Roman leader Julius Caesar is said to have kept a stock of it in the treasury. Ancient writer Pliny the Elder says Rome’s Emperor Nero owned the last stalk of [...]
  •  

Playing Pool with Planets

artist's impression of hot Jupiter exoplanets

Each Jupiter-size planet in the galaxy falls into one of three distinct categories: hot, warm, or cold. A new study suggests that despite the apparent differences between these populations, they may have all formed from the same underlying dynamical process: a game of pool played at planetary scales.

A Diversity of Jupiters

Though our solar system has only one Jupiter-size planet, elsewhere in the galaxy we have found three different species of these massive gas giants. Cold Jupiters closely resemble their namesake and orbit far from their host stars; hot Jupiters are the opposite and are found whipping around their stars on extremely close-in orbits. In between these are the warm Jupiters, which tend to orbit in the intermediate space between 0.1 and 1.0 au.

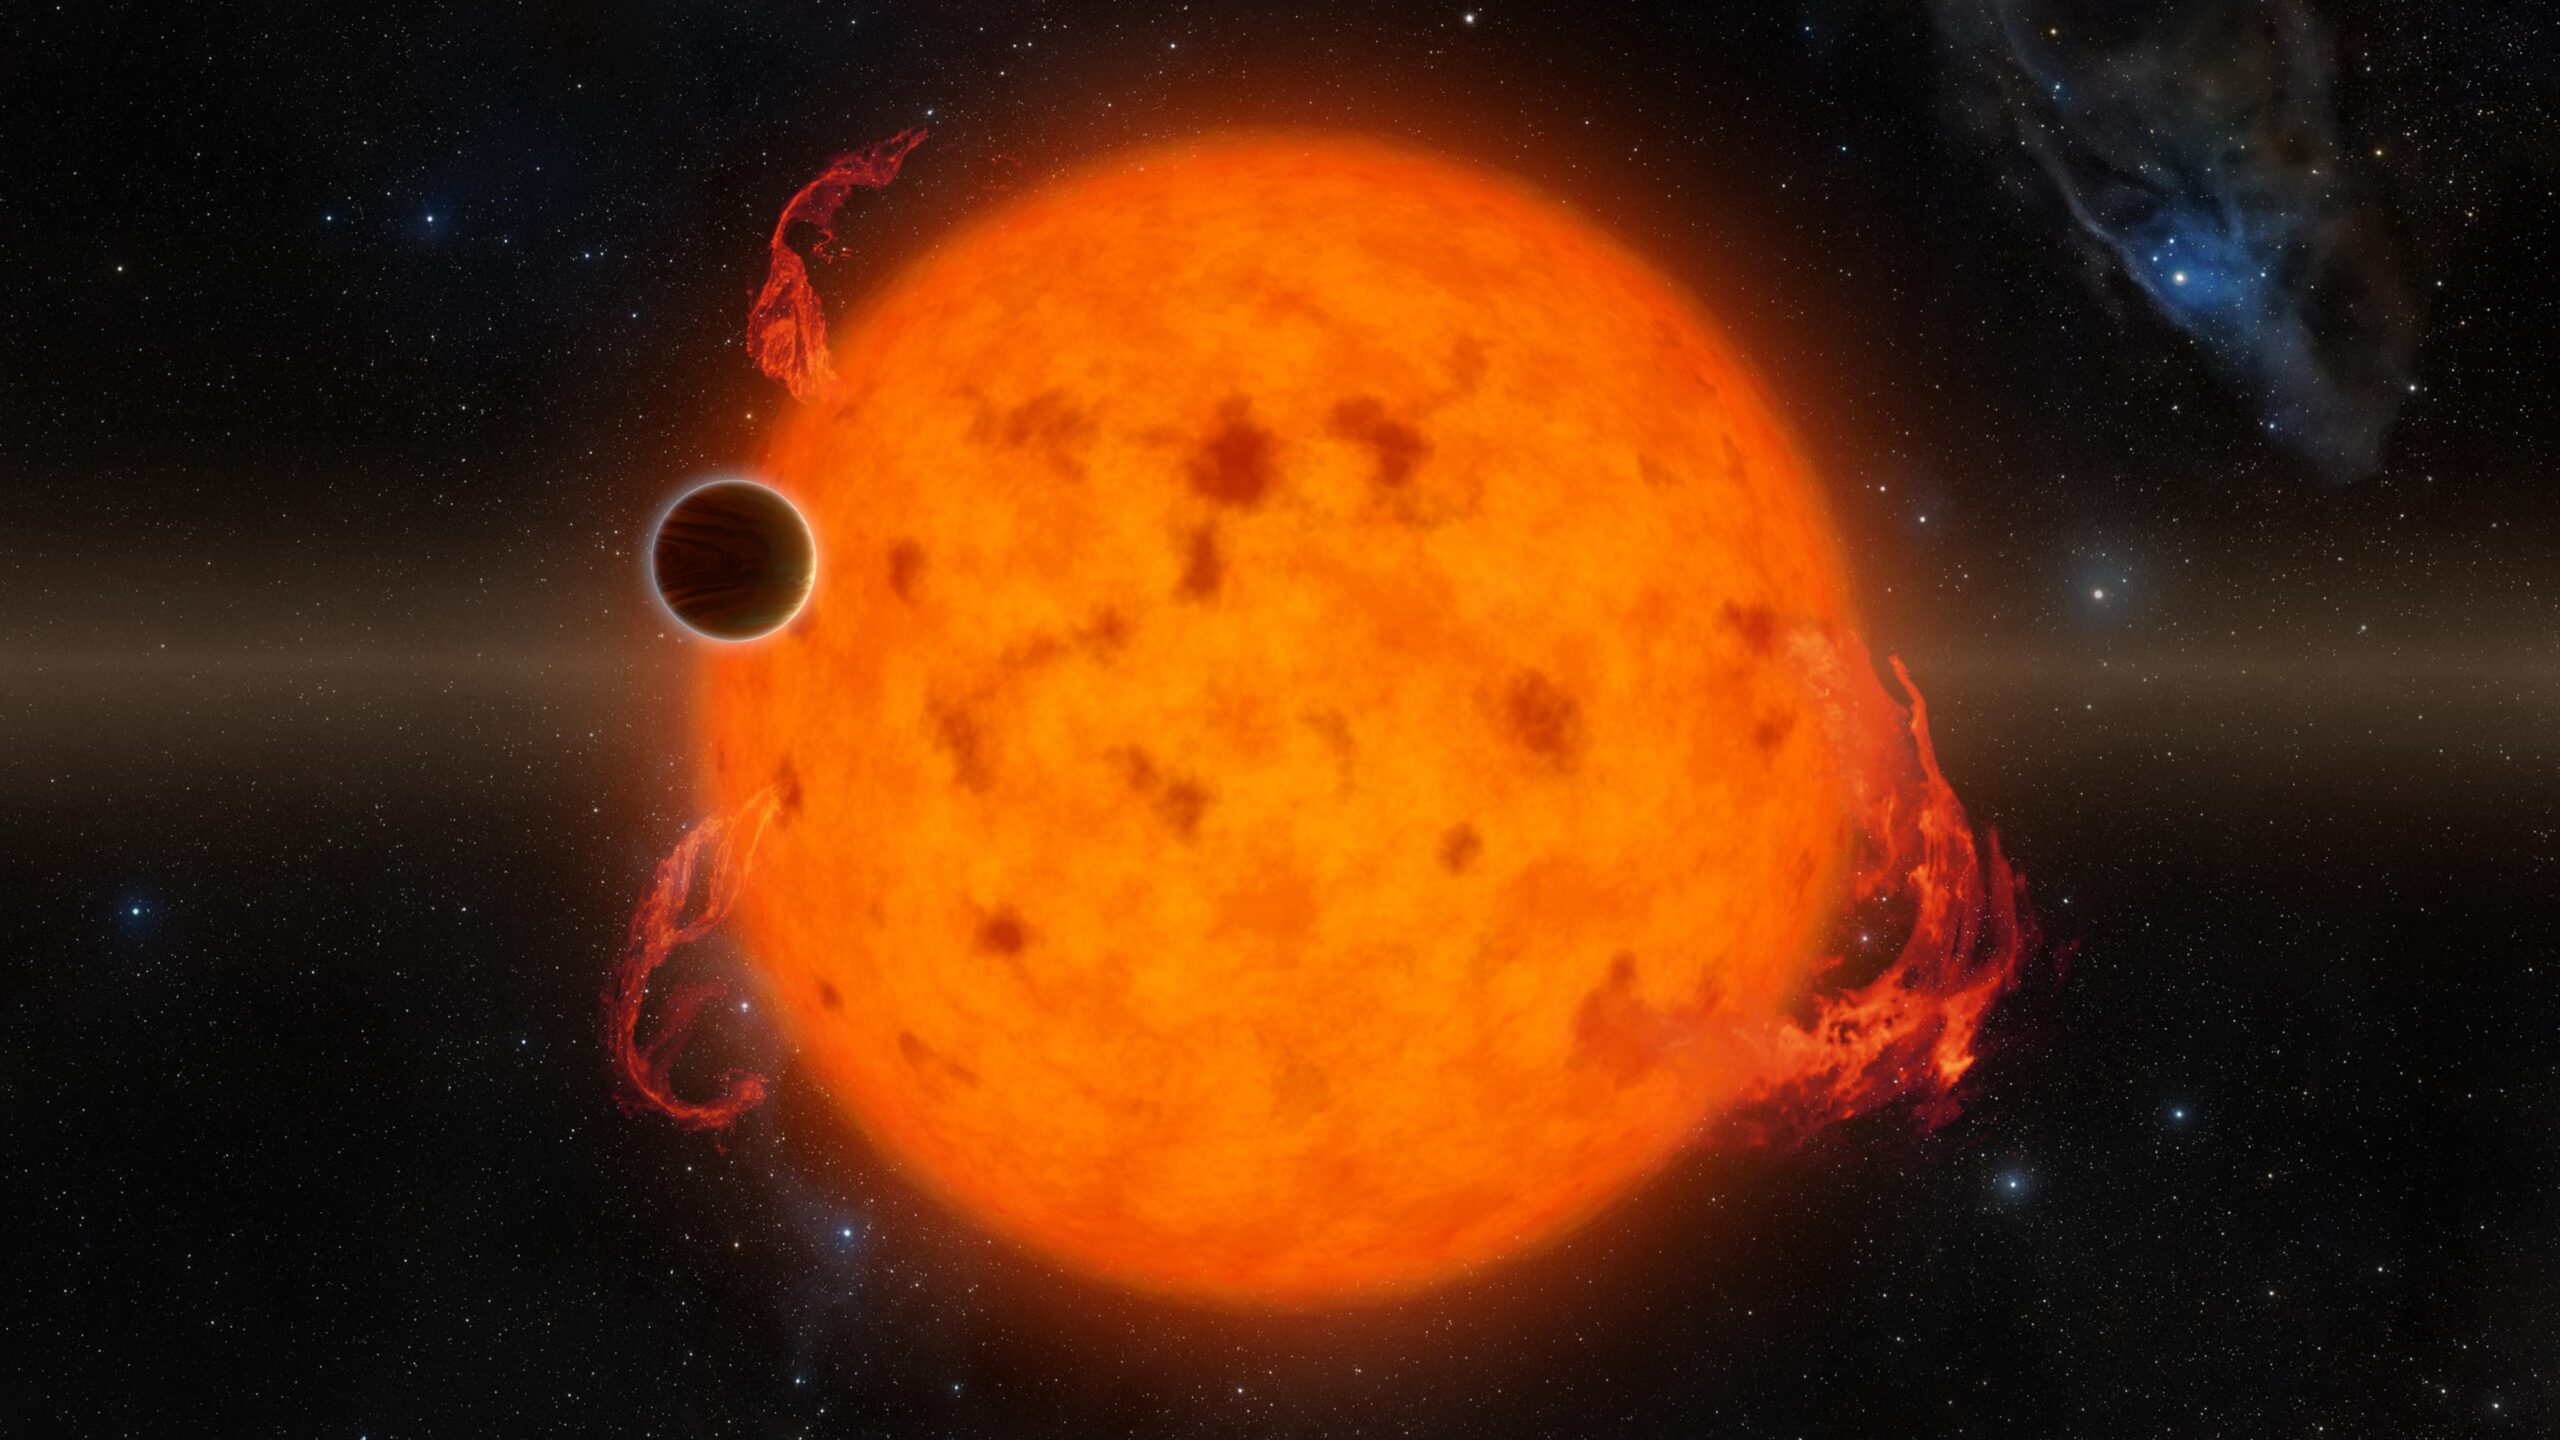
A rendering of a star with lots of spots and flares with a planet in the foreground.

An artist’s depiction of a hot Jupiter. These planets orbit extremely close to their host stars, but likely got to their locations by scattering inward from more distant orbits. [NASA/JPL-Caltech]

Though these three populations are defined by their orbital distances, they differ from each other in other ways as well. For example, hot Jupiters almost never have nearby companions; if there are any other planets circling the same star, they’re usually far-out cold Jupiters. They can also orbit in pretty much any direction, including opposite the direction of their star’s spin, and are usually on perfectly circular orbits. In contrast, warm Jupiters often have friends nearby, are much more aligned with their stars’ spins, and can have modest eccentricities.

Given these differences, it’s often thought that each of these populations arrived at its current location through different dynamical processes and that the history of the warm Jupiters is likely quite different from the history of the hot Jupiters. However, a new study led by Julia Esposito (Georgia Institute of Technology) has proposed an alternative view. Maybe these populations, though they appear different now, were all created by the same process: planet–planet scattering.

Virtual Planetary Billiards

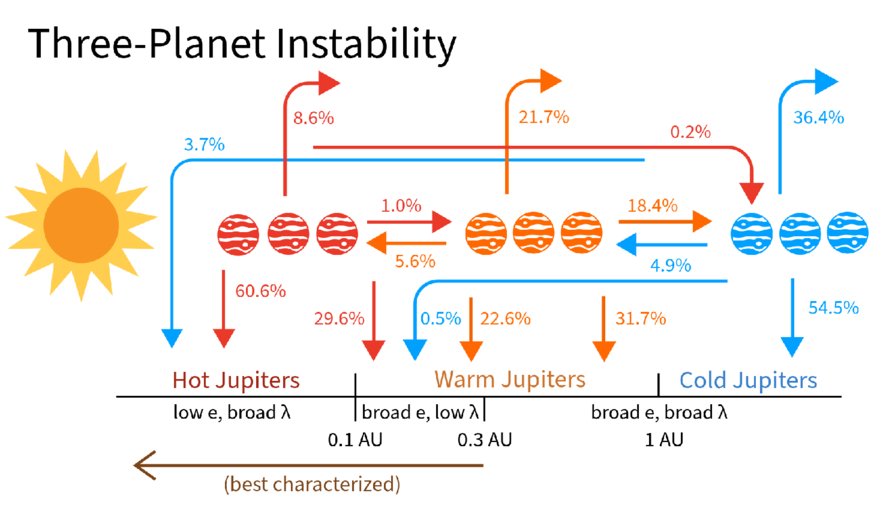
A cartoon of Jupiters at different distances from the sun with labelled arrows flowing inwards and outwards from each.

A schematic showing where different planets ended up as a function of where they scattered from during their evolution. Click to enlarge. [Esposito et al. 2026]

Esposito and collaborators set up 1,500 virtual planetary systems with three massive planets each, then simulated how the orbits evolved before probing the final configurations. In crucial contrast to previous simulation studies, the team initialized their Jupiters across a range of different distances and included the effects of tides sapping energy from orbits of planets that got too close to their host stars.

At the end of the simulation, the team surveyed the digital carnage. Almost every virtual system ended with only two planets after either ejecting one away from the star or having two planets collide. But, remarkably, the remaining two-planet systems looked tantalizingly similar to what we actually observe, with a mix of hot, warm, and cold Jupiters. Even more exciting, the end populations were highly correlated to where the violent scattering event took place.

For example, the warm Jupiters were almost all produced by “warm scattering” simulations, where the scattering took place between 0.1 and 1.0 au. The planets that survived the simulations and ended up as warm Jupiters matched all of the properties of the real warm Jupiter population: they had nearby companions, were moderately eccentric, and were mostly aligned with their stars. The hot Jupiters, meanwhile, were almost all produced by “cold scattering” events where the flybys happened far from the star and resulted in one planet hurtling inwards. These also matched all of the observed properties of real hot Jupiters.

The researchers concluded that planet–planet scattering can produce both the warm and hot Jupiter populations so long as you let the planets scatter from a variety of different distances. This exciting theoretical insight, if correct, would mean that astronomers could stop searching for different pathways to create each population. Happily, this model also provides testable predictions, and the authors lay out how the theory could be supported or disproven with additional data. Through virtual experiments like these, astronomers continue to build up an understanding of how the wide range of planetary architectures observed across the galaxy came to be.

Citation

“Unified Formation Channel of Hot and Warm Jupiters via Planet–Planet Scattering,” Julia Esposito et al 2026 ApJL 1003 L3. doi:10.3847/2041-8213/ae61b0

The post Playing Pool with Planets appeared first on AAS Nova.

  •  

Hints for Massive Galaxy Evolution from Dusty Star-Forming Galaxies

NGC 972

How do massive galaxies form and evolve? A recent study traces the stellar and dust distributions across evolutionary phases of massive galaxies to better understand how massive dusty star-forming galaxies fit into the picture.

Dusty Massive Galaxies

Massive galaxies, like the Milky Way or even larger, undergo phases of active star formation and quiescent phases of inactivity, but exactly how these galaxies evolve through these stages is not yet fully understood. Dusty star-forming galaxies, which are undergoing a period of intense star formation and shrouded in dust, might be the missing evolutionary step between star-forming and quiescent phases of massive galaxy evolution. 

Currently, the leading explanation for massive galaxy formation and evolution is inside-out growth — star formation and quenching start in the inner regions of a galaxy and progress outward. However, it’s not clear whether dusty star-forming galaxies also follow the favored inside-out pathway, or if they instead proceed outside-in, first growing their disks and then assembling a central bulge.

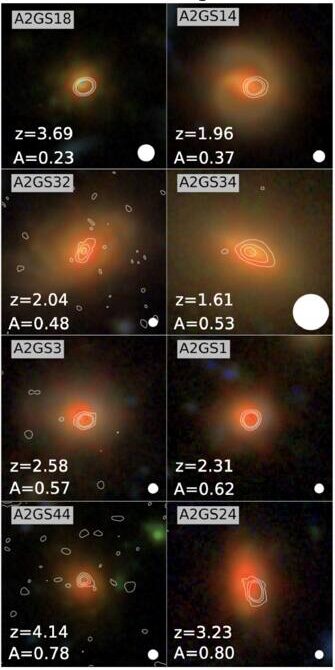
JWST NIRCam images

Example of JWST NIRCam images with ALMA contour lines overlaid for select dusty star-forming galaxies in the sample. [Modified from Bodansky et al 2026]

The spatial distribution (or morphology) of the stars and dust within dusty massive galaxies can help us trace their evolution. Thanks to high-resolution observations from JWST and the Atacama Large Millimeter/submillimeter Array (ALMA), researchers can now directly compare the morphologies of distant star-forming, quiescent, and dusty galaxies during the height of our universe’s star formation. Filling this gap will reveal how dusty star-forming galaxies may connect star-forming and quiescent galaxies in massive galaxy evolution.

Multiwavelength Morphological Comparisons

To directly compare the star and dust morphologies across massive galaxies, Sarah Bodansky (University of Massachusetts, Amherst) and collaborators selected a sample of 33 dusty star-forming galaxies from the GOODS-ALMA 2.0 survey that searched the sky for 1.1-mm dust emission as well as star-forming and quiescent comparison samples drawn from JWST observations. Combining the ALMA survey data with JWST imaging, the authors studied the rest-frame optical (stars) and rest-frame near-infrared (dust) morphologies of dusty, star-forming, and quiescent galaxies at redshifts around cosmic noon (a few billion years after the Big Bang).

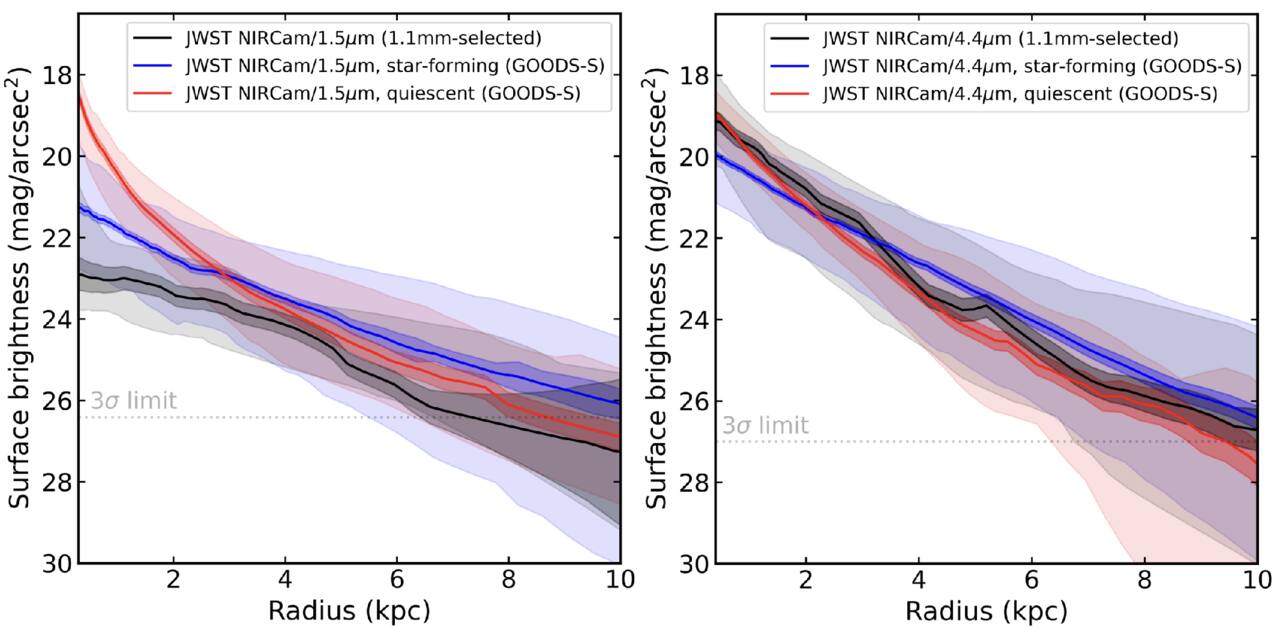
When comparing optical morphologies, the authors found that dusty star-forming galaxies and typical star-forming galaxies had similar distributions, but their near-infrared morphologies showed clear differences. Dusty galaxies tended to show more compact near-infrared emission, with dust tracing their stellar populations and more concentrated in the galaxies’ central regions. Though clearly different from star-forming galaxies, the authors noted striking similarities between the near-infrared morphologies of the dusty star-forming and quiescent galaxies, especially within their centers.

Surface brightness profiles

Average surface brightness profiles for the rest-optical (left) and rest-near-infrared (right) for the dusty (black), star-forming (blue), and quiescent (red) galaxies. In the near-infrared, the dusty star-forming galaxy profile appears very similar to the quiescent galaxy profile. [Bodansky et al 2026]

All of these properties suggest that dusty star-forming galaxies have built up stellar mass and dust in their cores, potentially forming a central bulge first and supporting an inside-out model of massive galaxy growth. This points to dusty star-forming galaxies as possible direct progenitors of early massive quiescent galaxies, hanging onto their last bit of star formation before becoming quiet as well. While this study morphologically distinguishes dusty galaxies from their star-forming and quiescent counterparts, future spectroscopic studies comparing the kinematics of these populations and investigations of molecular gas distributions are necessary to better pin down the evolutionary connection between star-forming, dusty, and quiescent massive galaxies.

Citation

“JWST+ALMA Reveal the Buildup of Stellar Mass in the Cores of Dusty Star-forming Galaxies at Cosmic Noon,” Sarah Bodansky et al 2026 ApJ 1001 235. doi:10.3847/1538-4357/ae4f64

The post Hints for Massive Galaxy Evolution from Dusty Star-Forming Galaxies appeared first on AAS Nova.

  •  

Simulations of Turbulent Mixing Close One Gap but Open Another

illustration of a white dwarf surrounded by rocky debris

Nature sometimes behaves in ways that are difficult to recreate in simulations. New research tackles the computational challenge of turbulent mixing and rules out a commonly assumed source of data–model disagreement.

Mixing Up Stellar Interiors

What do Earth’s oceans, red giant stars, and white dwarfs have in common? These are all sites of thermohaline mixing, a form of turbulent mixing that takes place when there is a vertical gradient in both temperature and chemical composition. For example, in Earth’s oceans, water near the surface is warmer and saltier than water in the depths below, setting up an unstable situation prone to mixing.

thermohaline mixing simulation results

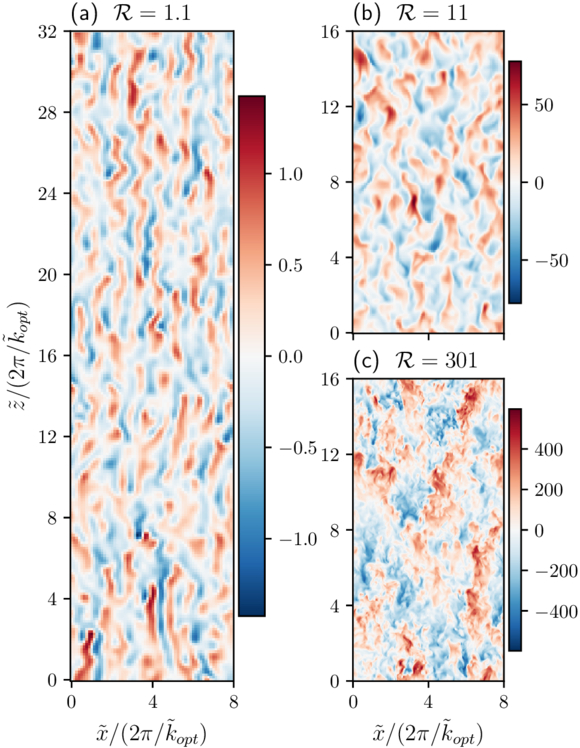
Examples of simulated thermohaline convection. These snapshots show the vertical velocity across a slice through the simulation volume. Click to enlarge. [Fraser 2026]

Thermohaline mixing has been explored in simulations to explain the evolution of red giants’ surface abundances, as well as how quickly rocky debris that accretes onto a white dwarf is absorbed into the star. However, effectively modeling this process in the interiors of stars has proven difficult.

One of the most important parameters for modeling mixing is the Prandtl number, Pr, which is the ratio of viscosity to thermal diffusivity (in other words, a way of describing whether momentum or heat diffuses more quickly within a fluid). For stellar interiors, Pr is around 10−6, but computational limitations have prevented modelers from setting this value lower than around 10−2. When tensions between models and reality arise, this gap between simulated and realistic Pr values is often assumed to be the source of the mismatch.

Bridging the Prandtl Number Gap

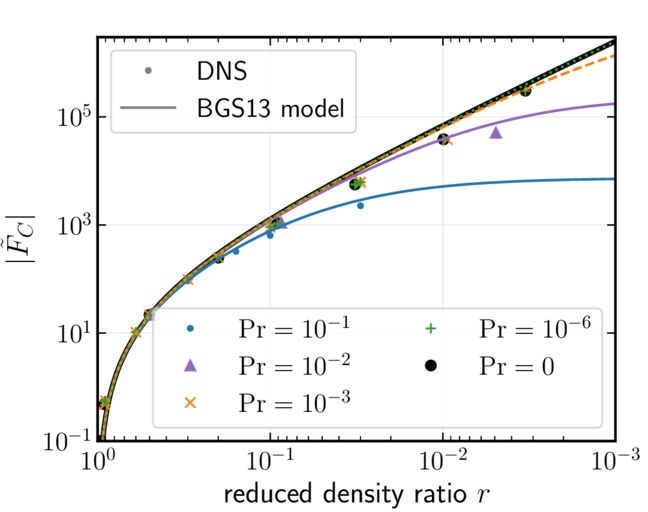
In a recent research article, Adrian Fraser (University of Colorado Boulder) aimed to test this assumption. Fraser carried out 3D simulations of thermohaline mixing, using a semi-implicit modeling technique that lowered the computational cost and allowed the simulations to probe Pr values of 10−1, 10−2, 10−3, 10−6, and 0.

comparison of simulations from this work and the benchmark model of thermohaline convection

Turbulent compositional flux as a function of reduced density ratio for the simulations from this work (DNS) and the benchmark model of thermohaline convection (BGS13). Click to enlarge. [Adapted from Fraser 2026]

By comparing these results against a benchmark model of thermohaline mixing, this exploration showed that adopting a realistic value of Pr doesn’t dramatically change the dynamics of the system — meaning that data–model incompatibilities can’t be swept under a Prandtl number–shaped rug and must instead be resolved by including additional physics.

Recreating Reality

Where does this leave modelers attempting to recreate the reality of stellar interiors? First, a silver lining of this investigation: Fraser found that setting Pr = 0 delivered nearly identical results to Pr = 10−6. This suggests that valid results can be attained in a much less computationally intensive way, since setting Pr = 0 lowers the complexity of the simulation. While simulations with Pr = 0 may not be appropriate for all scenarios, including systems with strong magnetic fields, it may provide a way forward in certain situations.

For modeling of red giants and white dwarfs, Fraser suggested that incorporating magnetic fields, stellar rotation, or additional sources of mixing may resolve the current discrepancies. In fact, some modeling work has shown that magnetic fields could entirely close the gap between observations and models for red giant surface abundances — suggesting that bringing models and observations into agreement may be within reach.

Citation

“Bridging the Prandtl Number Gap: 3D Simulations of Thermohaline Convection in Astrophysical Regimes,” Adrian E. Fraser 2026 ApJL 1001 L22. doi:10.3847/2041-8213/ae5796

The post Simulations of Turbulent Mixing Close One Gap but Open Another appeared first on AAS Nova.

  •  

Feed the Fire, Fade the Metals

galaxy cluster MACS J1149.5+2223

Editor’s Note: Astrobites is a graduate-student-run organization that digests astrophysical literature for undergraduate students. As part of the partnership between the AAS and astrobites, we occasionally repost astrobites content here at AAS Nova. We hope you enjoy this post from astrobites; the original can be viewed at astrobites.org.

Title: Metal-Poor Star-Forming Clumps in Cosmic Noon Galaxies: Evidence for Gas Inflow and Chemical Dilution Using JWST NIRISS
Authors: Vicente Estrada-Carpenter et al.
First Author’s Institution: Arizona State University
Status: Published in ApJ

If you want to reconstruct a galaxy’s life story, one of the best “fossil records” is its metallicity. In astronomy this refers to the abundance of elements heavier than helium, which are made in stars and returned to a galaxy’s gas through winds and supernovae. Over time, more star formation usually means more metals mixed into the gas.

Now zoom to Cosmic Noon (roughly when the universe was most actively forming stars). Many galaxies in this epoch look “clumpy”; their star formation is concentrated in several bright knots scattered across the disk. The big question is where those clumps come from. Do they form from the galaxy’s own gas via internal disk instabilities, or do they light up when fresh, metal-poor gas flows in and both fuels star formation and dilutes the local metallicity?

The authors try to answer that question with JWST by measuring the metallicity of each clump relative to its immediate surroundings, rather than comparing clumps to a single galaxy-wide number (which can be misleading if the galaxy has a metallicity gradient).

They use JWST/Near Infrared Imager and Slitless Spectrograph (NIRISS) slitless grism spectroscopy from the CAnadian NIRISS Unbiased Cluster Survey (CANUCS) to study 20 lensed galaxies at redshift 0.6 < z < 1.35. (Lensing effectively acts like a zoom lens, helping to resolve smaller structures.) They focus on emission lines that trace star-forming gas, especially Hα (a star formation tracer) and sulfur lines [SII] and [SIII] (needed for their metallicity method).

Slitless spectra come with a headache: because there is no slit, different parts of a galaxy can overlap in the dispersed image. To make reliable emission-line maps from slitless data, the authors use a forward-modeling code called Sleuth, which allows the continuum to vary across the galaxy.

The authors identify clumps using the Hα map together with rest-frame ultraviolet imaging because these tracers are sensitive to star formation on different timescales: Hα highlights gas ionized by the youngest massive stars, while ultraviolet light traces young stellar light over longer periods. As a result a clump can be bright in one and not the other, especially if dust is involved.

To estimate gas-phase metallicity, they use the “strong-line” method, which infers metallicity from ratios of bright emission lines calibrated using models and empirical samples. Their main diagnostic is S23 = ([SIII] + [SII]) / Hα. Because some line ratios also depend on the ionization state (how strongly the gas is being ionized by young stars), they also use the sulfur ratio S32 = [SIII]/[SII] as a check and iterate to a self-consistent solution.

So, Are Clumps Really Chemically Different from Their Surroundings?

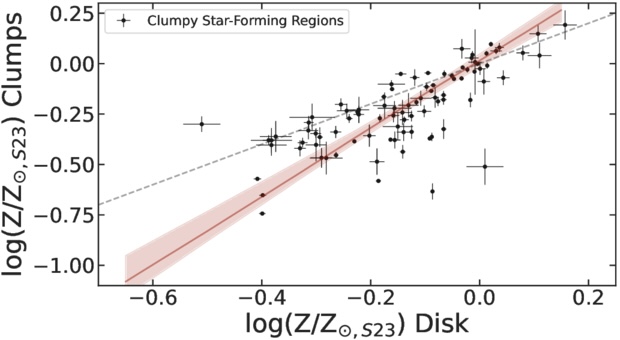
For each clump, the authors measure the metallicity inside the clump and compare it to an annulus just outside the clump (masking neighboring clumps to avoid mixing). When they plot “clump metallicity” versus “local disk metallicity,” most points fall below the 1-to-1 line, meaning the clumps are more metal poor than their surroundings (Figure 1). The mean offset is about 0.1 dex, which corresponds to roughly 20% dilution in the clump gas.
plot of gas-phase metallicity in star-forming clumps compared against metallicity of nearby disk regions

Figure 1: Each point compares a star-forming clump’s gas-phase metallicity to the metallicity of the nearby disk region immediately surrounding it. If clumps and disks had the same metallicity, they would lie on the dashed 1-to-1 line. Instead, most clumps sit below it, showing a typical ∼0.1 dex metallicity deficit, consistent with local chemical dilution. (The solid red line shows a best-fit linear trend to the clump measurement.) [Adapted from Estrada-Carpenter et al. 2025]

An extra wrinkle is that the galaxy medians hint at two populations: some galaxies have clumps with small offsets (near the 1-to-1 line), while others show larger offsets. The authors suggest this could mean two formation pathways, one dominated by internal gas reservoirs (smaller offsets) and another where inflow of metal-poor gas plays a bigger role (larger offsets). They are careful, though, as the sample is still small.

If inflow is really the driver, you should expect a link: the more strongly a clump is forming stars relative to its surroundings, the more diluted its metallicity should be. That is exactly what the authors find. The clumps that are most boosted in star formation are also the most metal diluted.

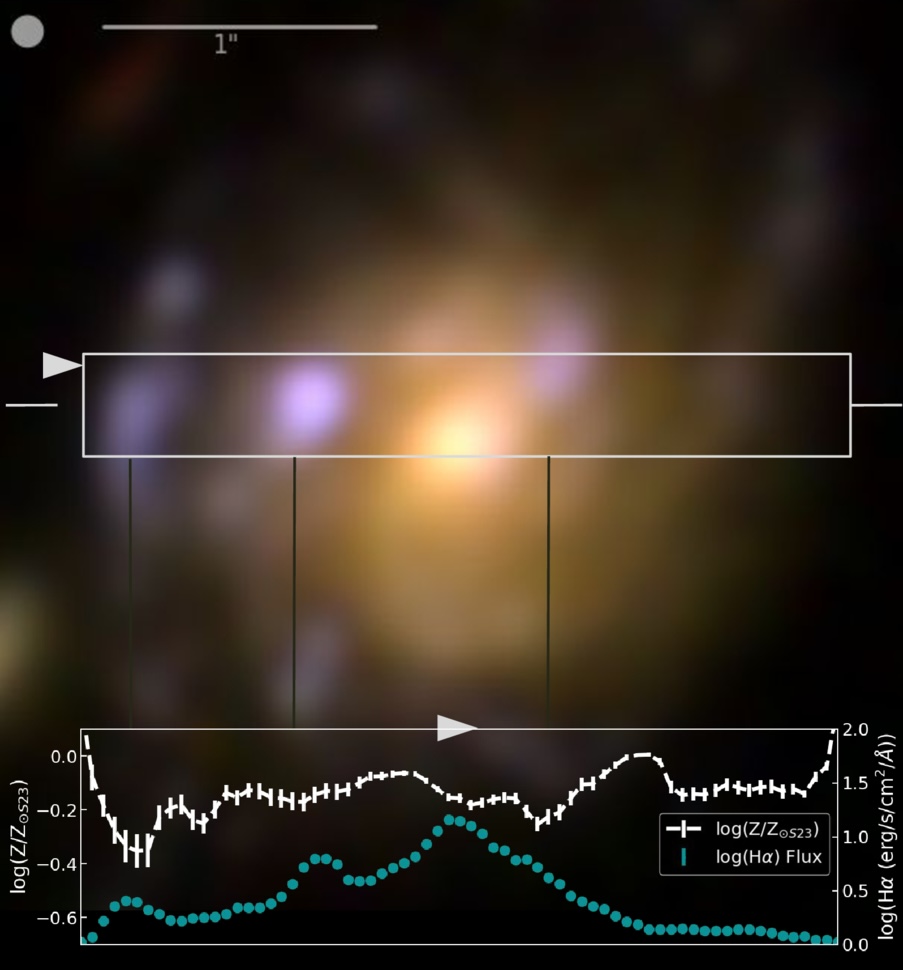
The article also emphasizes that clumps are not chemically uniform blobs. In at least one detailed example, the peaks in Hα (highest star formation) coincide with local minima in metallicity along a cut through the galaxy (Figure 2), suggesting internal star formation rate and metallicity gradients that reinforce the same story, intense star formation goes hand in hand with lower metallicity in the clump regions.
galaxy image showing spatial variation of H alpha and metallicity

Figure 2: Example galaxy from this study illustrating the clump-scale link between star formation and metallicity. The color image shows the galaxy with a rectangular strip marking the region used for a 1D cut. In the bottom panel, the turquoise line shows the Hα flux (a tracer of recent star formation), while the white line shows the metallicity along the same cut. Peaks in Hα flux line up with local dips in metallicity, showing that the brightest star-forming clumps are also the most chemically diluted compared to nearby regions. [Adapted from Estrada-Carpenter et al. 2025]

Are These Clumps Really “In Situ,” or Could They Be Small Satellites?

A reasonable alternative is that some clumps are actually small companion galaxies projected onto the disk. These could also look metal poor, because low-mass galaxies tend to be low metallicity. The authors look for evidence using face-on systems and find that more massive clumps tend to sit closer to galaxy centers, which is consistent with in-situ clumps that form in the disk and migrate inward, though it does not rule out satellites. They argue that kinematics from JWST/NIRSpec IFU will be needed for a definitive separation.

Why This Matters

Gas inflow, star formation, and feedback, together known as the baryon cycle, are key drivers of how galaxies grow. What this article adds is a spatially resolved view that compares each clump to its local environment, showing that regions of elevated star formation also tend to be locally metal poor. That pairing is hard to explain as a simple metallicity gradient or a galaxy-wide averaging effect, and it is exactly what you would expect if at least some clumps are being fueled by relatively metal-poor inflows. In short, these clumps may be snapshots of galaxies refueling in real time.

Original astrobite edited by Ryan White.

About the author, Niloofar Sharei:

I’m an astronomy PhD candidate at UC Riverside studying how galaxies grow through star-forming clumps. I track how these clumps emerge, evolve, and sometimes survive long enough to reshape their galaxies. When I’m not thinking about cosmic blobs, I’m reading, hiking, or listening to Bach.

The post Feed the Fire, Fade the Metals appeared first on AAS Nova.

  •  

Featured Image: Galaxies Caught in Transition

images of six galaxies

How does environment shape a galaxy’s growth and evolution? This is the question explored in a recent study led by Gissel Montaguth (University of São Paulo). Montaguth’s team examined nearly 4,000 galaxies in low-mass, high-mass, and compact galaxy groups, as well as galaxies adrift in the field without belonging to a group. The sampled galaxies were classified as early-type, late-type, transition (generally disk galaxies with quenched star formation), or other (generally elliptical but with lingering star formation). The image above shows six transition galaxies from the sample, three of which show signs of past disturbances (top row). The team found that early-type and “other” galaxies were resilient to changes in environment, but late-type and transition galaxies could be affected by life in close groups. Late-type galaxies in compact groups tended to be somewhat smaller than their loosely grouped or field galaxy counterparts, while transition galaxies showed a significantly steeper stellar mass–size relation in group environments and smaller sizes in groups than in the field. This suggests that transition galaxies are strongly influenced by interactions, mergers, and processes like disk truncation. To learn more about the impact of environment on galaxy properties, be sure to check out the full article linked below.

Citation

“Galaxies Caught in Transition: The Role of Group Environment in Shaping the Mass–Size Relation in the Local Universe,” Gissel P. Montaguth et al 2026 ApJ 999 160. doi:10.3847/1538-4357/ae42ca

The post Featured Image: Galaxies Caught in Transition appeared first on AAS Nova.

  •  

In or Out? Using Balmer Emission to Distinguish Inflows from Outflows

M33

Galaxies pull in and pump out gas as they form and evolve, but distinguishing between the two directions is tricky. A recent study used emission lines and dust absorption to try to pin it down.

Inflow or Outflow?

Throughout their lives, galaxies churn gas into stars, stars fuse new metals, supernovae blow enriched material back out, and the cycle repeats. To maintain this process and sustain star formation, a galaxy must fuel up by accreting gas from its surroundings. However, catching galactic gas accretion has proven difficult — both emission from gas falling into the galaxy (inflows) and gas blown out by supernovae (outflows) can appear blueshifted or redshifted along an observer’s sight line, depending on if the flowing material is in front of or behind the galaxy.

While direct evidence of inflows has been identified in the Milky Way, only a few direct detections of inflowing gas in other galaxies exist due to the degeneracy of inflow and outflow emission-line features. Relying on additional absorption measurements, some studies have teased out inflows in other galaxies, but these star formation fuel pumps remain overwhelmingly evasive. The angle at which we observe a galaxy also limits our ability to detect both inflows and outflows, with face-on galaxies best oriented to detect these shifted spectral features. How then do we uncover this critical component of a galaxy’s evolution?

Breaking Through with the Balmer Decrement

Balmer decrement diagram

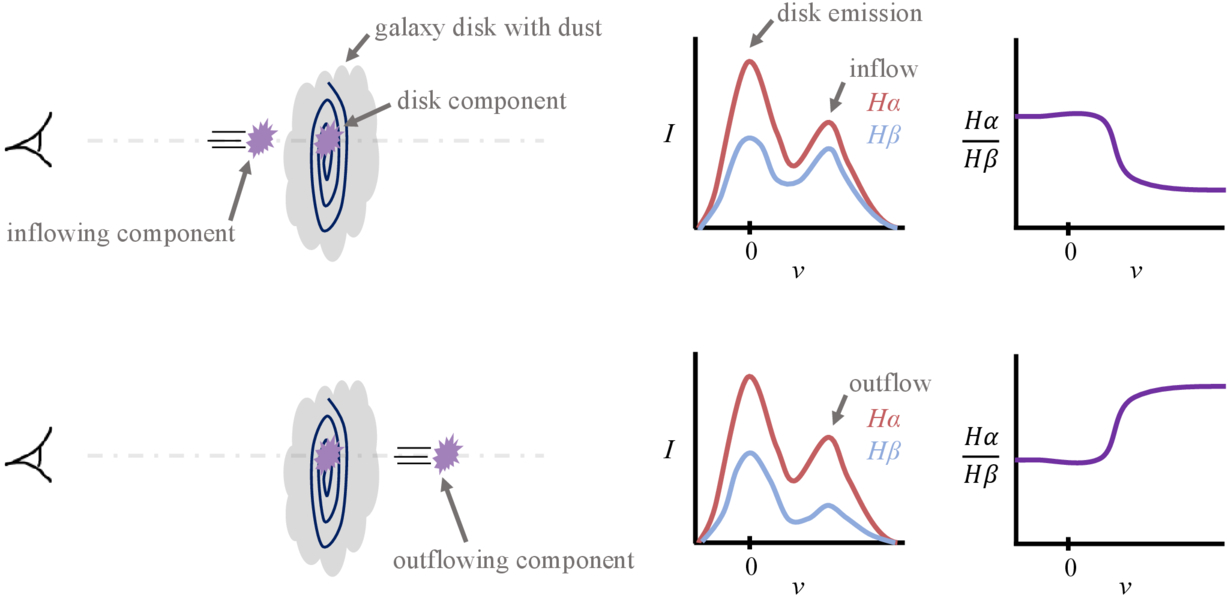
A diagram illustrating the degeneracy in emission spectra of galaxies, with the top panel showing an inflowing component and the bottom panel showing an outflowing component. While the Hα emission is similar, the Hβ emission is more affected by extinction due to dust in the galaxy’s disk, making it possible to identify inflow versus outflow based on the Balmer decrement. Click to enlarge. [Sitaram et al 2026]

To try to break through the confusion between inflows and outflows, Meghna Sitaram (Columbia University) and collaborators explored how the strengths of hydrogen emission lines vary depending on the location of the emitting gas. Referred to as the Balmer decrement, the ratio between the Hα (redder) and Hꞵ (bluer) emission lines is sensitive to dust between the emitting gas and the observer. Because dust preferentially absorbs bluer photons, an inflow or outflow behind a galaxy is expected to have a higher Hα/Hꞵ ratio due to the intervening dust in the galaxy’s disk absorbing some of the Hꞵ emission.

Testing this idea, the authors performed a hydrodynamic simulation of an isolated, face-on Milky Way–like galaxy and tracked inflows and outflows over a billion years. From the simulation, they extracted mock spectral observations to measure the ionized gas motions and Hα and Hꞵ emission lines along different sight lines throughout the galaxy. Separating gas components into three categories — inflow, outflow, and in the disk — the authors found that dust extinction does cause noticeable differences in the Balmer decrement depending on a component’s location with respect to the disk.

histograms

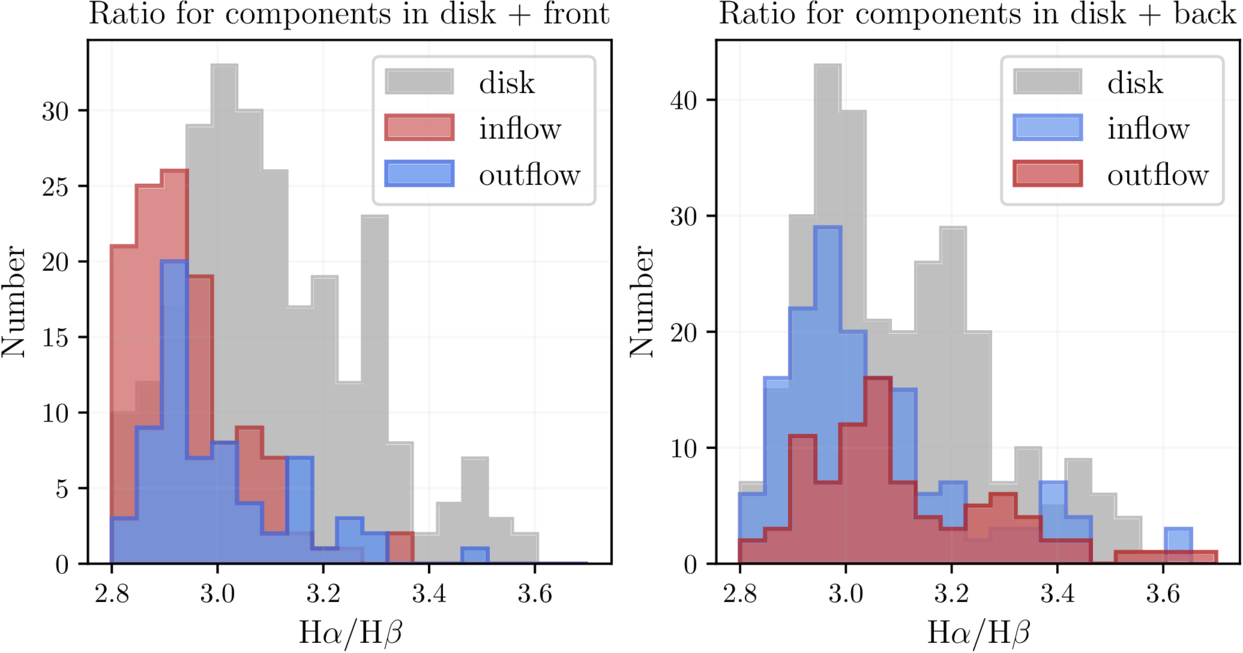
The distribution of Balmer ratios between different components in the interstellar medium and in front of the galaxy (left) and behind the galaxy (right). Material in front of the galaxy shows lower Hα/Hβ ratios. Click to enlarge. [Sitaram et al 2026]

Front Inflow Finds

What does this mean for identifying the inflows that provide galaxies with star-forming fuel? The authors reported that components in front of the galaxy — redshifted inflows and blueshifted outflows — tend to exhibit lower Hα/Hꞵ ratios compared to components behind the disk, aligning with the expectation that dust in the disk absorbs Hꞵ. In particular, these front inflows appear to be the most readily distinguished from gas in and behind the galaxy’s disk.

However, things get more complicated for gas behind the galaxy. Because the dust in the simulation is distributed nonuniformly in small clumps throughout the galaxy, it is difficult to distinguish between disk gas and gas behind the galaxy. While future simulations with improved dust modeling are necessary to resolve this issue, this study offers a useful method to distinguish inflow and outflow in dusty face-on galaxies.

Citation

“Identifying Signatures of Inflow onto Face-On Galaxies Using Balmer Decrement,” Meghna Sitaram et al 2026 ApJ 1001 87. doi:10.3847/1538-4357/ae5222

The post In or Out? Using Balmer Emission to Distinguish Inflows from Outflows appeared first on AAS Nova.

  •  

Water Vapor Around a Sizzling Supergiant: High-Resolution Spectroscopy of B[e] Supergiant LHA 115-S 18

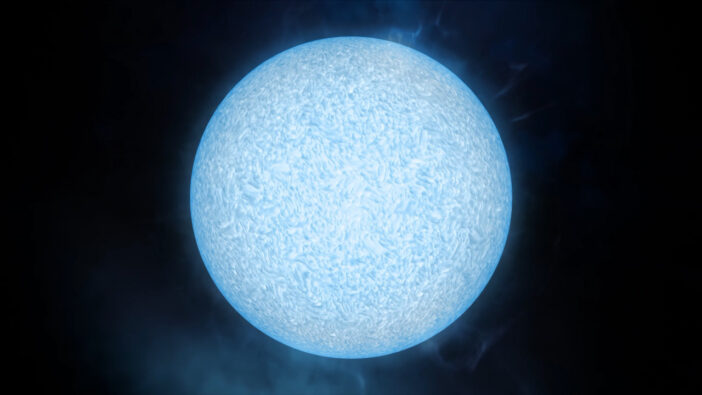
blue supergiant

Prior to exploding, massive stars advance through action-packed evolutionary stages that are exciting but often difficult to fully decipher. A recent study focuses on a unique late-stage star to better understand its properties and evolution.

To B[e] a Supergiant

HD 62623 disk image

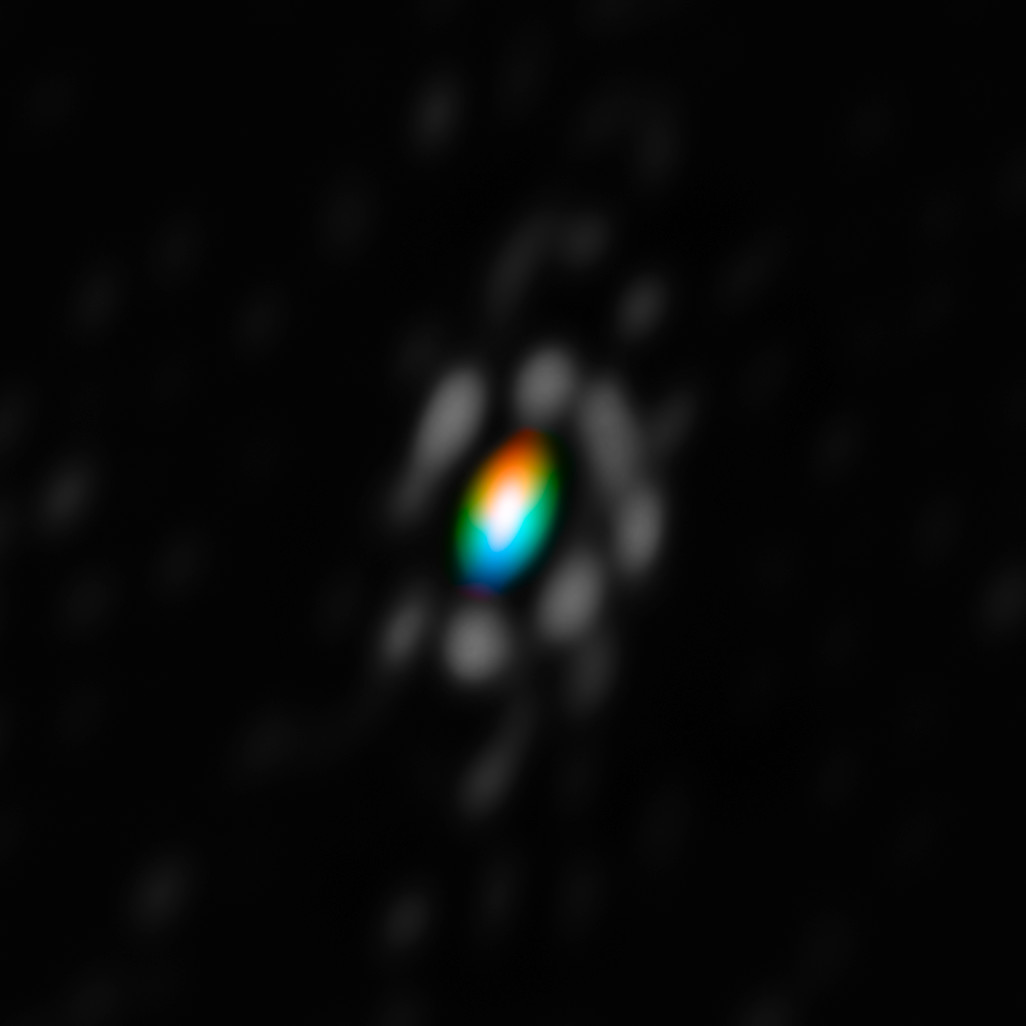
Very Large Telescope Interferometer image of the circumstellar disk around the B[e] supergiant star HD 62623. The colors indicate the rotation of the disk with blue coming toward us and red going away. [ESO/F. Millour; CC BY 4.0]

After depleting their cores of hydrogen, massive stars journey off the main sequence through a series of evolutionary phases before ending in dramatic supernova explosions. A massive star’s post-main-sequence evolution is intense, often sloughing off layers of material that can settle into a circumstellar disk. The B[e] supergiant phase describes a blue supergiant star surrounded by a cool, dense circumstellar disk where oxygen is more abundant than carbon. These environments often lock up carbon atoms in carbon monoxide molecules, leaving excess oxygen available to form other molecules including SiO, TiO, and water vapor. These molecules can survive under different physical conditions, making them key tracers of the environments around B[e] supergiants.

One particularly interesting B[e] supergiant, LHA 115-S 18, has been the subject of numerous studies but remains poorly constrained. The star exhibits significant variability both in brightness and emission features on timescales of days to years, and previous works have suggested that the star may have an as-yet unconfirmed binary companion. Molecular line emission from CO and TiO have been identified in LHA 115-S 18, indicating a circumstellar disk, but to date, water vapor emission has not been identified in any B[e] supergiant. Identifying more complex oxygen-bearing molecules like water will further reveal the physical properties and possible binary companion of LHA 115-S 18.

Identifying Emission in LHA 115-S 18

To characterize the emission around LHA 115-S 18, María Laura Arias (Institute of Astrophysics La Plata; National University of La Plata) and collaborators obtained high-resolution near-infrared spectroscopy of the star using the Immersion Grating Infrared Spectrometer on the Gemini South telescope. From the high-resolution spectra, the team identified several atomic emission lines indicative of the star’s gaseous envelope, revealing the structure of material around the star: an inner hot disk of ionized material and an outer cool disk of neutral material. Looking at molecular emission from carbon monoxide — a tracer of both gas motions and stellar age — the authors confirmed the presence of a rotating ring of gas around LHA 115-S 18 and determined that the star is an evolved, post–red supergiant object.

LHA 115-S 18 spectrum

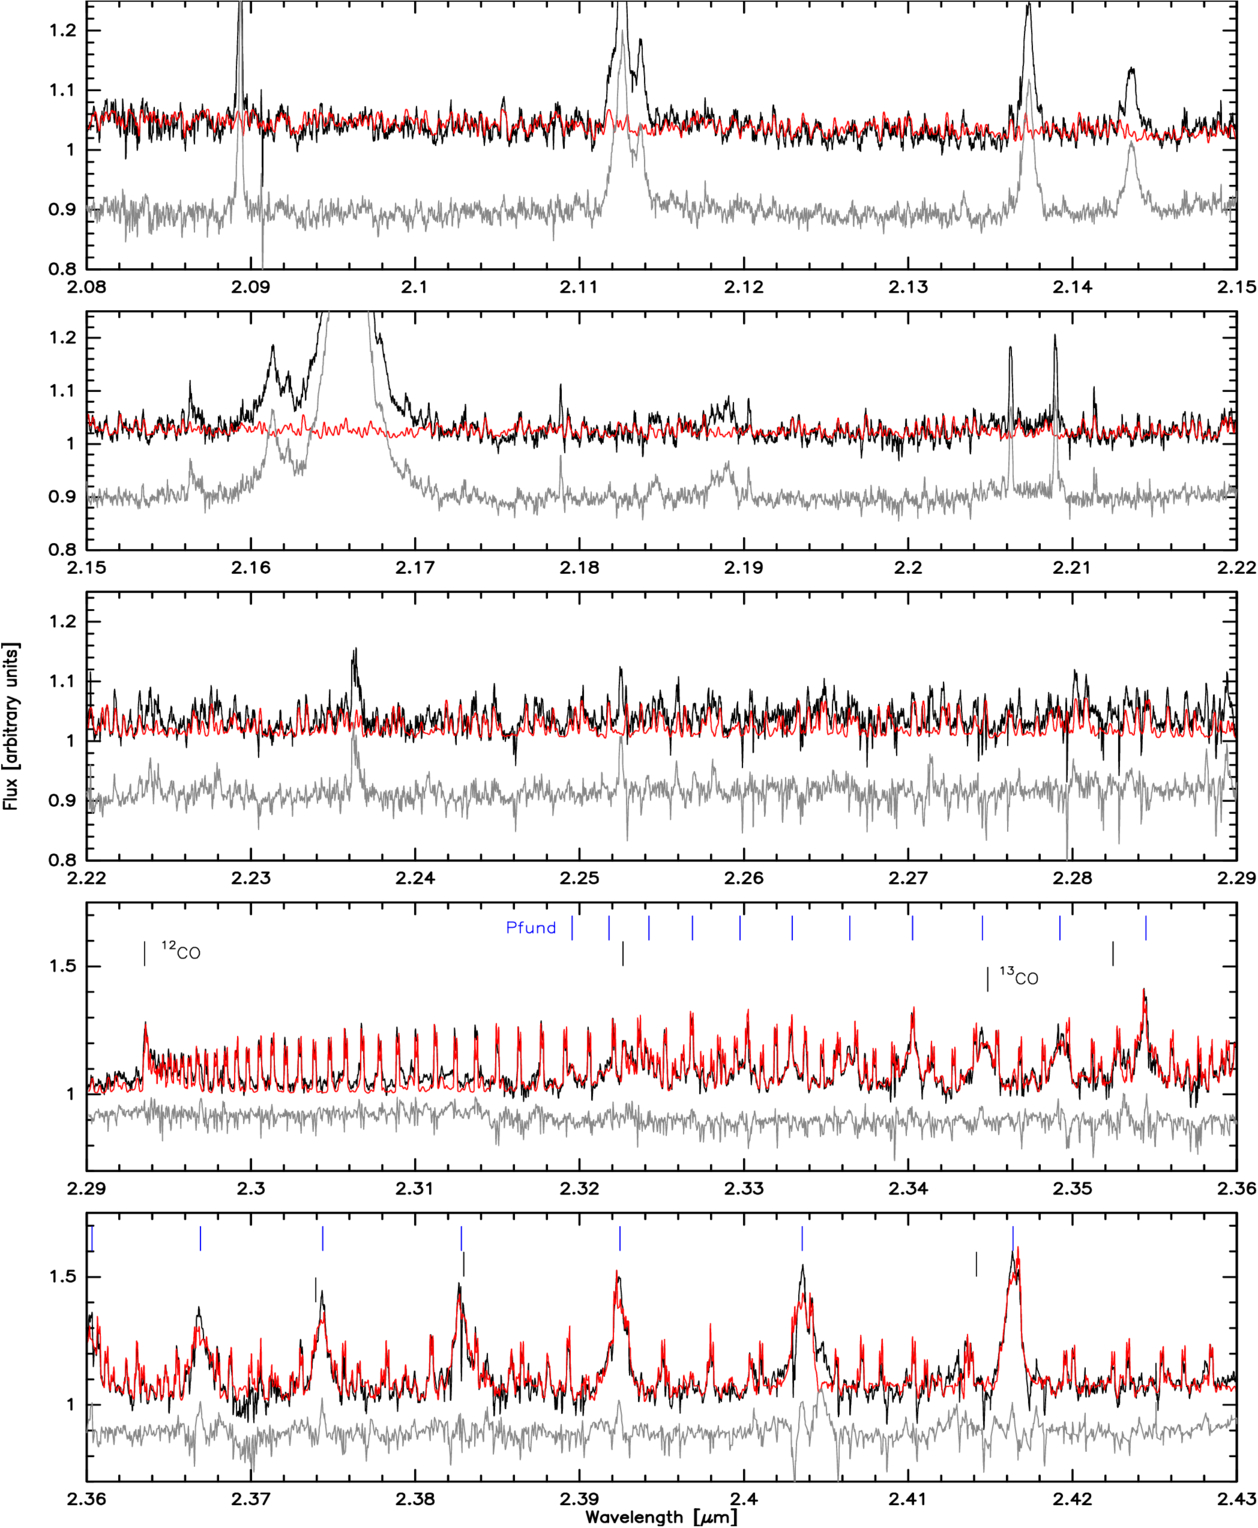
Spectrum of LHA 115-S 18 (black) with the model spectrum composed of water vapor (red, top three panels) and water vapor, CO, and hydrogen emission (red, bottom two panels) overplotted as well as residuals (gray). [Arias et al 2026]

Through computing a synthetic spectrum to compare to the observed spectrum, the authors identified many water vapor emission lines in the circumstellar environment around LHA 115-S 18. While water vapor has been detected in other evolved late-type stars, this is the first detection of water vapor from a B[e] supergiant star. For water vapor to survive the star’s intense radiation, it must exist in a dense, cool, heavily shielded disk around the B[e] supergiant.

Sustaining a cool disk around such a hot star indicates that the circumstellar environment around LHA 115-S 18 is complex and likely shaped by binary interaction. With emission features characteristic of both cool and hot evolved stars, this particular B[e] supergiant presents itself as a unique object holding critical insights into the late-stage evolution of massive stars. Further multiwavelength observations of LHA 115-S 18 will constrain its potential binarity and reveal a possible evolutionary link between B[e] supergiants and other late-stage evolutionary phases of massive stars.

Citation

“High-resolution Near-Infrared Spectroscopy of the B[e] Supergiant LHA 115-S 18: Discovery of Hot Water Vapor Emission,” María Laura Arias et al 2026 ApJL 1000 L49. doi:10.3847/2041-8213/ae524a

The post Water Vapor Around a Sizzling Supergiant: High-Resolution Spectroscopy of B[e] Supergiant LHA 115-S 18 appeared first on AAS Nova.

  •  

Observing the End of Star Formation in Galaxies

galaxy transitioning from star forming to quiescent

Editor’s Note: Astrobites is a graduate-student-run organization that digests astrophysical literature for undergraduate students. As part of the partnership between the AAS and astrobites, we occasionally repost astrobites content here at AAS Nova. We hope you enjoy this post from astrobites; the original can be viewed at astrobites.org.

Title: Searching Within Galaxies for the Earliest Signs of Quenching With Spatially Resolved Star Formation Histories in UVCANDELS
Authors: Charlotte Olsen et al.
First Author’s Institution: New York City College of Technology
Status: Published in ApJ

How and Why Do Galaxies Stop Forming Stars?

Galaxies serve as important laboratories for many subfields of astrophysics. As such, astrophysicists are interested in the full galactic life cycle, from how galaxies are born to the end of their formation. Whereas young galaxies in the distant universe are actively forming stars, many nearby galaxies are much quieter, with little or no ongoing star formation. Astronomers like to describe these galaxies as “red and dead” because their stars are older and therefore appear redder in color. The process by which galaxies shut down their star formation is known as quenching, and it causes galaxies to become quiescent. Understanding the origin of quiescent galaxies is a fundamental question in galaxy evolution. Studying this process is challenging, however, because star formation is intertwined with many other factors that shape galaxies, including their environments and supermassive black holes.

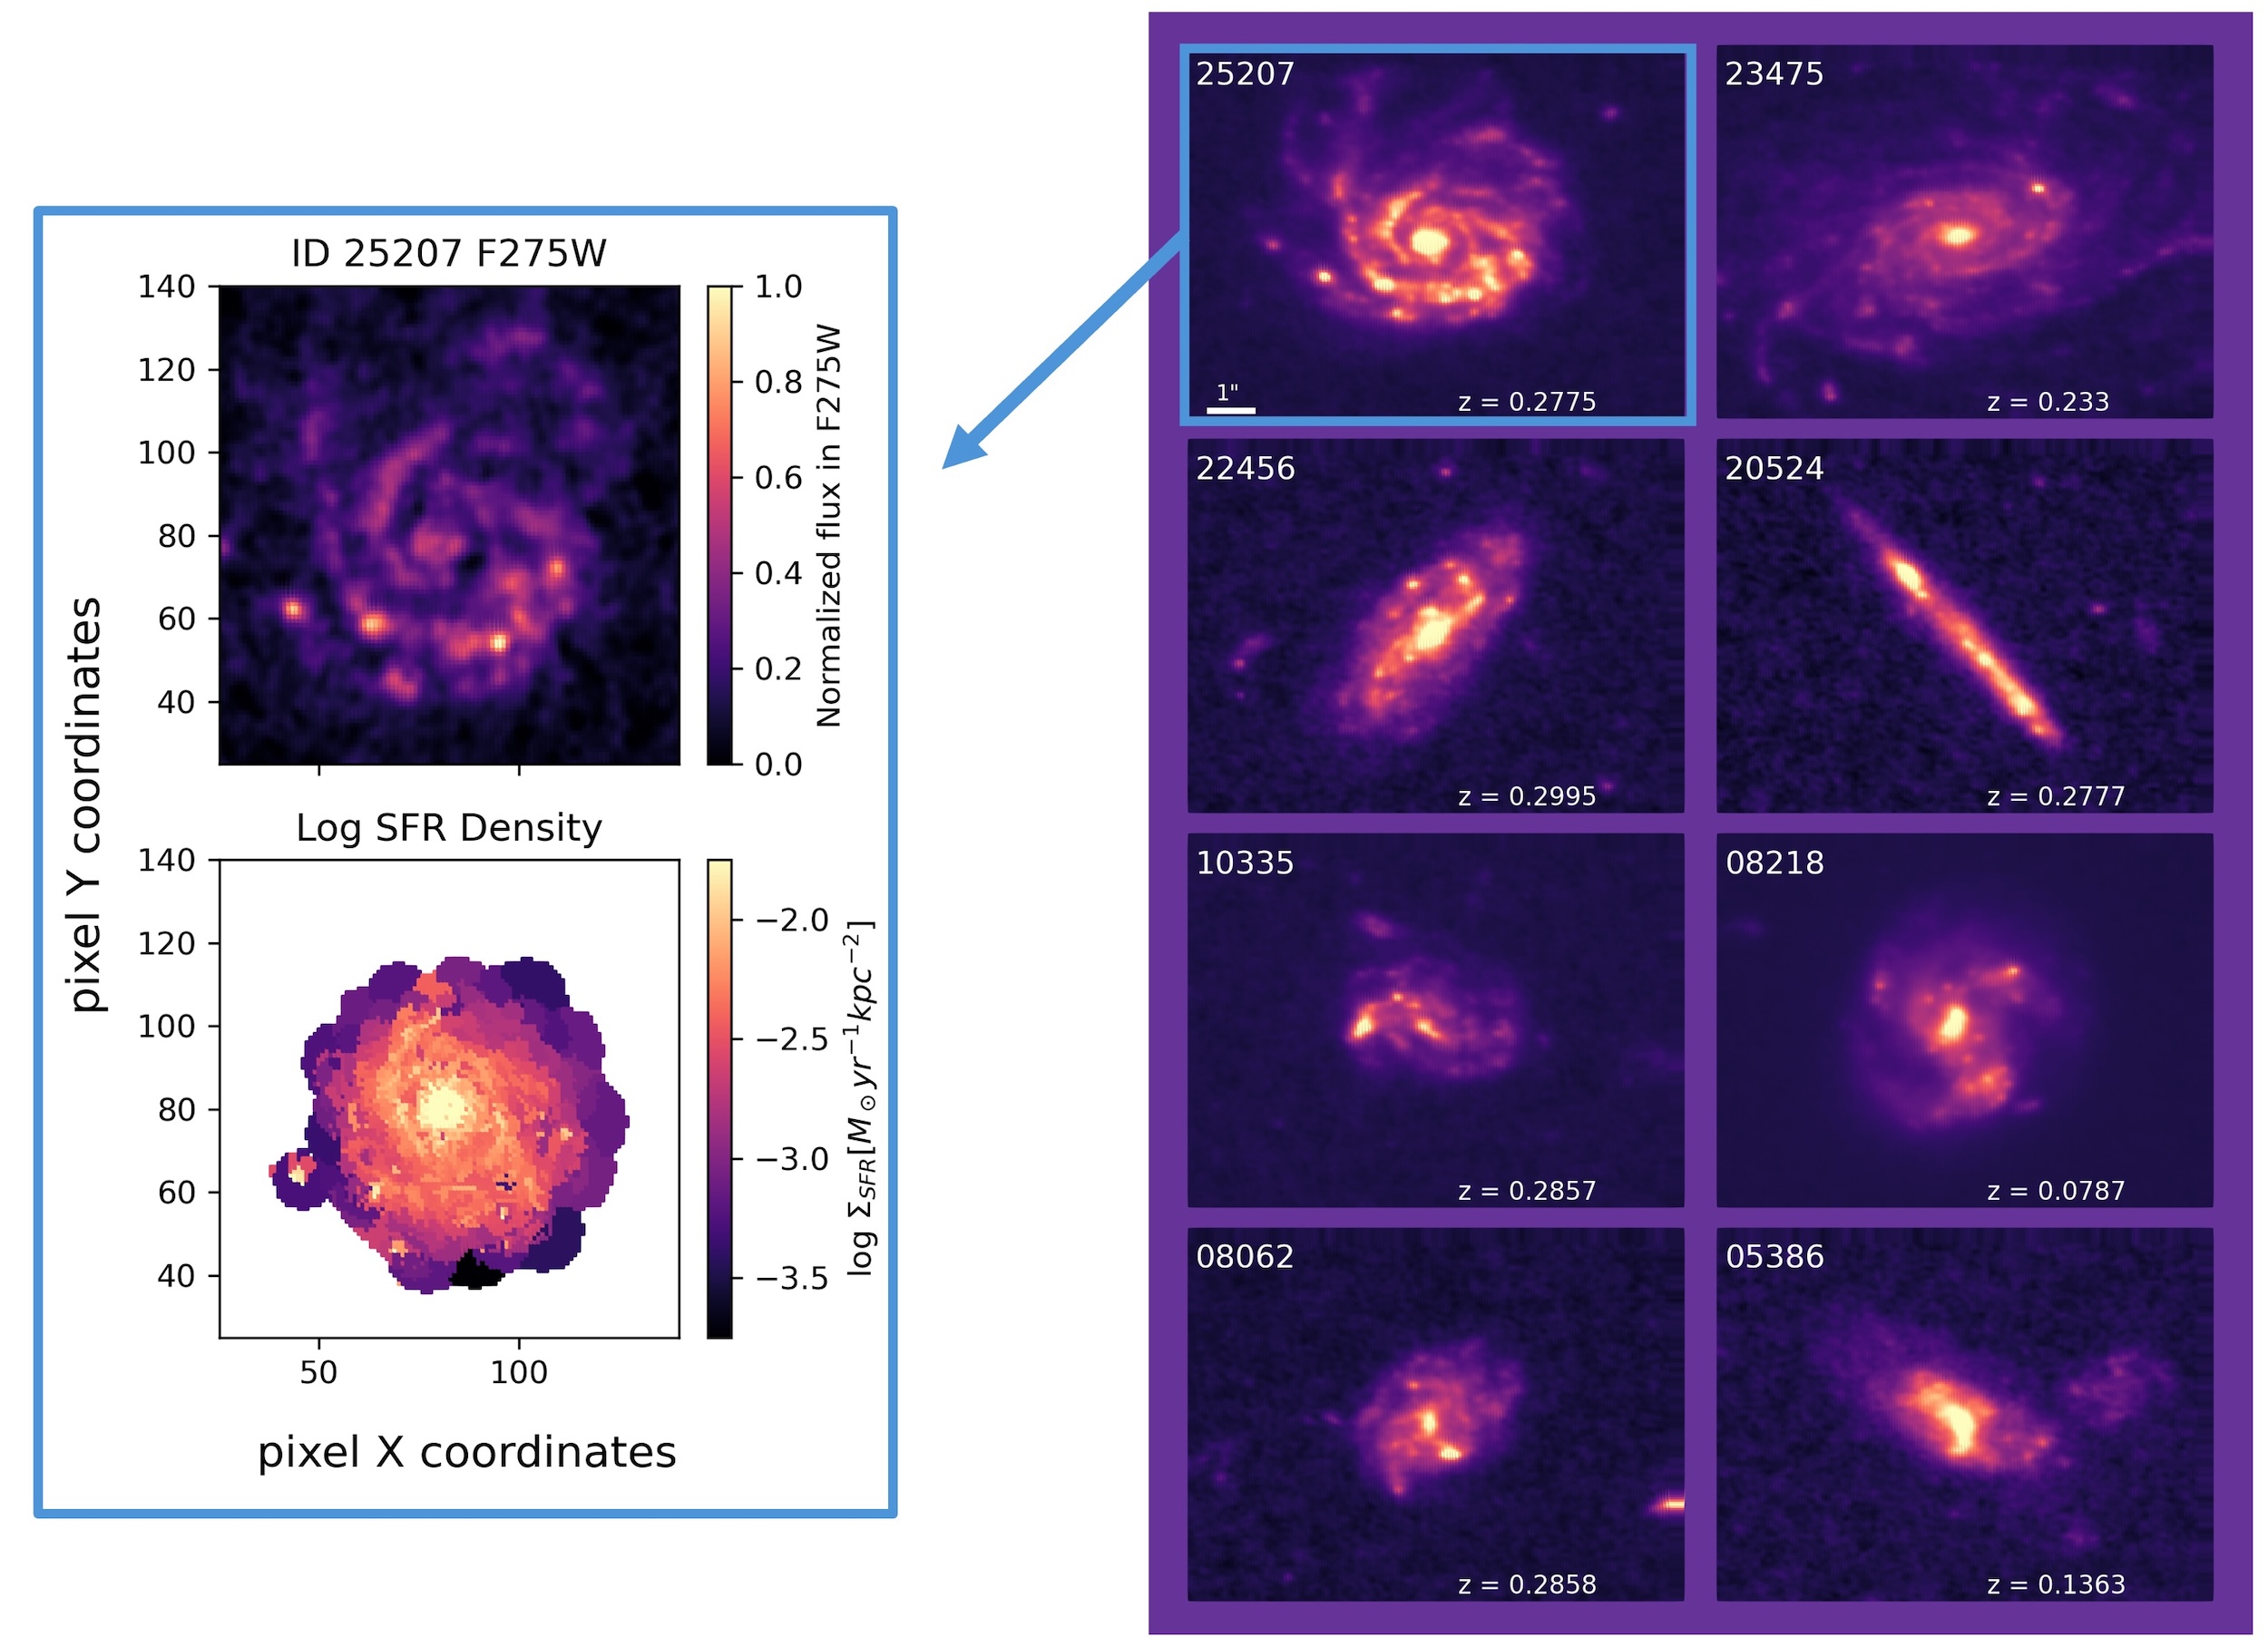
Star formation occurs on scales that are much smaller and over timescales much shorter than the global properties and overall lifetime of a galaxy. By observing star formation on these smaller scales over time, astronomers can gain a clearer picture of how star formation ceases in a galaxy, and they can determine whether this process is driven from the inside out — starting with the supermassive black hole in the galactic center — or from the outside in, influenced by environmental effects. In today’s article, the authors use the Cosmic Assembly Near-Infrared Deep Extragalactic Legacy Survey with high-resolution ultraviolet coverage (UVCANDELS) to examine eight “golden” galaxies, shown in Figure 1. They then reconstruct the star formation histories within small regions of each galaxy to detect the “earliest signs of quenching.”

galaxy sample from Olsen et al.

Figure 1: Images of the eight galaxies in the “Golden Sample” of galaxies studied in this work (right). These galaxies were chosen because of their clear detection, and they show a range of edge-on to face-on views as well as shapes. The authors divided each galaxy into small, resolved regions in which they measured the star formation (example shown on left). [Adapted from Olsen et al. 2026]

Characterizing the Star Formation Histories

To trace a galaxy’s star formation over cosmic time, today’s authors model its integrated light — which encodes the many episodes of past star formation — using spectral energy distribution (SED) fitting. By comparing a galaxy’s light across many wavelengths to computer models, SED fitting can estimate the ages of its stars and when they formed. This approach allows astronomers to study how a galaxy’s star formation rate evolves as a function of its stellar mass, known as the SFR – Mstellar relation. Note that the article considers the star formation rate and stellar mass in individual regions of each galaxy, so it analyzes these properties as surface densities, ΣSFR and ΣMstellar, instead of the total values.

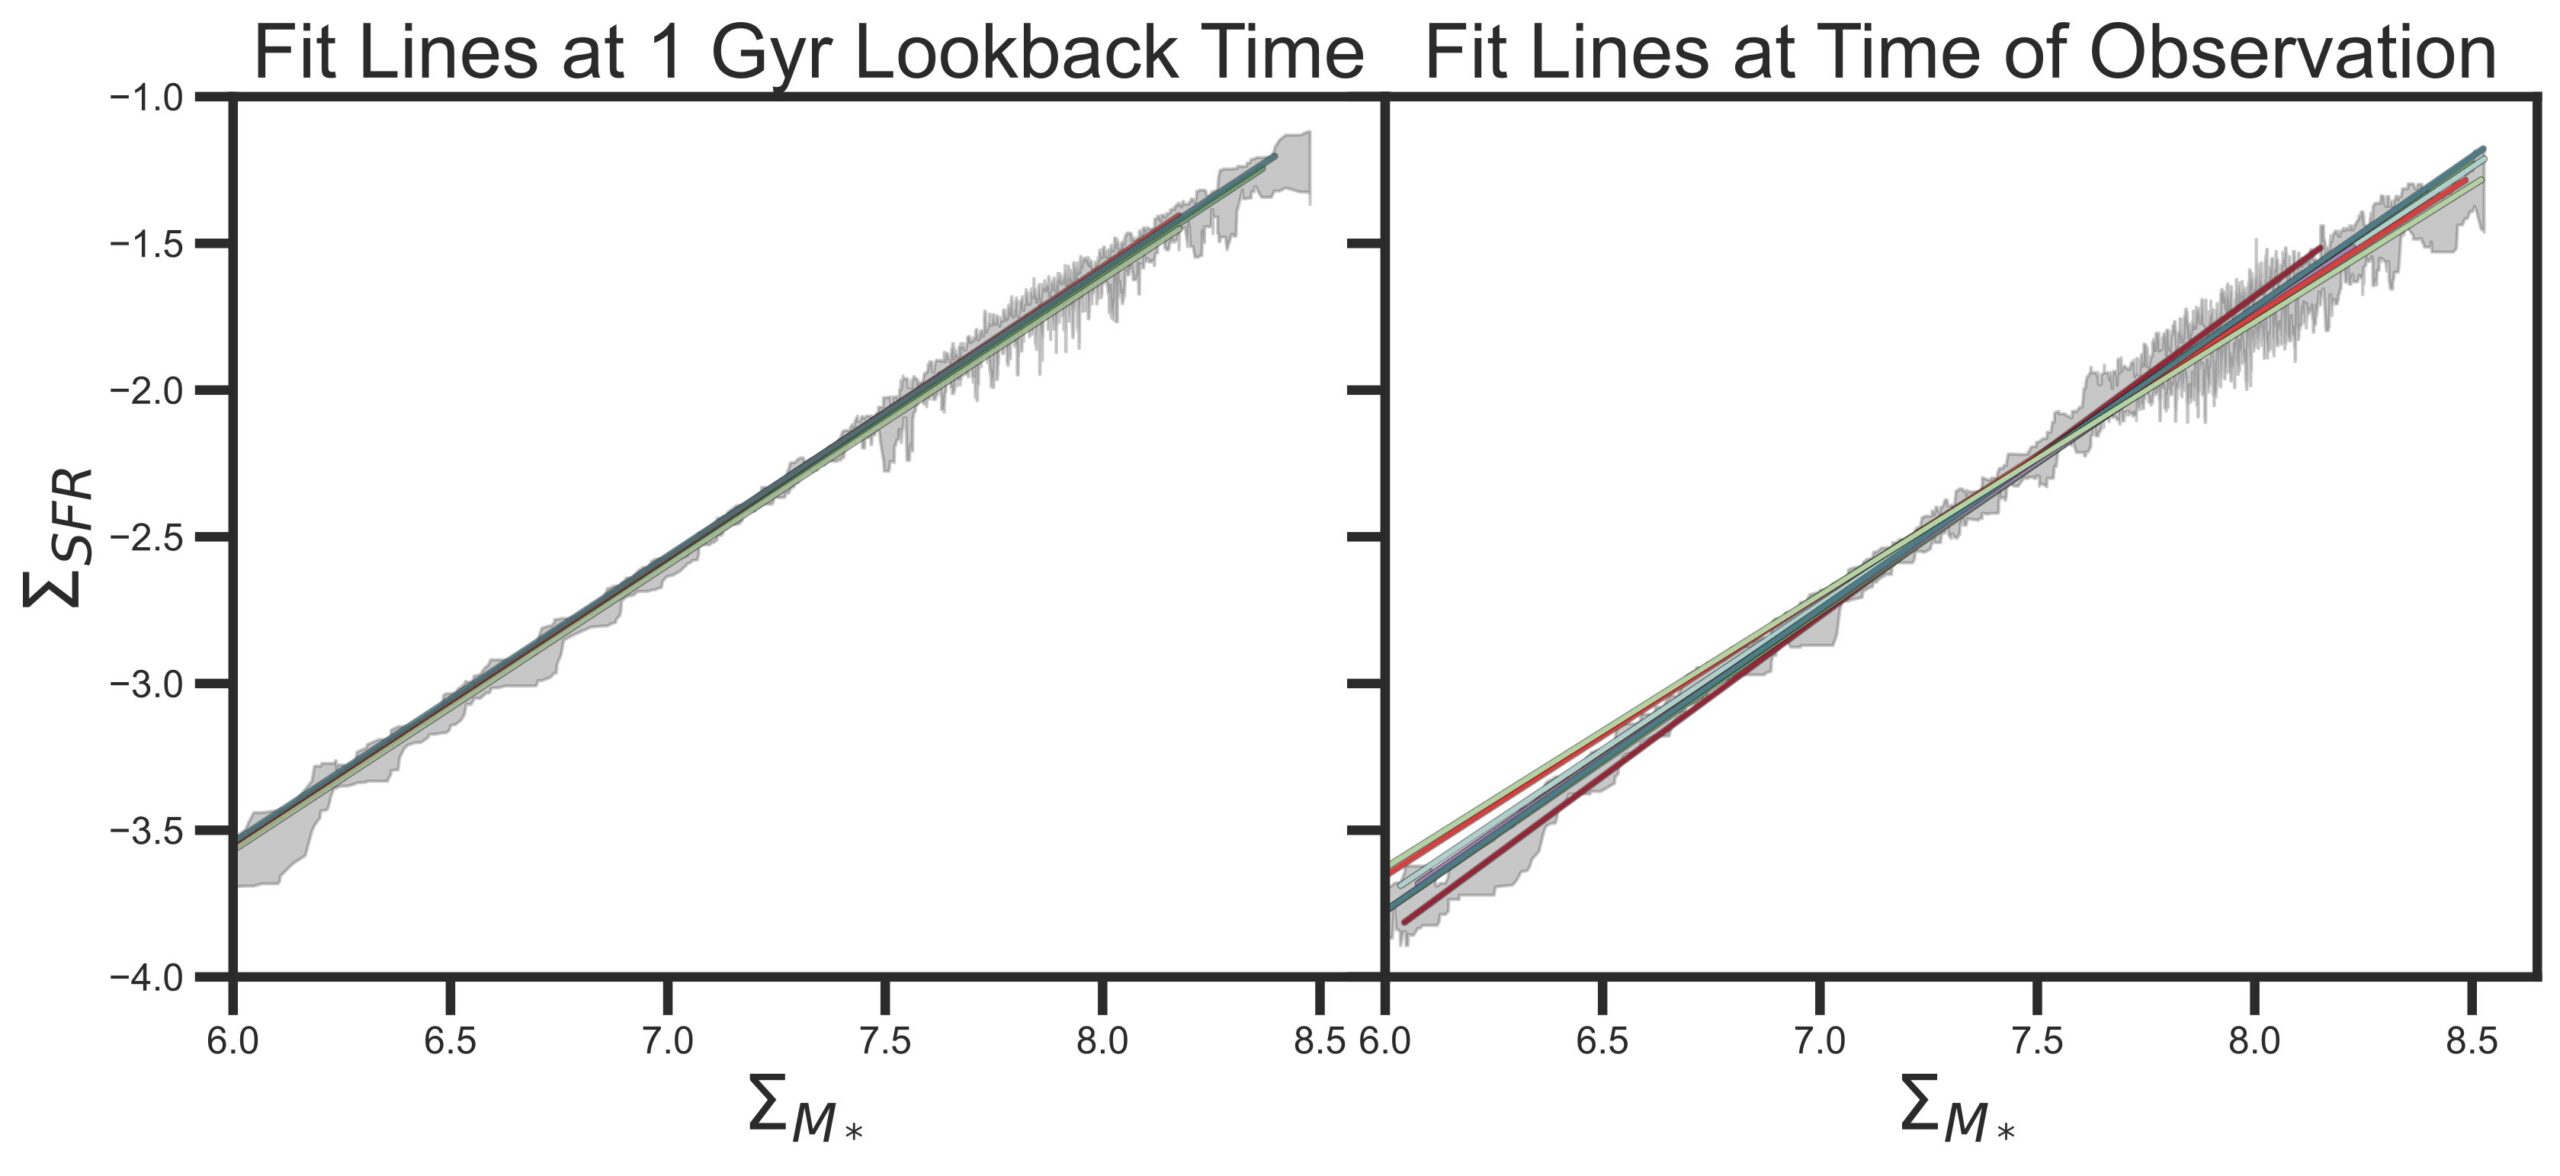
Using SED fitting, the authors determine the expected star formation rate and stellar mass of the regions from 250 million to 1 billion years before the time of observation. Figure 2 shows the line of best fit for the SFR – Mstellar relation of the regions for each galaxy, before and at the time of observation. The SFR – Mstellar relations are very similar across the sample 1 billion years before the observations; however, by the time of observation, the overall star formation rates have decreased slightly, indicating that the galaxies are beginning to quench. They also exhibit increased variation suggesting that each galaxy is quenching in a different way.

best-fit SFR – M stellar relation

Figure 2: The best-fit SFR – Mstellar relation of the regions for each galaxy, represented by the different colored lines, 1 billion years (1 Gyr) before and at the time of observation (left and right panels, respectively). At 1 billion years before the observation, the galaxies appear to have the same relation, but their variation at the time of observation suggests that the galaxies have begun quenching in different ways. [Olsen et al. 2026]

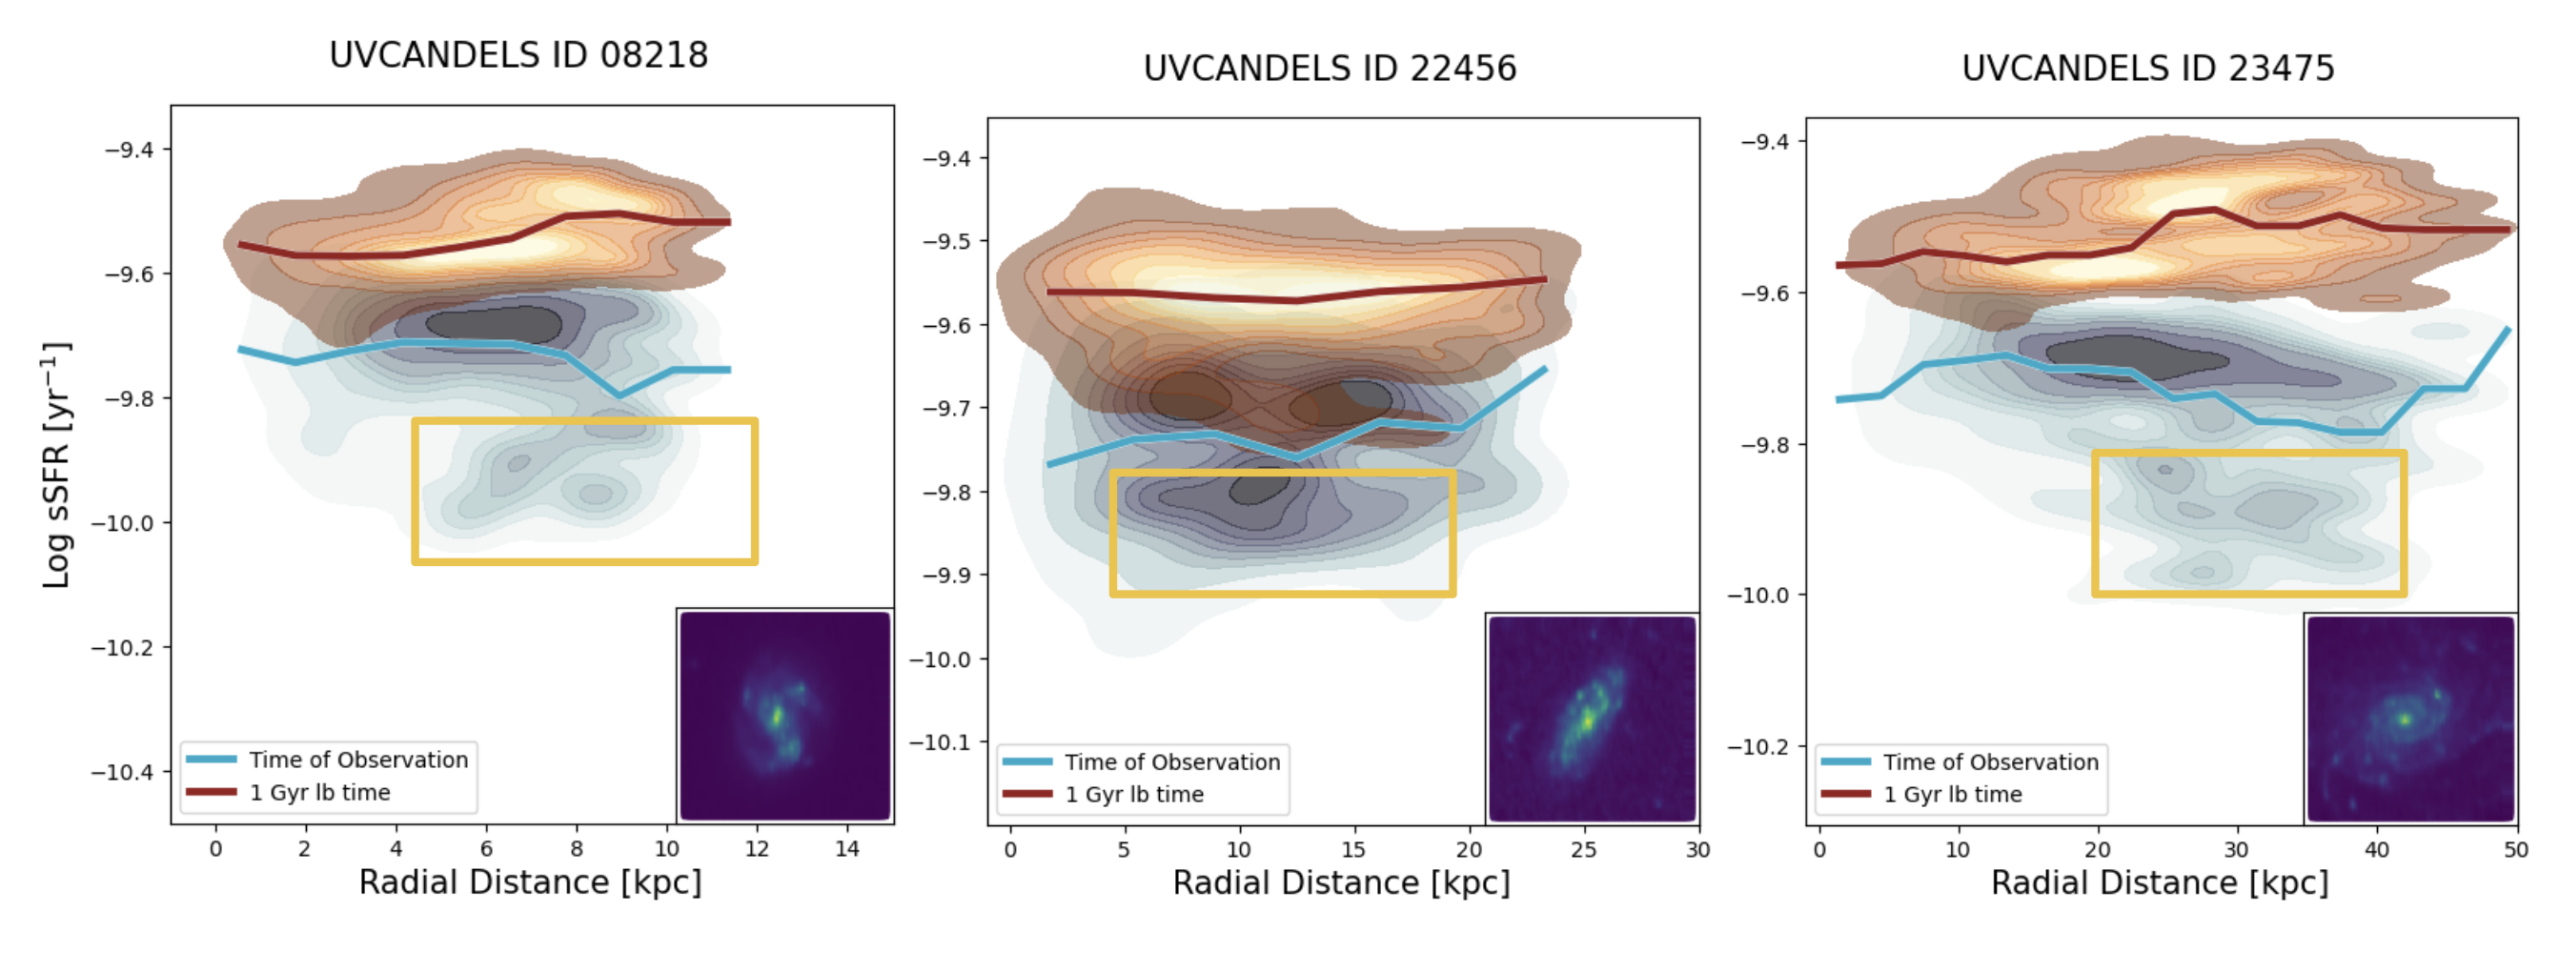
To further probe how these galaxies are starting to quench, the authors also measure the specific star formation rate (sSFR) of the regions as a function of their distance from the center of the galaxy. The sSFR can be thought of as the rate of new star formation relative to the amount of existing stellar mass: SFR /Mstellar. Figure 3 shows three examples from the galaxies studied in this work. Once again, the star formation rates of the regions decrease over the course of 1 billion years. However, the regions where the star formation rate has declined most rapidly differ from galaxy to galaxy — ranging from the central regions to the mid-disk to the outskirts — as each galaxy is undergoing a different quenching mechanism.
specific star formation rate of the regions as a function of their distance from the center of the galaxy

Figure 3: The specific star formation rate of the regions as a function of their distance from the center for three of the galaxies in the sample. Overall, the star formation rate decreases from 1 billion years before the observation (red) to the time of observation (blue). However, the regions where the star formation decreases most significantly (indicated with the yellow boxes) vary from galaxy to galaxy. [Olsen et al. 2026]

Detecting the Earliest Signs of Quenching

It should be noted that all of the galaxies in this study are still forming stars. However, they are on the verge of having their star formation suppressed, offering valuable insight into how quenching begins and how diverse the process can be. New telescopes are pushing the boundaries of what we can observe. On one hand, JWST can capture galaxies at exceptionally high resolution; on the other, the Vera C. Rubin Observatory and the Nancy Grace Roman Space Telescope will deliver vast datasets containing billions of galaxies. Future investigations leveraging these facilities could reveal more about the physical processes that quench galaxies on small scales, shedding light on the mechanisms that drive galaxy evolution.

Original astrobite edited by Catherine Slaughter.

About the author, Shalini Kurinchi-Vendhan:

After studying astrophysics and literature at Caltech, I moved onto a Fulbright Fellowship in Heidelberg, Germany. I’m passionate about using computer simulations to explore supermassive black holes and galaxy evolution — but I also love poetry and traveling.

The post Observing the End of Star Formation in Galaxies appeared first on AAS Nova.

  •  

Featured Image: Massive Stars in the Making

W51A star forming region

W51A study region

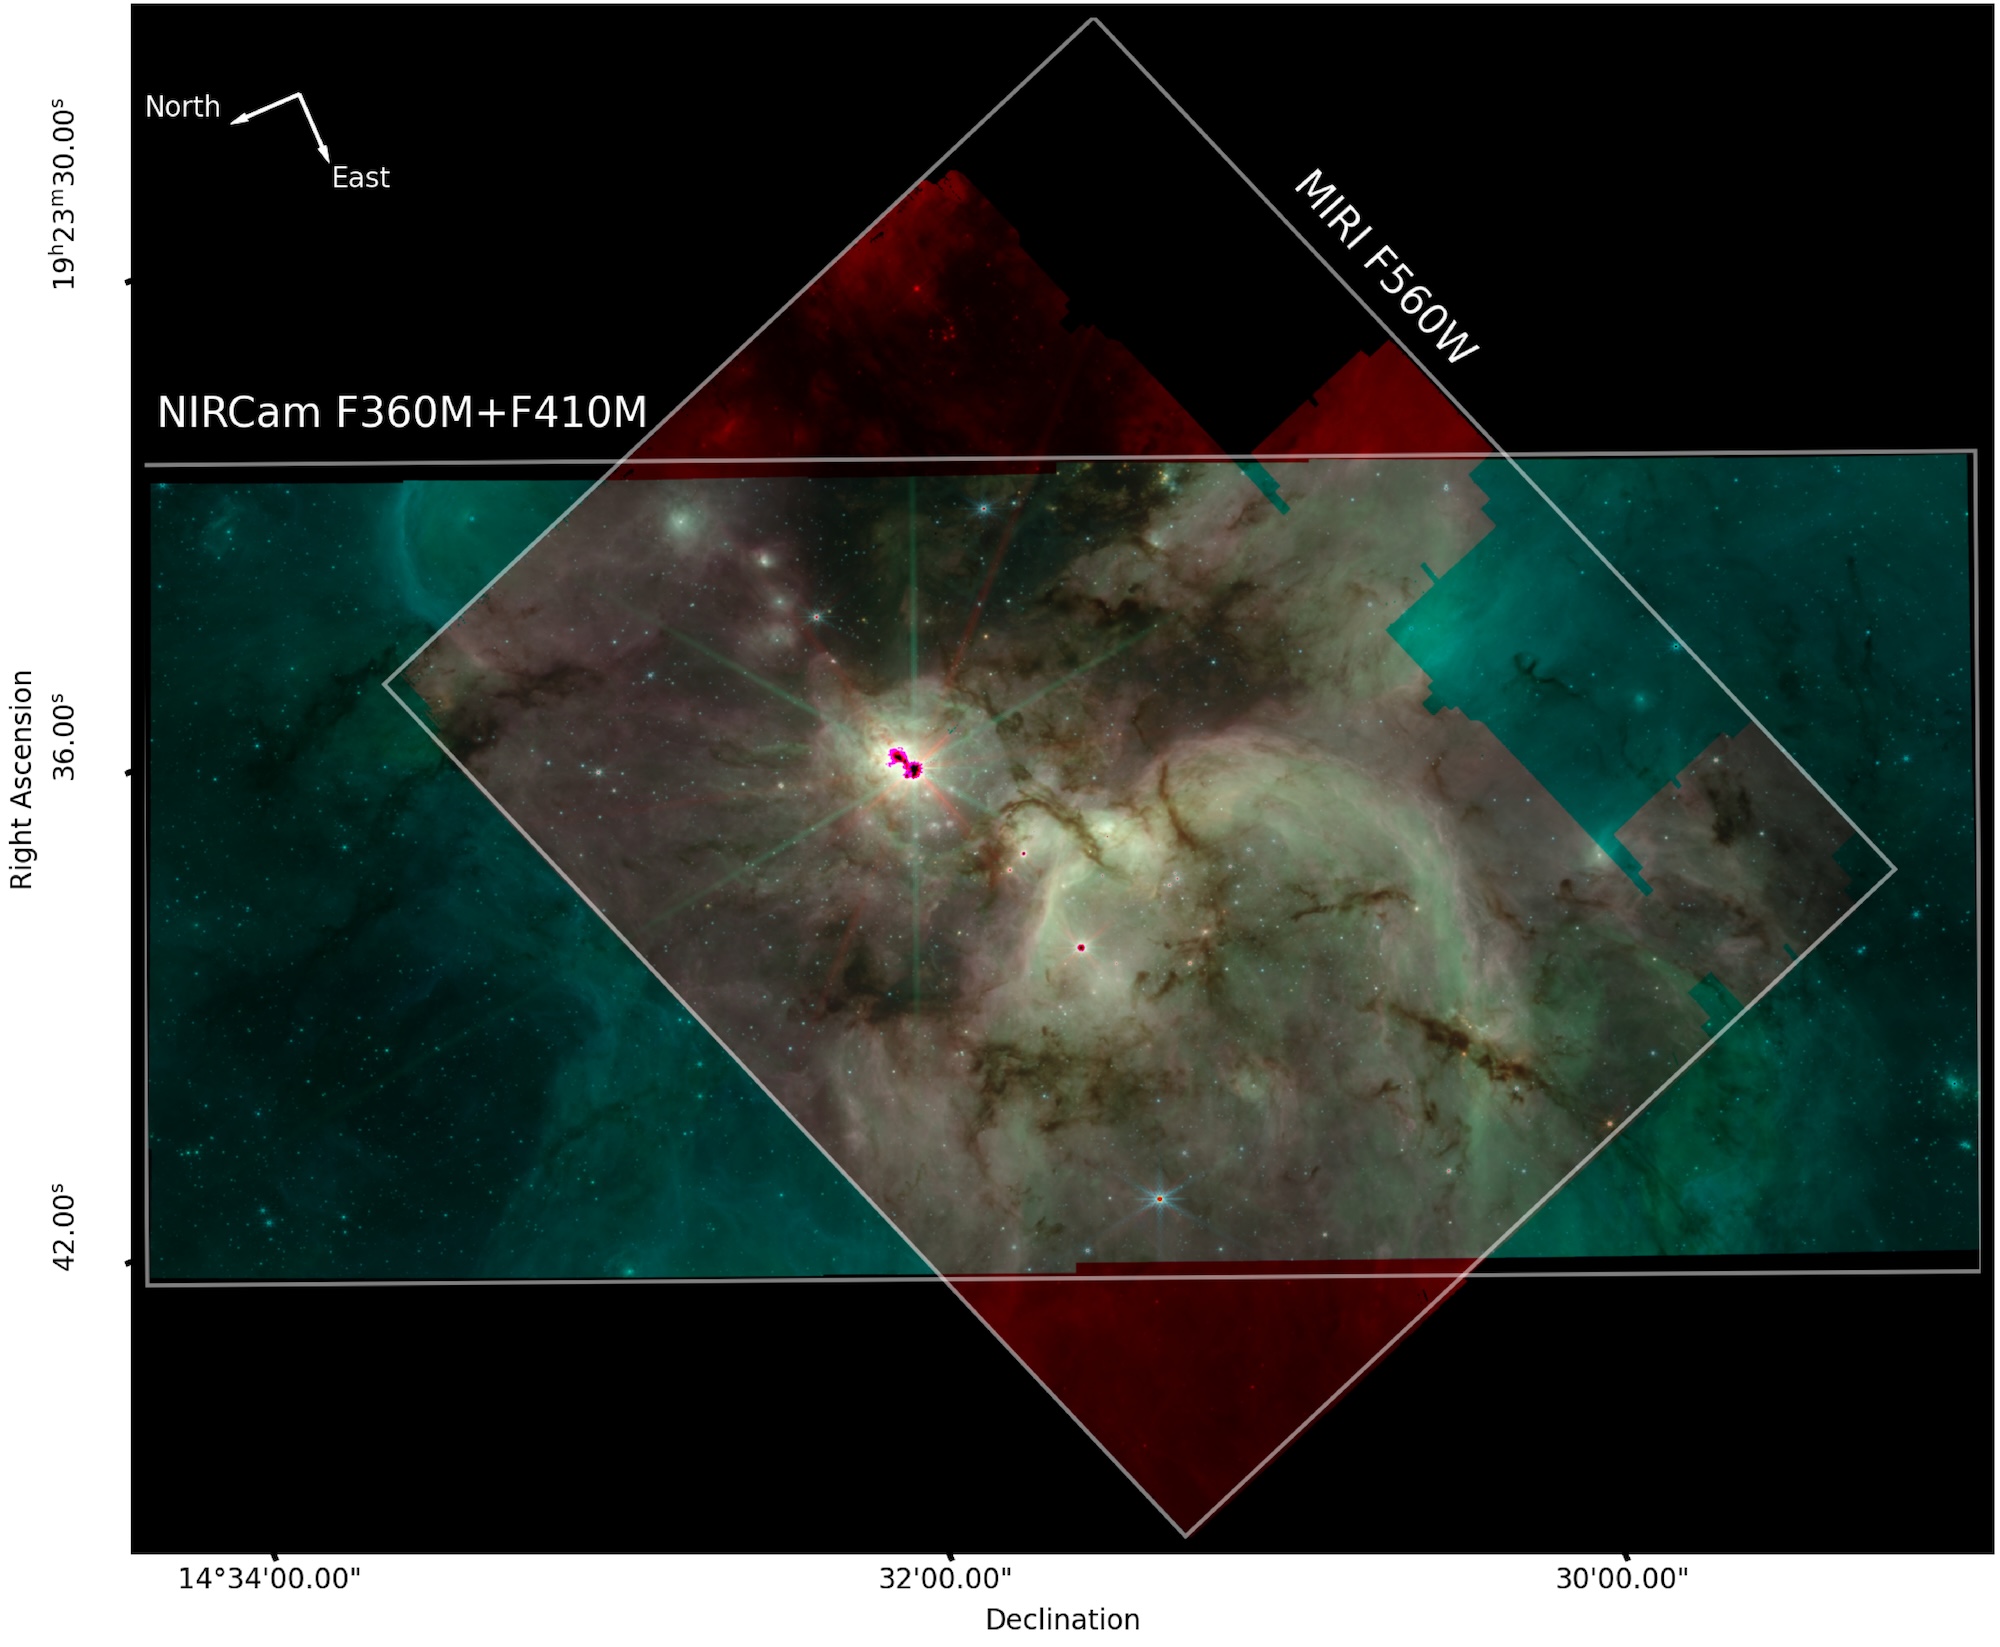
The full view of the study region, showing the NIRCam and MIRI footprints. [Yoo et al. 2026]

This image shows one W51A, of the most active star-forming regions in our galaxy. A research team led by Taehwa Yoo (University of Florida) recently observed this region with JWST, using the telescope’s Near-Infrared Camera (NIRCam) and Mid-Infrared Instrument (MIRI) to record fine structures in the swirling, dusty gas and reveal deeply embedded protostars. The JWST data enabled the team to study two protoclusters that are busily sculpting roughly 10,000 solar masses of gas — each! — into new stars. One protocluster, W51-IRS2 (containing the brightest source in the image above), has excavated a bubble around itself through intense stellar feedback, while the other, W51-E (down and to the right of W51-IRS2, where multiple dust lanes converge), is still being fed by dusty tendrils. For more details on this star-forming region, be sure to check out the full research article linked below.

Citation

“A JWST NIRCam/MIRI View of the W51A High-Mass Star-Forming Region,” Taehwa Yoo et al 2026 AJ 171 208. doi:10.3847/1538-3881/ae40b7

The post Featured Image: Massive Stars in the Making appeared first on AAS Nova.

  •  

Monthly Roundup: Investigating Active Galactic Nuclei

composite image of the active galaxy Centaurus A

Many galaxies, including our own, have a central supermassive black hole. In certain galaxies, gas becomes ensnared in the black hole’s gravitational pull and collects in a disk that feeds the black hole, forming an active galactic nucleus (AGN). An AGN can feast on this disk of gas and dust for millions to billions of years — glowing across the electromagnetic spectrum, brandishing relativistic jets, and creating a brilliant, variable light show visible from billions of light-years away.

Today’s Monthly Roundup investigates the connection between AGNs and neutrinos, considers the question of AGN variability, and explores modeling techniques for relativistic environments.

A Search for Neutrinos from X-Ray-Bright AGNs

Where do neutrinos — neutral, nearly massless elementary particles — come from? AGNs have emerged as one likely source; in 2022, the IceCube collaboration reported evidence for neutrinos from the nearby galaxy Messier 77, which hosts an X-ray-bright AGN, and earlier observations potentially linked a neutrino to the blazar TXS 0506+056.

NGC 7469

The spiral galaxy NGC 7469, shown here in this JWST image, contains an AGN that may be a source of neutrinos. [ESA/Webb, NASA & CSA, L. Armus, A. S. Evans; CC BY 4.0]

To investigate the possible connection between neutrinos and X-ray-bright AGNs, the IceCube collaboration performed a dedicated search for neutrinos toward a collection of X-ray-bright AGNs in the northern sky. The team’s initial analysis confirmed that Messier 77 is the strongest source of neutrinos in that area. Focusing specifically on X-ray-bright AGNs with hard X-ray fluxes at least 20% of Messier 77’s flux — 47 AGNs in total — the team found evidence for a possible neutrino excess toward 11 of the galaxies, with NGC 7469 being the strongest candidate.

This result suggests that X-ray-bright AGNs are indeed a plausible source of neutrinos. As for the specific physical origin of these AGN-generated neutrinos, the data provide a few clues. The X-ray emission of an AGN is thought to arise from a billion-degree cloud of plasma called the corona. The interaction of coronal X-rays with high-energy protons is thought to produce neutrinos in the energy range of 1–10 teraelectronvolts — roughly the energies of the neutrinos associated with Messier 77 in this study. However, NGC 7469 was associated with neutrinos more energetic than this range, suggesting that not all AGN-produced neutrinos have a coronal origin. Thus, though the body of evidence suggesting that X-ray-bright AGN are a source of neutrinos, the precise mechanism through which these neutrinos are produced remains unknown.

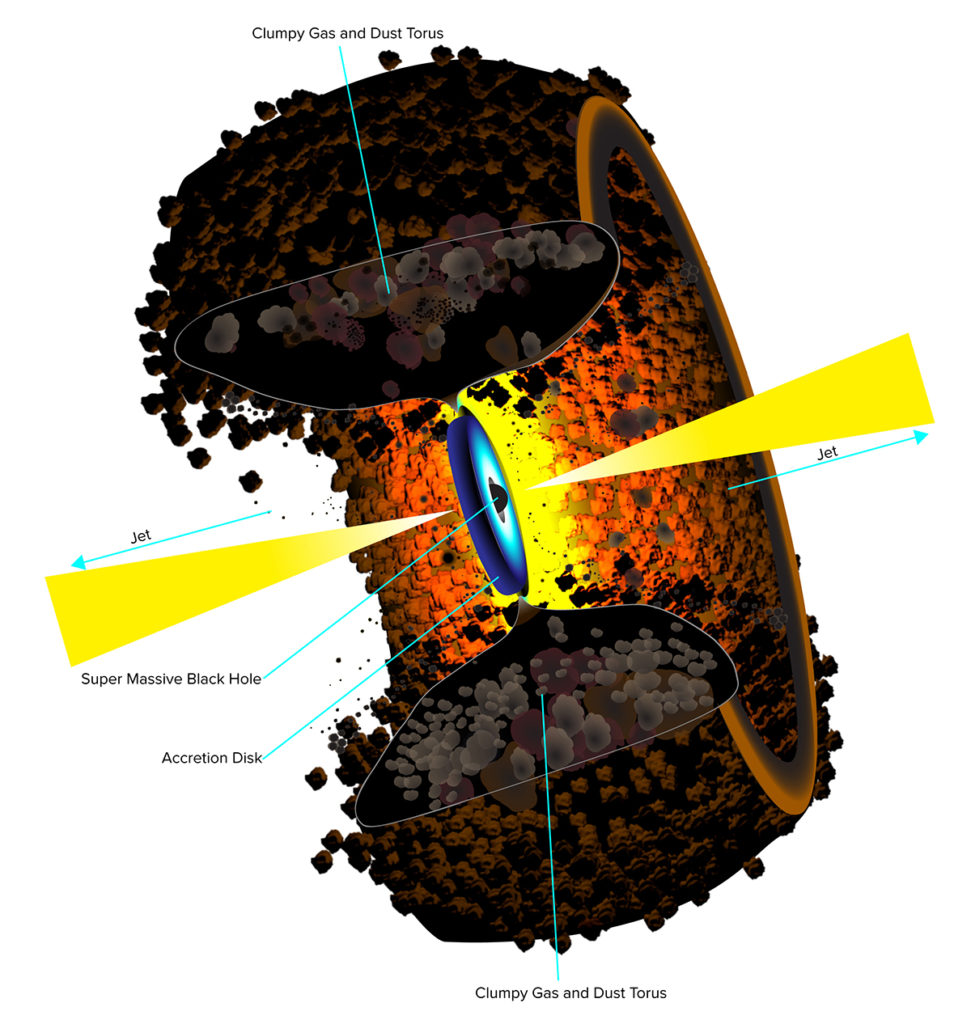
diagram of the unified model of active galactic nuclei

A diagram of the unified model of active galactic nuclei, showing an accretion disk, dusty torus, and jets. Click to enlarge. [B. Saxton NRAO/AUI/NSF; CC BY 4.0]

Disk or Jet: Which Varies More?

If there’s one constant when it comes to AGNs, it’s change; observations show that the emission from active galaxies varies on timescales from minutes to decades. Though both the accretion disk and the jet contribute to the overall multiwavelength behavior of an AGN, it’s not yet clear which of these structures is a greater contributor to an AGN’s variability.

Vineet Ojha (Peking University) and coauthors considered AGN variability at optical and mid-infrared wavelengths. Ojha’s team collected a sample of AGN that lie at similar redshifts and fall into one of three categories: narrow-line Seyfert 1 galaxies detected in gamma rays, narrow-line Seyfert 1 galaxies not detected in gamma rays, and broad-line Seyfert 1 galaxies detected in gamma rays. These three classes are distinguished by the presence or absence of relativistic jets as well as their accretion rate; gamma-ray-detected Seyfert 1s likely host jets, and narrow-line Seyfert 1s likely have higher accretion rates than broad-line Seyfert 1s.

Using optical data from the Zwicky Transient Facility and mid-infrared data from the Wide-field Infrared Survey Explorer, the team separated statistical wiggles from true variability and determined which sample of AGNs was most variable. They found that broad-line AGNs detected in gamma rays are the most variable, suggesting that jets are major contributors to AGN variability. Narrow-line AGNs detected in gamma rays are next in line, likely because these AGNs have jets but also have a strong thermal emission component from their accretion disks due to their high rate of accretion. Narrow-line AGNs not detected in gamma rays are the least variable, lacking a jet and dominated by thermal emission. Taken together, these results suggest that AGN variability is mostly jet driven, with some contribution from accretion disk instabilities.

More on AGN Jets: The Slow-Light Effect

The galaxy Messier 87 (M87) hosts one of the most studied AGN jets. M87’s jet is visibly structured, and it exhibits superluminal motion, in which the relativistic plasma appears to move faster than the speed of light. Because the plasma accelerated by an AGN moves so quickly, researchers attempting to model this plasma may opt to use the slow-light approach, in which the evolution of the ambient plasma is modeled simultaneously with the propagation of light through the medium. Though more computationally intensive than the fast-light approach, in which photons zip through a static medium, slow-light techniques are needed in regions of relativistic flows or strong acceleration.

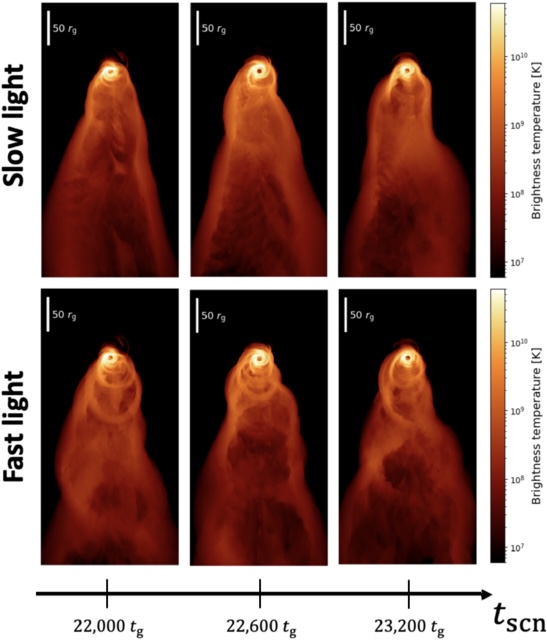
comparison of slow light and fast light results for M87's jet

Comparison of the jet morphology from the slow-light (top row) and fast-light (bottom row) methods. [Adapted from Tsunetoe et al. 2026]

Yuh Tsunetoe (Chinese Academy of Sciences; University of Tsukuba) and collaborators demonstrated their use of the slow-light approach in models of M87’s jet-launching region, where plasma is accelerated to relativistic velocities. The team performed general relativistic magnetohydrodynamics simulations of the accretion disk and jet from M87’s supermassive black hole and compared the results from slow-light and fast-light methods.

The team found that slow-light images tended to be smoother, lacking the looping, helical structures within the jet seen in fast-light images. Slow-light images show more evidence for the superluminal motion that is observed in relativistic jets like M87’s, as well as greater limb brightening and less wobbling motion. The team also investigated the effects of changing the black hole spin, finding greater wobbling in the jet for slow black hole spins and a straighter, wider jet for rapid black hole spins. Overall, Tsunetoe and coauthors found that the slow-light approach generated images that are more consistent with the properties of M87’s jet, demonstrating that the slow-light approach is necessary to capture the behavior of relativistic jets.

Citation

“Evidence for Neutrino Emission from X-Ray-Bright Active Galactic Nuclei with IceCube,” R. Abbasi et al 2026 ApJL 1000 L26. doi:10.3847/2041-8213/ae4aad

“The Relative Contributions of Accretion Disk Versus Jet to the Optical and Mid-Infrared Variability of Seyfert Galaxies,” Vineet Ojha et al 2025 ApJ 994 84. doi:10.3847/1538-4357/ae0a38

“Slow-Light Effect in the Jet-Launching Region of M87,” Yuh Tsunetoe et al 2026 ApJ 1000 29. doi:10.3847/1538-4357/ae43e7

The post Monthly Roundup: Investigating Active Galactic Nuclei appeared first on AAS Nova.

  •  

Astronomers See Braided Magnetic Fields Above a Sunspot

sunspot

Revealed in high resolution, researchers have spotted complex twisting and braiding motions in fine threads of plasma suspended above a sunspot. The flow of material that followed this braiding provides evidence for magnetic reconnection.

Heating Up the Corona

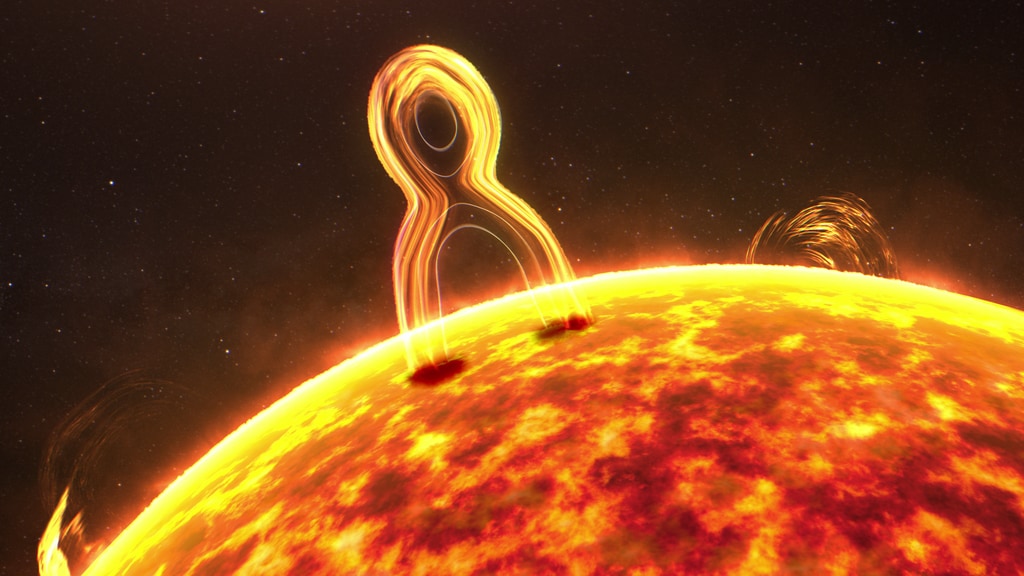
illustration of magnetic reconnection on the Sun

Magnetic reconnection is common throughout the universe, from Earth’s magnetic field to the jets of supermassive black holes. This illustration shows magnetic reconnection happening on the Sun. [NASA’s Conceptual Image Laboratory]

One of the leading challenges for the field of solar physics is explaining how the temperature of the Sun skyrockets from roughly 6000K at its surface, or photosphere, to more than 106K in its wispy corona. The top candidates for the resolution to this mystery are magnetohydrodynamic waves and magnetic reconnection, in which nearby field lines reorganize into a lower-energy configuration and release magnetic energy.

One way for magnetic reconnection to heat the corona is along magnetic fields that loop up into the corona and are anchored to the solar photosphere. The footprints of these field lines — the spots where they land in the photosphere — wiggle around in random ways. As this happens, the arcing magnetic field lines become braided together, and the twisted magnetic field can then undergo magnetic reconnection, heating the corona.

Braiding and Unbraiding

This process has been explored theoretically, but it’s been challenging to observe directly. As increasingly capable Sun-studying instruments have come online, though, researchers have been able to attain the high resolution needed to see this process at work.

Recently, Hechao Chen (Yunnan University; Peking University; Yunnan Key Laboratory of Solar Physics and Space Science) used data from the New Vacuum Solar Telescope, the Interface Region Imaging Spectrograph, and the Solar Dynamics Observatory to study the braiding and unbraiding of fine magnetic structures above a sunspot.

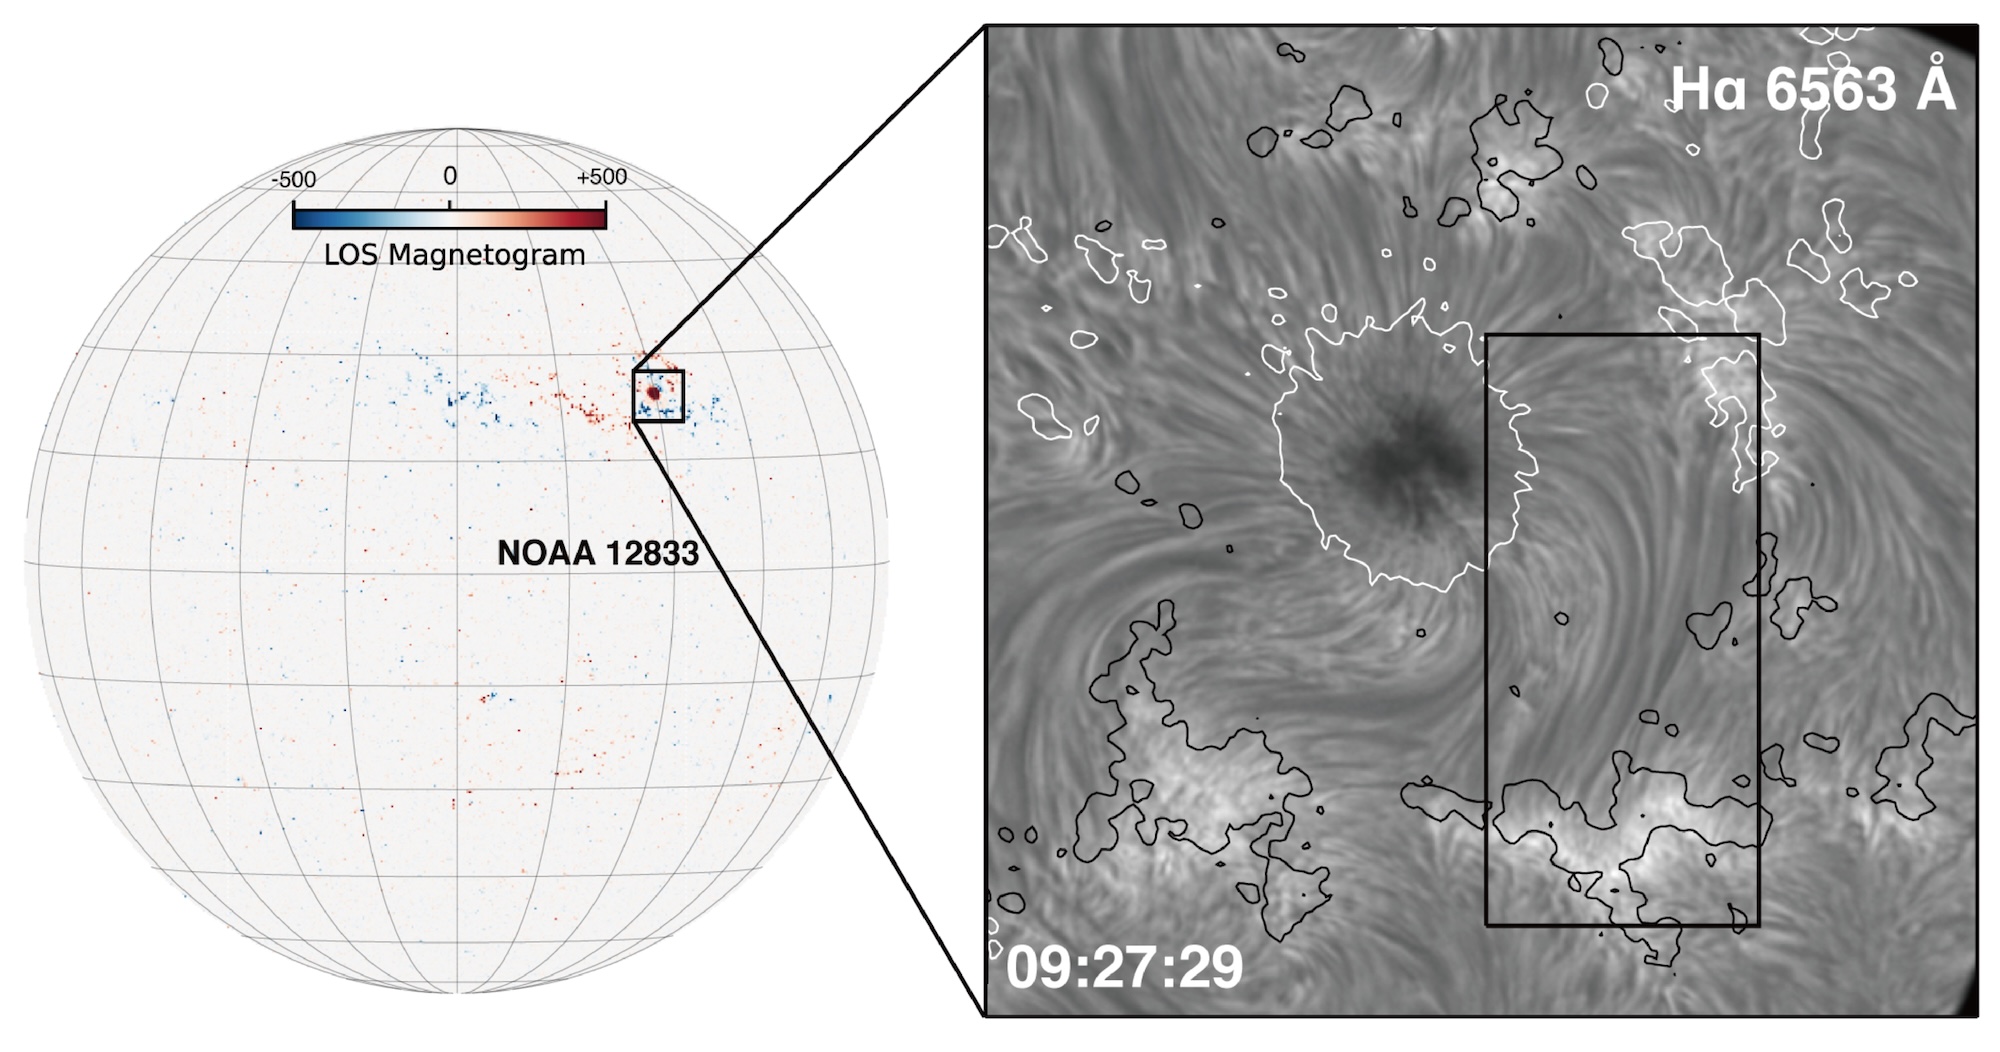
plasma threads around a sunspot

Location of the sunspot featured in this study, plus a closeup of the strands of plasma around the sunspot. Click to enlarge. [Adapted from Chen et al. 2025]

The images show a bundle of narrow strands of plasma stretching about 17,000–22,000 miles (28,000–36,000 kilometers). These plasma threads trace magnetic field lines as they emerge from the sunspot before diving down again in a network region, where the magnetic field is slightly enhanced at the border of a giant convective cell.

Driven by Reconnection

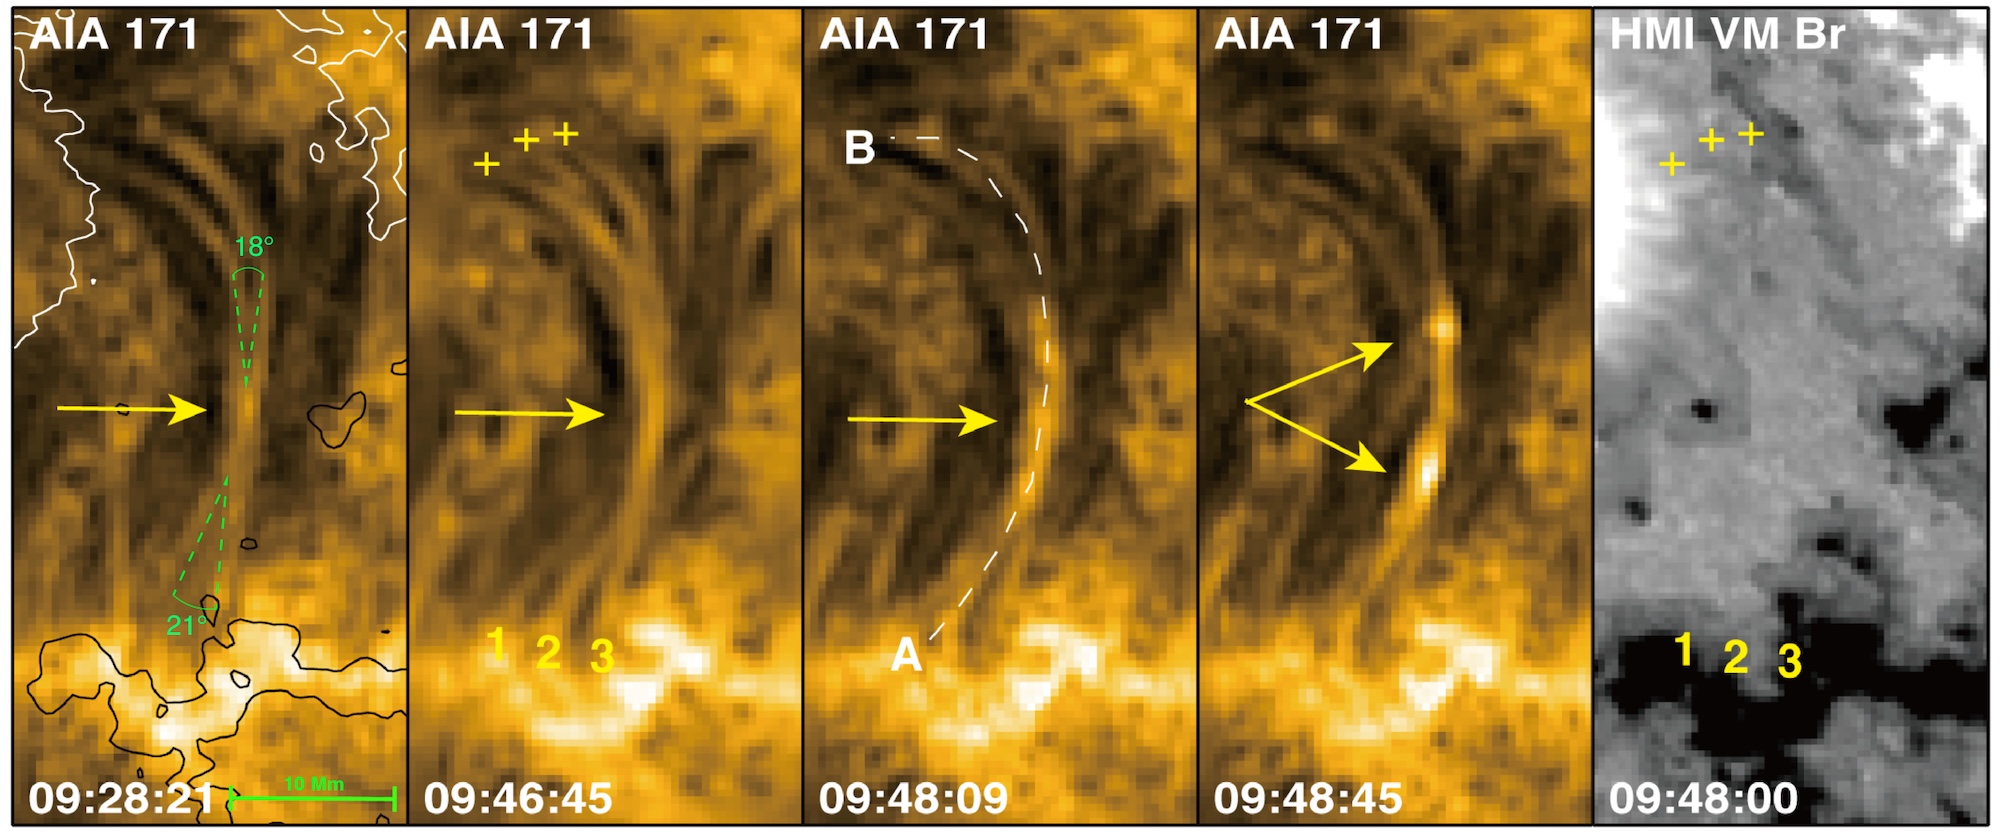
The plasma threads appear to lie nearly parallel to one another at the beginning of the observation. Images from all three facilities showed the plasma threads intertwining, providing evidence for the twisting of magnetic field lines predicted to happen when their footprints move around. (As further evidence for this footprint motion, the team also observed complicated flow patterns near one of the footprints.) This intertwining was followed by a sudden brightening where the threads were most tightly knotted, creating two bright “blobs” that traveled outward toward the footprints. Afterward, the threads resumed their nearly parallel state.

braiding magnetic field structures on the Sun

Images from Solar Dynamics Observatory. The first four images show the Sun at a wavelength of 17.1 nanometers, and the final image shows the radial magnetic field. The arrows indicate the location of the magnetic field braiding and the plasma “blobs.” Click to enlarge. [Adapted from Chen et al. 2025]

The team witnessed these bright points form and travel outward repeatedly, moving with projected velocities of 20–230 km/s. They posited that the motion and heating of these blobs of plasma was driven by the release of magnetic tension, and that the threads returned to a parallel configuration once reconnection was complete. They estimated that each of these events produced 1017 Joules, roughly the energy expected for small-scale reconnection events.

This work beautifully illustrates the process of magnetic reconnection on the Sun, showing how random motions can set the stage for the buildup of magnetic tension. The heating and acceleration of plasma that follows demonstrates how small-scale reconnection events like the ones shown here can provide the energy needed to heat the solar corona.

Citation

“Witnessing Magnetic Reconnection in Tangled Superpenumbral Fibrils Around a Sunspot,” Hechao Chen et al 2025 ApJ 995 94. doi:10.3847/1538-4357/ae12e9

The post Astronomers See Braided Magnetic Fields Above a Sunspot appeared first on AAS Nova.

  •  

Black Hole Baby Photos: JWST and Chandra Observe M31-2014-DS1

illustration of M31-2014-DS1

One of the most luminous supergiant stars in the Andromeda Galaxy, M31-2014-DS1, has disappeared, potentially leaving behind a black hole shrouded in dusty gas. What do new infrared and X-ray observations tell us about this event?

Failure to Explode?

SN 2023ixf in Messier 101

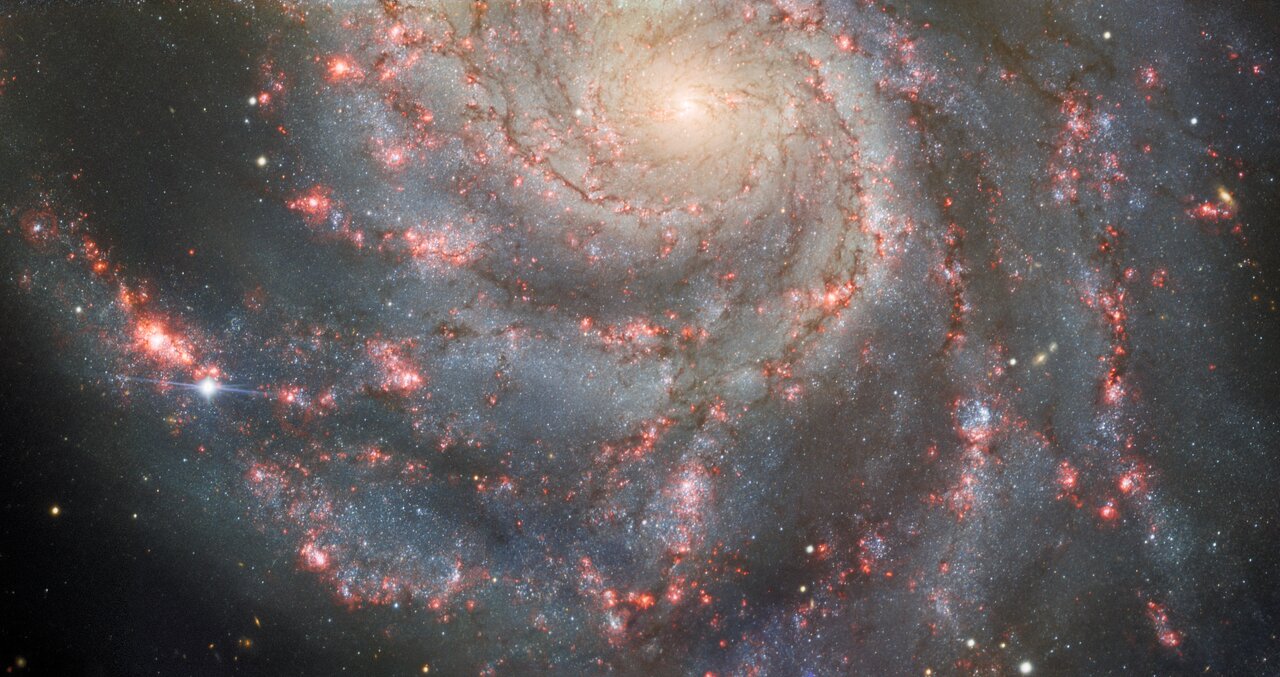
This image from Gemini North shows the supernova SN 2023ixf along one of the spiral arms of Messier 101. Though less showy than core-collapse supernovae, “failed” supernovae may be another way to form stellar-mass black holes. [International Gemini Observatory/NOIRLab/NSF/AURA; CC BY 4.0]

Massive stars are famous for going out with a bang. After swelling into supergiants, these stars bring their brief lives to a close in a cosmic fireworks show: a supernova explosion that creates a neutron star or a black hole.

But a splashy supernova explosion may not be the only way for a massive star to go out. As observations have begun to suggest, some massive stars may — for reasons not yet fully understood — quietly collapse in upon themselves, going out with a whimper rather than a bang. Though less spectacular and far harder to spot, these “failed” supernovae highlight a possible pathway for the formation of stellar-mass black holes.

A Newborn Black Hole in a Dense, Dusty Blanket

Just last month, researchers reported their discovery of a potential failed supernova. The supergiant M31-2014-DS1 suddenly brightened in 2014 before fading to obscurity, leading researchers to suspect that the star had experienced a failed supernova and created a black hole. The event shared similarities with another failed supernova candidate, NGC6946-BH1.

JWST data of M31-2014-DS 1

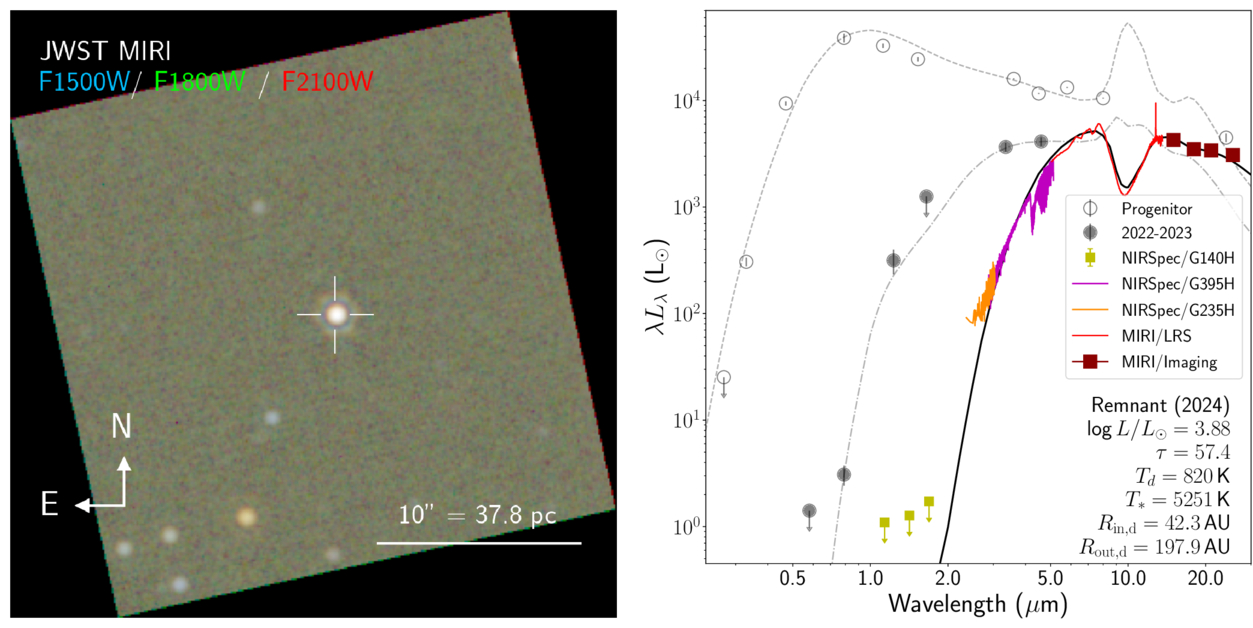
Left: A JWST image of M31-2014-DS 1. Right: Spectral energy distributions of the progenitor star/the remnant using data from 2005 to 2012 (empty circles), 2022 to 2023 (filled circles), and 2024 (colored lines). Click to enlarge. [De et al. 2026]

In a new article published in the Astrophysical Journal Letters, Kishalay De (Columbia University; Flatiron Institute) and coauthors have used JWST and the Chandra X-ray Observatory to learn more about what remained after M31-2014-DS1 disappeared. The JWST observations show an extremely red object that has faded considerably in just a few years, with a deep absorption feature from silicate dust and numerous narrow molecular absorption lines. Chandra did not detect any X-rays.

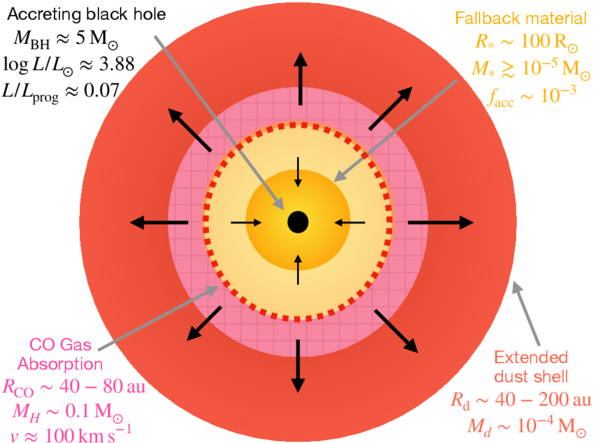
Together, these observations support a model in which the collapsing star ejected its outer layers in a relatively low-energy event (somewhere in the broad ballpark of one hundred-millionth to one ten-thousandth the energy of a typical core-collapse supernova) and formed a black hole. Some of the ejected material fell backward and fed the newborn black hole, while the remainder created a dense blanket that blocked the light from the accreting black hole from view.

Continued Evolution

schematic of the gas surrounding a newborn black hole

Cartoon showing the authors’ model and the model parameters inferred from the observations. Click to enlarge. [De et al. 2026]

In observations from 2024, the source had faded to just 7% of the progenitor star’s luminosity, supporting the conclusion that the star has disappeared and what lies beneath the dusty ejecta is a black hole. De’s team expects that as time goes on, the gas that obscures the accretion-powered luminosity of the newborn black hole will expand and become less dense along our line of sight. At some point — estimated to be no sooner than about 27 years from now — the X-ray emission from the accreting black hole should pierce the dusty shroud and become visible to sensitive X-ray observatories. In the infrared, JWST will be able to track the source’s evolution caused by continued dust creation in the expanding shell.

Thanks to its location in a neighboring galaxy, M31-2014-DS1 has granted astronomers a front-row seat to a poorly understood pathway for black hole formation. Going forward, we can expect further insights into M31-2014-DS1 and, hopefully, the discovery of many more sources like it.

Citation

“Fading into Darkness: A Weak Mass Ejection and Low-Efficiency Fallback Accompanying Black Hole Formation in M31-2014-DS1,” Kishalay De et al 2026 ApJL 999 L25. doi:10.3847/2041-8213/ae468d

The post Black Hole Baby Photos: JWST and Chandra Observe M31-2014-DS1 appeared first on AAS Nova.

  •  

Featured Image: Rare Giant Galaxies

low-surface-brightness galaxies

Giant low-surface-brightness galaxies are rare and unusual members of the galactic menagerie. They host the largest galactic disks currently known, have baryonic masses of order 100 billion solar masses, and sport narrow, tightly wound spiral structures. The origins of these vast galaxies — they can be up to 10 times larger than the Milky Way — are unknown, though various theories involving mergers, accretion, and strange dark matter halos exist. Research also suggests that there may be a connection between these galaxies and compact ellipticals, which are small, dense, and contain old stars. In a recent article, a team led by Anna Saburova (Sternberg Astronomical Institute) investigated two giant low-surface-brightness galaxies with compact elliptical companions. In the image above, the colored circles represent the oxygen abundance at each location in AGC 192040 (left) and UGC 1382 (right). The red arrows point to the compact elliptical companions. Using the chemical abundance information to investigate possible formation mechanisms, Saburova and collaborators found that the two galaxies likely formed in different ways. UGC 1382 appears to be the result of multiple mergers, while AGC 192040 may have accreted gas from its halo or a galactic filament before undergoing a merger of its own. To learn more about this study of two rare galaxies, be sure to check out the full research article linked below!

Citation

“MUSE Study of Two Giant Low-Surface-Brightness Galaxies with Compact Satellites,” Anna S. Saburova et al 2026 ApJ 998 19. doi:10.3847/1538-4357/ae3139

The post Featured Image: Rare Giant Galaxies appeared first on AAS Nova.

  •  

The Winner of the Cosmic Speed-Eating Contest

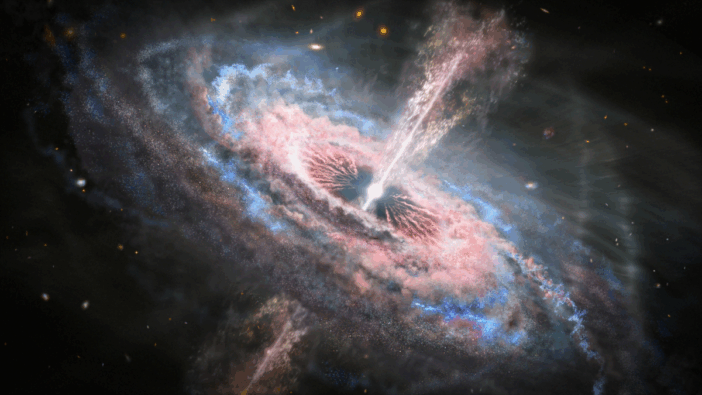
artist's impression of a quasar

Editor’s Note: Astrobites is a graduate-student-run organization that digests astrophysical literature for undergraduate students. As part of the partnership between the AAS and astrobites, we occasionally repost astrobites content here at AAS Nova. We hope you enjoy this post from astrobites; the original can be viewed at astrobites.org.

Title: X-Ray Investigation of Possible Super-Eddington Accretion in a Radio-Loud Quasar at z = 6.13
Authors: Luca Ighina et al.
First Author’s Institution: Harvard–Smithsonian Center for Astrophysics and Italian National Institute for Astrophysics
Status: Published in ApJL

Quasars are some of the most extreme objects in the entire universe. Despite being as far as tens of billions of light-years away, they nonetheless can appear as bright as some stars in our own Milky Way. To put their brightness in perspective, one just has to consider the Sun. Compared to puny human scales, our star is a truly gargantuan object. It’s a fully functional fusion reactor, churning hydrogen into helium in its core and outputting an unfathomable amount of energy in the process. This glowing furnace is so bright that it can cook us with the heat of an oven during the day, even at a distance of more than 90 million miles (about 8 light-minutes). That distance dramatically dilutes the radiation of the Sun by the time it reaches us, as we only receive a small sliver of its total output, and yet we can still feel its heat pounding down on us when we stand beneath a clear summer sky.

However, if one were to move the Sun about 30 light-years away, it would appear completely unremarkable. You’d need to be under relatively dark skies to even spot it! The vastness of space would simply crush the output of our solar engine; however, if you place a luminous quasar at that same 30 light-year distance, its searing radiation would seem to effortlessly cross the cosmic gulf looming between the stars, scorching us relentlessly with the same heat as the Sun does today. The power of a quasar simply puts our star to shame.

Still, even quasars have limits. The source of power for these objects is a supermassive black hole. The supermassive black hole that lives at the center of our Milky Way is currently dormant. However, many supermassive black holes (especially in the early universe) actively gulp down matter, releasing tremendous energy that escapes in the form of radiation across the electromagnetic spectrum. The escaping photons bump into particles on their way out, exerting an outward pressure. If enough light is unleashed by the quasar, this pressure will actually balance against the pull of gravity, cutting off the food supply for the black hole. This negative feedback loop means that a given quasar has an upper limit to its brightness, called the Eddington luminosity, and to the speed at which it accretes matter, called the Eddington rate. The authors of today’s bite examine a particularly misbehaved quasar that seems to violate even these extreme limits.

It’s a Bird! It’s a Plane! It’s a Jet?

The authors observed the quasar RACS J032021.44−352104.1 (RACS J0320−35 for short) with several radio observatories, including the Giant Metrewave Radio Telescope, the Australia Telescope Compact Array, and the Australian Large Baseline Array. Combining this data with publicly available observations, they find that the source is “radio-loud,” or bright at very long wavelengths. Typically, this kind of emission is expected to be generated by powerful jets that are ejected from the poles of a quasar. For example, the authors compare this radio-loud quasar to similar sources, which show significant variability in the X-ray part of the spectrum. This is a tell-tale sign that the X-ray emission is also generated by these jets (which might come out in fits and spurts and thus cause fluctuations in brightness over time).

However, when the authors examine X-ray data of RACS J0320−35 taken by the Chandra X-ray Observatory, they find surprising results. The quasar is extremely luminous in X-rays, making it one of the brightest in the early universe. But despite the fact that it pumps out a huge number of these energetic photons, it seems to preferentially emit only the lower-energy band of X-rays and completely lacks the highest-energy emission that characterizes similar sources. In technical terms, the X-ray spectrum of RACS J0320−35 is incredibly “soft.” Moreover, this X-ray emission seems to be constant on the timescale of months, though further observations will be required to test if it varies on longer timescales. Still, the softness of the spectrum and weak variability of this system mean that its X-ray emission is unlikely to be produced by a jet.

The authors carefully consider a particular variety of jet — one that is sharply angled towards us. Since quasar jets often travel at incredible speeds, the special theory of relativity kicks in and causes strange behaviors. In particular, an effect called relativistic beaming can cause a source to appear much brighter if traveling towards the observer at extremely high speeds. However, they find that although relativistic beaming can explain the mysterious X-ray properties of RACS J0320−35, such a scenario is incompatible with its observed radio emission. Moreover, a lack of gamma-ray emission and weak variability are further pieces of evidence against the jet origin of the X-ray emission.

Limits Are Meant to Be Broken

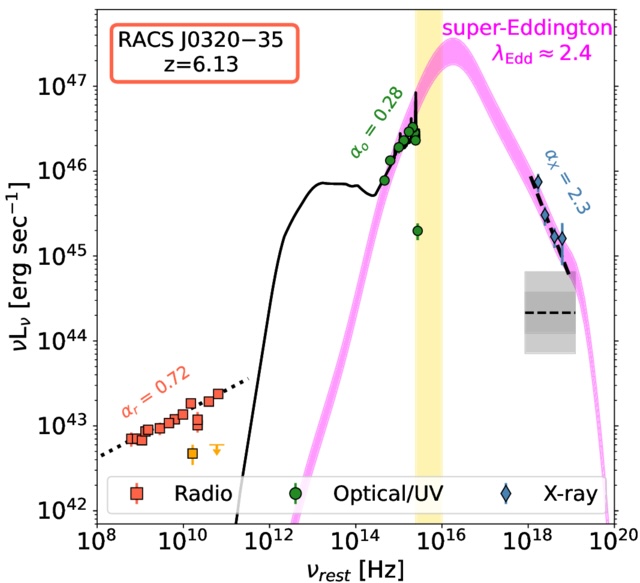
The article presents one more fascinating possibility for the origin of the X-rays in this source. Some theoretical work and simulations show that if a black hole breaks the Eddington limit and starts accreting matter at “super-Eddington rates,” the X-ray spectrum that results can be incredibly soft. The authors find excellent agreement between the observations and the predictions from a particular model that simulates a very slowly spinning black hole (see Figure 1). This scenario seems to be a promising explanation for the X-ray emission in RACS J0320−35, which is extremely exciting for several reasons.

plot comparing the observed energy spectrum of RACS J0320−35 and the theoretical spectra predicted by several models

Figure 1: A plot showing the observed energy spectrum of RACS J0320−35 and the theoretical spectra predicted by several models. In particular, the green circles (visible light and ultraviolet (UV) emission), blue diamonds (X-ray emission), and red squares (radio emission) represent the real observations. The shaded pink region represents the predictions of a model that simulates a black hole spinning very slowly and accreting at super-Eddington rates. The model seems to match the observed X-ray and visible/UV emission excellently. However, explaining the observed radio emission might require conditions that violate the assumptions behind this scenario. [Adapted from Ighina et al. 2025]

Many astronomers are considering super-Eddington accretion to explain the masses of early quasars and their fainter counterparts, called active galactic nuclei. Because supermassive black holes are supposed to have a cap on their accretion rate (the Eddington limit), the earliest black holes in the universe should only have been able to reach large sizes after sufficient time had passed. Astonishingly, observations from JWST are finding massive active galactic nuclei everywhere in the early universe, which seems to violate this — these black holes appear astonishingly massive despite existing for only a fraction of the universe’s current age. However, if early black holes could grow faster than expected by undergoing super-Eddington accretion, this tension might be resolved.

Despite the promising initial results of this model, there are a few caveats to the results presented in today’s article. For example, the radio jets observed from this source require a rapidly spinning black hole, which conflicts with the model assumptions. The authors note that a radio jet can be very far from a black hole, tracing its past activity. In fact, this jet may have actually spun down the central supermassive black hole by extracting energy from it, a fascinating possibility that will require both further observations and simulations to explore. Today’s bite shines a brilliant light on this possibility by analyzing RACS J0320−35, a fascinating quasar in the early universe and a stunning example that cosmic limits are meant to be broken.

Original astrobite edited by Veronika Dornan.

About the author, Ansh Gupta:

I’m an astronomy graduate student at the University of Texas at Austin working with Steven Finkelstein. I use data from JWST to study the formation and growth of the first galaxies and black holes in the universe. In my spare time, I enjoy playing piano, reading, and making YouTube videos.

The post The Winner of the Cosmic Speed-Eating Contest appeared first on AAS Nova.

  •  

Featured Image: Galaxy Cluster in Technicolor

galaxy cluster MACS0416

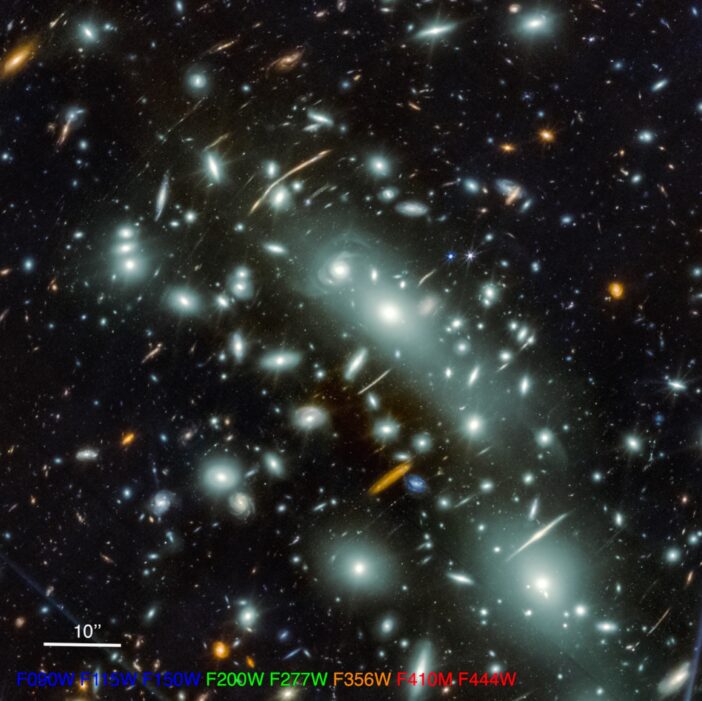
The expansive collection of galaxies pictured here is MACS J0416, a galaxy cluster located about 4.3 billion light-years away. (Click the image for the full view!) MACS J0416 is one of five clusters targeted by the Canadian NIRISS Unbiased Cluster Survey (CANUCS). This survey takes advantage of the spacetime-bending abilities of massive galaxy clusters and uses JWST’s Near-Infrared Imager and Slitless Spectrograph (NIRISS) and Near-Infrared Camera (NIRCam) to paint a detailed multi-wavelength portrait of galaxies in the early universe. Three of the CANUCS galaxy clusters, including MACS J0416, were investigated even more closely in the follow-up JWST in Technicolor program, which added precise spectroscopic redshifts and broadened the wavelength coverage of parallel fields of view. In a recent publication led by Ghassan Sarrouh (York University), the CANUCS team outlined the design of these programs and their data products, which enabled the study of roughly 53,000 galaxies within the galaxy cluster fields and an additional 44,000 galaxies in adjacent fields. To learn more about the CANUCS and JWST in Technicolor programs, be sure to check out the full research article linked below.

Citation

“CANUCS/Technicolor Data Release 1: Imaging, Photometry, Slit Spectroscopy, and Stellar Population Parameters,” Ghassan T. E. Sarrouh et al 2026 ApJS 282 3. doi:10.3847/1538-4365/ae1611

The post Featured Image: Galaxy Cluster in Technicolor appeared first on AAS Nova.

  •  

Selections from 2025: The Nine-Ringed Bullseye Galaxy

Bullseye galaxy

Editor’s Note: For the remainder of 2025, we’ll be looking at a few selections that we haven’t yet discussed on AAS Nova from among the most-downloaded articles published in AAS journals this year. The usual posting schedule will resume January 2nd.

The Bullseye: HST, Keck/KCWI, and Dragonfly Characterization of a Giant Nine-ringed Galaxy

Published February 2025

Main takeaway:

Bullseye galaxy rings

Red ellipses overplotted on the first eight rings identified with Hubble in the Bullseye galaxy. Click to enlarge. [Pasha et al 2025]

Using a combination of the Hubble Space Telescope, the Dragonfly Telephoto Array, and the Keck Cosmic Web Imager, Imad Pasha (Yale University) and collaborators discovered and performed deep follow-up observations of a giant collisional ring galaxy aptly nicknamed the “Bullseye” galaxy (LEDA 1313424). The team identified a staggering nine rings in the Bullseye with a likely tenth that has since faded — the most rings found in any collisional ring galaxy to date. The rings are a result of a small blue dwarf galaxy shooting through the Bullseye’s core about 50 million years ago, sending ripples through the galaxy.

Why it’s interesting:

Galaxy mergers and interactions are commonplace in the universe, but it is very rare for a dwarf galaxy to strike right through a large galaxy’s core. When this does happen, the collision sends shock waves through the impaled galaxy, sweeping gas and dust outward and forming rings where star formation can occur (hence the name, collisional ring galaxy). These galaxies are valuable sites to explore galactic structure and evolution as well as provide a unique case to study galaxy mergers and interactions. Previously discovered collisional ring galaxies have at most two or three rings, so when Pasha and collaborators found the stunning nine in the Bullseye, it was clear they caught something significant.

Catching the Bullseye at a lucky time in its evolution:

Why does the Bullseye have so many rings? Theoretical studies of these head-on collisions predict that many rings will form and travel outward after the initial crash; however, the rings tend to dissolve after only a few hundred million years. Catching this collision only 50 million years after it happened means we are witnessing the earlier stages of the Bullseye’s evolution. This lucky discovery not only confirms theoretical predictions for collisional ring galaxies, it also may be a clue to how another unique galaxy type, giant low-surface brightness galaxies, originate. Given the wispy ring material found at very large radii from the Bullseye, the authors suggested that collisional ring galaxies may evolve into giant low-surface brightness galaxies as they expand outward and fade. Further investigation and a larger sample of collisional ring galaxies are necessary to confirm this hypothesis, but the Bullseye provides interesting and critical observational evidence of these predictions for the first time.

Citation

Imad Pasha et al 2025 ApJL 980 L3. doi:10.3847/2041-8213/ad9f5c

The post Selections from 2025: The Nine-Ringed Bullseye Galaxy appeared first on AAS Nova.

  •  

Selections from 2025: The Formation of Massive Stars

star-forming region AFGL 5180

Editor’s Note: For the remainder of 2025, we’ll be looking at a few selections that we haven’t yet discussed on AAS Nova from among the most-downloaded articles published in AAS journals this year. The usual posting schedule will resume January 2nd.

The SOFIA Massive (SOMA) Star Formation Survey. V. Clustered Protostars

Published June 2025

Main takeaway:

A team led by Zoie Telkamp (University of Virginia) used the Stratospheric Observatory for Infrared Astronomy, SOFIA, to study massive protostars and test theories of high-mass star formation. Contrary to the predictions of some star-formation models, the team found no evidence that massive protostars require a certain surface mass density to form. Formation in a cluster environment, however, may limit the formation of the most massive protostars.

Why it’s interesting:

Massive stars are rare, short-lived, and luminous. They influence their environments across a vast range of spatial and temporal scales, from advancing the epoch of reionization in the early universe to impacting the formation of individual planetary systems in the present-day universe. The fundamental question of how high-mass stars form is still unsettled. Theories of high-mass star formation range from scaled-up versions of low-mass star formation to scenarios involving collisions between protostars.

More about this massive-star study and the potential impact of a cluster environment:

infrared images of massive protostars

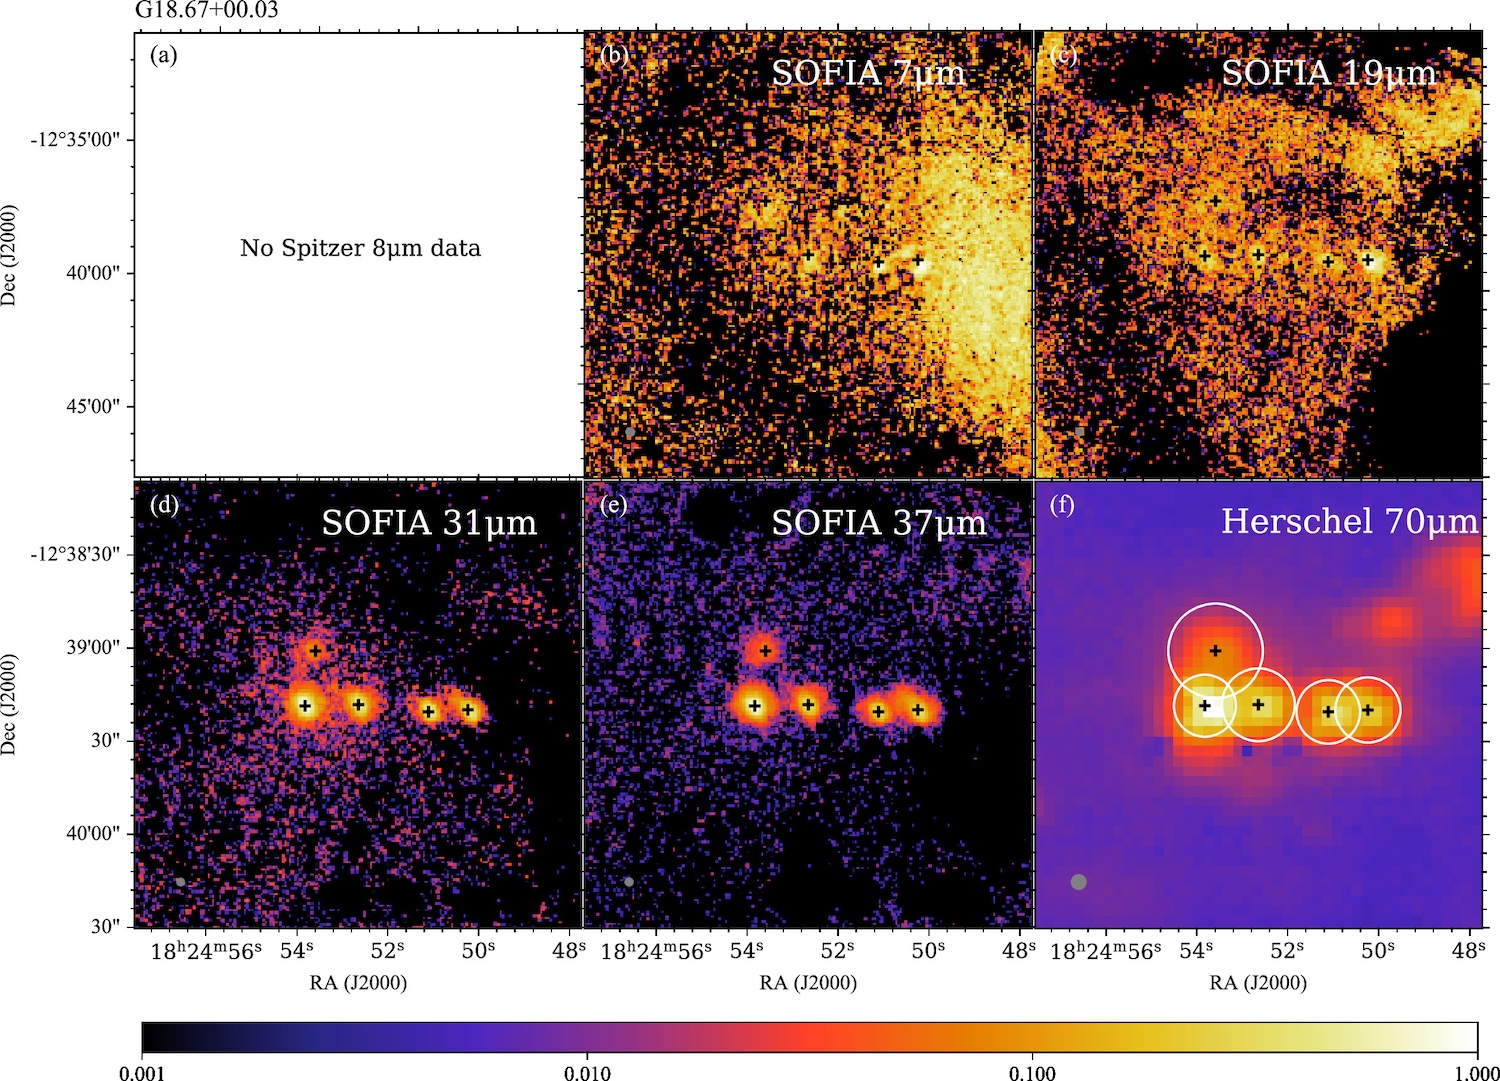
SOFIA FORCAST and Herschel Space Observatory images of protostars in the G18.67+0.03 star-forming region. Click to enlarge. [Telkamp et al. 2025]

Researchers developed the SOFIA Massive Star Formation Survey to investigate the origins of massive stars, targeting roughly 50 high-mass and intermediate-mass protostars in a wide variety of environments in our galaxy. This particular work, the fifth in a series of articles reporting the survey’s findings, described the team’s study of massive protostars forming in cluster environments. Using the Faint Object infraRed CAmera for the SOFIA Telescope (FORCAST), Telkamp and collaborators identified 34 protostars in seven star-forming regions and estimated their masses and other physical properties. The team noted a lack of protostars above 30 solar masses in these cluster regions, which might be evidence that competition for gas in dense environments can prevent the formation of more massive protostars. More work is needed to confirm this finding.

Citation

Zoie Telkamp et al 2025 ApJ 986 15. doi:10.3847/1538-4357/adcd79

The post Selections from 2025: The Formation of Massive Stars appeared first on AAS Nova.

  •  

Intergalactic Impacts of Quasars During the Epoch of Reionization

quasar artist's concept

Emitting powerful radiation into their surroundings, quasars had the ability to significantly influence their local environments. A recent study using JWST observations focuses in on one of the most powerful known quasars to determine its intergalactic impact.

Quasar Questions

Beacons of light from the very distant universe, quasars are incredibly luminous galactic cores powered by active supermassive black holes. During the first few billion years after the Big Bang, quasars pumped radiation not only into their host galaxies but also out into intergalactic space and subsequently into nearby galaxies. This radiation was strong enough to ionize any intervening material and even break up (or photodissociate) molecular hydrogen gas. With their star formation fuel evaporated, a quasar’s unsuspecting galactic neighbors were stymied from growth.

Sky map

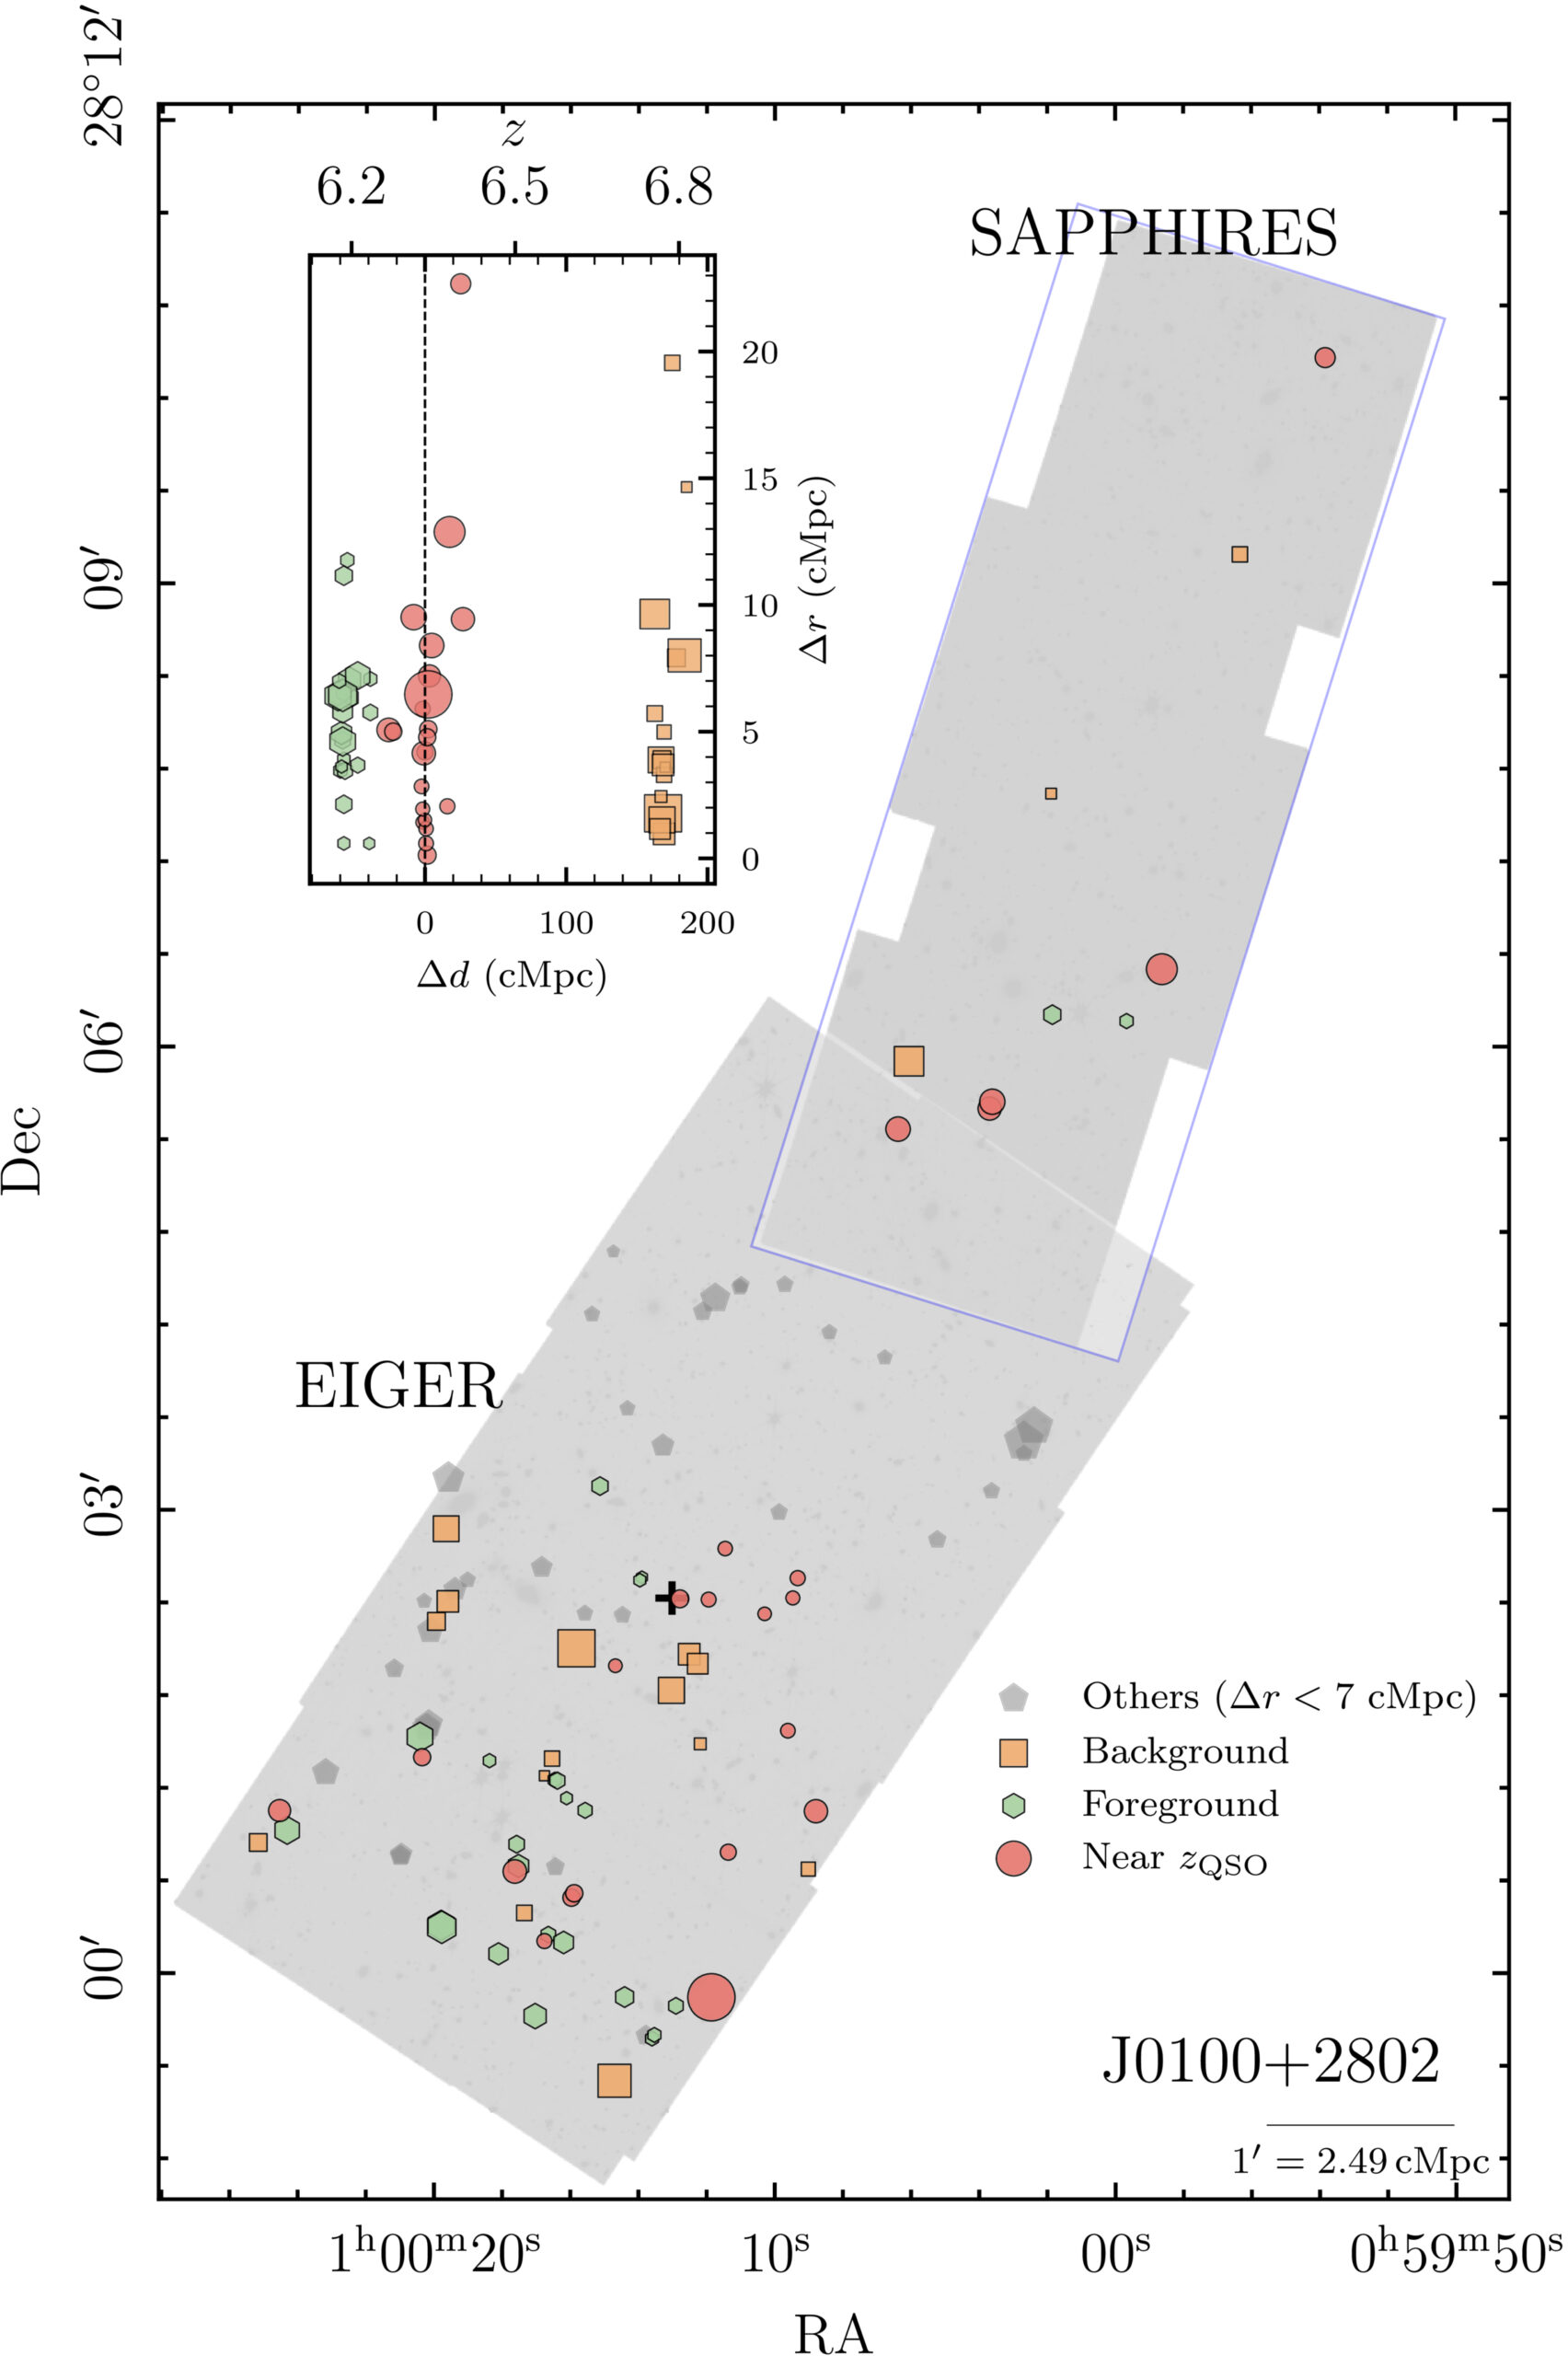
Sky map showing the location of quasar J0100+2802 (marked with black cross) and the [OIII]-emitting galaxies detected in the field. The red points are within the same redshift window as J0100+2802, and the green and orange points show foreground and background galaxies respectively. Click to enlarge. [Zhu et al 2025]

When the universe went from neutral to ionized during the epoch of reionization, quasars are thought to have occupied dense regions, tracing out the beginnings of galaxy clusters. However, studies thus far have been unable to decipher the environmental influence of quasar radiation from other mechanisms impacting the evolution of nearby galaxies. With the advent of JWST, direct measurements of rest-frame star formation tracers during the epoch of reionization are now possible, allowing astronomers to explore high-redshift quasar environments in new ways.

Searching for Suppressed Star Formation

To investigate how quasars may impact their environments, Yongda Zhu (University of Arizona) and collaborators set their gazes on J0100+2802 — the most ultraviolet-luminous quasar known at redshift z > 6. This powerful quasar lies in an overdensity, surrounded by galaxies filled with hot, young stars, making it an ideal candidate to test the impacts of luminous quasars on their neighbors. The authors used spectroscopy and photometry obtained from JWST to explore the space around J0100+2802.

Searching within the expected reach of the quasar’s radiation field, the authors identified galaxies with doubly ionized oxygen emission ([OIII] λ5008), which traces a galaxy’s recent star formation activity. After carefully separating background and foreground galaxies from galaxies at the same redshift as J0100+2802, the authors measured the total [OIII] emission and compared it to the overall ultraviolet stellar emission. From their sample, galaxies closer to J0100+2802 tend to exhibit lower [OIII]/UV ratios than those farther away, indicating that the powerful quasar may be suppressing star formation activity in nearby galaxies. 

[OIII]/UV versus distance from quasar

[OIII]/UV ratio versus distance from quasar J0100+2802. There is a clear positive correlation indicating that closer to the powerful quasar, [OIII] emission declines. The dashed line shows the expected radiation field of J0100+2802. Click to enlarge. [Modified from Zhu et al 2025]

Confirming the Culprit

To verify that the quasar is truly responsible for this declining trend, other environmental factors and intrinsic galaxy properties must be ruled out. Could the galaxies nearby J0100+2802 just happen to have elevated ultraviolet stellar continuum? Or could the overdense environment itself drive this trend? The authors performed additional analysis to control for these variables and found no strong global factors that could explain the decline in [OIII] emission — radiation from the quasar is likely the driver.

To further bolster their results and determine whether this behavior is more widespread, the authors investigated the environments around three other quasars at the same redshift as J0100+2802. Though these quasars are not as powerful as J0100+2802, a similar trend is uncovered for galaxies within the radiation field of these quasars. From this study, radiative feedback from quasars appears to disrupt the star formation activity in nearby galaxies, suppressing their growth and changing the way early galaxy formation progresses. 

Further wide-field studies are necessary to understand the full extent to which reionization-era quasars can impact their environments, but this study provides a clear path forward with JWST.

Citation

“Quasar Radiative Feedback May Suppress Growth on Intergalactic Scales at z = 6.3,” Yongda Zhu et al 2025 ApJL 995 L5. doi:10.3847/2041-8213/ae1f8e

The post Intergalactic Impacts of Quasars During the Epoch of Reionization appeared first on AAS Nova.

  •  

Boosting the Gravitational Wave Background

Simulation of a supermassive black hole binary

The gravitational wave background — the constant, low-frequency hum of colliding supermassive black holes across the universe — seems to have a larger amplitude than expected. Can preferential accretion explain why?

Larger than Expected

Arp 122

The peculiar galaxy Arp 122, shown here in a Hubble Space Telescope image, is in the process of merging. When two galaxies merge, the supermassive black holes at their centers eventually merge as well. [ESA/Hubble & NASA, J. Dalcanton, Dark Energy Survey/DOE/FNAL/DECam/CTIO/NOIRLab/NSF/AURA; Acknowledgement: L. Shatz; CC BY 4.0]

In 2023, researchers announced the discovery of compelling evidence for the gravitational wave background: a low-frequency, low-amplitude signal that is likely due to supermassive black hole binaries across the universe steadily trundling toward mergers. The amplitude of the background, however, is larger than expected for a population of merging supermassive black holes.

Though some researchers have invoked new physics to explain this discrepancy, all that may be required is an adjustment to our understanding of the supermassive black hole binary population in our universe. In a recent research article, Julia Comerford (University of Colorado Boulder) and Joseph Simon (University of Colorado Boulder; Oregon State University) tackled one of the underlying assumptions about the masses of merging supermassive black holes.

Preferential Accretion Pathway

When supermassive black holes merge, the strength of the gravitational wave signal depends on how similar the black holes were in mass; merging equal-mass black holes produce stronger signals than mismatched black holes do. What if, Comerford and Simon proposed, the masses of merging supermassive black holes scattered across the universe are more similar than previously thought?

initial and final black hole mass ratios

The initial and final black hole mass ratio, q. The blue and orange lines show a 10% and 20% increase in the total mass of the binary, respectively. The dotted line divides major mergers (q ≥ 0.25) and minor mergers. [Comerford & Simon 2025]

Observations and simulations of supermassive black holes within colliding galaxies appear to support this hypothesis. Rather than staying the same mass as they approach one another, as models tend to assume, supermassive black holes likely gather material from their surroundings and gain mass.

What’s more, it appears that the smaller of the two black holes tends to pack on more mass, meaning that the masses of the black holes grow more similar as they wind toward a merger. (This somewhat counterintuitive result arises because the smaller of the two black holes encounters more gas as it spirals inward.)

Boosting the Signal

If accretion tends to even out the masses of the binary members, is the resulting increase in signal strength large enough to explain the observed amplitude of the gravitational wave background?

plot of estimated gravitational wave amplitude

Probability distribution functions for the calculated gravitational wave background amplitude for different accretion conditions. The brown diamond shows the median amplitude from the NANOGrav data set. [Adapted from Comerford & Simon 2025]

Comerford and Simon modeled the gravitational wave background from supermassive black hole binaries undergoing preferential accretion onto the smaller black hole. Benchmarking their model with observations wherever possible, they found that just a 10% increase in the total mass of the merging black holes can raise the gravitational wave background to the median observed value — easing the discrepancy without the need for speculative new physics.

The signal-boosting effect from preferential accretion may be especially important if the binary evolution timescale — the time it takes for black holes approaching a merger to reach a separation at which their gravitational waves become accessible to pulsar timing arrays — is longer than the estimated 1.8 billion years. At longer timescales, models without this accretion become entirely inconsistent with observations. Future research that examines the masses and accretion rates of supermassive black holes as they approach make their way toward a merger can provide further clues to the role of preferential accretion.

Citation

“Preferential Accretion onto the Secondary Black Hole Strengthens Gravitational-Wave Signals,” Julia M. Comerford and Joseph Simon 2025 ApJ 994 168. doi:10.3847/1538-4357/ae1133

The post Boosting the Gravitational Wave Background appeared first on AAS Nova.

  •  
❌