❌

Reading view

Featured Image: Massive Young Star Clusters, Revealed

The Antennae galaxies are a nearby pair of interacting galaxies, shown in optical light from the Hubble Space Telescope (left) and in infrared light from JWST (right) in the image above. Between the two galaxies’ bright nuclei, there is a vast and dusty molecular cloud complex that harbors a large number of massive young star clusters — and in a recent article led by Rupali Chandar (University of Toledo), researchers have worked to pin down exactly how many clusters are embedded within the dusty whorls of the Antennae galaxies. The team used JWST to search for emission from star clusters too thickly blanketed with dust to be visible in previous observations by Hubble. They ultimately identified 45 sources, 40 of which were seen for the first time in this study. These star clusters mostly inhabit the overlap region between the two galaxies, are less than 2.5 million years old, and each contain roughly 104–106 solar masses. To learn more about how JWST’s infrared capabilities unveiled young star clusters in these interacting galaxies, be sure to check out the full article linked below.

Citation

“Nowhere Left to Hide: Uncovering All of the Massive Young Embedded Star Clusters in the Antennae with JWST,” Rupali Chandar et al 2026 ApJ 1002 64. doi:10.3847/1538-4357/ae56e8

The post Featured Image: Massive Young Star Clusters, Revealed appeared first on AAS Nova.

  •  

Astronomers Hate Them! This Star Formation Ingredient Makes Clusters Look 300 Million Years Older

NGC 3603

Editor’s Note: Astrobites is a graduate-student-run organization that digests astrophysical literature for undergraduate students. As part of the partnership between the AAS and astrobites, we occasionally repost astrobites content here at AAS Nova. We hope you enjoy this post from astrobites; the original can be viewed at astrobites.org.

Title: Characterizing The Star Cluster Populations in Stephan’s Quintet Using HST and JWST Observations
Authors: P. Aromal et al.
First Author’s Institution: University of Western Ontario
Status: Published in ApJ

On 12 July 2022, the first images taken with JWST were released to the public. All of the astronomers in my department gathered together to watch the images be revealed in real time. It was exciting for everyone, from graduate students getting to see a glimpse into the future possibilities of their fields, to retired professors getting to see the fruits of their decades-long labor in advocating for the telescope to be built.

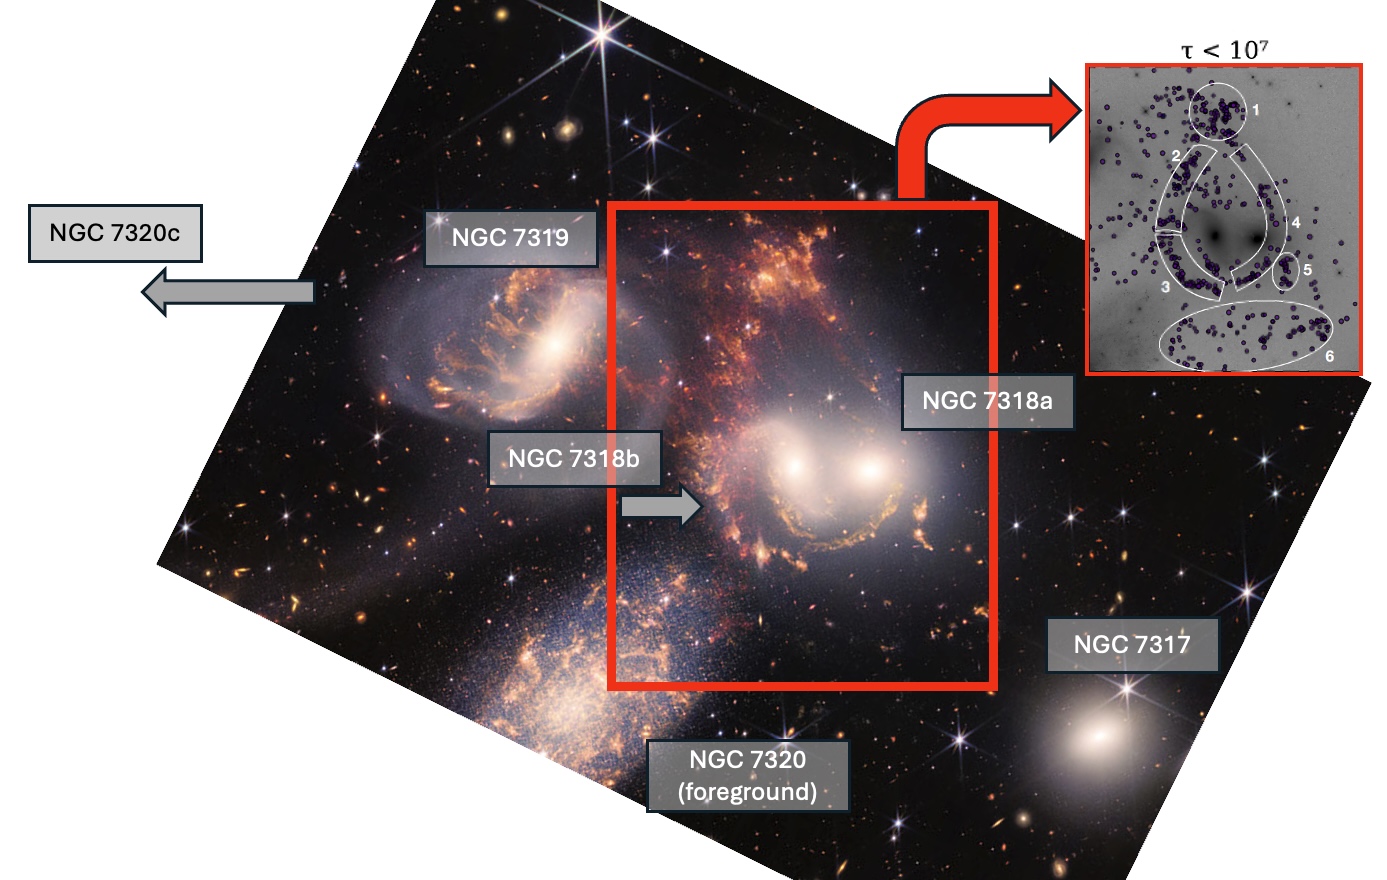
One image that was showcased was of Stephan’s Quintet (Figure 1), an actively interacting galaxy group. We were all immediately impressed by the clarity of the star-forming regions in the dense gas between the galaxies in the image. Now, more than three years later, the authors of today’s article lay out a comprehensive study of the star clusters in those same regions, taking advantage of JWST’s multi-wavelength imaging capabilities.

Stephan's Quintet

Figure 1: The JWST imaging of Stephan’s Quintet with member galaxies labeled (including NGC 7320C, which is outside of the field of view). Gray arrows indicate the direction the associated galaxy is moving. The inlaid image shows the distribution of young star clusters in relation to the six main tidal features in the group. [Inset image: Adapted from Aromal et al. 2025; Background image: NASA, ESA, CSA, STScI]

HST + JWST = OMG!

While JWST’s depth and resolution are exciting for those studying high-redshift galaxies, for local-universe astronomers JWST really shines when used in combination with the Hubble Space Telescope (HST). The star clusters in Stephan’s Quintet were already cataloged in 2015 using HST, but the filters used in the imaging only captured optical and very-near-infrared wavelengths. If you want to get enough data to be able to accurately estimate the ages of these star clusters, especially accounting for reddening caused by surrounding dust, you need to push your imaging further into the infrared.

Unlike HST, JWST can take images in two wavelength filters at once, meaning you can get more data with roughly the same observing time. Here the authors imaged the same star clusters that HST looked at with five new JWST filters, all at longer infrared wavelengths than HST. Together, the authors had flux measurements at 10 different wavelengths across the optical and infrared spectrum for each star cluster, meaning they could perform spectral energy distribution fitting.

Go Ahead, Guess My Age

The best way to estimate an unresolved star cluster’s age is to get its full spectrum of light and fit spectroscopic models with varying ages to it until the model matches the observations. But, if you have individual brightness measurements at many different, spread-out wavelengths, you can still fit spectral models to the measurements and make a best guess despite the gaps in your full spectrum. Here the authors compare their multi-wavelength data to Code Investigating GALaxy Emission (CIGALE) spectral energy distribution models, allowing both the cluster ages and amount of dust extinction to vary.

This is where the long-wavelength JWST imaging is most necessary, because it is sometimes difficult to determine a cluster’s age with this method. For instance, is the light a cluster is giving off mostly red because its stars are very old, or is it because its stars are actually bluer and younger and the cluster just appears red due to foreground dust?

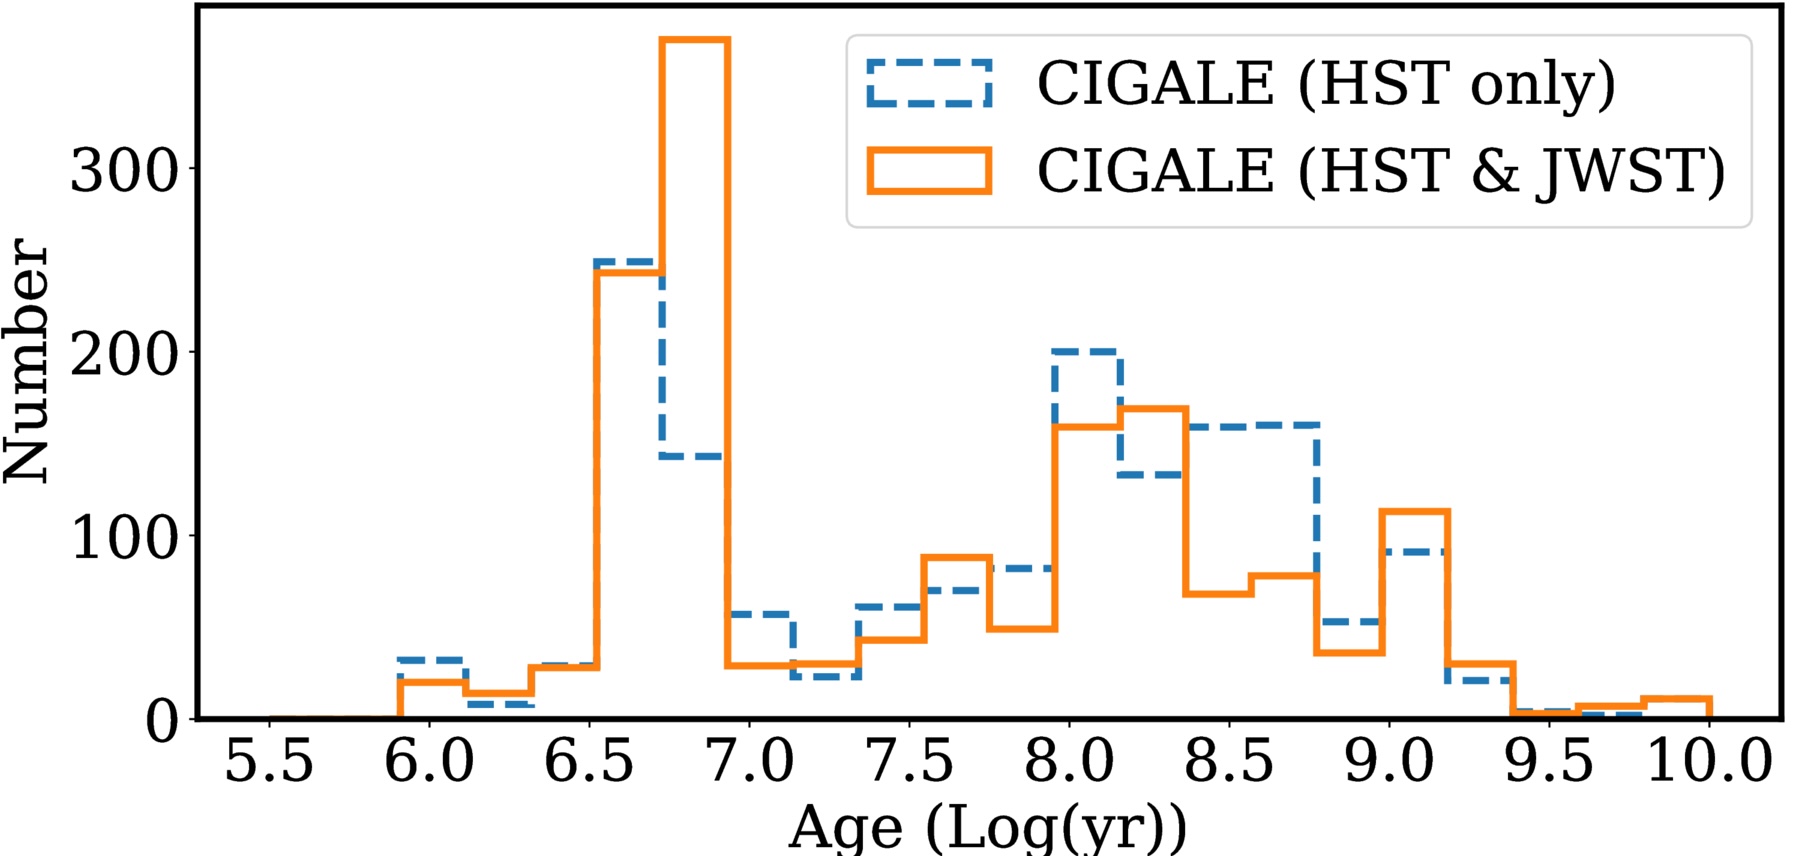
Infrared imaging can “see through” any dust and break this age–extinction degeneracy. For most of the clusters, the authors found that the original HST-only age estimates were accurate, but for 121 clusters in the sample (about 8% of the total), the JWST imaging made a significant change in the age estimates, shifting them to younger ages.

Where Do the Hip, Young Star Clusters Hang Out?

Once the authors had their updated ages for the clusters, they then mapped out where the clusters were located in Stephan’s Quintet and how these clusters traced the known tidal structures in the group. Tidal structures are structures, usually consisting of gas, dust, and stars, that are formed from the tidal forces galaxies exert on one another as they interact and merge. The authors found that throughout all tidal regions of Stephan’s Quintet, there were many young, low-mass star clusters, all about 3–5 million years old. This timescale lines up with previous studies’ estimates of when NGC 7318B was thought to first fall into Stephan’s Quintet, compressing the gas in the group and creating tidal shocks that would trigger star formation.

Additionally, the authors’ star cluster age distribution for the group (see Figure 2) has a second, broader peak of higher-mass clusters with ages around 200 million years. This would correspond to when the most recent encounter between NGC 7320C (which has now passed through the group and is out of frame in Figure 1) and NGC 7319 is estimated to have occurred.

histogram of the ages of all the star clusters in Stephan's Quintet

Figure 2: A histogram of the ages of all the star clusters in Stephan’s Quintet. The blue dashed line shows the estimates using only the HST data, and the orange solid line shows the estimates using both HST and JWST together. Notice how a lot of the clusters around 108 years old turned out to be less than 107 years old. [Adapted from Aromal et al. 2025]

Going even older, they found that the star clusters in the group that are more than 1 billion years old are also the most massive, and they are predominantly concentrated around NGC 7318A. This is the most massive elliptical galaxy in the group, and it’s the most likely to have a rich, old star cluster population, formed prior to any tidal interactions.

Taken together, the updated age measurements of the star clusters in Stephan’s Quintet provide not only a study of star formation history, but also of the galaxy–galaxy interaction history in the system!

Looking Ahead

While the authors have improved the age estimates of the clusters in Stephan’s Quintet, there are still limitations to their analysis. Their estimated star formation rate for the group is much lower than that estimated with other tracers, such as H-alpha emission, meaning this study may still be missing a fraction of very young star clusters. The most likely culprits are embedded clusters that haven’t had enough time to expel the surrounding gas from the massive clouds they formed within.

Future work will attempt to identify these embedded clusters using near-infrared JWST imaging, since in this study the authors focused only on the previously HST-identified clusters. In addition, combining their JWST data with high-resolution radio observations taken with the Atacama Large Millimeter/submillimeter Array will allow them to study the gas in the group more closely and understand how it influences the star formation.

This work highlights JWST’s excellent application to star cluster observations, building on the data we already have from decades of HST use, and it looks like we’re only just getting started!

Original astrobite edited by Skylar Grayson.

About the author, Veronika Dornan:

Veronika is a postdoctoral research associate at the University of Edinburgh. Her research is in observations of globular star clusters and how they can be used to study the evolution of their host galaxies.

The post Astronomers Hate Them! This Star Formation Ingredient Makes Clusters Look 300 Million Years Older appeared first on AAS Nova.

  •  

Ursa Major III/UNIONS 1: Dwarf Galaxy or Star Cluster?

Ursa Major III/UNIONS 1

The smallest satellite of the Milky Way, Ursa Major III/UNIONS 1, has posed a mystery since its discovery. Is this smattering of stars a dwarf galaxy or a star cluster?

The Milky Way’s Mysterious Companion

In 2024, researchers discovered a small group of stars orbiting the Milky Way at a distance of about 33,000 light-years in data from the Ultraviolet Near Infrared Optical Northern Survey (UNIONS). This collection of stars amounts to just 16 solar masses and shines with only 11 times the Sun’s luminosity, making it 4–5 times less massive than the next faintest Milky Way satellite.

Considering its small stellar population and small size (its half-light radius is 10 light-years, which is typical for a globular cluster), this satellite appeared at first glance to be an ordinary star cluster. But early data also suggested that the stars had an unusually high velocity dispersion, which could mean that they are nestled within a dense and massive dark matter halo — making the satellite not a star cluster but a dwarf galaxy.

Reflecting this uncertainty, the satellite has two names: Ursa Major III (its dwarf galaxy designation) and UNIONS 1 (its star cluster classification). Can new data clear up the confusion?

New Dispersion Data

In a recent research article, William Cerny (Yale University) and collaborators described new observations of 16 stars in Ursa Major III/UNIONS 1 with the Keck II telescope.

plots of velocity dispersion

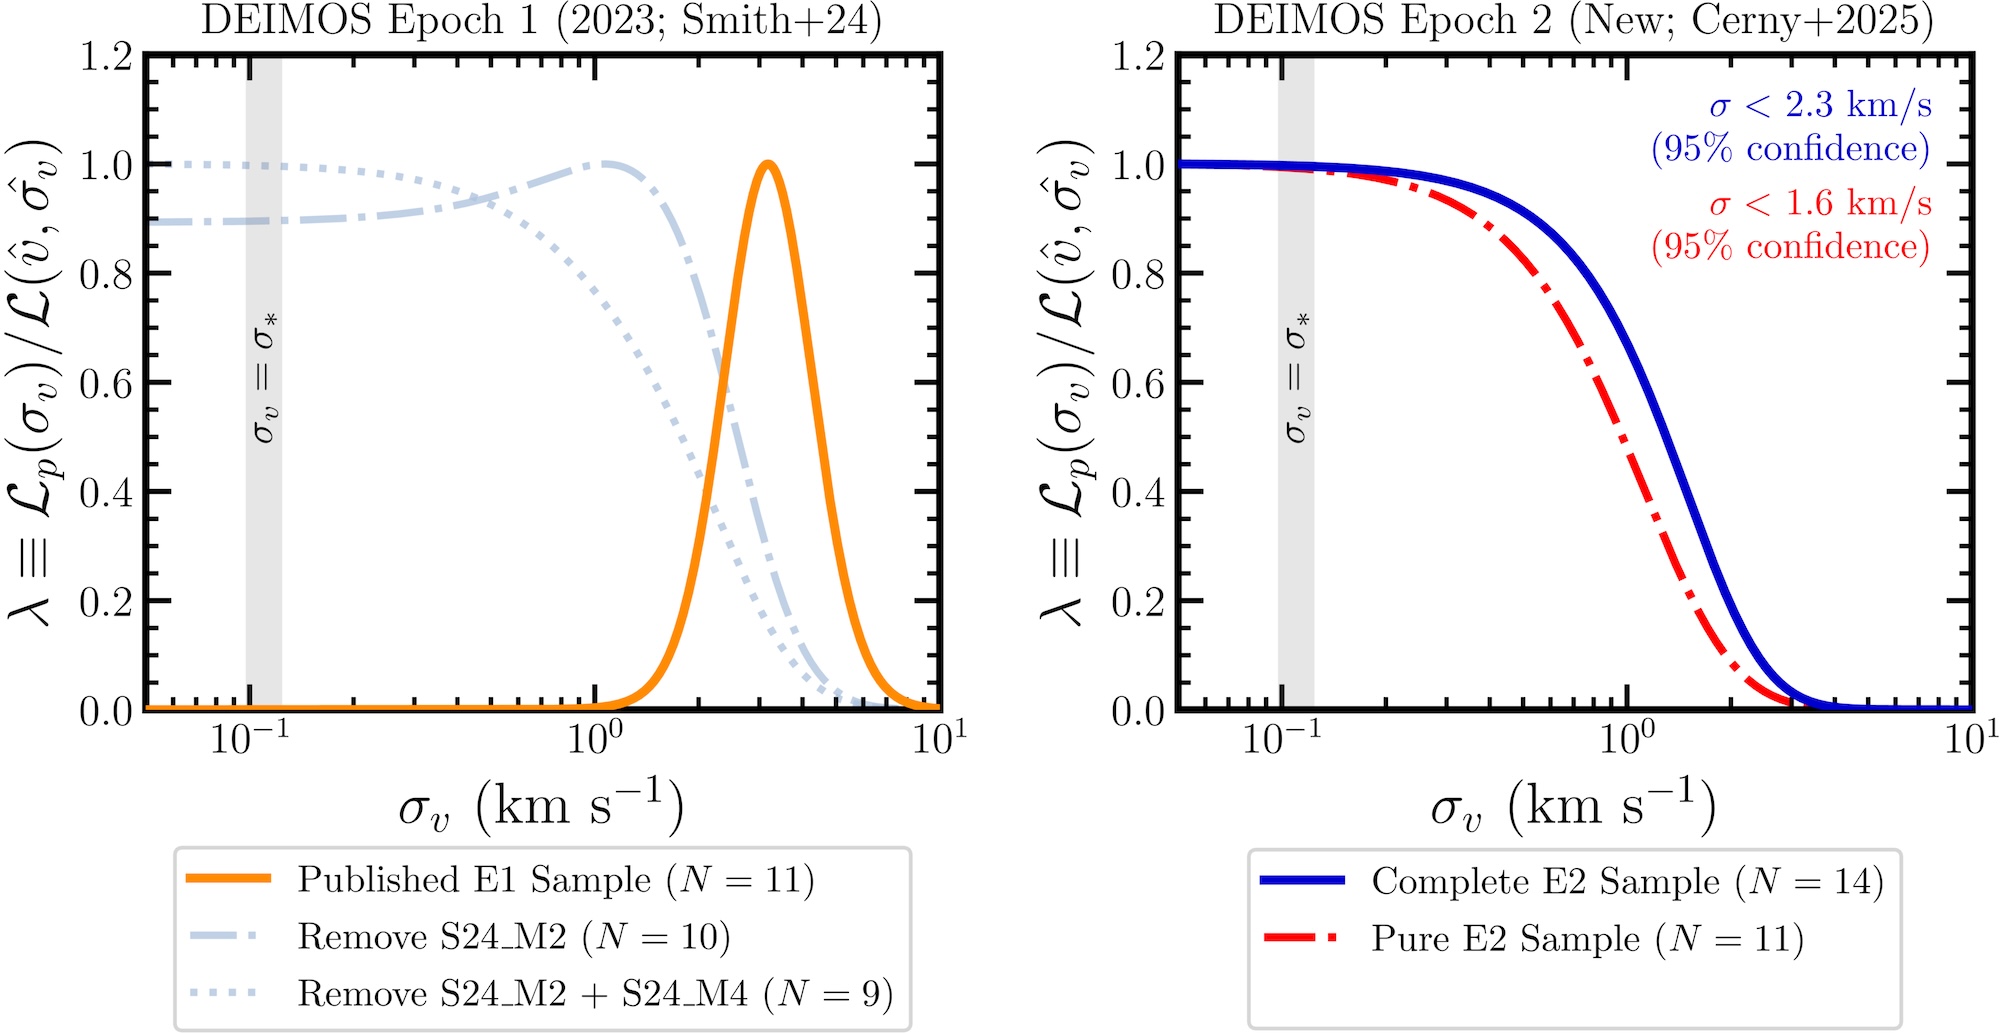
Normalized likelihoods for the velocity dispersion based on the initial data (left) and the new data (right). The initial velocity dispersion measurement of 3.7 km/s is ruled out by the new measurements. Click to enlarge. [Cerny et al. 2026]

Crucially, these measurements enabled a new estimation of the system’s velocity dispersion. In contrast to earlier work that found a high velocity dispersion of 3.7 km/s, the new data favor a value of just 0.1 km/s and rule out values above 2.3 km/s. While these results do not unequivocally preclude the possibility of dark matter, they strongly favor little to no dark matter. This goes against the initial evidence in favor of the dwarf galaxy hypothesis.

These observations also helped to confirm one candidate binary pair and identify three new binary candidates. (This large binary fraction, though interesting, isn’t diagnostic, as both star clusters and dwarf galaxies are known to host high proportions of binary stars.)

Further Evidence

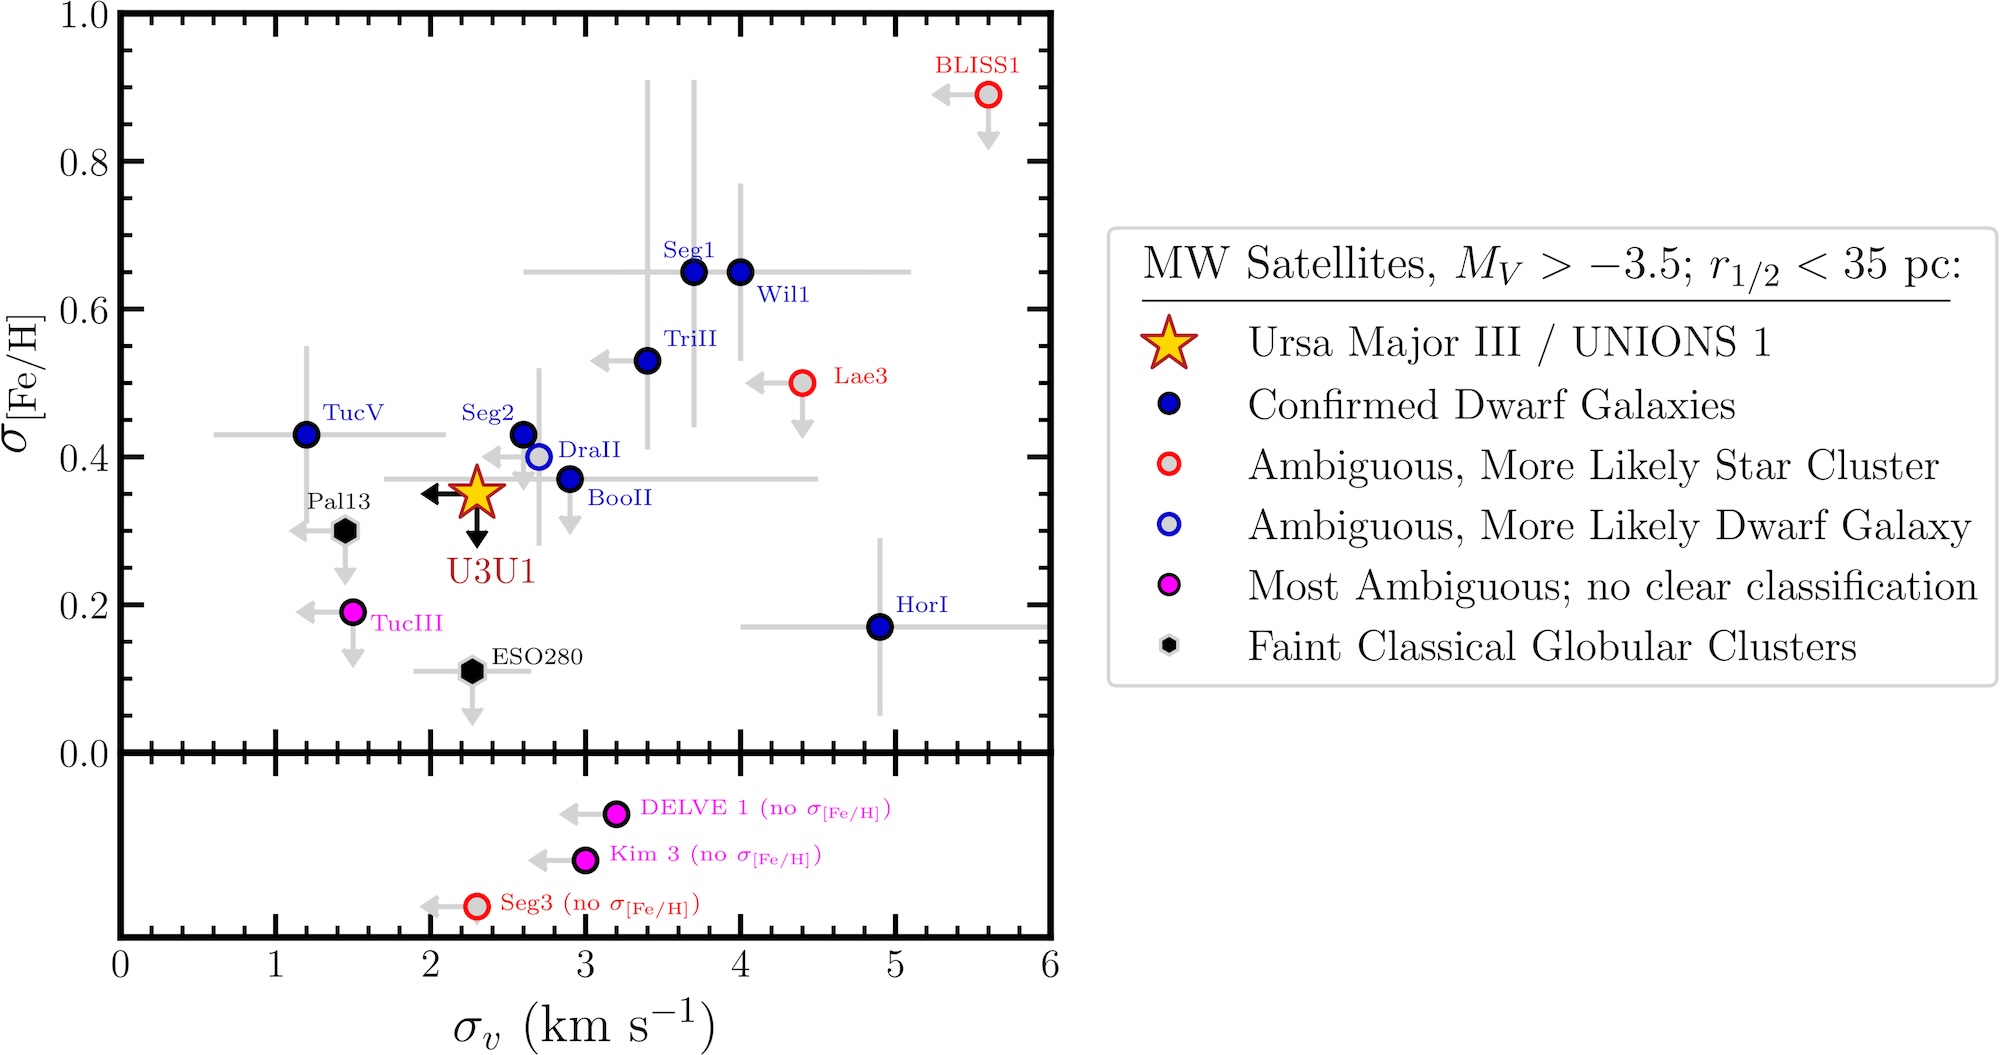
Cerny’s team conducted a further test of the Ursa Major III/UNIONS 1’s identity by measuring the metallicities of its 12 brightest stars. They found that the stars are metal poor and have little metallicity dispersion. This finding again points to a star cluster, in which stars form in a single epoch, rather than a dwarf galaxy, which may feature multiple generations of stars with different degrees of chemical enrichment.

metallicity dispersion vs velocity dispersion for faint Milky Way satellites

Upper limits on velocity dispersion and metallicity dispersion for Ursa Major III/UNIONS 1 compared to other faint Milky Way satellites. There are no confirmed dwarf galaxies for which the metallicity dispersion and velocity dispersion are both lower than for Ursa Major III/UNIONS 1. Click to enlarge. [Cerny et al. 2026]

Based on the newly collected evidence, Cerny and collaborators concluded that Ursa Major III/UNIONS 1 is likely a star cluster, though the possibility that it’s instead a dwarf galaxy could not be ruled out. If the star cluster classification holds, Ursa Major III/UNIONS 1 would be the least luminous metal-poor star cluster known. This classification may also imply the presence of a large number of compact objects — white dwarfs, neutron stars, or black holes — to keep the cluster intact, filling the role that dark matter would have played.

Going forward, further chemical abundance measurements of Ursa Major III/UNIONS 1 may still sway the argument one way or another. And as facilities like the Vera C. Rubin Observatory and the Euclid space telescope continue to collect data, other extreme Milky Way satellites may come to light.

Citation

“No Observational Evidence for Dark Matter Nor a Large Metallicity Spread in the Extreme Milky Way Satellite Ursa Major III/UNIONS 1,” William Cerny et al 2026 ApJL 999 L8. doi:10.3847/2041-8213/ae29b8

The post Ursa Major III/UNIONS 1: Dwarf Galaxy or Star Cluster? appeared first on AAS Nova.

  •  

The Sun Left Home in a Hurry

A photograph of a dense knot of stars against a collection of more spread-out stars.

By simulating how the orbits of distant solar system objects were altered by close encounters with other stars early in the Sun’s life, astronomers have placed tight constraints on how long our home star stuck around its siblings after birth.

Born in Batches

Though our Sun currently travels on a solitary trajectory through the galaxy, its earliest childhood was not spent so lonely. Instead, the Sun was likely born as part of a litter of many other stars all collapsing out of the same cloud of precursor gas and dust. As a consequence, its early adolescence was spent in the company of dozens of other young stars, all zipping along on their own paths, destined to drift apart but initially packed close together.

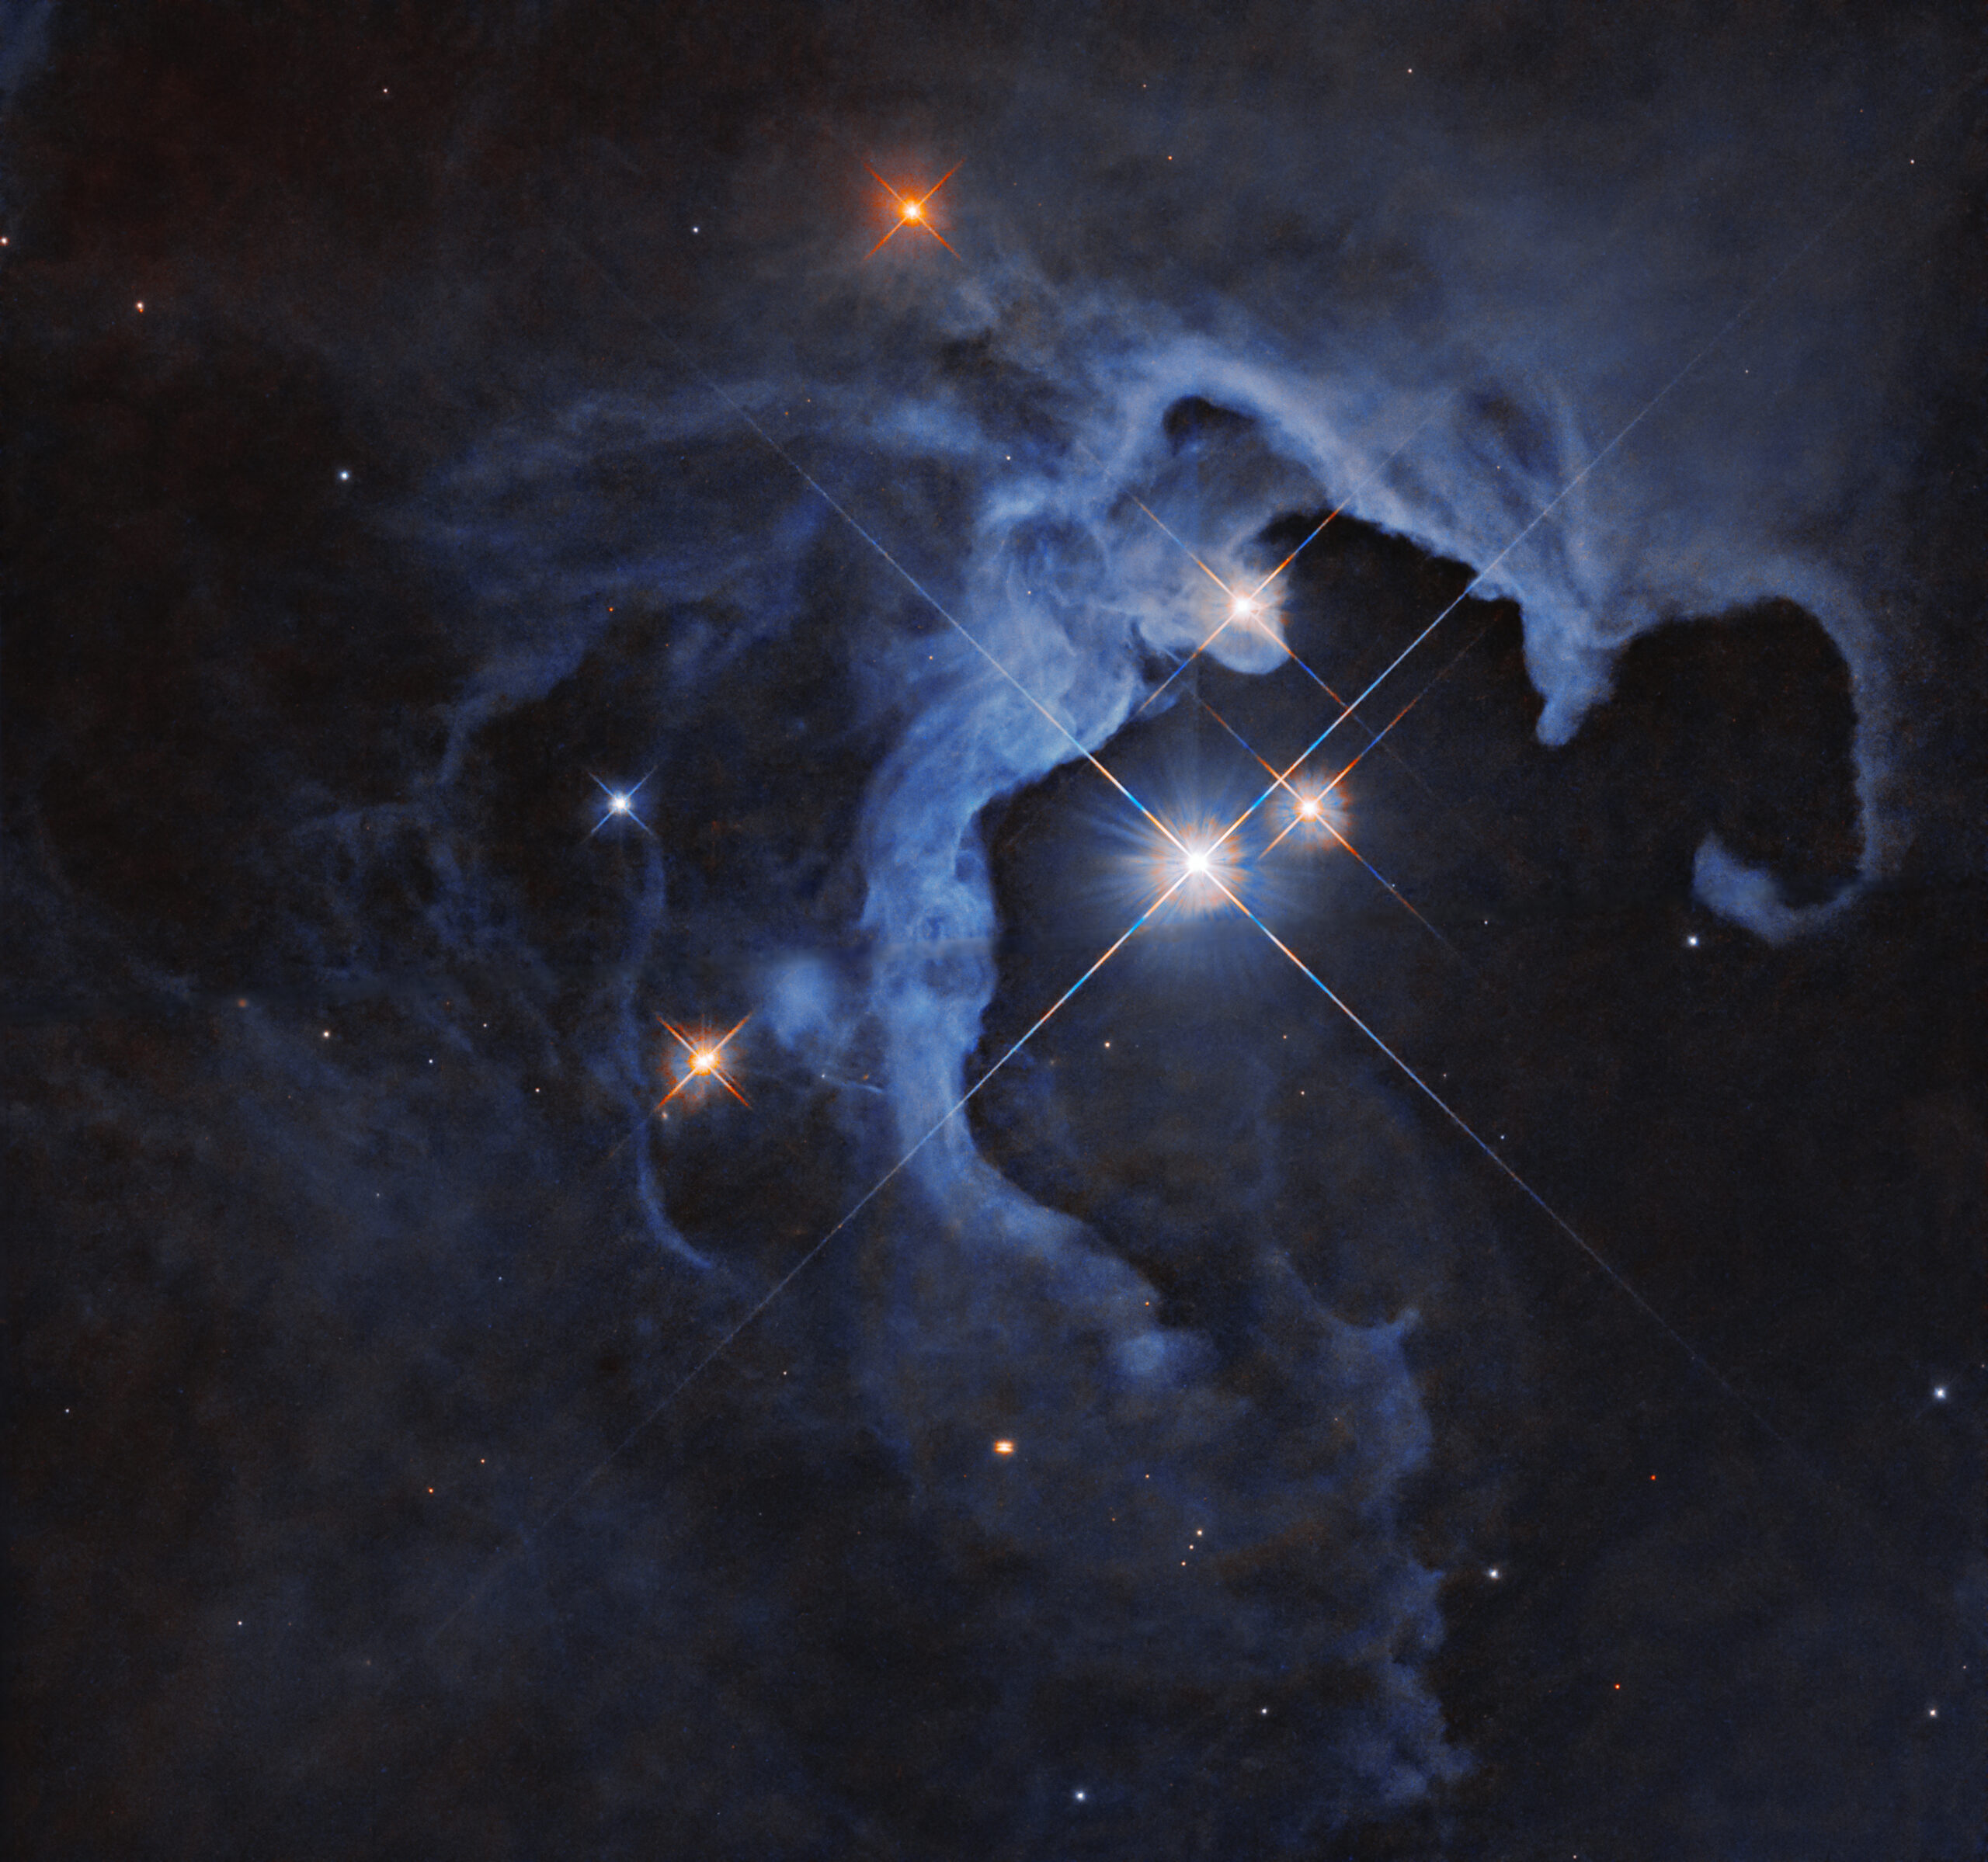
A photograph of three bright stars within a circular cavity of gas.

The Hubble Space Telescope’s view of a collection of young stars still embedded within their natal nebula. [NASA, ESA, G. Duchene (Universite de Grenoble I); Image Processing: Gladys Kober (NASA/Catholic University of America)]

Despite their kinship, these young stars were not kind to one another when they passed nearby. When two stars grow close, the intense gravity of the encounter can severely disrupt their proto-planetary systems, scattering the objects orbiting farthest from their stars and potentially even ejecting some objects altogether. These early years likely left scars on the edges of our solar system that persist even today, billions of years after the early tussles.

Recent research led by Amir Siraj, Princeton University, leverages these scars or their apparent absence to ask the question: given the structure we observe in the outer solar system today, what limits can we place on the number of stars born near the Sun and the amount of time the Sun spent in its birth cluster?

Distance is Power

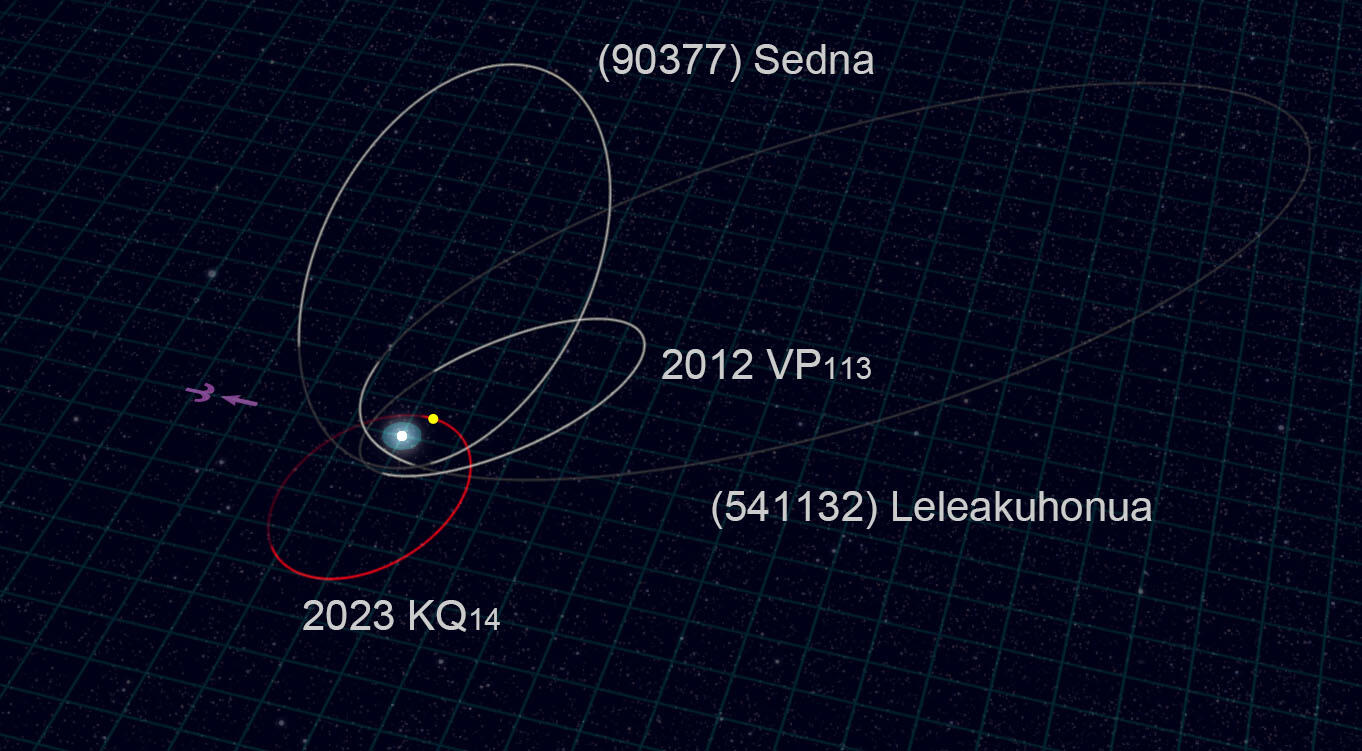
Several authors have asked this question over the past several decades, but Siraj and collaborators added a new twist: instead of studying either the giant planets or the cold classical Kuiper Belt, they instead focused exclusively on the “distant sednoids.” This rarefied collection of only nine known objects includes only the most distant minor planets in our solar system: the sednoids never come within 40 au of the Sun, and they spend much of their orbits beyond 400 au. Interestingly, however, all of them orbit on planes that are fairly aligned with that of the planets, and none ever strays farther than 20° from the ecliptic.

A black background with the sun at center surrounded by several large ovals, each labeled with the name of a minor planet.

An illustration of the orbits for some of the distant sednoids considered in this study. Click to enlarge. [NAOJ]

Through a suite of numerical simulations, Siraj and collaborators demonstrate that this relatively tight distribution of inclinations implies that the Sun couldn’t have been too roughed up on its way out of the cluster. By simulating many different close flybys and their influence on the distant sednoids, the researchers constrained the product of the number of stars in the Sun’s birth cluster and the time the Sun spent there to be less than or equal to 5 billion years per cubic parsec. Assuming a typical cluster density of 100 stars per cubic parsec, this suggests that the Sun cleared out of the densest and most dangerous part of the cluster within just 50 million years.

The authors stress that this conclusion leans on the assumption that the distant sednoids arrived on their extreme orbits essentially immediately, though in fact astronomers aren’t sure exactly how and when these objects ended up on the outskirts of the solar system. If the sednoids were in fact implanted onto their orbits early on, this limit on how long it took the Sun to leave its siblings is by far the strongest to date. With the Vera C. Rubin Observatory poised to discover thousands of new distant solar system objects, it’s likely that the bound will grow even more stringent in the next few years.

Citation

“Limits on Stellar Flybys in the Solar Birth Cluster,” Amir Siraj et al 2025 ApJL 993 L4. doi:10.3847/2041-8213/ae1025

The post The Sun Left Home in a Hurry appeared first on AAS Nova.

  •  

Examining Earendel: Is the Most Distant Lensed Star Actually a Cluster?

JWST images of Earendel

What’s the nature of the distant source Earendel, which appears as a point of light in a dramatically gravitationally lensed galaxy?

Record-Breaking Discovery

Hubble image of the Sunrise Arc and Earendel

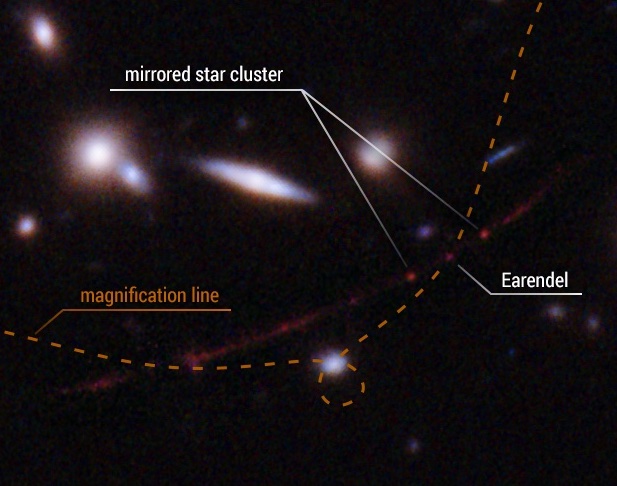
Hubble image zooming in on the Sunrise Arc and Earendel. The two images of the mirrored star cluster are called 1a and 1b. [NASA, ESA, Brian Welch (JHU), Dan Coe (STScI); Image Processing: Alyssa Pagan (STScI)]

In 2022, astronomers using the Hubble Space Telescope reported the discovery of the most distant single star candidate ever seen, now pinpointed to have a redshift of z = 5.926. The star, named Earendel, is an incredible beacon from the first billion years of the universe, standing out brilliantly from the red smear of its host galaxy, the Sunrise Arc.

But there’s a catch — at the distances involved, distinguishing between one star and many isn’t easy, and Earendel might not actually be just one star. New research uses stellar population modeling to explore the possibility that what has been touted as a single star is really a cluster.

The Light of Earendel, Our Most Beloved Star… Cluster?

The question sounds simple: does the light from Earendel resemble that of one star, or does it more closely align with the emission from a collection of many stars? What complicates matters is that Earendel’s light has been warped and magnified by an intervening galaxy cluster in a process called gravitational lensing. Because the degree of magnification isn’t known precisely, it’s not clear exactly how large the source is — leaving wiggle room for Earendel to be one or many stars.

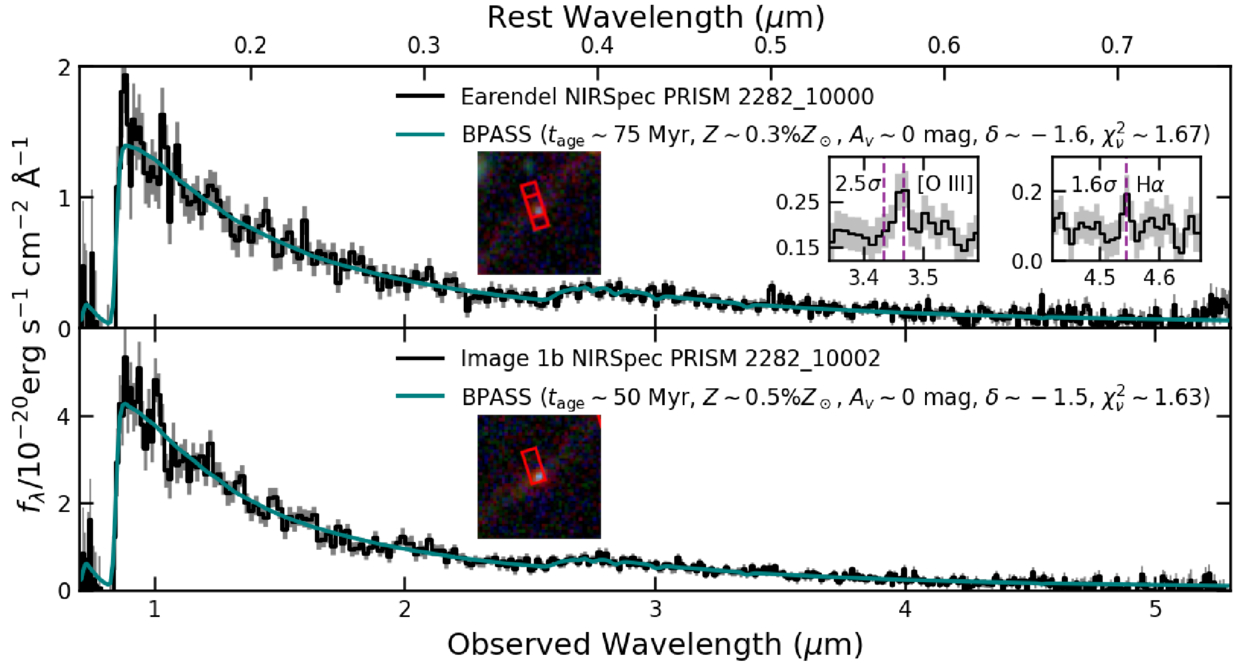
JWST spectra of Earendel and 1b

JWST spectra of Earendel (top) and 1b (bottom), along with the best-fitting models. Click to enlarge. [Pascale et al. 2025]

To investigate Earendel’s identity, Massimo Pascale (University of California, Berkeley) and collaborators fit a simple stellar population model to JWST Near-Infrared Spectrograph (NIRSpec) spectra of both Earendel and another source in the Sunrise Arc called 1b, which is widely accepted to be a star cluster. The model varied the age of the cluster, its metallicity, the amount of dust it contains, and other factors. To make the modeling more rigorous, the team also used three different stellar population model libraries.

Both Earendel and 1b were well fit by all three stellar population models, supporting the hypothesis that Earendel is a cluster. Earendel and 1b share certain similarities, such as metallicity (less than 10% of the Sun’s), stellar surface density (high, rivaling the maximum density seen in the local universe), and age (more than 30 million years old).

Cluster Comparison

age and metallicity of star clusters in the nearby universe and at high redshifts

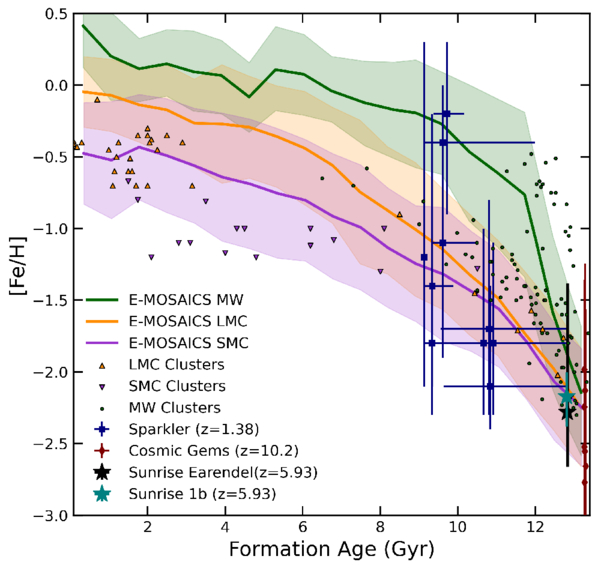
Metallicity and formation age of star clusters in the local universe, in the Milky Way and Magellanic Clouds, and at high redshifts. Click to enlarge. [Pascale et al. 2025]

Given the potential ages and metallicities of the two sources, it’s possible that both Earendel and 1b are the precursors to today’s globular clusters. These clusters may fit into an evolutionary sequence that connects other lensed star clusters, such as the redshift z = 10.2 Cosmic Gems clusters and the z = 1.4 Sparkler clusters.

While this work demonstrates that Earendel could be a cluster, it doesn’t prove that it is. Doing so is challenging, especially since certain features predicted to exist for a single star might be beyond our observational capabilities, or they could be reproduced by clusters with certain properties. The authors pointed to one smoking-gun signal for Earendel being a single, massive star: brightness fluctuations due to microlensing by stellar winds. So far, no such variability has been found, and the cluster hypothesis remains viable.

Citation

“Is Earendel a Star Cluster?: Metal-Poor Globular Cluster Progenitors at z ∼ 6,” Massimo Pascale et al 2025 ApJL 988 L76. doi:10.3847/2041-8213/aded93

The post Examining Earendel: Is the Most Distant Lensed Star Actually a Cluster? appeared first on AAS Nova.

  •  

Star-Crossed Clusters: When Ages Are at Odds

NGC 6791

There’s more than one way to measure the age of a star in a cluster. But do different age-assigning methods agree?

Assessing Ages

stellar isochrones

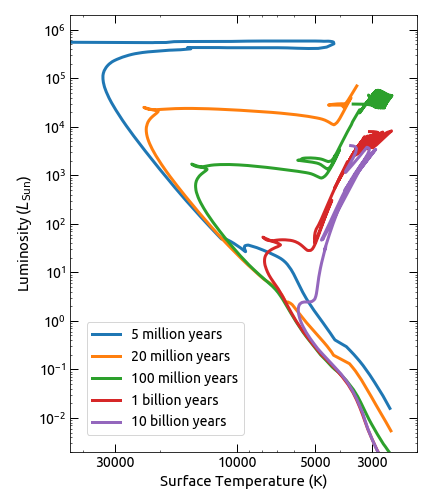
Examples of isochrones for star clusters of various ages. [Ivan Ramirez; CC BY 4.0]

The ages of stars are critical components for many fields of astronomy, from the study of stars themselves to the planets that orbit them and the galaxies they make up. But measuring stellar ages is tricky. It’s considered relatively “easy” to measure the ages of stars in clusters; assuming all stars in a cluster are born from the same material at the same time, the age of the cluster’s stars can be determined using isochrones — theoretical curves describing the temperatures and luminosities of a group of stars of the same age.

However, most stars do not reside in clusters, and to measure the ages of stars that roam the galaxy solo or in small groups, astronomers must use other methods. One method is asteroseismology, in which researchers measure the changes in a star’s brightness or the motion of its surface due to sound waves bouncing around in its interior. Asteroseismology can reveal critical information about a star’s interior structure, composition, and age, but it’s not yet clear how asteroseismic age estimates compare to well-established isochrone-fitting methods for star clusters.

Measurement Matchup

To investigate how these methods compare, Jamie Tayar (University of Florida) and Meridith Joyce (University of Wyoming) compared the age estimates from asteroseismology and isochrone-fitting methods for seven well-studied open and globular clusters. The team scoured the literature for asteroseismic measurements of red giant stars, which are commonly used to calibrate studies of the Milky Way’s history and evolution, and selected a representative age for each cluster from isochrone-fitting methods from the literature.

comparison of asteroseismic and cluster ages for several star clusters

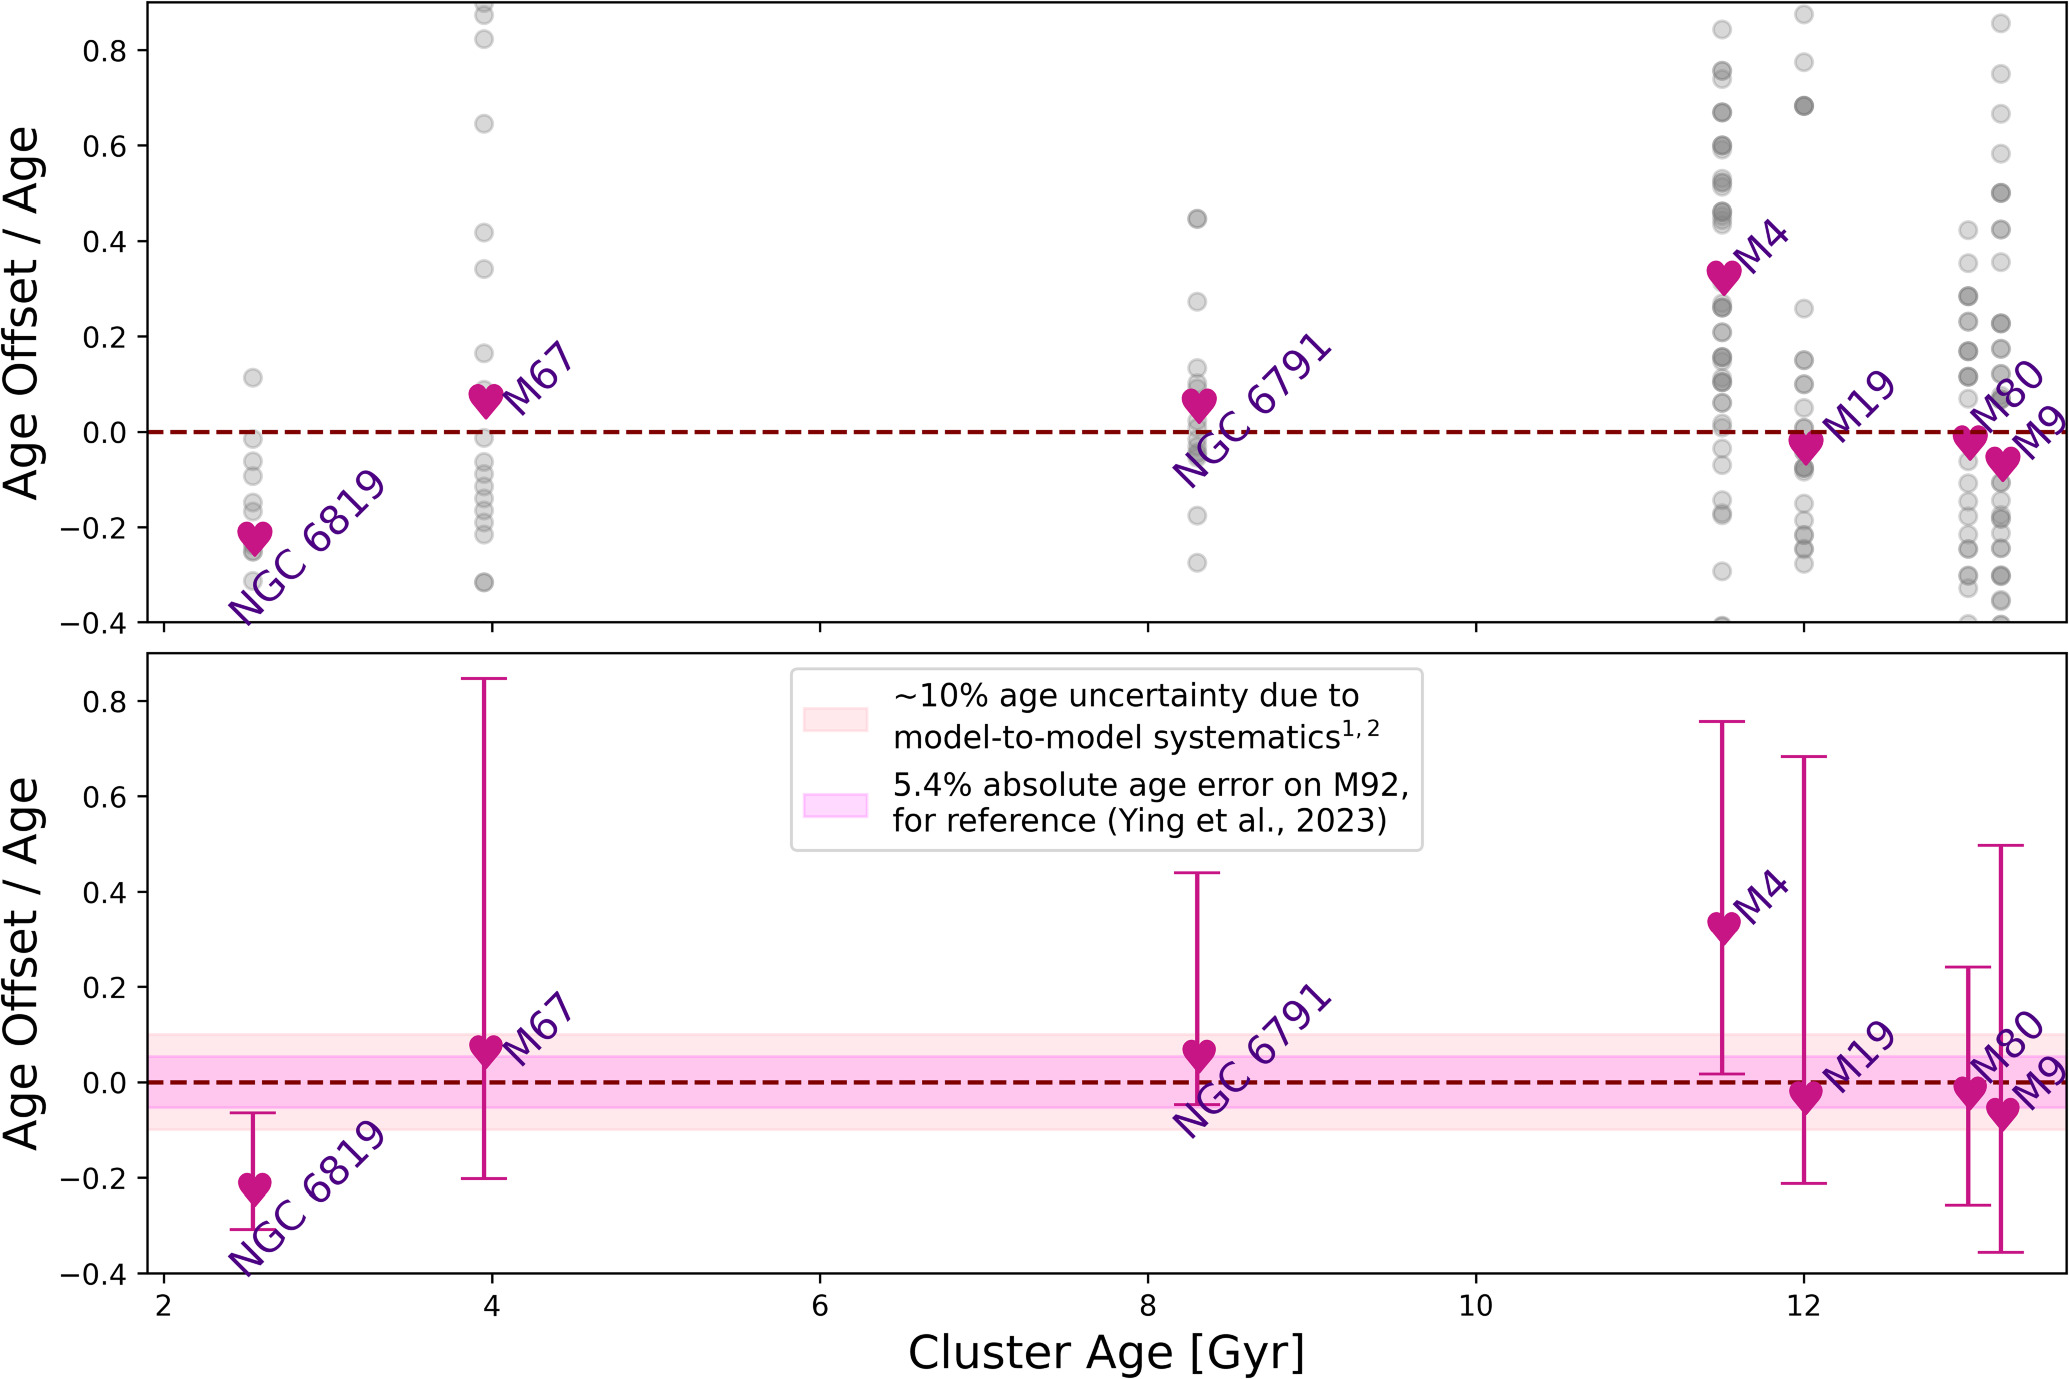
Offsets between asteroseismic ages and cluster ages for seven well-studied clusters. Asteroseismic measurements of individual stars are shown as gray circles, with the median values indicated by the pink hearts. The bottom panel shows the asymmetric dispersion of the asteroseismic data. [Tayar & Joyce 2025]

While the median ages derived from asteroseismic methods fell close to the cluster age for many of the clusters, the team found an enormous amount of spread in the asteroseismic ages of stars within a single cluster. The spread is far greater than expected from the uncertainty in a given asteroseismic measurement, or from the uncertainty arising from the use of different models.

In addition, two of the seven samples had median ages far from the isochrone-fitting cluster age. For these two clusters, especially the well-constrained open cluster NGC 6819, it’s possible that the asteroseismic ages and cluster age are systematically offset from one another — a possibility that would require a dedicated asteroseismic search with a single observatory and a single analysis pipeline to investigate further.

Ages at Odds

Asteroseismic stellar ages are increasingly used to probe the history of the Milky Way and calibrate other age determination methods — so what does it mean for the asteroseismic results to be so varied and potentially offset from the cluster fitting method?

It may mean that asteroseismic measurements require further investigation and calibration before they can achieve the accuracy necessary for galactic archaeology. Part of this endeavor may involve an investigation of binary processes such as accretion or mergers that could alter the masses of individual stars, affecting their inferred ages. These efforts could potentially unlock hundreds of thousands of stellar age measurements from past, present, and future datasets, aiding studies that explore everything from individual stars and their planets to the histories of entire galaxies.

Citation

“Star-Crossed Clusters: Asteroseismic Ages for Individual Stars Are in Tension with the Ages of Their Host Clusters,” Jamie Tayar and Meridith Joyce 2025 ApJL 984 L56. doi:10.3847/2041-8213/adcd6f

The post Star-Crossed Clusters: When Ages Are at Odds appeared first on AAS Nova.

  •  
❌