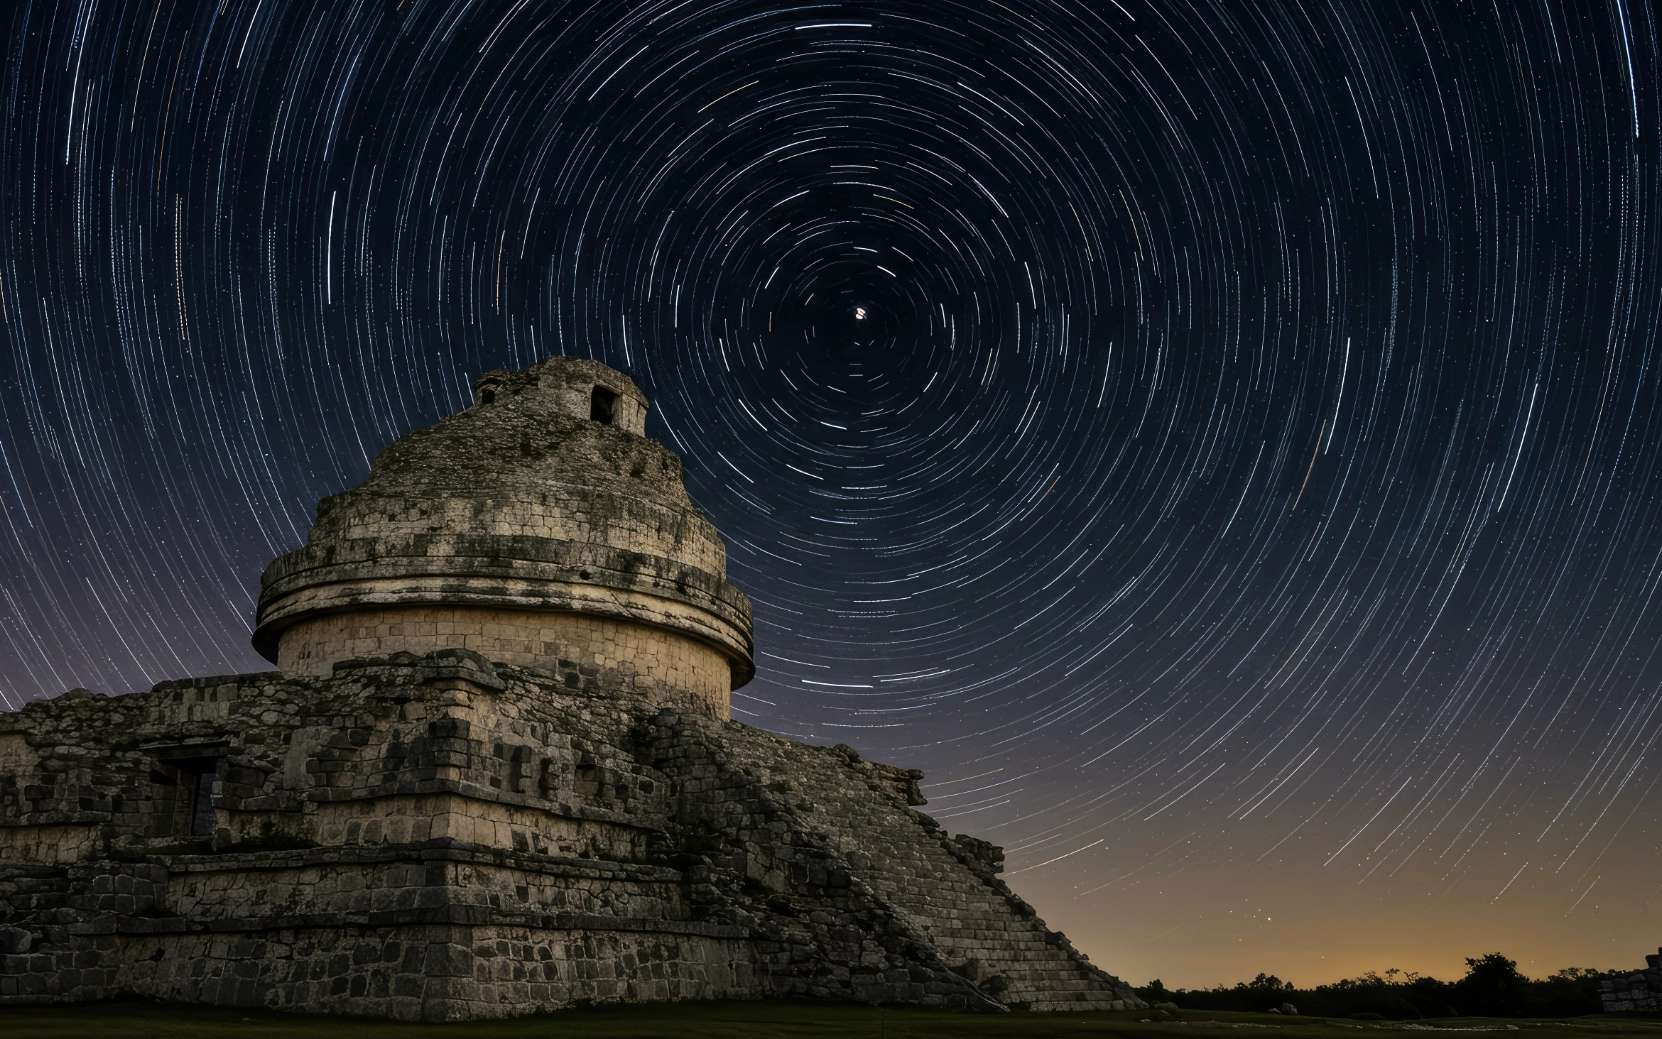
On connaît enfin le nom d’un astronome maya : sa signature se cachait sous une formule mathématique


A Maya astronomer’s identity has been revealed for the first time, discovered in an inscription at the Xultun site in Guatemala, finally revealing a name behind their storied knowledge.
Despite the Maya’s renowned knowledge of math and astronomy, no individual had ever been directly associated with those accomplishments, unlike figures such as the Greek scholars Ptolemy or Archimedes.
Now, in a recent paper published in Antiquity, an international team of archaeologists has identified a name linked to the Maya’s sophisticated mathematical knowledge: Sak Tahn Waax.
From around 2000 BCE until the Spanish conquest in the 16th century, the Maya flourished across the Yucatán Peninsula, building a civilization renowned not only for its political and economic power, but also for its remarkable scientific and mathematical achievements. Although relatively few Maya texts survived the Spanish conquest, those that remain—along with archaeological evidence—show that the Maya precisely calculated the length of the solar year and carefully tracked the movements of the Moon and Venus across the sky.
The art, architecture, and glyphic texts of the Classic Maya likewise reflect a sophisticated understanding of the natural world, interwoven with Indigenous cosmological traditions.
That expertise shaped nearly every aspect of Maya society. Their intricate calendars guided agriculture, informed religious observances, and influenced political life. Yet despite the importance of this knowledge, the individuals responsible for developing it have largely remained anonymous.
Meaning “white-chested fox,” the name Sak Tahn Waax appears on a wall engraved with mathematical formulas, which archaeologists dated to the eighth century CE using inscribed dates and radiocarbon analysis. Researchers believe the room likely served as either a classroom or a workshop for producing books.
The inscription was first documented shortly after excavations began at Xultun in 2011. Although the team initially focused on other priorities at the site, deciphering the text remained an enduring objective.
Reading the inscription required years of laboratory work using color scans and multispectral imaging. After reconstructing the wall’s faded engravings, the researchers determined that the text contained instructions for synchronizing the planetary cycles of Mars and Venus with the Maya calendar, concluding with the signature, “so says Sak Tahn Waax.”
“It’s really elegant, complex math,” said co-author Heather Hurst, an archaeologist at Skidmore College. “That’s why he’s signing it.”
The strangest thing about the discovery may be how common signatures are in other elements of Maya life. Artists and scribes often signed ceramics, while important political and military figures’ names often adorn stelae and buildings. Despite this propensity to name individual Maya on things, those responsible for their legendary knowledge of math and science largely remain unknown.
The archaeologists behind this new study now suggest that those names may be available after all; it is only that researchers have not known where to look.
“There’s good evidence for codex book production,” said lead author Franco Rossi, an archaeologist at the Massachusetts Institute of Technology. “So if there’s going to be a name … this would be the most logical place.”
The researchers hope the discovery will inspire a deeper appreciation for Maya history and for the scholars whose work shaped the civilization.
“I would have loved to see Sak Tahn Waax and Ptolemy hanging out,” Hurst concluded. “They would have had a great discussion.”
The paper, “The Identification and Work of an Eighth-Century Maya Mathematician,” appeared in Antiquity on July 14, 2026.
Ryan Whalen covers science and technology for The Debrief. He holds an MA in History and a Master of Library and Information Science with a certificate in Data Science. He can be contacted at ryan@thedebrief.org, and follow him on Twitter @mdntwvlf.

Many observations of solar flares suffer from saturation and blooming, causing crucial information to be lost. Researchers recently validated a technique for retrieving information from saturated flare images, unlocking a treasure trove of powerful solar flares for examination.
Since 2010, the Atmospheric Imaging Assembly (AIA) on the Solar Dynamics Observatory (SDO) has been capturing nearly continuous extreme-ultraviolet images of the Sun’s disk, revealing our star’s dramatic high-energy behavior. Though SDO/AIA’s observations have transformed our understanding of the Sun’s activity, they have limitations: powerful solar flares can saturate the detector, spilling charge into nearby pixels.
This saturation and overflow compromises our ability to study the most energetic solar flares — but the “lost” information may actually be recoverable. When light from an intense flare enters SDO’s instruments, not all of it pools in the saturated region of the detector: some of the light is diffracted by the optics, and by mathematically inverting this pattern of diffracted light, researchers can attempt to extract the encoded information about the saturated region. Researchers have used this technique for more than a decade, but options for validating the results were limited until now.
Launched almost 10 years to the day after SDO, the Solar Orbiter spacecraft provides an excellent opportunity to test inversion techniques for recovering information from saturated solar images. Solar Orbiter’s Extreme Ultraviolet Imager snaps brief photos of the Sun at a rapid cadence, and its images remain unsaturated even when faced with energetic solar flares.

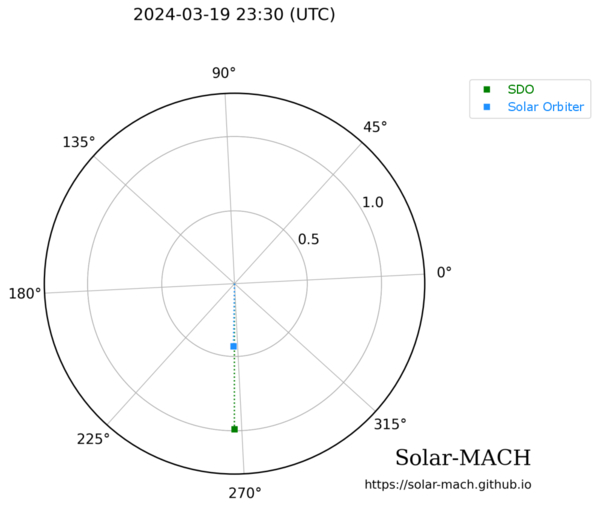
Positions of SDO (green) and Solar Orbiter (blue) during a solar flare on 19 March 2024. Click to enlarge. [Guastavino et al. 2026]
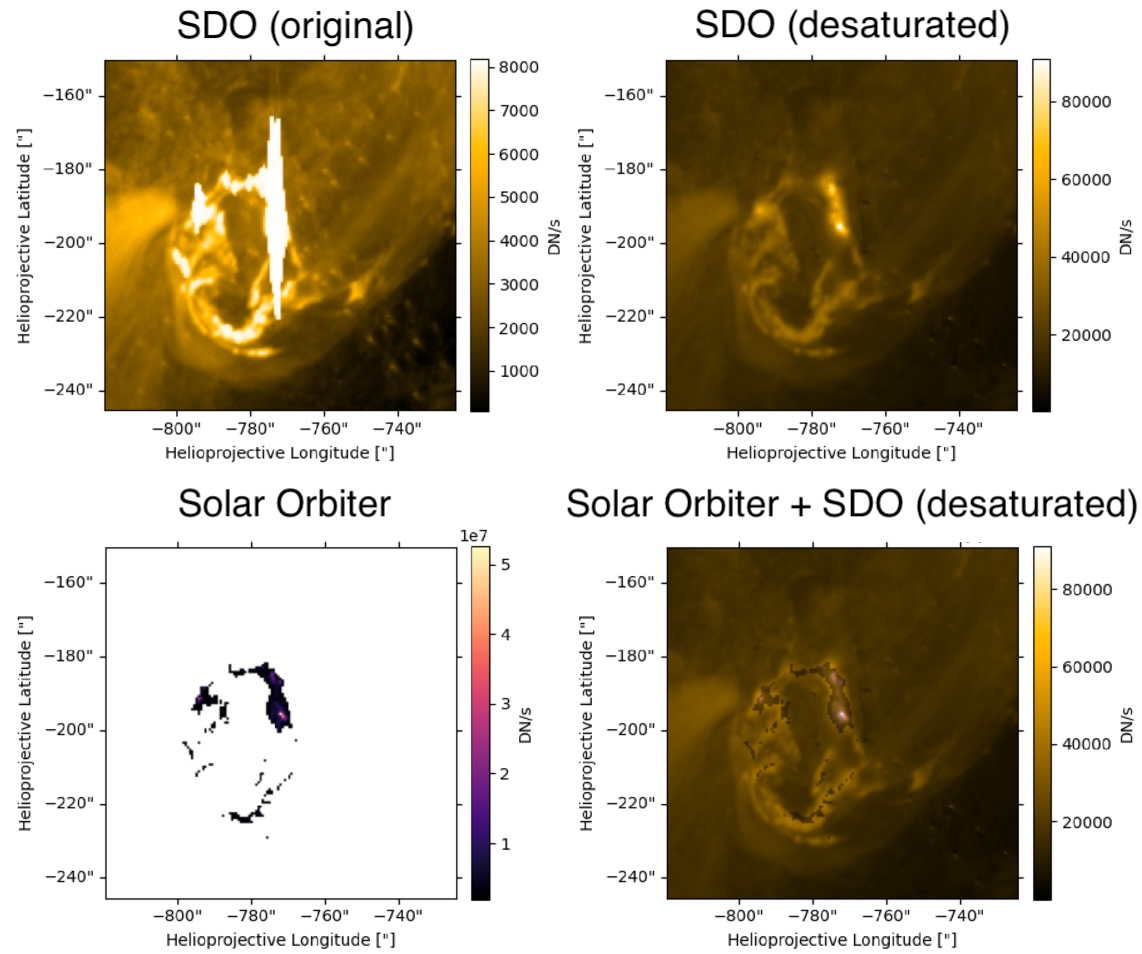
Guastavino’s team aligned and reprojected the data, accounting for the slightly different viewing angles of the two spacecraft, then applied an algorithm called Adaptive SE-DESAT to reconstruct the flux within the saturated portion of the SDO image. The team compared the desaturated SDO images to the unsaturated Solar Orbiter images over the course of the flare, finding the same flare morphology and similar time evolution between the two data sets.

Example of unprocessed SDO data (top left), desaturated SDO data (top right), Solar Orbiter data (bottom left), and a combination of the two data sources (bottom right). Note that the Solar Orbiter observations have been clipped so that only the highest flare intensities were recorded. Click to enlarge. [Adapted from Guastavino et al. 2026]
Overall, these results demonstrate the effectiveness of the inversion technique, though Guastavino and coauthors noted that improvements could be made during the impulsive phase of the flare, when the emission is increasing. The team identified several reasons why the results may not match during this phase, including rapid evolution of the flare during individual exposures.
Despite these areas that require further attention, the validation of this technique unlocks 16 years of solar flare observations from SDO. This especially enhances our sample of powerful solar flares, increasing the available records of the most energetic solar flares by orders of magnitude.
“Validation of an Extreme-Ultraviolet Desaturation Technique for the Atmospheric Imaging Assembly on Board the Solar Dynamics Observatory Using Observations from the Extreme Ultraviolet Imager on Board Solar Orbiter,” Sabrina Guastavino et al 2026 ApJL 1005 L50. doi:10.3847/2041-8213/ae7d2e
The post When the Spacecraft Align: Rescuing Saturated Images of Solar Flares appeared first on AAS Nova.
Fourth of July celebrations across the United States this weekend could be accompanied by light shows in the night skies, as a string of powerful solar eruptions appear set to strike Earth.
The sun has been especially hyperactive over the past few days — firing off 10 M-class solar flares over 24 hours that have been accompanied by multiple coronal mass ejections (CMEs), which are set to slam into Earth on July 3 and July 5.
CMEs are large, fast-moving clouds of magnetized plasma and solar radiation that occasionally get flung into space with solar flares when kinks in the sun's magnetic field snap. If CMEs smash into Earth, they cause disturbances in Earth's magnetic field, called geomagnetic storms, that can trigger partial radio blackouts and produce vibrant aurora displays farther away from Earth's magnetic poles than usual.
"Machine-Gun Sun! More than 5 storms on their way to Earth and 3 of them offer good chances for aurora views," Tamitha Skov, a space weather physicist at Millersville University of Pennsylvania, wrote in a July 2 post on the social platform X. "NOAA and NASA model predictions do not show all the storms yet (it's hard to keep up with the rapid-fire storm launches!) but the first should hit before noon July 3 UTC."
The CMEs are expected to give a glancing blow to our planet, creating conditions for a moderate (G2) geomagnetic storm, according to the National Oceanic and Atmospheric Administration's (NOAA) Space Weather Prediction Center. It's also possible that these storms will strengthen to become strong (G3), depending on how they interact with Earth's magnetic field.
Auroras resulting from G3-class geomagnetic storms are often visible in northern parts of Washington, Idaho, Montana, Wyoming, North Dakota, South Dakota, Minnesota, Wisconsin, Michigan, New York and Maine, according to NOAA. Skywatchers farther south in Oregon, Nebraska, Iowa, Illinois, Indiana, Ohio, Pennsylvania, Massachusetts, Connecticut, Rhode Island, Vermont and New Hampshire will also have a chance of catching the light show. In any case, skywatchers interested in seeing or photographing the auroras will need to get as far from artificial light sources as possible.
The weekend storms might not be the last activity we see from the sun in the coming days, as two gigantic sunspots currently pimpling its face are displaying "beta-gamma-delta" magnetic fields — the most tangled and unstable type. This means these sunspots harbor the potential to launch powerful X-class flares, according to spaceweather.com.
The last few years have seen a record number of powerful X-class flares explode from the sun's surface, hitting Earth with several major solar storms, including 2024's Mother's Day storm. This record comes partly from improvements to scientists' solar monitoring technologies, but also due to the sun reaching its 11-year peak in sunspot production, or solar maximum, in 2024.
Following this peak, the sun has now entered a period known as the "battle zone," a relatively understudied solar phase where instabilities across our star's newly flipped magnetic field ramp up the production of solar holes, gigantic, highly-tangled sunspots and subsequent geomagnetic storms.
The worst-case scenario for a solar storm is a superstorm like the 1859 Carrington Event, which released roughly the same energy as 10 billion 1-megaton atomic bombs. After slamming into Earth, the powerful stream of solar particles set telegraph systems around the world on fire and caused auroras brighter than the light of the full moon to appear as far south as the Caribbean.
The Carrington Event unleashed a roughly X45 magnitude solar flare that remains a record, yet it's likely far from the worst the sun can muster — with ancient tree rings harboring evidence of even more powerful blasts that occurred long before humans existed.
One of Taika Waititi's greatest strengths as a director is his unique voice; he's able to bring a light touch to tragedy (Jojo Rabbit) and a gentle sadness to offbeat comedy (Our Flag Means Death). That makes him an excellent choice to direct Klara and the Sun, based on the novel by Kazuo Ishiguro. Sony Pictures just released the first trailer, and it's giving strong Hunt for the Wilderpeople vibes—a good thing, from my perspective, since that's my favorite Waititi film.
Per the official premise:
Based on the bestselling novel from Nobel Prize winner Kazuo Ishiguro and written and directed by Academy Award winner Taika Waititi, Klara and the Sun introduces audiences to Klara (Jenna Ortega), an Artificial Friend who wants nothing more than to find the perfect home. When Klara meets Josie (Mia Tharia), each immediately senses a kindred spirit in the other. Josie has a fraught relationship with her mother (Amy Adams), and they’ve suffered great loss, but Klara’s innocent wonder and unwavering loyalty begin to heal the family and bring light to Josie’s complicated world.
The cast also includes Natasha Lyonne as an artificial friend (AF) store manager; Rachel House as the housekeeper, Melania; Aran Murphy (son of Cillian Murphy) as Josie's best friend, Rick; and Sophia Bryant-Taukiri as Josie's older sister, Sal. Steve Buscemi and Harry Greenwood also appear in as-yet-undisclosed roles.


© Sony Pictures
For our weary eyeballs, strained and tired from long periods locked onto screens, rest and relaxation can do wonders. But a man in Scotland came up with an eye-popping plan to try to pamper his pooped peepers.
Ophthalmologists discovered it when the man, who was in his 20s, appeared at an eye treatment center in Edinburgh. He told them he had noticed increasing floaters and flashing lights in his right eye over the previous six days. According to a BMJ Case Report, the man said he hadn't had any eye or head injuries before the vision problems began, and that his family didn't have a history of eye disorders that might explain them. Besides having mild near-sightedness and needing glasses, he usually didn't have any problems with his eyes, he said.
When the doctors—Niamh O’Connell and Ashraf Khan—took a close look, they were surprised to find that both of his eyes were in terrible shape. In his right eye, he had multiple retinal tears, widespread retinal bruising, and a condition called retinal dialysis—a retinal break at a junction in the front of the eye—that is usually seen after a significant eye injury. In his left eye, he had more widespread bruising and six full-thickness rips in his retina.


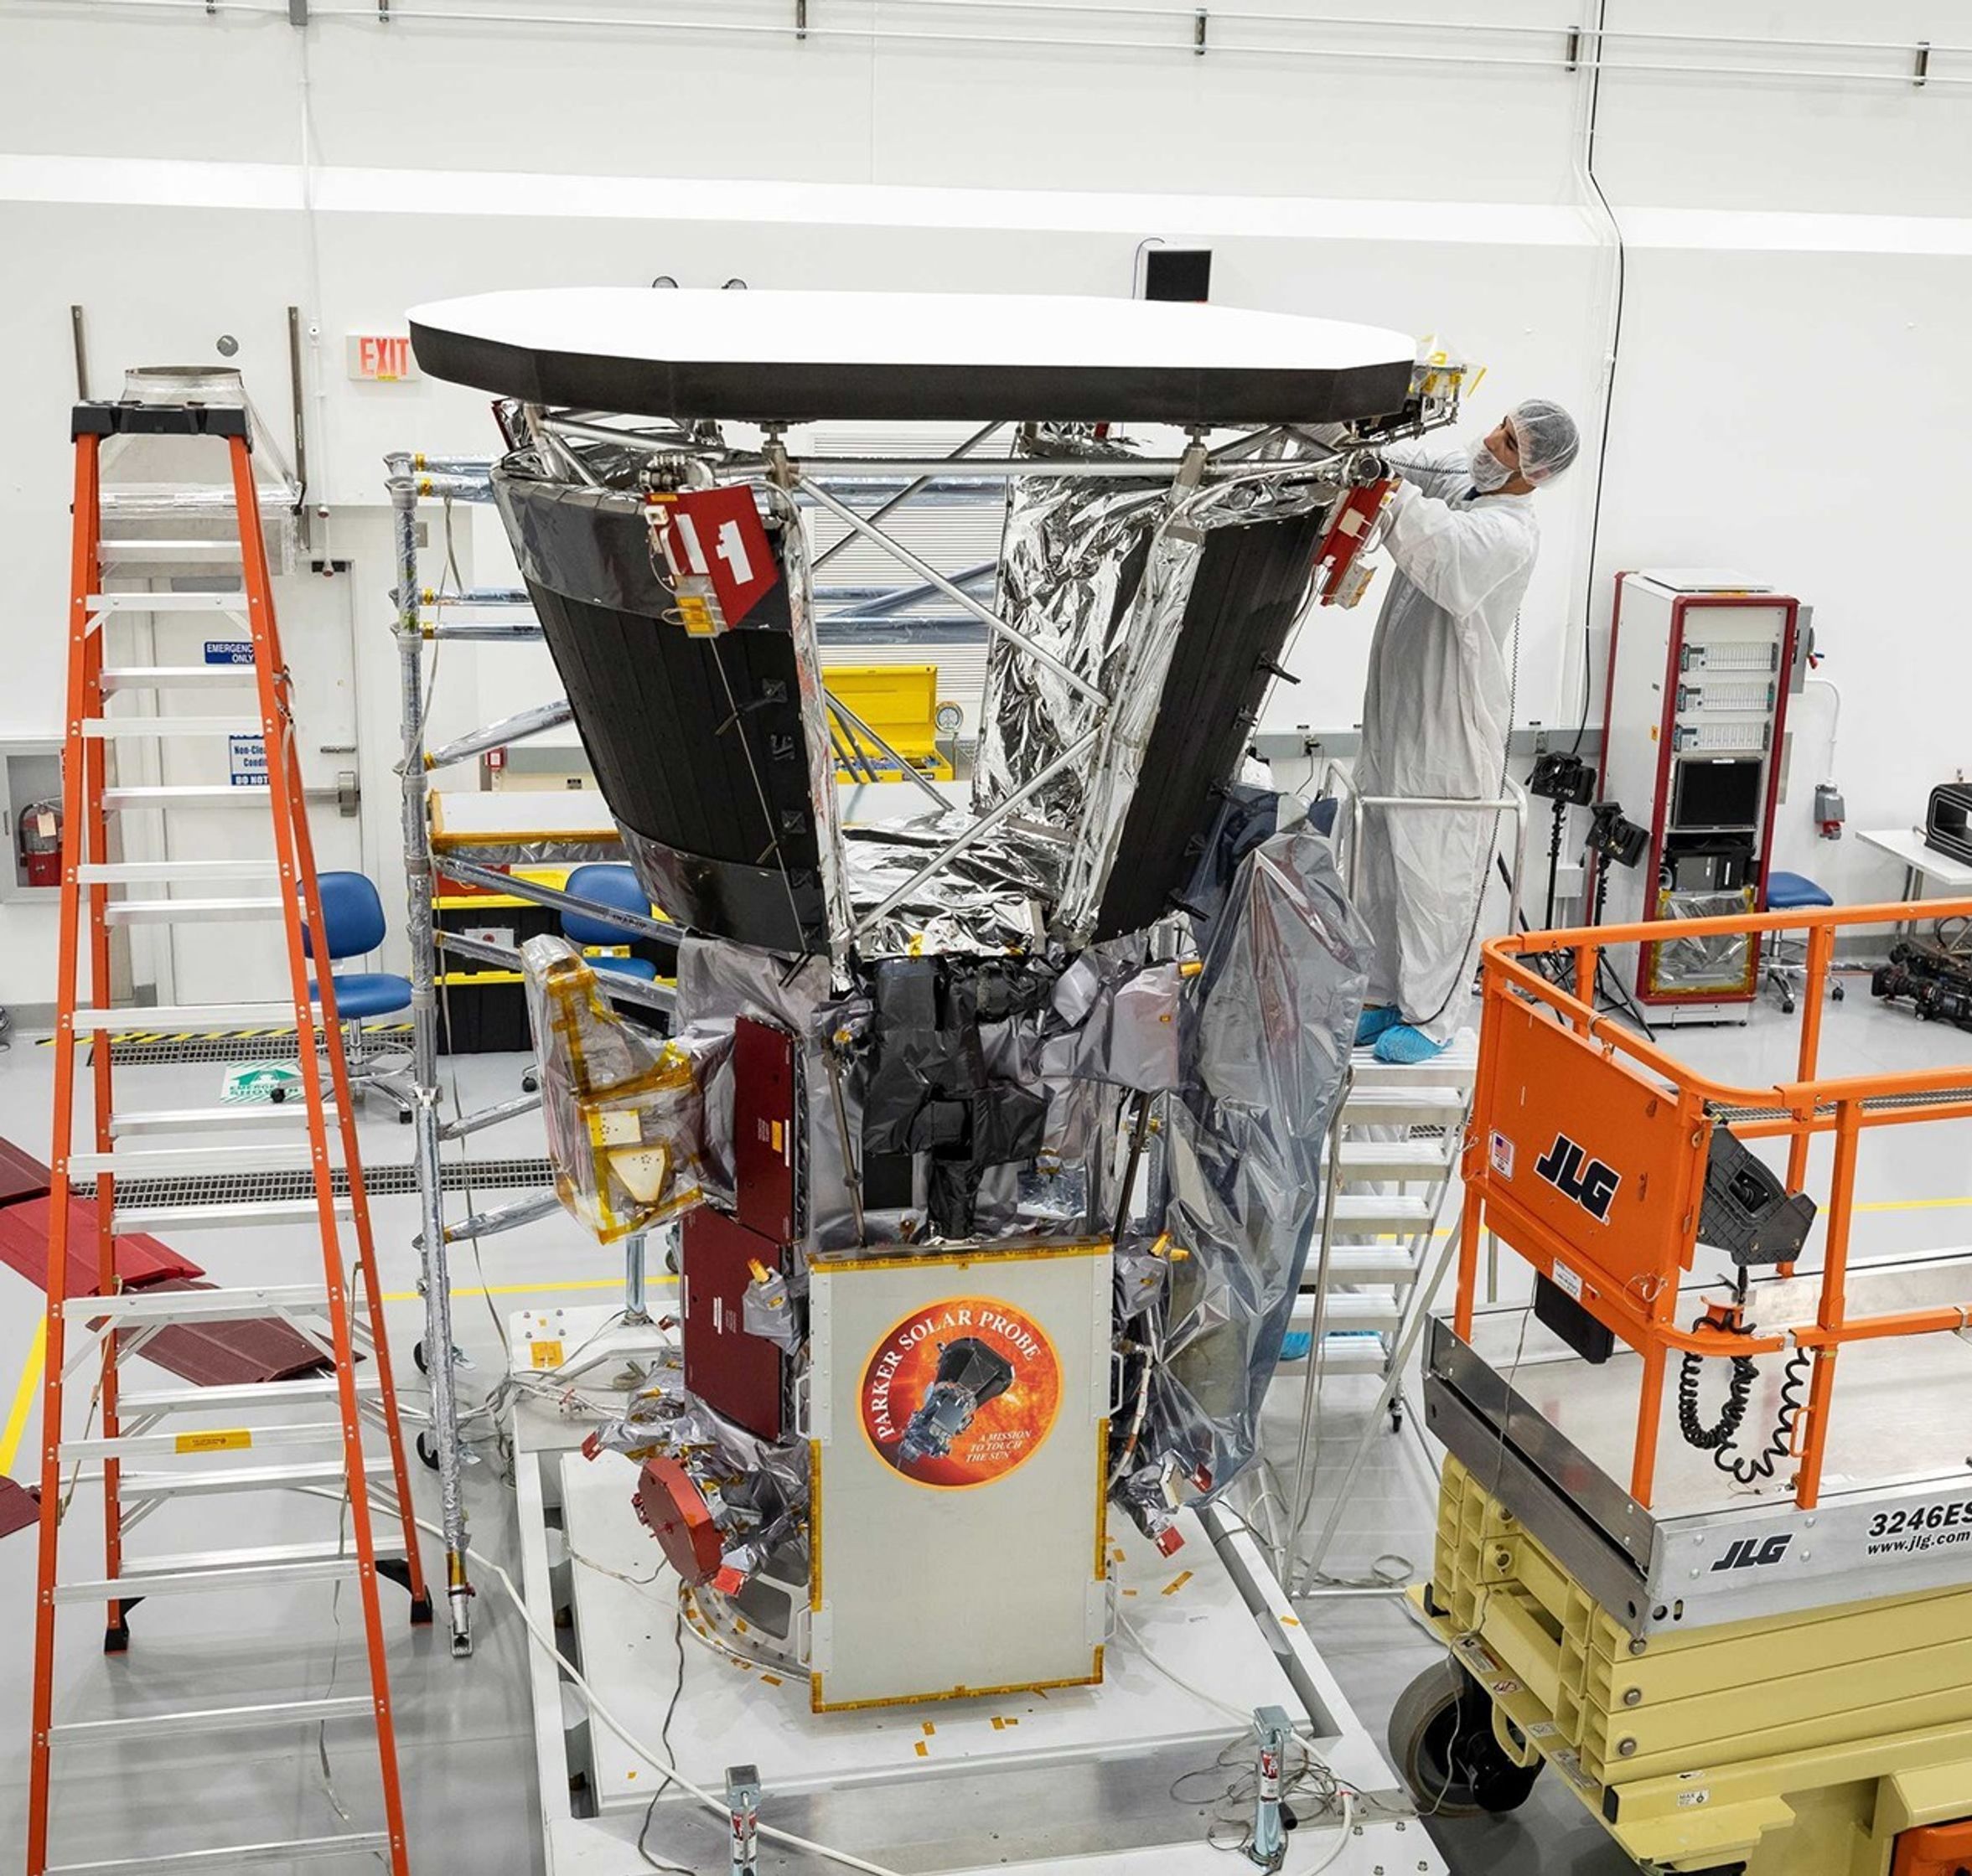
NASA’s Parker Solar Probe completed its 28th close approach to the Sun on June 8, again matching its record distance of 3.8 million miles from the solar surface. The flyby allowed the spacecraft to continue its measurements of the solar wind and solar activity at their source, while adding to our understanding of how the Sun’s atmosphere changes throughout the solar cycle.
The spacecraft checked in with flight controllers at the Johns Hopkins Applied Physics Laboratory (APL) in Laurel, Maryland — where Parker Solar Probe was designed and built — on Thursday, transmitting a beacon tone that indicated its systems were operating normally. Zooming around the Sun on a trajectory that limited communications with Earth, Parker had been out of contact and operating autonomously for nine days around its closest approach, as planned.
During this solar encounter, which started June 3 and ends Saturday, June 13, Parker’s four scientific instrument packages gathered data from inside the Sun’s atmosphere, or corona. Parker will begin returning detailed spacecraft telemetry on June 14, with science data transmission set to run from Wednesday, June 17 to Tuesday, June 30.
Parker’s observations of the solar wind and solar events, such as coronal mass ejections and the aftermaths of flares, are critical to advancing humanity’s understanding of the Sun and the phenomena that drive high-energy space weather events that pose risks to astronauts, satellites, air travel, and even power grids on Earth. Understanding the fundamental physics of space weather enables more reliable prediction of astronaut safety during future deep-space missions to the Moon and Mars.
Parker also equaled its record-setting speed of 430,000 mph — a mark that, like Parker’s distance to the Sun, was set during a close approach on Dec. 24, 2024, and matched during five flybys since, most recently on March 11. Parker will continue matching these speed and distance records during future flybys.
Through all six close approaches, mission leads say, the spacecraft has remained in excellent condition. While Parker doesn’t have a temperature sensor on the front of its heat shield — known as the Thermal Protection System, or TPS — the team can estimate through models that the heat shield reaches temperatures of about 1,700 degrees Fahrenheit at closest approach.

“The heat shield material is incredibly light and fragile, but the thermal design, as well as the software that keeps the spacecraft pointing the TPS toward the Sun, have been outstanding,” said John Wirzburger, Parker Solar Probe mission systems engineer at APL. “It’s a real tribute to the team that designed, built, and operates Parker Solar Probe.”
Meanwhile, the team can measure the temperature of the barrier blanketing below the heat shield, and the actual spacecraft temperature has remained consistent on each pass.
“That temperature consistency is a major indicator of spacecraft health,” said Wirzburger. “It tells us the heat shield isn’t degrading. If it were cracking or weakening, we’d see temperatures drift upward as more heat leaked through.”
Parker launched in August 2018. At the time, the Sun was near the minimum of its 11-year activity cycle. In 2024, representatives from NASA, the National Oceanic and Atmospheric Administration (NOAA), and the international Solar Cycle Prediction Panel announced that the Sun had reached its solar maximum period. Parker’s 28 encounters with the Sun reflect this change over time, sampling the Sun’s atmosphere from quiet to very active periods. Parker Solar Probe will remain in this orbit around the Sun and continue making observations into the declining phase of solar activity.
The next steps for the mission in late 2026 and beyond are under NASA review.
Parker Solar Probe was developed as a part of NASA’s Living With a Star (LWS) program to explore aspects of the Sun-Earth system that directly affect life and society. The LWS program is managed by the agency’s Goddard Space Flight Center in Greenbelt, Maryland, for NASA’s Science Mission Directorate in Washington. Johns Hopkins APL manages Parker Solar Probe for NASA and designed, built, and now operates the mission.
Mike Buckley, Johns Hopkins Applied Physics Laboratory
The post Parker Solar Probe Makes 28th Close Pass of Sun appeared first on NASA Science.
Eugene Parker, pioneer of theoretical solar and plasma astrophysics, was born June 10, 1927. Parker revolutionized the field of heliophysics, notably by first proposing the existence of the solar wind — a stream of charged particles ejected from the Sun — in 1958. His theory was confirmed by Mariner II in 1962. Among many otherContinue reading "June 10, 1927: The birth of Eugene Parker"
The post June 10, 1927: The birth of Eugene Parker appeared first on Astronomy Magazine.

The Sun’s activity history, the sources of tiny jets, and how magnetic fields might impact space weather forecasts: today’s Monthly Roundup introduces a trio of recent research articles from the Astrophysical Journal that tackle hot topics in solar physics.
Since the 1970s, regular monitoring of the Sun’s magnetic field has allowed researchers to decipher the Sun’s behavior as it cycles through periods of low and high activity. But what resources exist for studying the Sun’s past behavior? To investigate the long-term behavior of the Sun, researchers reach for historical records of sunspots, which stretch back to the 1700s.
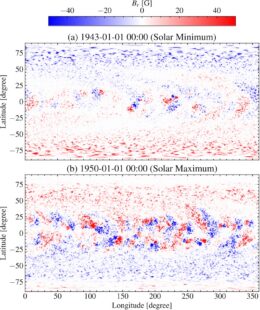
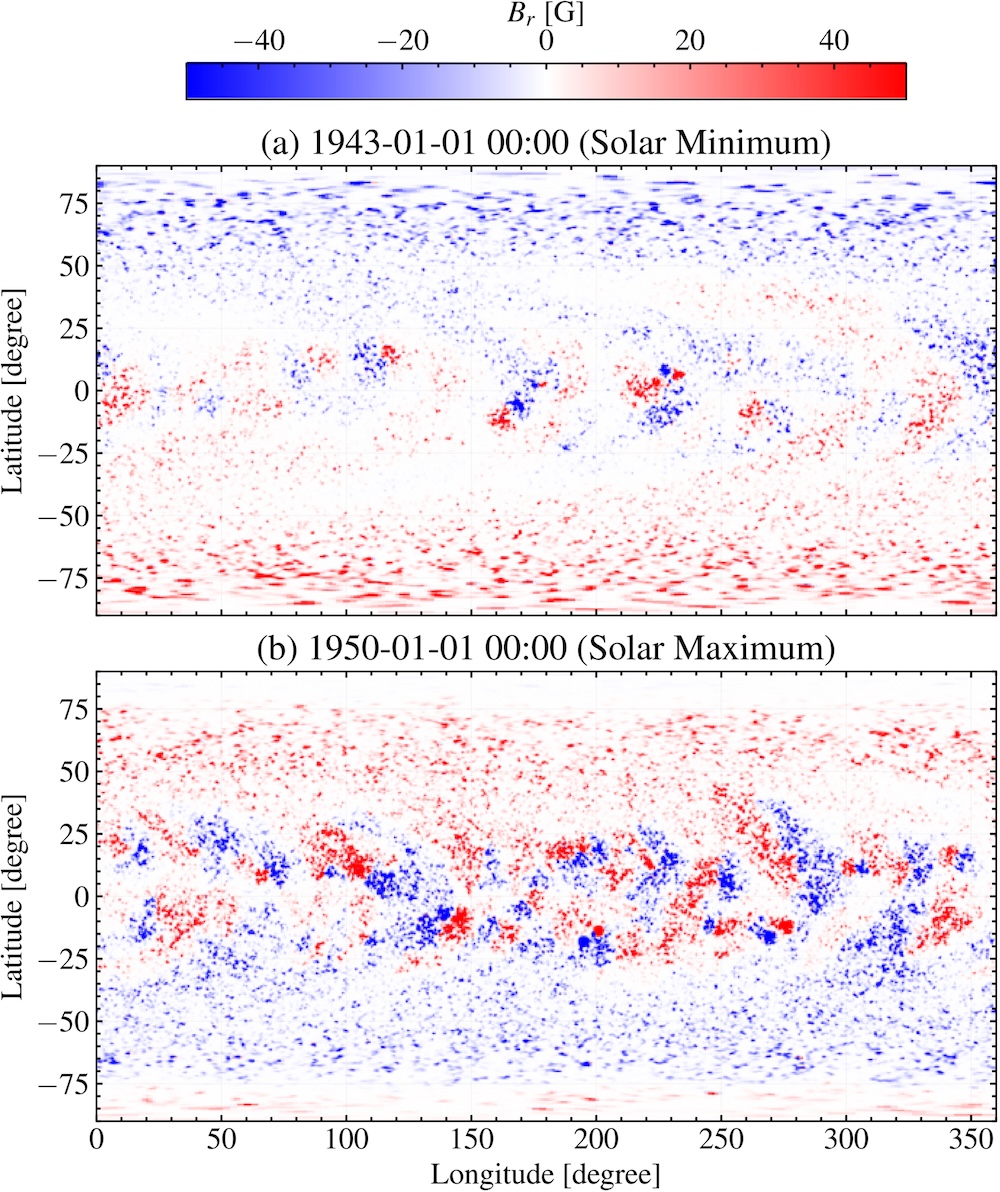
Example maps of the simulated photospheric radial magnetic field during a period of low (top) and high (bottom) solar activity. Click to enlarge. [Jha et al. 2026]
Jha and coauthors found that this method successfully reproduced the expected large-scale behavior of the Sun’s magnetic field across multiple solar cycles, such as the reversal of the polarity of the solar magnetic field near the peak of the activity cycle. While this work highlights the impressive results obtained from combining historical sunspot records with modern sunspot statistics, the team pointed out that this method cannot accurately reproduce all quantities because of the nonlinear nature of the underlying physics. Future work will refine the model further, and in the meantime, the team’s simulated historical magnetic field maps will be made publicly available.
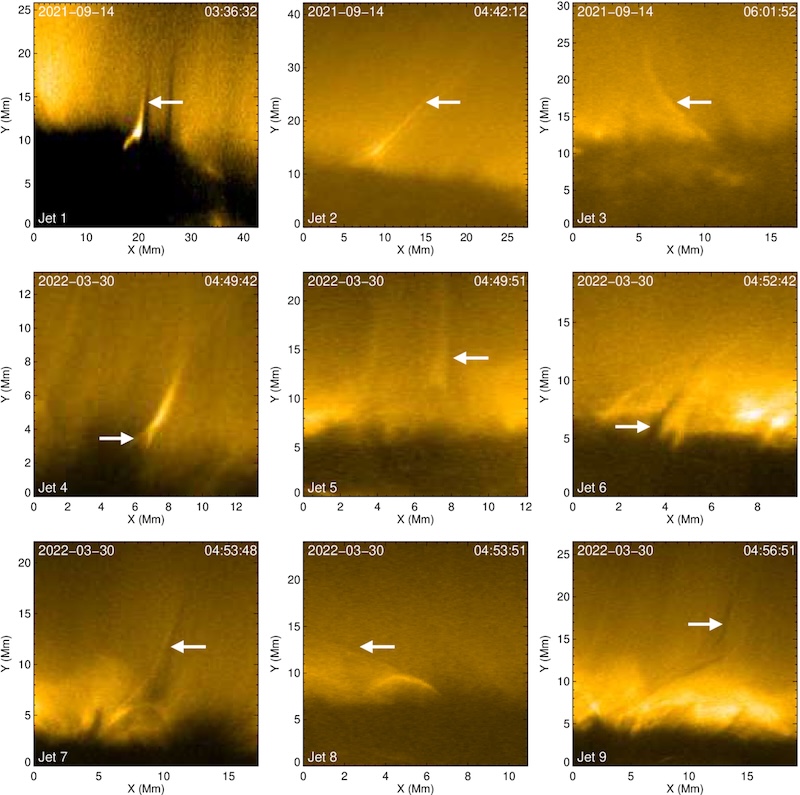
The Sun’s atmosphere is filled with an ever-shifting maze of magnetic field lines, which reconfigure and release pent-up magnetic energy in a process called magnetic reconnection. Magnetic reconnection can launch particles and heat plasma, and it’s thought to be responsible for driving jets on a variety of scales in the Sun’s tenuous outer atmosphere, or corona. Annu Bura (Indian Institute of Astrophysics; Pondicherry University) and coauthors investigated the physical origins of the smallest of these reconnection driven jets, picoflare jets, using data from the Extreme Ultraviolet Imager on board Solar Orbiter. Solar Orbiter has ventured within 0.3 au of the Sun, and its Extreme Ultraviolet Imager has returned exceptionally precise high-energy images of our home star.

Examples of jets identified in this study. You can see an animation of this figure. [Bura et al. 2026]
Using radiation magnetohydrodynamics simulations, the team explored the origins of their sample of jets. The simulations suggested that the bright features arose from hot, tenuous coronal plasma, while the accompanying dark features were due to cooler, denser plasma venturing upward from deeper in the Sun’s atmosphere, in the chromosphere. Overall, the simulations and observations support a picture in which picoflare-scale jets are driven by magnetic reconnection after magnetic flux emerges through the Sun’s surface. This echoes the formation route of larger coronal jets, suggesting that this process may apply to a wide range of physical scales.
The vast majority of our observations of the Sun have come from within a few degrees of the ecliptic plane, either from telescopes situated on Earth’s surface or from spacecraft that stuck close to the plane of our solar system. With rare but notable exceptions — the Ulysses spacecraft, which measured the Sun’s magnetic field and plasma environment from a near-polar orbit, and Solar Orbiter, which took the first-ever image of the Sun’s poles in November 2025 — the Sun’s poles have remained hidden from our instruments.
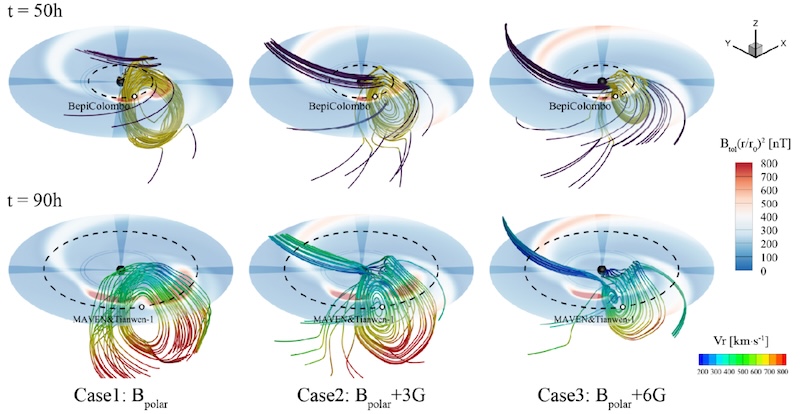
Our limited knowledge of the Sun’s polar magnetic field has consequences for our ability to model space weather events like coronal mass ejections. A team led by Xiao Zhang (Chinese Academy of Sciences; University of Chinese Academy of Sciences) has used numerical simulations to investigate how solar polar magnetic field conditions influence the propagation of a coronal mass ejection (CME) through the solar system.
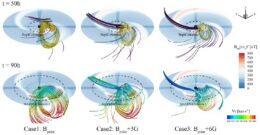
Simulation results showing how the propagation and expansion of a CME are affected by the polar magnetic field strength. Click to enlarge. [Zhang et al. 2026]
“Historical Reconstruction of Solar Surface Magnetism from Cycles 1–24 Using the Synthetic Active Region Generator and the Advective Flux Transport Model,” Bibhuti Kumar Jha et al 2026 ApJ 997 279. doi:10.3847/1538-4357/ae279a
“On the Origin of Coronal Picoflare Jets,” Annu Bura et al 2026 ApJ 1000 94. doi:10.3847/1538-4357/ae48e6
“Influence of Solar Polar Magnetic Fields on the Propagation of Coronal Mass Ejections,” Xiao Zhang et al 2026 ApJ 1000 200. doi:10.3847/1538-4357/ae4c54
The post Monthly Roundup: Science of the Sun appeared first on AAS Nova.

Revealed in high resolution, researchers have spotted complex twisting and braiding motions in fine threads of plasma suspended above a sunspot. The flow of material that followed this braiding provides evidence for magnetic reconnection.

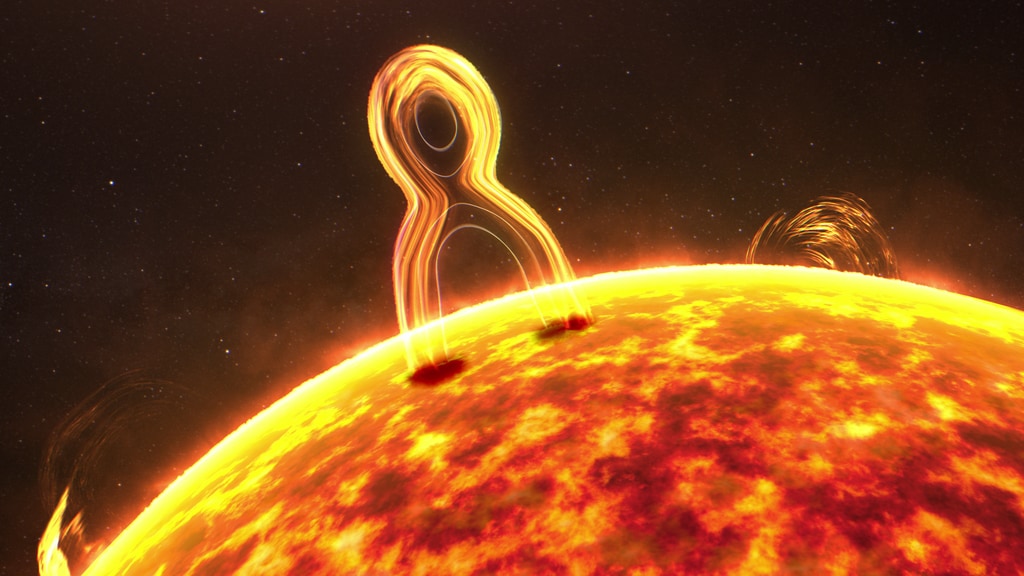
Magnetic reconnection is common throughout the universe, from Earth’s magnetic field to the jets of supermassive black holes. This illustration shows magnetic reconnection happening on the Sun. [NASA’s Conceptual Image Laboratory]
One way for magnetic reconnection to heat the corona is along magnetic fields that loop up into the corona and are anchored to the solar photosphere. The footprints of these field lines — the spots where they land in the photosphere — wiggle around in random ways. As this happens, the arcing magnetic field lines become braided together, and the twisted magnetic field can then undergo magnetic reconnection, heating the corona.
This process has been explored theoretically, but it’s been challenging to observe directly. As increasingly capable Sun-studying instruments have come online, though, researchers have been able to attain the high resolution needed to see this process at work.
Recently, Hechao Chen (Yunnan University; Peking University; Yunnan Key Laboratory of Solar Physics and Space Science) used data from the New Vacuum Solar Telescope, the Interface Region Imaging Spectrograph, and the Solar Dynamics Observatory to study the braiding and unbraiding of fine magnetic structures above a sunspot.

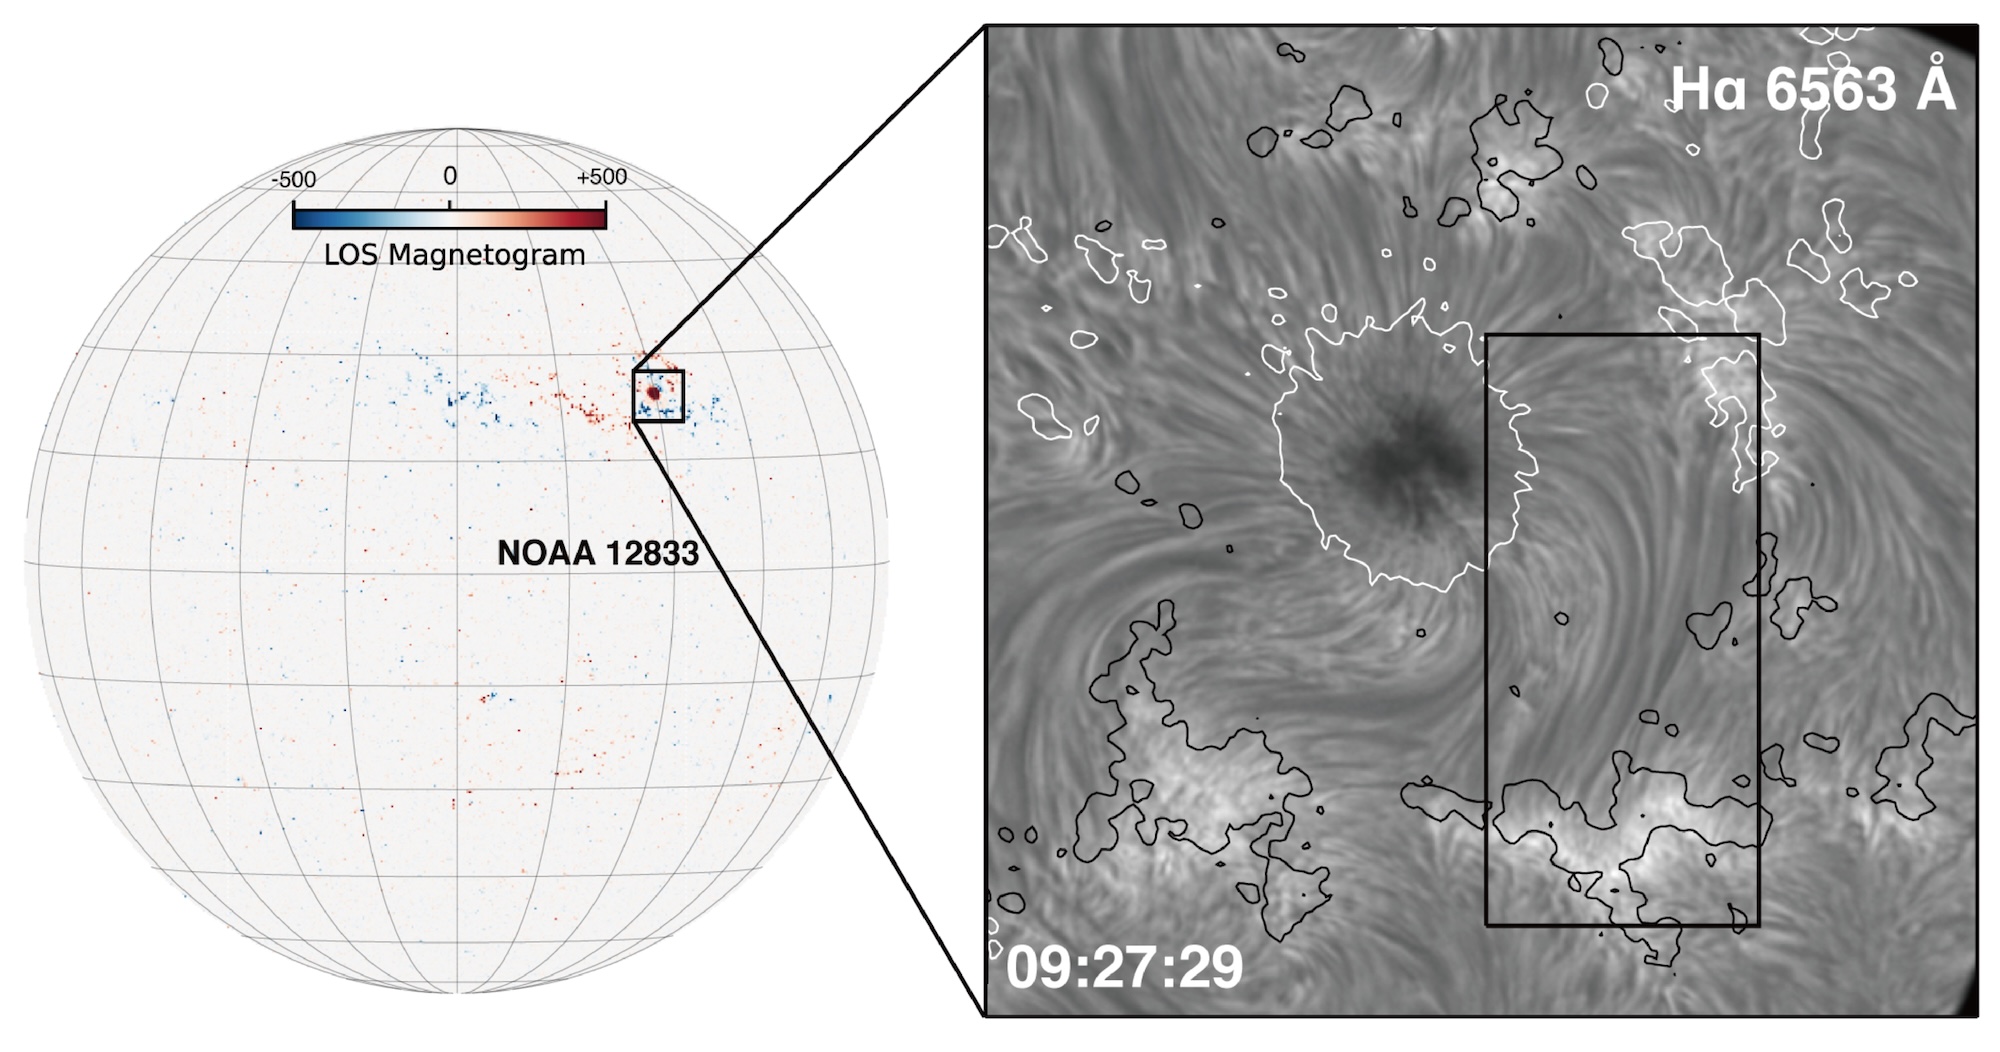
Location of the sunspot featured in this study, plus a closeup of the strands of plasma around the sunspot. Click to enlarge. [Adapted from Chen et al. 2025]
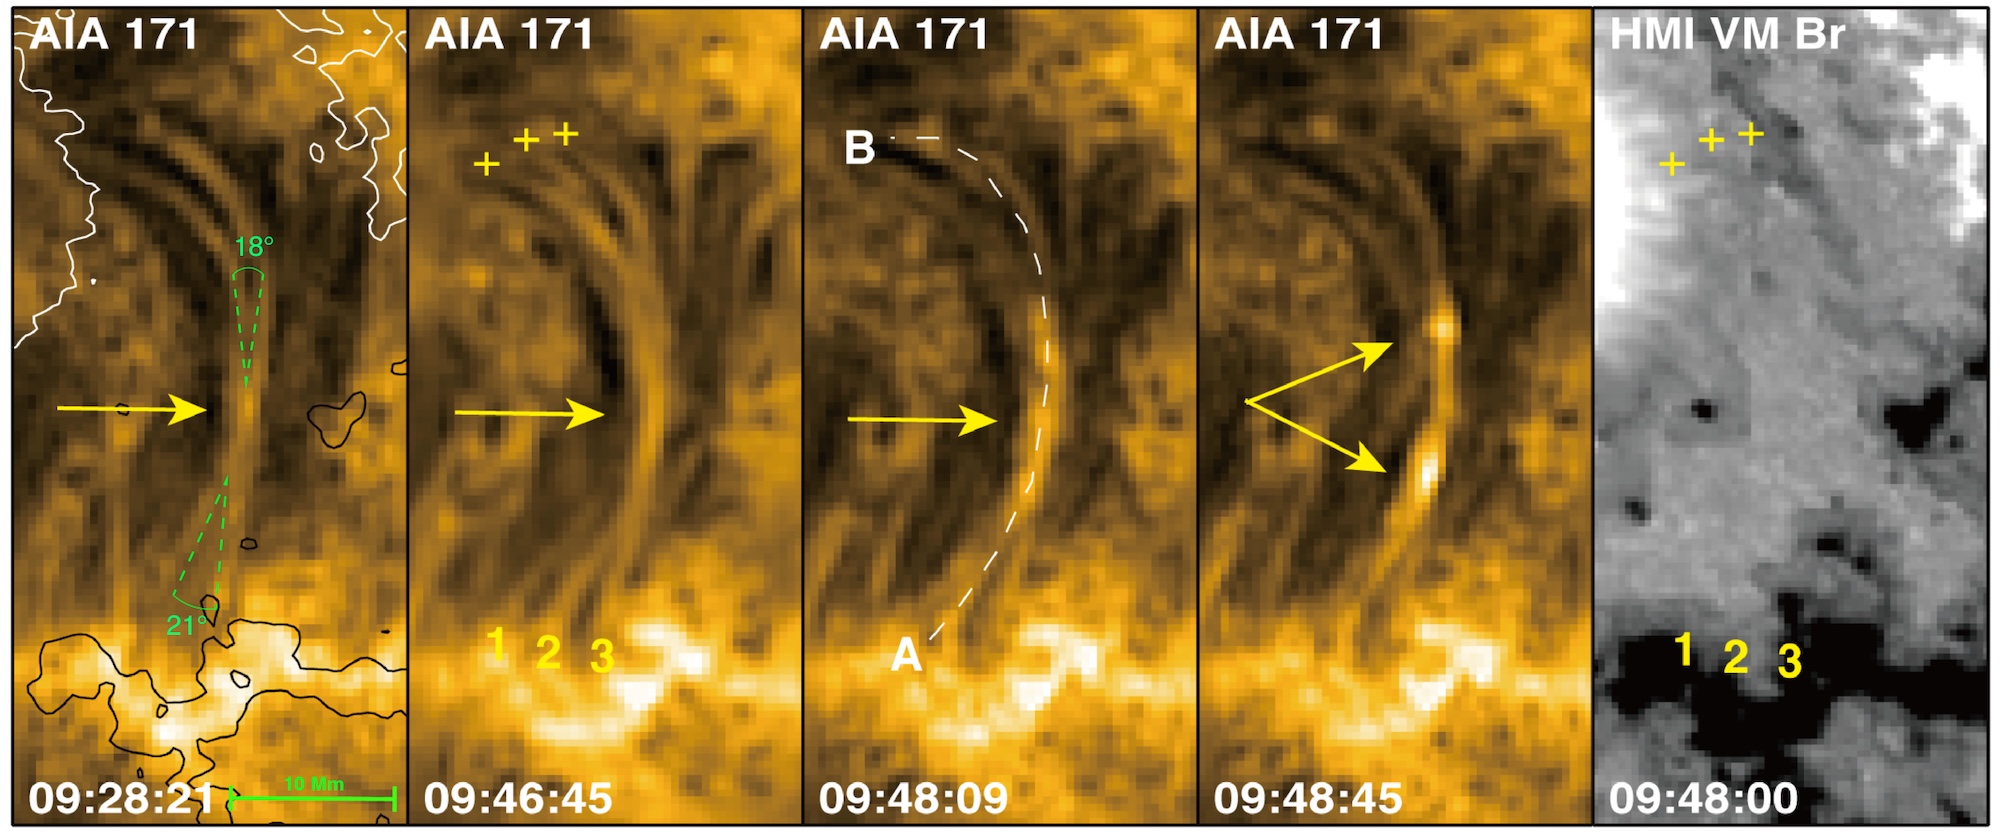
The plasma threads appear to lie nearly parallel to one another at the beginning of the observation. Images from all three facilities showed the plasma threads intertwining, providing evidence for the twisting of magnetic field lines predicted to happen when their footprints move around. (As further evidence for this footprint motion, the team also observed complicated flow patterns near one of the footprints.) This intertwining was followed by a sudden brightening where the threads were most tightly knotted, creating two bright “blobs” that traveled outward toward the footprints. Afterward, the threads resumed their nearly parallel state.

Images from Solar Dynamics Observatory. The first four images show the Sun at a wavelength of 17.1 nanometers, and the final image shows the radial magnetic field. The arrows indicate the location of the magnetic field braiding and the plasma “blobs.” Click to enlarge. [Adapted from Chen et al. 2025]
This work beautifully illustrates the process of magnetic reconnection on the Sun, showing how random motions can set the stage for the buildup of magnetic tension. The heating and acceleration of plasma that follows demonstrates how small-scale reconnection events like the ones shown here can provide the energy needed to heat the solar corona.
“Witnessing Magnetic Reconnection in Tangled Superpenumbral Fibrils Around a Sunspot,” Hechao Chen et al 2025 ApJ 995 94. doi:10.3847/1538-4357/ae12e9
The post Astronomers See Braided Magnetic Fields Above a Sunspot appeared first on AAS Nova.

What happens when pileups of solar wind plasma collide with Earth’s protective magnetosphere? New work uses machine learning to examine how strongly these events affect our planet’s magnetic field.

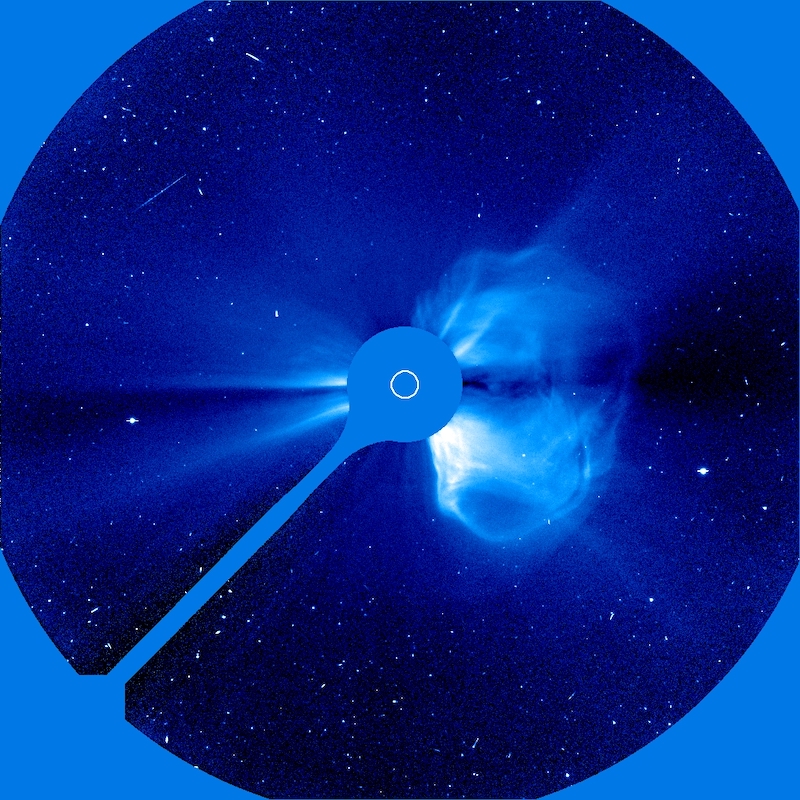
The Solar & Heliospheric Observatory (SOHO) took this coronagraphic image of a coronal mass ejection on 20 April 1998. [SOHO (ESA & NASA)]
Stream interaction regions arise when slow-moving solar wind is struck from behind by faster-moving solar wind emitted later. The collision of the two solar wind streams creates a tangle of compressed plasma and strong magnetic fields capable of peeling back Earth’s protective magnetosphere and dumping in high-energy charged particles, with beautiful yet harmful results.
Though stream interaction regions are less disruptive than coronal mass ejections, they’re far more common; they frequently needle Earth’s magnetosphere, especially during the calmer years of the Sun’s activity cycle. Predicting how strongly a stream interaction region will influence Earth’s magnetosphere — in other words, how geoeffective it is — is challenging, however. When two streams of solar wind collide, their properties combine in complex and nonlinear ways that traditional statistical investigations have struggled to pin down.
Now, Ye and collaborators have used machine learning to study the properties and impact of stream interaction regions in a physically meaningful way. They performed their study on a sample of 879 stream interaction events for which there is abundant information, such as temperature, magnetic field strength and direction, and solar wind conditions before and after the event.

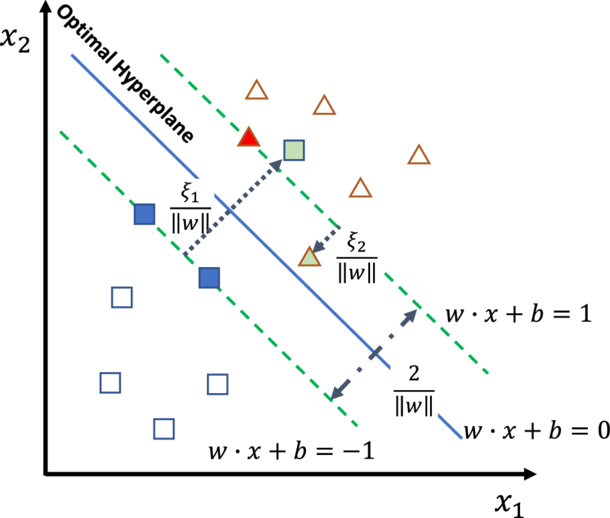
Illustration of the authors’ support vector machine framework. The optimal hyperplane is the boundary that best divides the data by maximizing the distance between the boundary and the data points nearest to it; these points are called support vectors. Square and triangle symbols represent two classes of data. Click to enlarge. [Ye et al. 2025]
The team first reined in the model’s complexity by identifying the most important features in the dataset. They then determined which features or combination of features had the largest contribution to the output — in other words, which physical parameters most strongly determined the geoeffectiveness of the event.

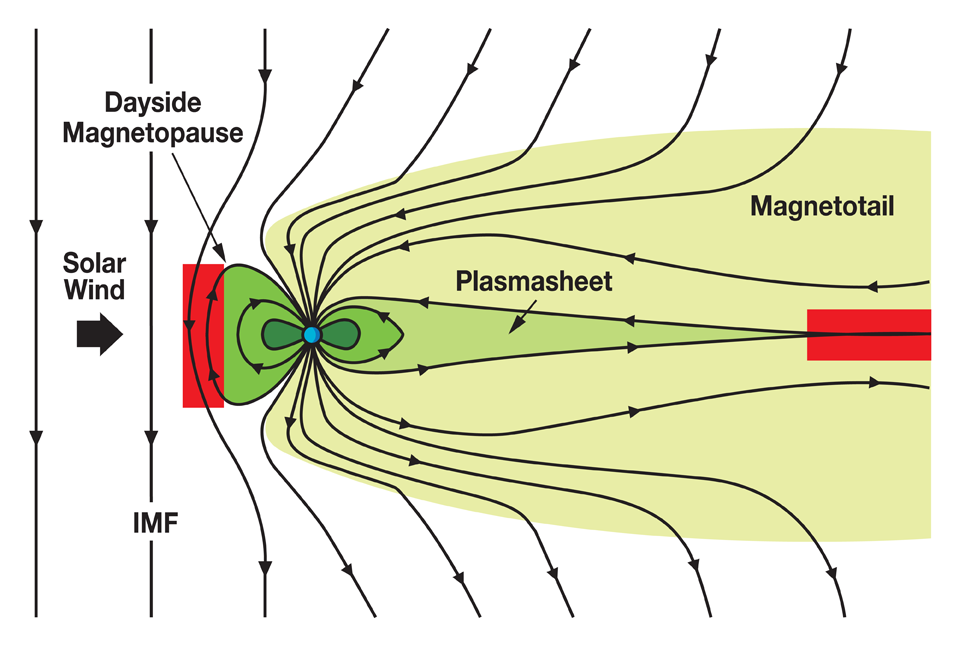
Illustration of how the interplanetary magnetic field (IMF) interacts with Earth’s magnetosphere. When the IMF points southward, as it does in this diagram, the impact on Earth’s magnetosphere is increased, with magnetic reconnection occurring in the red areas. Click to enlarge. [NASA]
“Assessing the Geoeffectiveness of Stream Interaction Regions Through Physically Interpretable Machine Learning,” Yudong Ye et al 2025 ApJ 993 10. doi:10.3847/1538-4357/ae0454
The post When Winds Collide: Predicting the Effects of Stream Interaction Regions appeared first on AAS Nova.

Editor’s Note: For the remainder of 2025, we’ll be looking at a few selections that we haven’t yet discussed on AAS Nova from among the most-downloaded articles published in AAS journals this year. The usual posting schedule will resume January 2nd.

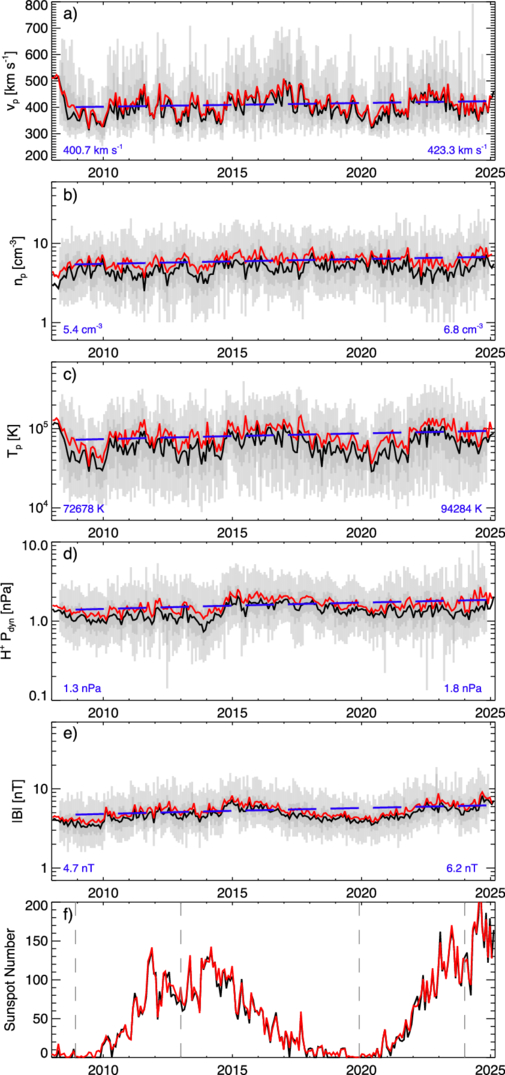
Various solar wind parameters measured at Earth’s orbital distance from 2008 to 2025. [Jasinski and Velli 2025]
The Sun undergoes an 11-year activity cycle that is driven by a change in its internal magnetic field structure. As the Sun’s magnetic activity changes, the number of sunspots, the frequency of solar flares and coronal mass ejections, and the intensity of the solar wind vary as well. Atop these mostly regular 11-year changes are longer-term variations. A recent example of this longer-term behavior began in the 1980s, when an overall weakening trend was stamped upon the usual 11-year cycle. This decline led to an exceptionally deep solar minimum in 2008, leading researchers to suspect that the Sun’s activity level might remain low for decades.
Though the Sun reversed its weakening activity trend in 2008, a prolonged period with little solar activity wouldn’t have been unprecedented. Astronomers have monitored and counted sunspots for centuries, allowing modern-day researchers to investigate the Sun’s behavior long before spacecraft began to study our home star. In the historical record, there are two instances of weak solar activity spanning multiple decades: the Maunder minimum in 1645–1715 and the Dalton minimum in 1790–1830. Compared to the 11-year solar cycle, these longer-term behaviors are more difficult to predict, and their causes are uncertain.
Jamie M. Jasinski and Marco Velli 2025 ApJL 990 L55. doi:10.3847/2041-8213/adf3a6
The post Selections from 2025: The Sun Changed Course in 2008 appeared first on AAS Nova.

Forecasting solar flares is one of the major challenges facing solar physicists today. New research finds that non-thermal emission can precede a solar flare by more than an hour, and this early emission may signal whether the flare will be accompanied by an explosion of plasma.

The Solar & Heliospheric Observatory (SOHO) took this coronagraphic image of a coronal mass ejection on 20 April 1998. [SOHO (ESA & NASA)]
Both solar flares and coronal mass ejections can disrupt everyday life on Earth, with flares knocking out radio communications and coronal mass ejections threatening spacecraft electronics and power grids. Given these real-life risks, as well as the potential for probing the physics behind the activity on the Sun and other stars, it’s critical to be able to identify signs of upcoming flares.
Luckily, there’s growing evidence that the Sun sends out subtle signals that a flare is soon to happen. One early sign of an impending flare is an increase in the non-thermal velocity of the plasma at the flare’s location. This phenomenon has been spotted in individual flares, but it hasn’t been studied and characterized for a large sample of flares — until now.

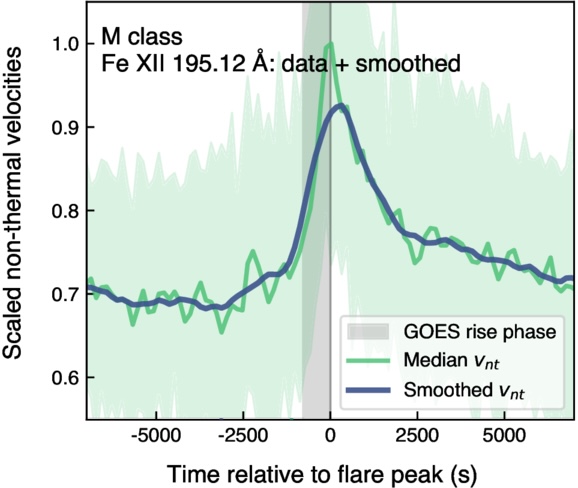
Demonstration of the increase in non-thermal velocity seen in an M-class flare compared to the onset and rise time of the soft X-ray flux (gray shaded area). [Adapted from To et al. 2025]
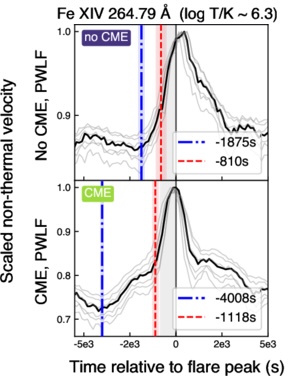
Of the flares in the sample, 83% were moderately powerful C-class flares, 18% were stronger M-class flares, and 1% were the most powerful X-class flares. To’s team identified a clear trend across all types of flares: the non-thermal velocity increases 4–25 minutes before the flare’s X-ray emission begins to rise, peaks when the X-ray emission peaks, and decays as the flare decays. The team found some evidence that for smaller flares, the velocity increase begins in spectral lines that trace cooler plasma before spreading to lines probing hotter plasma, but more work is needed to confirm this trend.
These results suggest that changes in the non-thermal velocity of solar plasma can not only signal when and where a flare is likely to arise, but also whether the flare will be accompanied by a potentially destructive coronal mass ejection. Upcoming missions like the Multi-slit Solar Explorer and SOLAR-C will give an even better view of the early stages of solar flares, helping to illuminate the physics behind them and enhancing our ability to forecast them.
“Systematic Nonthermal Velocity Increase Preceding Soft X-Ray Flare Onset: A Large-Scale Hinode/EIS Study,” Andy S. H. To et al 2025 ApJ 993 102. doi:10.3847/1538-4357/ae07de
The post How Solar Flares Hint That They’re About to Happen appeared first on AAS Nova.


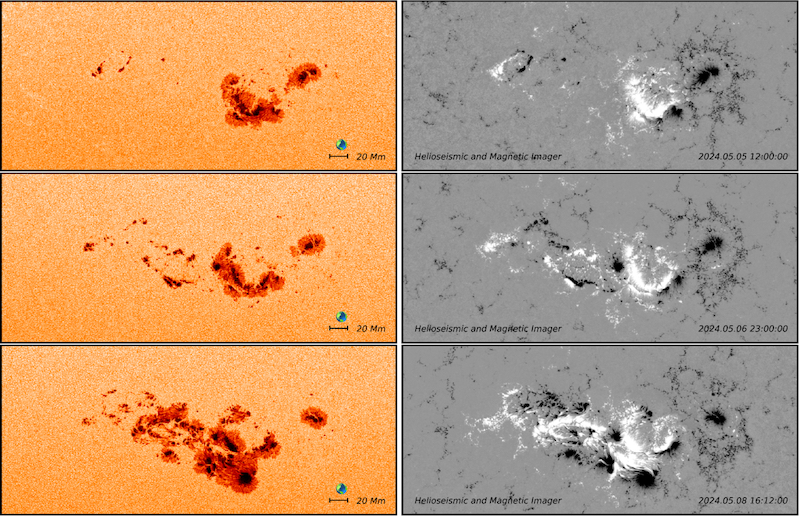
Evolution of a cluster of active regions as seen in continuum emission (left column) and radial magnetic field (right column). Click to enlarge. [Dikpati et al. 2025]
“Mother’s Day Superstorms: Pre- and Post-Storm Evolutionary Patterns of ARs 13664/8,” Mausumi Dikpati et al 2025 ApJ 988 108. doi:10.3847/1538-4357/addd09
The post Featured Image: Mother’s Day Superstorms appeared first on AAS Nova.

Spacecraft scattered throughout the solar system keep tabs on the solar wind, but the measurements are dotted with data gaps. How can scientists prevent these gaps from biasing their studies of the solar wind?

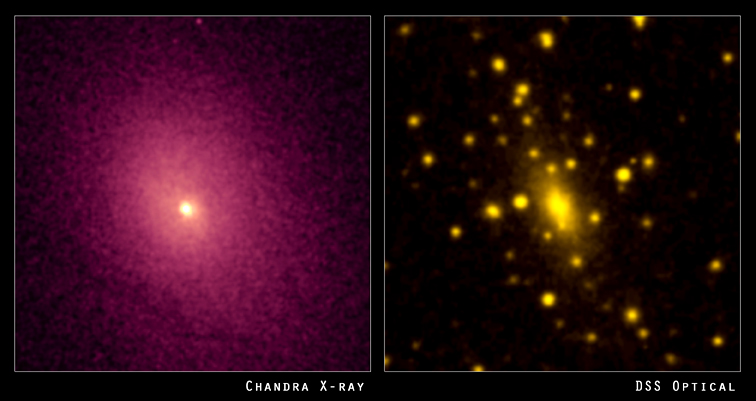
Left: the distribution of hot gas between the galaxies in the cluster Abell 2029. Right: the visible light from the galaxies in the cluster. [X-ray: NASA/CXC/UCI/A.Lewis et al. Optical: Pal.Obs. DSS]
Luckily, there are many spacecraft that sample the solar wind from various locations within our solar system. Unluckily, many of these spacecraft do not continuously monitor the solar wind. For example, when a spacecraft orbiting a planet dips into the planet’s atmosphere, this detour creates an hours-long gap in solar wind monitoring.
How do these data gaps affect studies of the solar wind? In a recent research article, Daniel Wrench and Tulasi Parashar (Victoria University of Wellington) approached this question in terms of how gaps affect the structure function: a mathematical description of how the solar wind fluctuates over different length or time scales.
Wrench and Parashar introduced random artificial gaps into data from the Parker Solar Probe, which monitors the solar wind continuously, and compared the structure functions calculated from the continuous and interrupted data sets. They used the difference between the true structure function — calculated from the continuous data set — and the structure functions from the artificially gapped data sets to develop a correction factor.

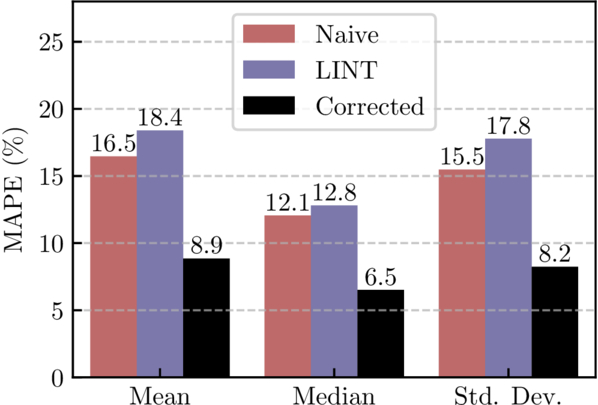
Performance of the correction factor method (black) compared to the uncorrected, gapped data (red) or gaps filled using linear interpolation (blue). MAPE is the mean absolute percentage error. [Wrench & Parashar 2025]

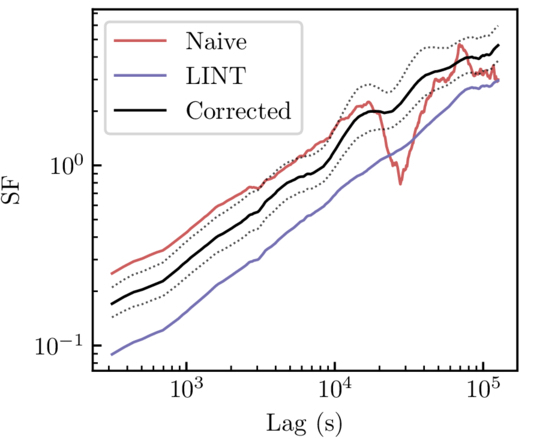
Structure function calculated from uncorrected Voyager 1 data (red), linearly interpolated data (blue), and corrected data (black). Both the linear interpolation method and the correction factor method remove the artifact around a lag of 3×10⁴ seconds, but the correction factor method does not suppress the signal like the linear interpolation method does. [Adapted from Wrench & Parashar 2025]
Finally, the authors applied their validated method to data from Voyager 1. Data from the two Voyager spacecraft are extremely scientifically valuable — no other spacecraft have ventured as far from the Sun and can measure the solar wind at such large distances. The data are also extremely sparse; one segment used in this work was missing 85% of the data. This means that an effective method of correcting these data has potentially huge scientific significance.
Wrench and Parashar applied their correction factor to the Voyager 1 data, showing that this method handily removes artifacts while avoiding the underestimation introduced by linear interpolation. While the authors saved the interpretation of the newly corrected Voyager 1 data for future research, this study makes it clear that even large data gaps needn’t hinder studies of the solar wind.
“Debiasing Structure Function Estimates from Sparse Time Series of the Solar Wind: A Data-Driven Approach,” Daniel Wrench and Tulasi N. Parashar 2025 ApJ 987 28. doi:10.3847/1538-4357/addc6a
The post Minding the Gaps in Solar Wind Data appeared first on AAS Nova.

The giant planet’s bow shock isn’t just deflecting the solar wind, it’s acting as a powerful particle accelerator, firing electrons to relativistic energies of at least 1 MeV, according to a new analysis of data from NASA’s Juno spacecraft.
The post Jupiter Accelerates Electrons to Near-Light Speed, Offering Clues to Cosmic Ray Origins appeared first on Sci.News: Breaking Science News.