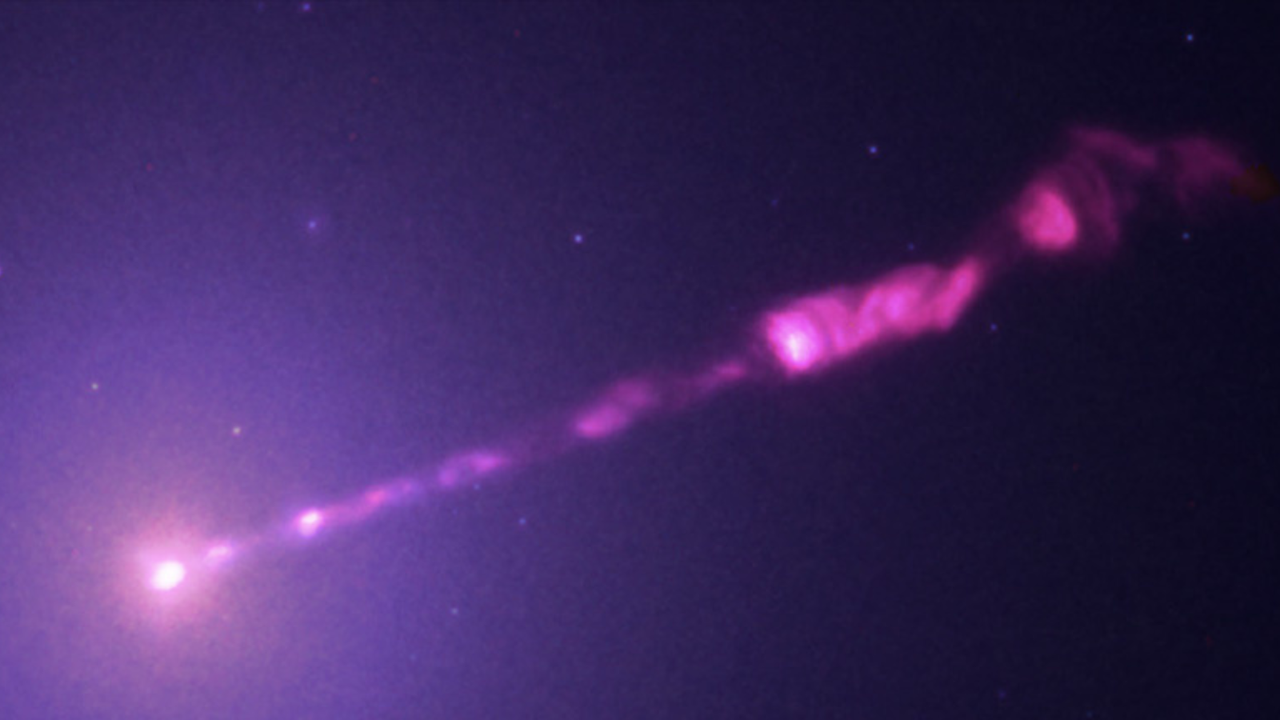
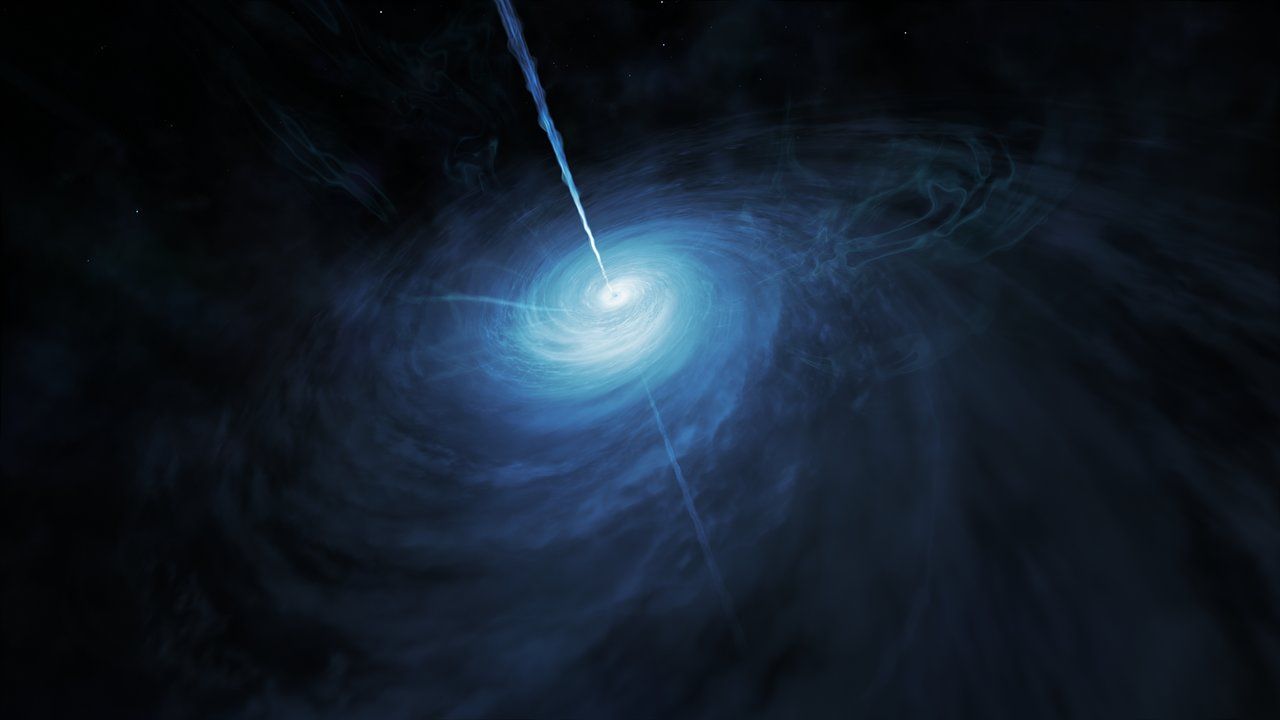
Astronomers have created a comprehensive census of active galactic nuclei (AGN) — galaxies powered by a feeding central black hole. The new census, led by data pipeline developer Mugdha Polimera at the Center for Astrophysics | Harvard & Smithsonian, began while she was a graduate student at the University of North Carolina at Chapel Hill,Continue reading "Active black holes are more common than we thought"
How supermassive black holes (SMBH) in the center of galaxies accrete material, how they feedback into the surrounding region, and how they regulate these to influence the evolution of their galaxies are all hot topics in astronomical/astrophysical research. Astronomers are nearly certain that all large galaxies like the Milky Way have a SMBH, and detailed […]
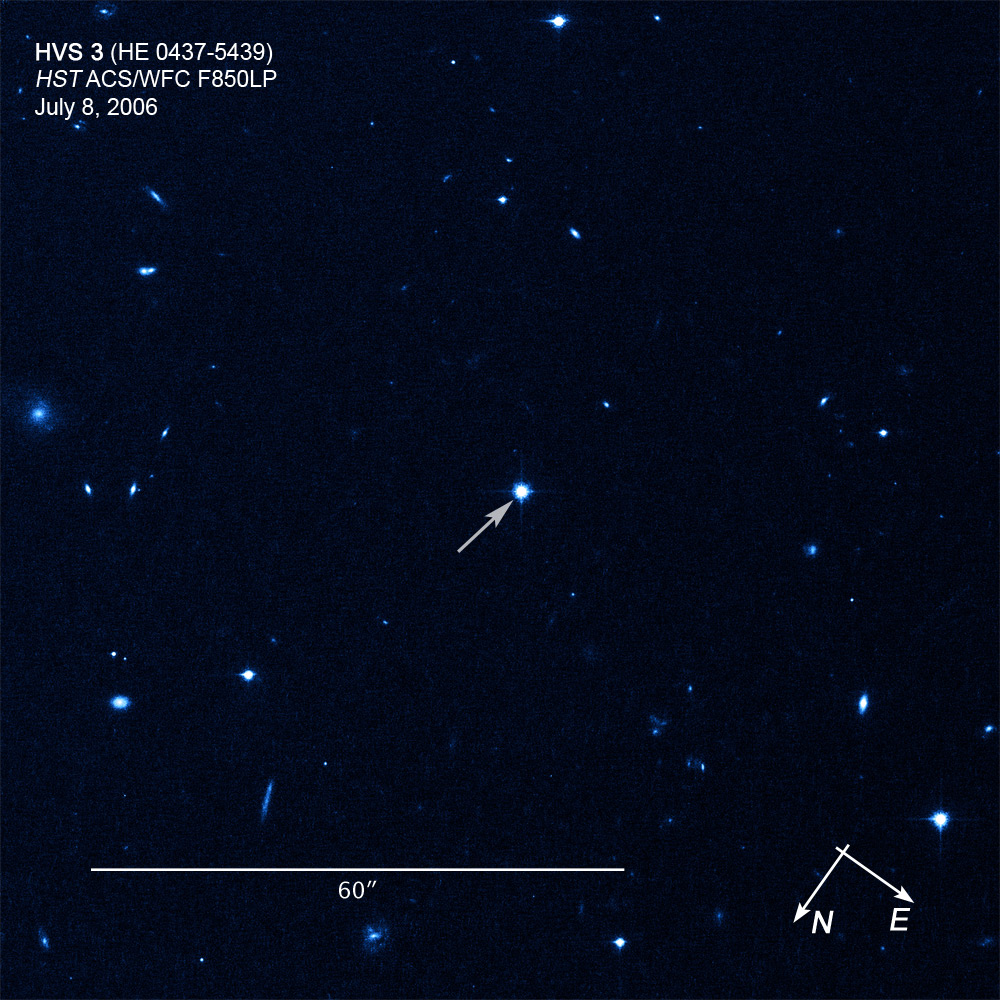
Zooming through the galaxy faster than they should, hypervelocity stars are a curious population of stars whose origins are often difficult to determine. A recent study presents the first evidence of an old, low-mass hypervelocity star launched from the Milky Way’s center, providing clues into this elusive set of fast-moving stars.
Astronomers have caught a number of hypervelocity stars zipping through the Milky Way since their first discovery in 2005. With speeds fast enough to escape the galaxy, hypervelocity stars were launched off course by some strong dynamical interaction. One such method, known as the Hills mechanism, predicts that when a binary star system approaches the Milky Way’s central supermassive black hole, one binary member is captured by the black hole and the other is flung away with high velocity.
However, constraining a hypervelocity star’s origin to the galactic center is limited by uncertainties in distances and proper motions, muddling how well researchers have been able to trace their orbits backward. Among a number of candidate galactic center–origin hypervelocity stars, only one has been confidently identified as having been kicked from the galaxy’s center. Intriguingly, this hypervelocity star and most galactic center–origin candidates are young, massive stars — old, low-mass hypervelocity stars from the galactic center have yet to be identified.
What does this dearth of old, low-mass zooming stars mean? Either stars in the galactic center are preferentially young and massive, with fewer than expected old and small stars, or low-mass hypervelocity stars are missed by selection effects, challenging to detect in current surveys. Searching for hypervelocity stars with higher precision and sensitivity may allow astronomers to tease out this missing population and trace back more zooming stars to a Hills mechanism origin.
Discovering An Old Hypervelocity Star
Leveraging high-quality spectra from the Dark Energy Spectroscopic Instrument (DESI) survey and precise astrometry from Gaia, Shunhong Deng (University of Chinese Academy of Sciences; China West Normal University) and collaborators reported the discovery of the hypervelocity star DESI-HVS1. From the spectroscopic and astrometric analyses, the authors determined that DESI-HSV1 is a ~14-billion-year-old low-metallicity star with a mass about 80% that of the Sun’s, moving through the galaxy at 523 km/s.
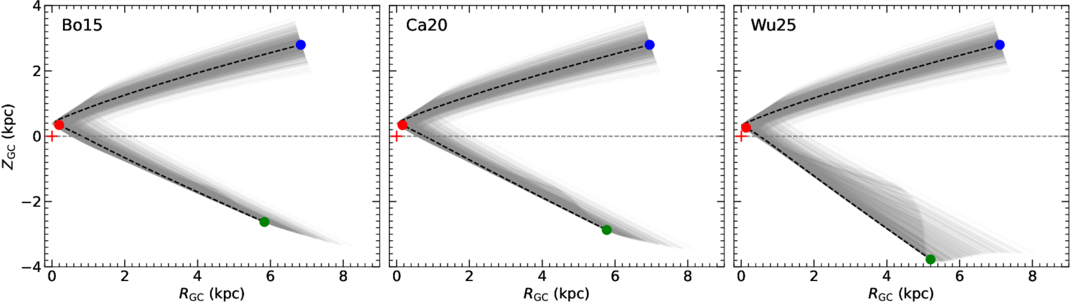
Backward-integrated orbits of DESI-HVS1 for three different galactic potential models. The blue, red, and green points show the star’s current position, closest approach to the galactic center, and position 50 million years ago, respectively. Click to enlarge. [Deng et al 2026]
Exploring the possible origins of this hypervelocity star, the authors integrated the star’s orbit backward in time for one billion years. The backward orbit integrations show the star approaching the galactic center where it then turns around, traveling away faster than the local escape velocity of the galaxy. Even when varying the galactic potential and constants, all orbit integrations suggest DESI-HVS1’s motion through the galaxy is most naturally explained by the Hills mechanism.
While more refined galaxy models and comparison to other candidate galactic center–origin hypervelocity stars are necessary to fully confirm its origins, DESI-HVS1 provides the first compelling evidence for an old, low-mass hypervelocity star candidate consistent with a galactic center launch. This suggests that the observed lack of such stars is likely not a reflection of the Milky Way’s central stellar population, but rather a consequence of observational constraints making such small hypervelocity stars particularly difficult to detect. As large spectroscopic and astrometric surveys continue to advance, the sample of galactic-center hypervelocity star candidates will grow, enabling further exploration of the stellar environment and dynamical processes at the Milky Way’s core.
Citation
“An Old, Low-mass, Metal-poor Hypervelocity Star Candidate Consistent with Galactic Center Origin,” Shunhong Deng et al 2026 ApJL 1003 L9. doi:10.3847/2041-8213/ae6505
NASA Webb Finds Strongest Evidence Yet for ‘Black Hole Stars’
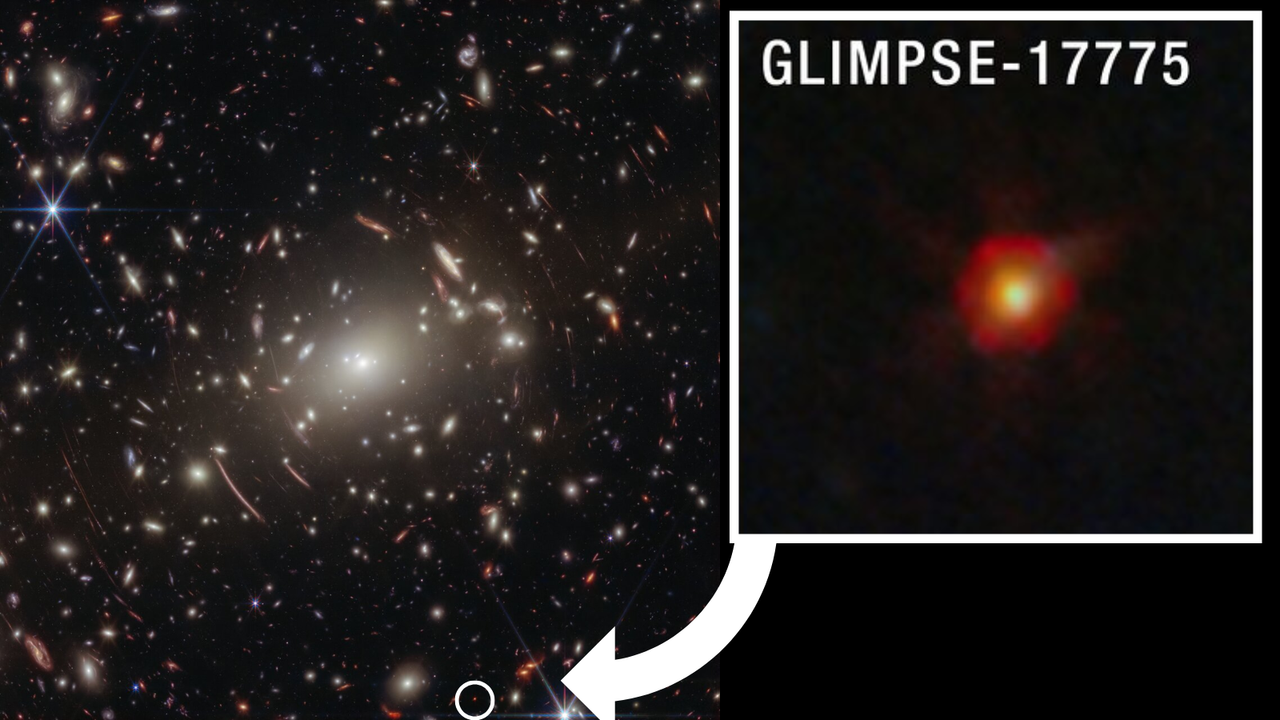
While the primary purpose of NASA’s James Webb Space Telescope’s observations of galaxy cluster Abell S1063 was to look for a certain population of stars, scientists obtained a detailed spectrum of GLIMPSE-17775 from the dataset. This little red dot is located behind Abell S1063.
Credits: Image: NASA, ESA, CSA, Vasily Kokorev (UT Austin); Image Processing: Alyssa Pagan (STScI)
The complex puzzle known as little red dots has become more complete since their initial discovery by NASA’s James Webb Space Telescope in 2022. Now a particular little red dot’s spectrum is helping connect many of the pieces.
A team of astronomers led by Vasily Kokorev at the University of Texas at Austin identified the lucky dot in question: GLIMPSE-17775. By carefully analyzing the dot’s spectrum captured by Webb — the deepest spectrum to date of a little red dot — the research team has identified multiple lines of evidence, all of which support the interpretation that GLIMPSE-17775 is a supermassive black hole enveloped in a dense cocoon of partially ionized gas, a model referred to as the BH* (black hole star) scenario. A paper describing the results was published today in The Astrophysical Journal.
“I think part of the scientific community is converging on a singular picture — that little red dots can be explained by black hole star models. But none of the previous little red dots have all of the pieces of evidence in the same place,” said Kokorev, lead author of the study. “With GLIMPSE-17775 we can test these models because of how deep and amazing this source’s spectrum is.”
Image: Abell S1063 with Pullout of GLIMPSE-17775 (NIRCam Image)
While the primary purpose of NASA’s James Webb Space Telescope’s observations of galaxy cluster Abell S1063 was to look for a certain population of stars, scientists obtained a detailed spectrum of GLIMPSE-17775 from the dataset. This little red dot is located behind Abell S1063.
Image: NASA, ESA, CSA, Vasily Kokorev (UT Austin); Image Processing: Alyssa Pagan (STScI)
Connecting puzzle pieces
Soon after Webb first began science operations, it discovered a new, mysterious type of object in the very early universe – abundant red objects that emerged about 600 million years after the big bang. Scientists have explored multiple explanations for these little red dots, including the black hole star scenario.
A set of fortunate circumstances brought about this new, elaborate spectrum of a little red dot. The little red dot that would come to be known as GLIMPSE-17775 was fortunately included in Webb’s imaging and spectroscopy efforts for a project that sought to look for Population III stars and faint galaxies in galaxy cluster Abell S1063. This little red dot is more distant than the galaxy cluster and magnified by gravitational lensing. (GLIMPSE-17775 has a cosmological redshift of 3.5, meaning it existed about 1.8 billion years after the big bang.)
While Webb provided a 30-hour spectrum of the little red dot, the effect of gravitational lensing made it equivalent to 80 hours of telescope time. This combination of Webb’s infrared sensitivity and nature’s own “magnifying glass” amplified the amount of detail that could be gleaned from GLIMPSE-17775. The result was more than 40 spectral lines from this small, red source, which is the most detailed little red dot spectrum to date.
“When we saw the spectrum for the first time, it was like having all the pieces of a puzzle scattered on the floor,” said Kokorev. “We picked up each piece of the puzzle, measured the lines, and started combining the different pieces into a mosaic. Maybe a few pieces looked like nothing at first, but then a couple of them came together, and we realized that there was something there.”
The spectroscopic data collected by Webb contains multiple lines of evidence that support the interpretation that little red dot GLIMPSE-17775 is a black hole star: a rapidly accreting, or growing, black hole enveloped in a dense gas cocoon, which is reprocessing the light emitted from near the black hole and producing the features seen in the spectrum.
Image: Evidence of a ‘Black Hole Star’
NASA’s James Webb Space Telescope captured the deepest spectrum to date of a little red dot. More than 40 spectral lines have been discerned from the data, many of which independently support the theory that GLIMPSE-17775 is a black hole enshrouded by a hot, dense gas cocoon.
Illustration: NASA, ESA, CSA, Vasily Kokorev (UT Austin); Designer: Leah Hustak (STScI)
Lines of evidence
Among the 40-plus lines that the team detected in GLIMPSE-17775’s spectrum were various independent indicators that all align with the BH* scenario. For example, the team found that many of the spectral lines, such as hydrogen, oxygen, and helium, do not fit a simple model of a rotating gas cloud. Instead, the best fit model includes a broadening effect known as electron scattering, a telltale sign that a dense, layered gas cocoon is enshrouding this source.
The strength and ratios of certain lines to each other, most notably the 16 iron lines that compose what the team has dubbed an “iron forest” and certain oxygen lines, require a high-energy source to produce them, like a rapidly accreting black hole. Additionally, astronomers noted the fluorescence and absorption of helium in the spectrum, both of which individually suggest that there is a dense medium enveloping a powerful source.
The BH* scenario not only fits GLIMPSE-17775; it also accounts for why most little red dots are faint in X-rays, since any such emission is likely absorbed by the dense gas cocoon.
One missing element of the GLIMPSE-17775 puzzle piece is the part of the spectrum that would reveal what’s known as a Balmer break, or a strong dip in the emitted light that’s a signature characteristic of little red dots. To build a more comprehensive understanding of this little red dot, the team incorporated ancillary data from two observing programs that used NASA’s Hubble Space Telescope: the Frontier Fields and BUFFALO (Beyond Ultra-deep Frontier Fields And Legacy Observations) programs.
The Webb and Hubble data together help explain why the Balmer break is weaker than what typically is found in other little red dots: A giant host galaxy is surrounding GLIMPSE-17775. Although a little red dot’s host galaxy is not something that has been usually seen at such scale before, it isn’t inconsistent with the dense gas cocoon model. The black hole star model of little red dots attributes excess blue light to stars in the host galaxy.
When Webb first discovered little red dots, some researchers thought these objects had “broken cosmology,” unsure how galaxies could have grown so big so quickly in the early universe to account for all this light coming from their stars. However, the team believes the GLIMPSE-17775 puzzle piece fits nicely in the existing framework of the universe’s evolutionary history, because black hole masses don’t need to be as high in order to explain the broad emission lines.
“Everything fits, nothing is broken, and I think that makes the puzzle that is our universe even better,” said Kokorev. “Looking ahead, I’m eager to dive deeper and learn about what is powering the central engines of little red dots. While we think it’s a black hole, there are some other interesting theories being proposed, which is exciting. Maybe in a year or two, we’ll have the final answer to what powers these sources.”
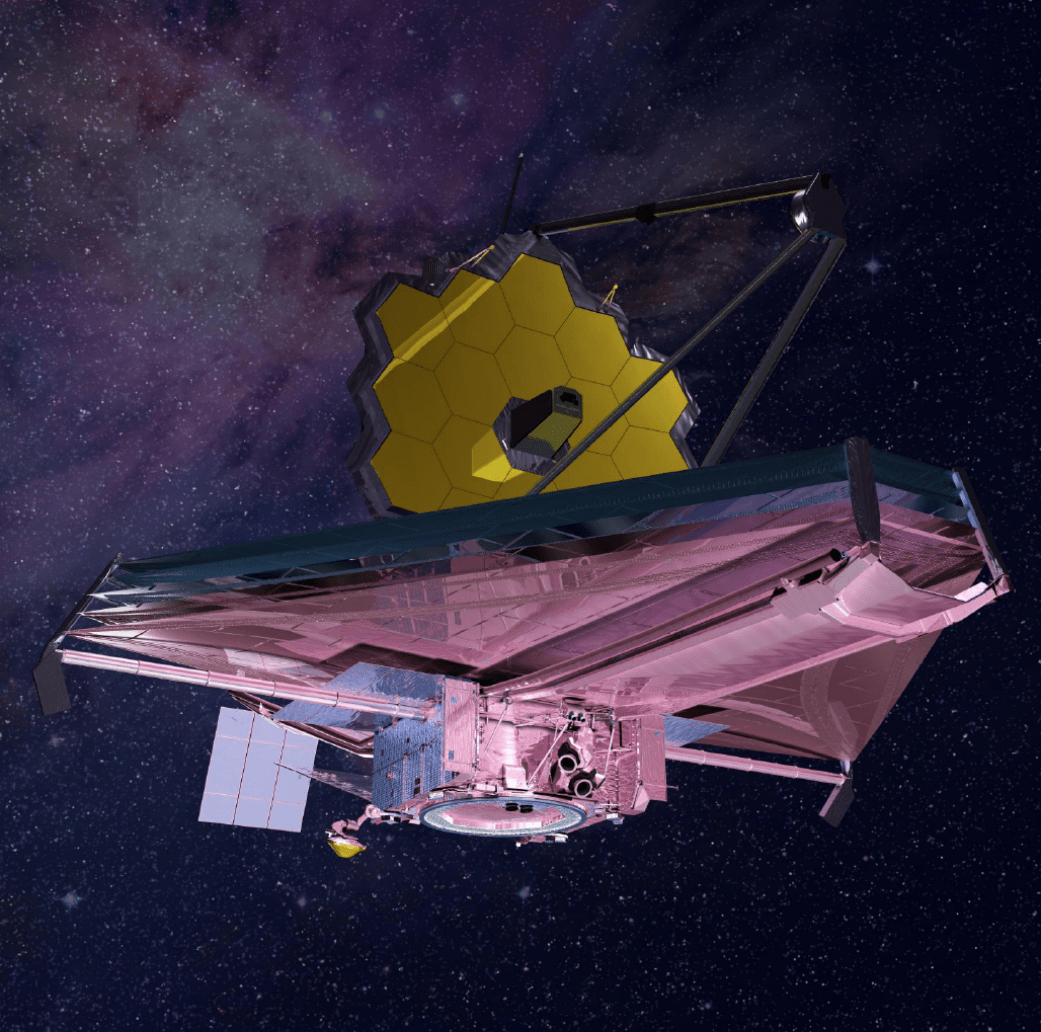
The James Webb Space Telescope is the world’s premier space science observatory. Webb is solving mysteries in our solar system, looking beyond to distant worlds around other stars, and probing the mysterious structures and origins of our universe and our place in it. Webb is an international program led by NASA with its partners, ESA (European Space Agency) and CSA (Canadian Space Agency).
The following sections contain links to download this article’s images and videos in all available resolutions followed by related information links, media contacts, and if available, research paper and Spanish translation links.
Related Images & Videos
Abell S1063 with Pullout of GLIMPSE-17775 (NIRCam Image)
While the primary purpose of NASA’s James Webb Space Telescope’s observations of galaxy cluster Abell S1063 was to look for a certain population of stars, scientists obtained a detailed spectrum of GLIMPSE-17775 from the dataset. This little red dot is located behind Abell S1063.
Evidence of a ‘Black Hole Star’
NASA’s James Webb Space Telescope captured the deepest spectrum to date of a little red dot. More than 40 spectral lines have been discerned from the data, many of which independently support the theory that GLIMPSE-17775 is a black hole enshrouded by a hot, dense gas cocoon.
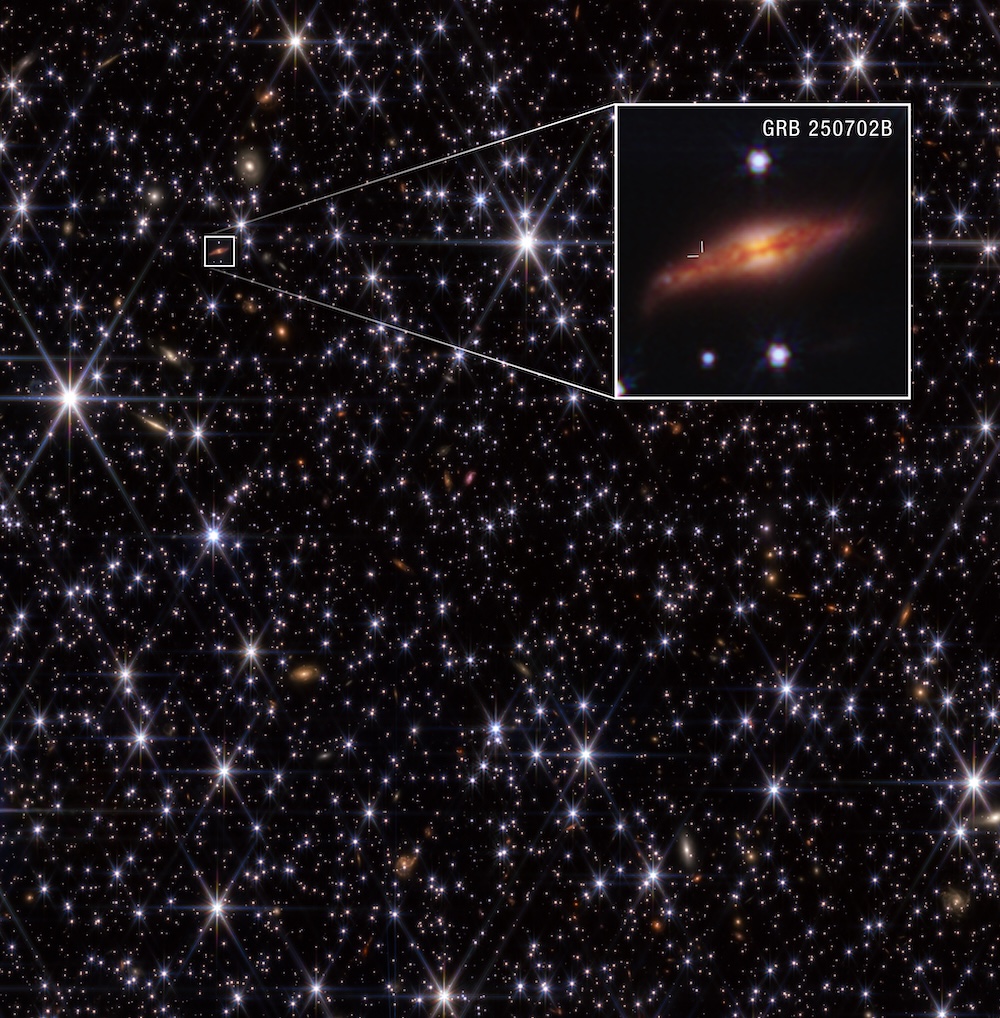
What’s the story behind the longest gamma-ray burst ever observed? Researchers explore how repeated interactions between a white dwarf and an intermediate-mass black hole could explain GRB 250702B’s unusual properties.
In 2025, the Fermi Gamma-ray Space Telescope spotted an intense flash of gamma rays from a distant, dusty galaxy, and a fleet of spacefaring and earthbound telescopes soon revealed the remarkable characteristics of the event. GRB 250702B featured multiple bursts spanning several hours, individual flares lasting roughly 100 seconds, and X-ray emission in the 24 hours leading up to the gamma-ray activity — something never seen before in a gamma-ray burst.
These characteristics have been challenging to explain with typical models of long gamma-ray burst formation, such as collapsing massive stars, but researchers have developed numerous promising alternatives. In a new research article, astronomers have shown how GRB 250702B’s behavior might be explained by repeated close encounters between a white dwarf and an intermediate-mass black hole.
Eccentric Close Encounters
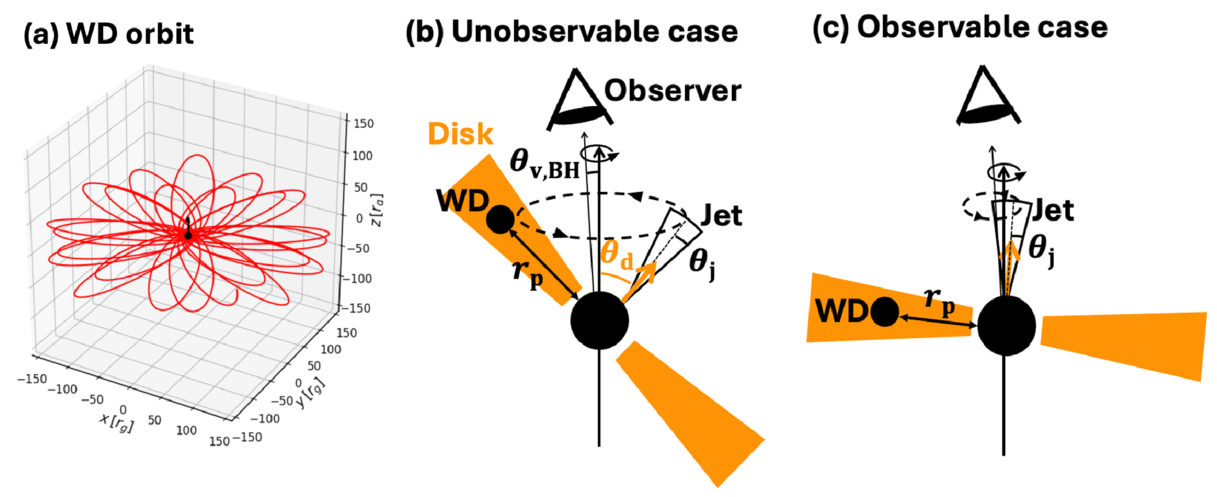
Yuri Sato (Tohoku University) and collaborators modeled the source of GRB 250702B as a white dwarf that has been captured into orbit around an intermediate-mass black hole. In their model, the white dwarf travels on an extremely eccentric orbit, drawing close to the black hole roughly once an hour. Each time the white dwarf ventures close, the black hole’s tidal forces strip away part of the star until, after about 40 such encounters, the white dwarf is completely destroyed.
Schematics showing the orbit of the white dwarf (WD; left) and the geometries that produce observable and unobservable jets. Click to enlarge. [Sato et al. 2026]
When the black hole peels material away from the white dwarf, some material swirls into an accretion disk, and some is cast off into space. Accretion from the disk powers a narrow relativistic jet: the source of the event’s powerful gamma-ray flares. This should mean that there is one jet produced each time the white dwarf is partially disrupted — 40 times — yet astronomers detected only a handful of flares from GRB 250702B.
Jet Precession and Model Predictions
The discrepancy can be resolved if the angle between the jet and the black hole’s spin axis precesses over time so that only some of the jets are pointed toward us. This can occur if the accretion disk is misaligned relative to the black hole’s spin. As an alternative, disk instabilities or other processes could keep all but a few of the expected jets from being launched.
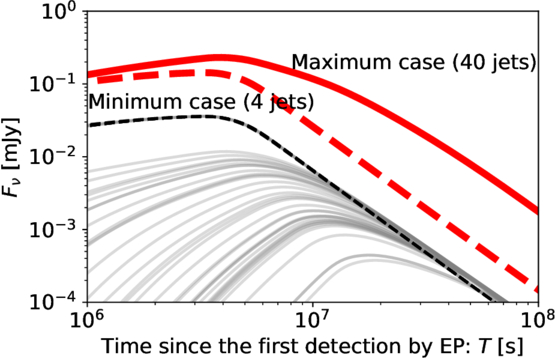
Predicted strength of the radio afterglow for the jet precession case (maximum case) and the case in which only four jets were launched due to disk instabilities or jet choking (minimum case). The x-axis shows the time since the burst was detected in X-rays by the Einstein Probe (EP). [Sato et al. 2026]
Sato and coauthors found that these two scenarios have different long-term outcomes, providing a potential way to ascertain what’s going on at the source; in the jet precession scenario, the jets that are launched away from our line of sight produce an order of magnitude more radio emission at late times.
This work by Sato and collaborators demonstrates how the repeated partial tidal disruption of a white dwarf by an intermediate-mass black hole can match the properties of one of the most remarkable recent transient sources — one that has pushed astronomers to consider new ways of producing gamma-ray bursts.
Citation
“Successive Partial Disruptions with Orbital Precession in a White Dwarf–Black Hole System for Repeating GRB 250702B,” Yuri Sato et al 2026 ApJL1003 L44. doi:10.3847/2041-8213/ae6a8f
Astronomers have discovered a distant quasar powered by a feeding supermassive black hole blasting out winds at record-breaking speeds for such an outflow seen in ultraviolet light, traveling at 30% the speed of light.
By taking general relativity into higher dimensions, a trio of physicists has proven that a mathematical pattern of ripples in space-time geometry could give rise to naked singularities and microscopic black holes.
Where do black hole mergers happen? Recent research finds evidence that most black hole mergers occur in triple systems containing a close inner binary and a more distant third party.
Assembling Merging Black Holes
Thanks to the combined efforts of the LIGO, Virgo, and KAGRA gravitational wave detectors, we’ve now collected the subtle signals from several hundred pairs of merging stellar-mass black holes. As this collection of spacetime ripples continues to grow, researchers are seeking to understand how these merging black hole pairs were assembled.
In the simplest scenario, pairs of high-mass stars independently evolve into black holes, lose momentum by emitting gravitational waves, and meld into one another. But the population of merging black holes likely contains contributions from multiple sources, including multiple-star systems, the disks surrounding accreting supermassive black holes, and black holes that have already experienced a merger. Which of these merging populations is reflected in our catalog of gravitational wave events?
Modeling Challenges
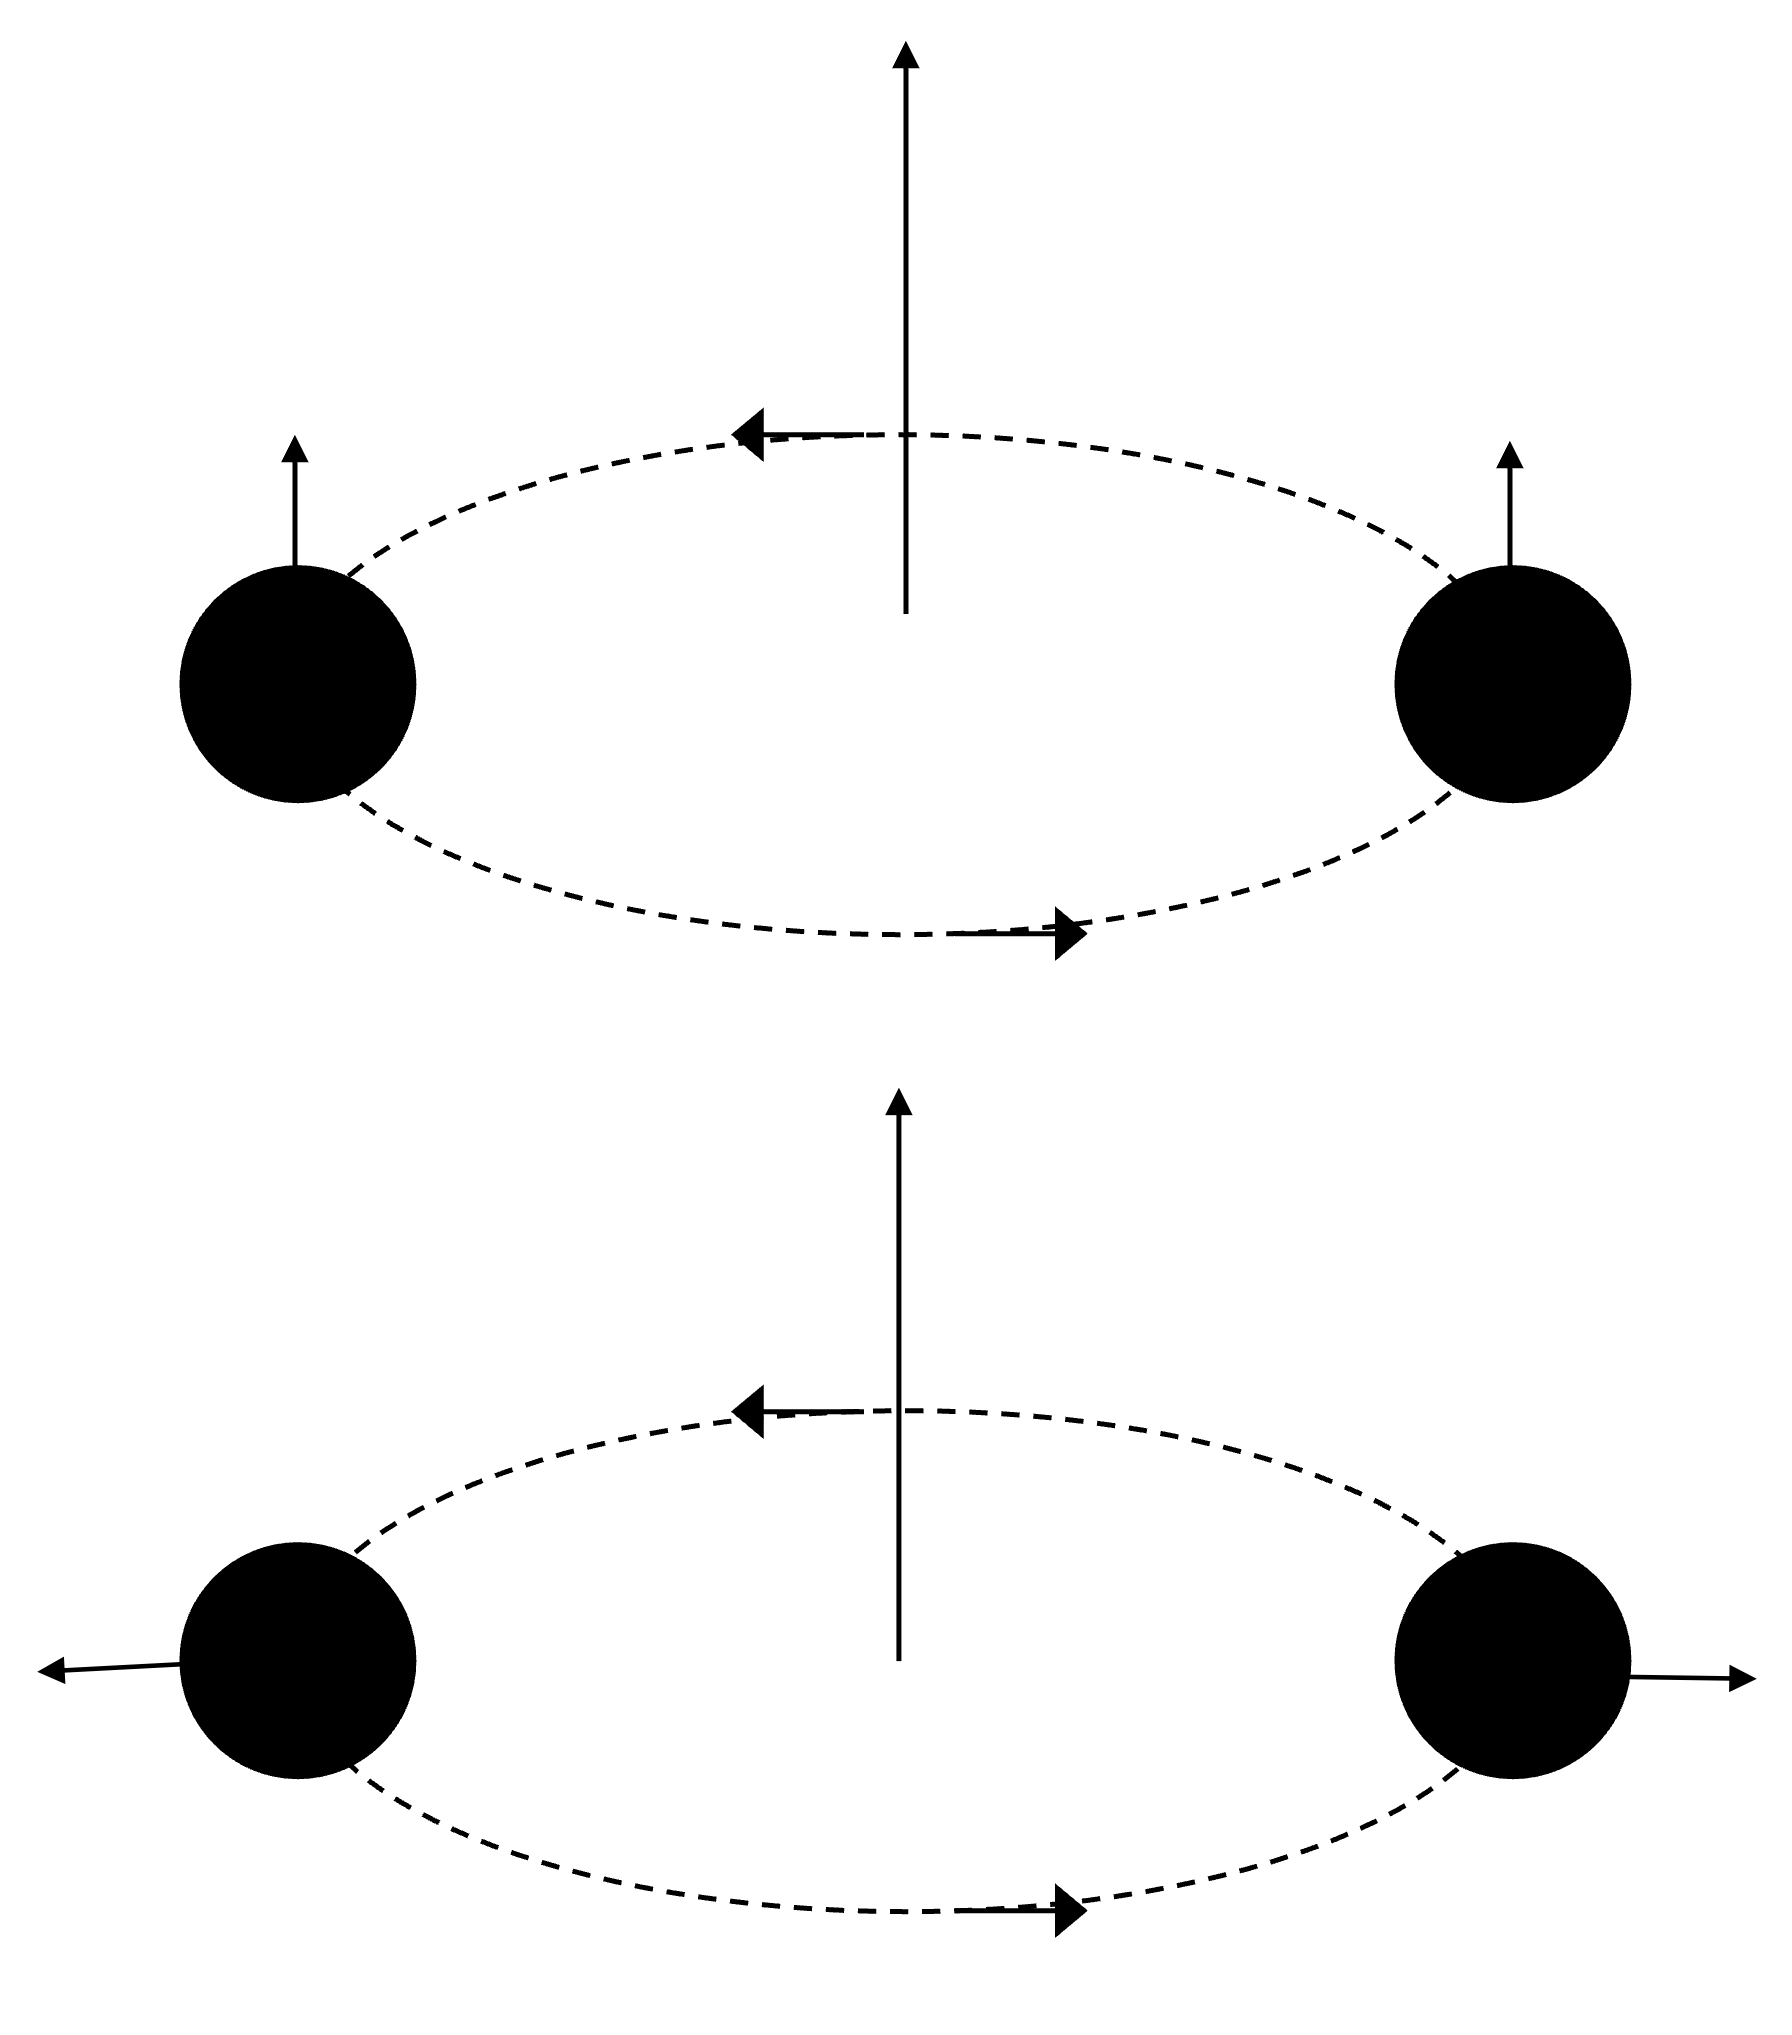
A black hole binary system with aligned spins and orbit (top) and a binary with spins tilted by 90 degrees (bottom). [AAS Nova/Kerry Hensley]
In theory, this question can be answered by extracting the properties of merging black holes — mass, spin, and the like — from gravitational wave observations and comparing these properties against model predictions from different formation pathways. In reality, this is exceedingly difficult, as certain merger pathways can produce a wide variety of results, depending on assumptions or fine tuning.
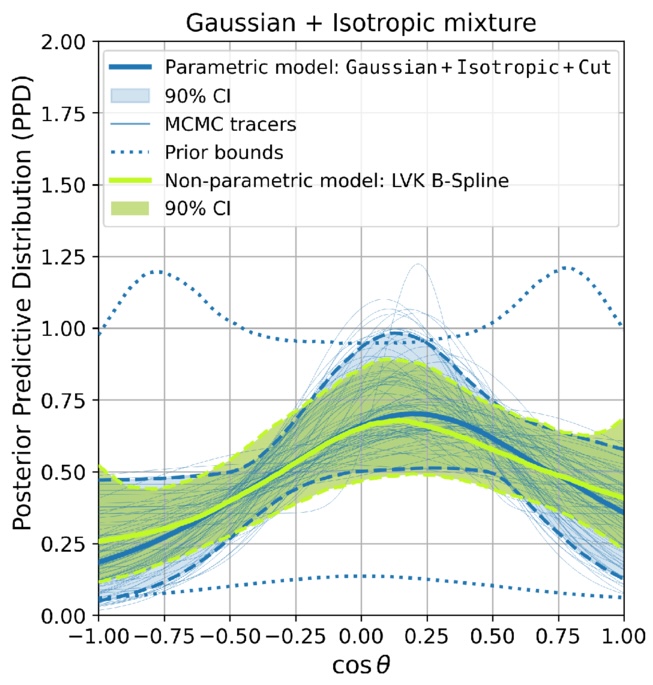
So far, the increasingly large pool of gravitational wave detections tentatively points to a feature that could illuminate the sites of black hole mergers: a peak in the spin–orbit tilt distribution around 90 degrees. This feature has been most confidently extracted from nonparametric analyses, which do not make assumptions about the population of merging black holes, but it has also been hinted at in parametric analyses, which do make population-level assumptions.
Triple-System Feature
To investigate this feature further, a team led by Jakob Stegmann (Max Planck Institute for Astrophysics) performed a new, astrophysically motivated parametric analysis of the most recent catalog of gravitational wave detections from LIGO, Virgo, and KAGRA.
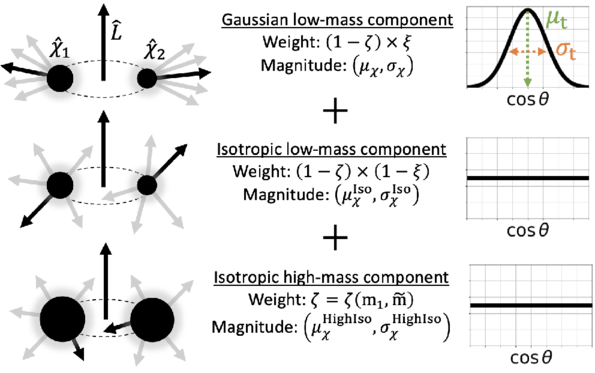
The three populations in the team’s modeling. [Stegmann et al. 2026]
Their modeling tests combinations of multiple populations, including mergers in isolated binary systems, triple-star systems, and dense environments like star clusters. They also include a potential contribution from higher-mass mergers involving black holes that have merged previously. Using this framework, Stegmann’s team found that the observed spin–orbit tilt distribution is best matched by a model dominated by mergers in triple-star systems, with some contribution from other sources.
Posterior predictive distribution of black hole spin–orbit tilts. Both the authors’ modeling (solid blue line) and the nonparametric modeling performed by the LIGO–Virgo–KAGRA collaboration (solid green line) find evidence for a peak in the spin–orbit tilt distribution near cosθ = 0. [Adapted from Stegmann et al. 2026]
Specifically, this finding suggests that most mergers occur in hierarchical triple systems, which naturally predict an excess of 90-degree spin–orbit tilts without any fine tuning. Hierarchical triples contain an inner close binary with a distant outer companion; in these systems, relativistic spin precession, gravitational wave emission, and oscillations in eccentricity and inclination work to tilt the black holes in the inner binary by 90 degrees.
Stegmann and collaborators pointed out that the triple-system scenario aligns well with other properties of the observed population of black hole mergers, such as the mass and effective spin distributions. This scenario may also be necessary to explain certain merging pairs that might have had slightly eccentric orbits at the moment of merging. If future gravitational wave observations strengthen the evidence for a peak in the spin–orbit tilt distribution near 90 degrees, it will have profound implications for how and where black holes merge in our universe.
Citation
“Gravitational-Wave Observations Suggest Most Black Hole Mergers Form in Triples,” Jakob Stegmann et al 2026 ApJL1000 L59. doi:10.3847/2041-8213/ae52ec
Editor’s Note:Astrobites is a graduate-student-run organization that digests astrophysical literature for undergraduate students. As part of the partnership between the AAS and astrobites, we occasionally repost astrobites content here at AAS Nova. We hope you enjoy this post from astrobites; the original can be viewed at astrobites.org.
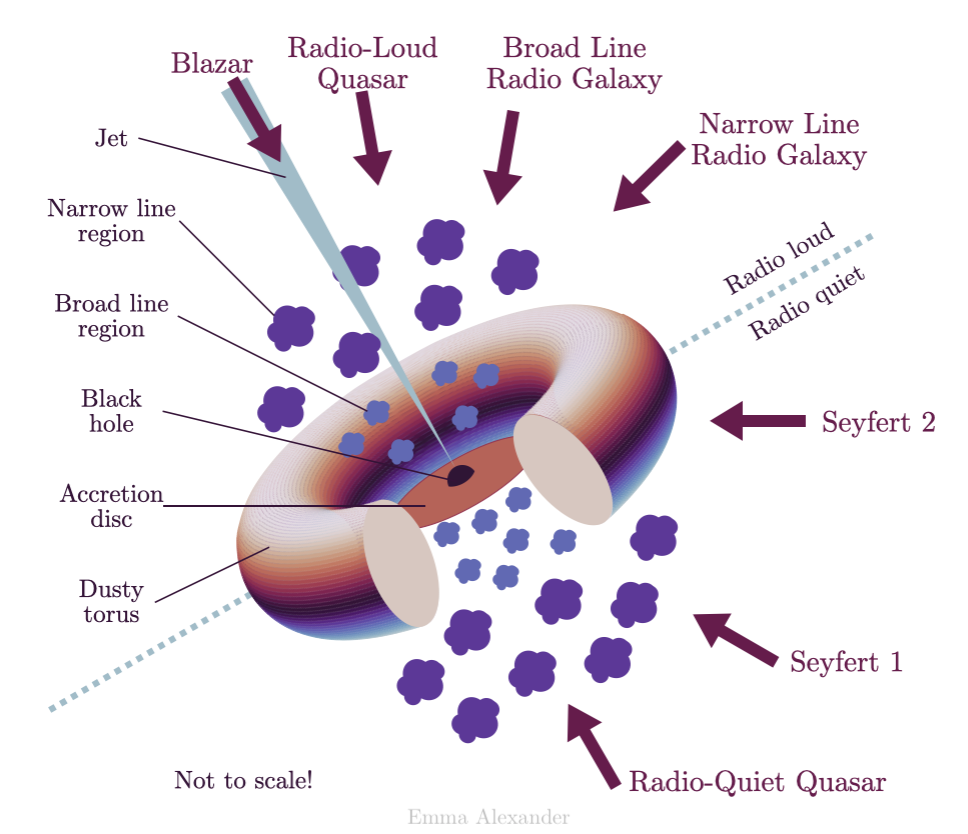
At the centre of nearly every galaxy lies a supermassive black hole that dominates this innermost region. Not only is there this millions-of-solar-masses dark beast, but usually too a whole bunch of stuff — stars, gas, dust, and more — which is often quite bright! When there is plenty of this material quite close to the black hole, we believe physics takes control to flatten it into a family of disk and toroidal structures in what we call the unified model of active galactic nuclei (AGNs; see Figure 1).
Figure 1: The unified model of AGNs asserts that there is an inner accretion disk, surrounded by a dusty torus that cohabitates with clouds moving at different velocities (the so-called broad and narrow line regions), and sometimes even relativistic jets extending from the accretion disk to galactic scales; you can read more about AGN structure in this Astrobites guide. [Emma Alexander; CC BY 4.0]
When astronomers look at different active galaxies (read: galaxies with active supermassive black holes at their core), we see a range of phenomenologies related to their brightness, spectra, morphologies, and more. The unified model of AGNs seeks to explain these different AGN appearances simultaneously by positing that they all have the same physical structure, and we are just viewing them from different angles, hence seeing different features.
The cores of AGNs are often imaged at the smallest scales (e.g., their accretion disks, viewed with interferometers like the Very Large Telescope Interferometer) and the largest scales (e.g., their relativistic jets, viewed with radio interferometers), but comparatively less effort has gone to directly observing the predicted dusty tori in the mid-infrared. That is exactly what today’s authors set out to do using the Large Binocular Telescope Interferometer (LBTI) — a pair of 8.4-metre-aperture mirrors separated by just over 14 metres and combined to simulate a telescope effectively 29 metres wide. This lets astronomers take direct images at a much higher resolution than a smaller-aperture telescope, and hence directly peer into the region around AGNs where this dusty torus should lie.
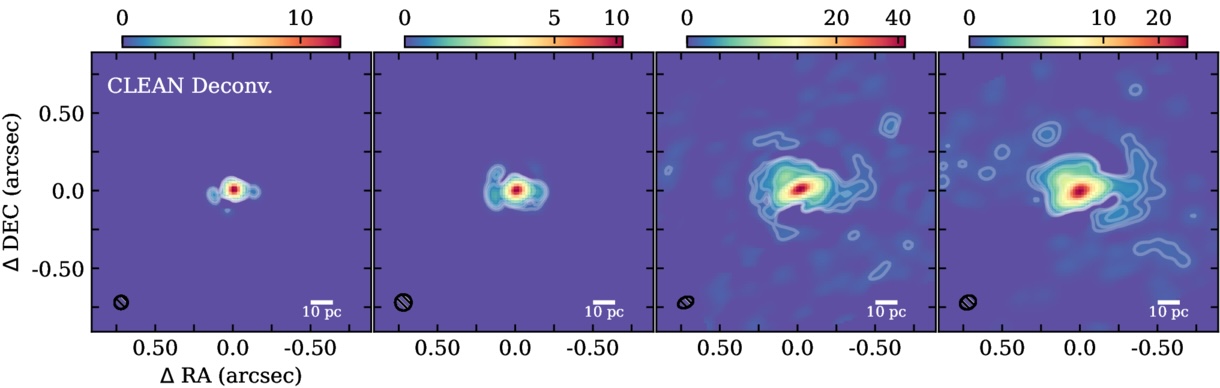
Today’s authors turn the LBTI towards NGC 4151, a medium-luminosity AGN. With the large effective aperture of the LBTI, they were able to resolve scales in the AGN region as small as 4.4–9.1 pc, about 14–30 light-years depending on the wavelength (see Figure 2), in the mid-infrared. These observations revealed warm dust emission in a complex structure around the central supermassive black hole. The authors note a central bar at all wavelengths, with a significant extension of cool dust arcing to the west (right in the image) and warmer dust localised to the centre (as evident by 3.7- and 4.8-micron emission only nearest to the supermassive black hole and its accretion disk).
Figure 2: The deconvolved images of the AGN core of NGC 4151 show a very bright central source (the innermost region around the supermassive black hole), as well as some complex surrounding structure particularly at long wavelengths. The interpreted morphology is described in Figure 3. These images are deconvolved, meaning that known optical effects are corrected for on the raw data to produce a sharper image. [Adapted from Isbell et al. 2026]
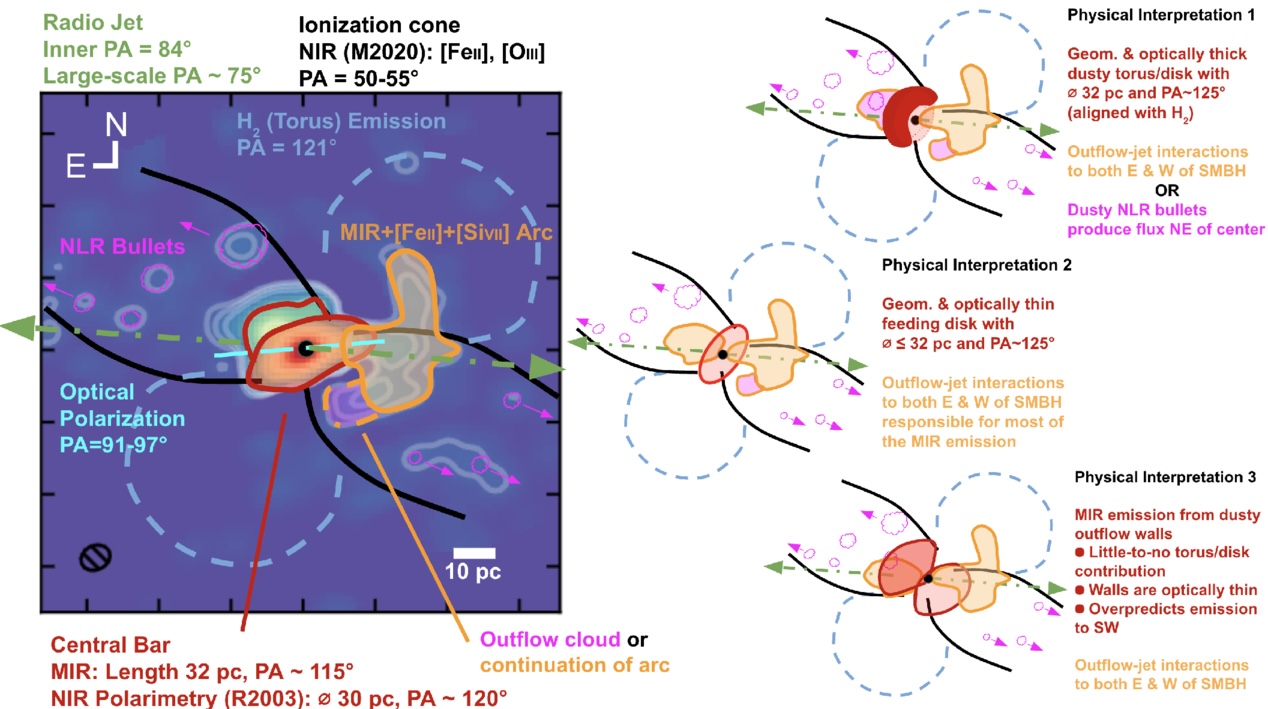
To explain the observed morphology in Figure 1, the authors compare three different interpretations based on this new high-resolution imagery together with the results of previous studies looking at other scales and the spectrum of the AGN core. Each interpretation is illustrated and briefed in Figure 3.
Figure 3: Three interpretations of the observed morphology are presented by the authors. The left panel illustrates the different regions surrounding the supermassive black hole (together with the results of other studies cited in the article). The right panel shows the suggested interpretations explaining the morphology. [Isbell et al. 2026]
The first interpretation is in keeping with the unified model of AGNs: a geometrically and optically thick torus of dust surrounds the inner region. In this interpretation, the surface of the dusty torus re-radiates light from the accretion disk to produce most of the mid-infrared emission. Additional mid-infrared emission could come from localised concentrations of gas or interactions between the outflow and the jet. The authors immediately disfavour this explanation, as other studies have shown bright ionised emission at the location of the would-be torus, which is not expected if an optically thick torus were to be present. Hence, these new observations somewhat challenge the one “flavour” of the unified model of AGNs.
The second interpretation aligns with a different version of the unified model: one in which a geometrically thin disk replaces a thick torus around the AGN core. Provided the disk is optically thin too, the authors favour this approach as it is consistent with the geometry of ionised emission that worked against the first interpretation. While other studies suggest that this thin disk should be optically thick, this morphology is at least better aligned with what we see in other AGNs.
The third interpretation suggests that the emission comes from only the radiation pressure–driven wind emanating from the AGN core. The authors disfavour this explanation, citing previous radiative transfer simulations that show that the flux should fall off with distance from the core too quickly to be consistent with the observations.
No matter the interpretation, these LBTI observations are an important glimpse into the future of mid-infrared AGN studies that will be done with 30-metre-class telescopes (such as the European Southern Observatory’s Extremely Large Telescope). This article, together with the group’s similar study on NGC 1068, is challenging and refining an accepted view of AGN morphology — the consequences of which apply to galaxies near and far — and poses new questions perfect for sophisticated hydrodynamic and radiative simulations.
Original astrobite edited by Margaret Verrico.
About the author, Ryan White:
I am a first-year PhD student at Macquarie University in Australia, working mainly on binary/multiple systems with massive stars (Wolf–Rayets in particular!). Outside of study, I’m probably drinking coffee, baking, reading, or going for a run. You can also find me procrastinating on Bluesky @astroryan.bsky.social.
The core of the brightest galaxy in the cluster Abell 402 contains a curious void. New observations suggest that an ultra-massive black hole could have excavated this feature.
At the Center of the Center of a Cluster
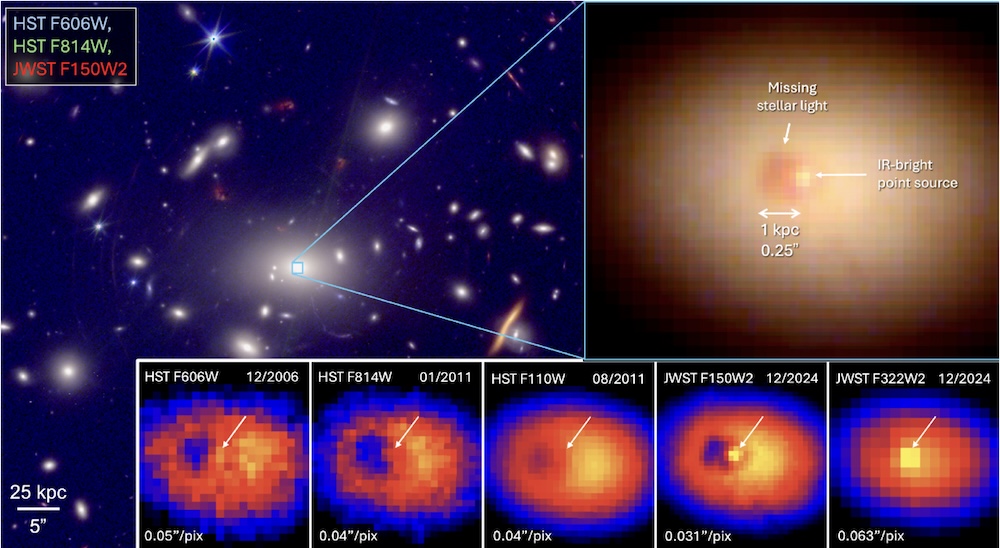
JWST and Hubble observations of A402-BCG. In addition to the dark cavity previously seen by Hubble, the galaxy’s center hosts an infrared-bright source. Click to enlarge. [McDonald et al. 2026]
Abell 402 is a galaxy cluster located roughly 4 billion light-years away, and at its center is a giant elliptical galaxy called A402-BCG. Zooming in on the heart of this galaxy, astronomers using the Hubble Space Telescope discovered a dark region that they suspected was due to a cloud of dust blocking the starlight from the galaxy’s center.
In a recent research article, a team led by Michael McDonald (Massachusetts Institute of Technology) investigated this dark region to test the dust-cloud hypothesis and explore other explanations.
McDonald’s team compiled new JWST Near-Infrared Camera data, archival Hubble imaging, and spectroscopy from the Multi Unit Spectroscopic Explorer (MUSE) on the Very Large Telescope. The new JWST images show a prominent dark feature at the center of A402-BCG, plus a bright source directly beside it.
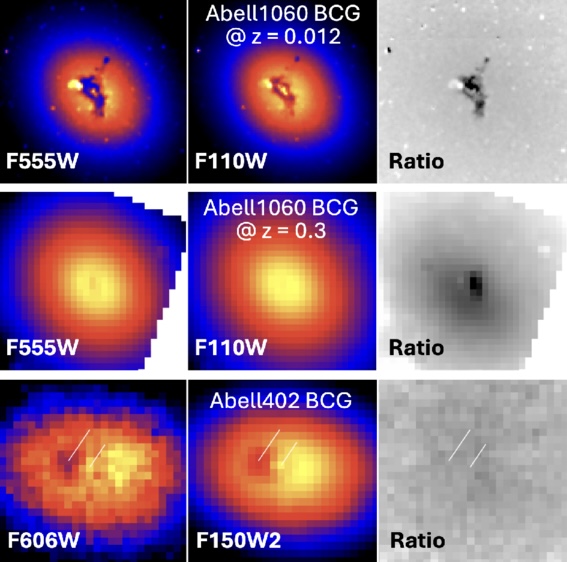
Comparison of the cavity in A402-BCG (bottom row) to the dust ring in Abell 1060’s central galaxy (top row). In the middle row, simulated observations show Abell 1060’s central galaxy at A402-BCG’s redshift. The appearance of the dust ring is wavelength dependent, but the appearance of A402-BCG’s cavity is not. [Adapted from McDonald et al. 2026]
Not Hidden, but Missing
If the dark feature at the center of A402-BCG is a dust cloud, the cloud would be less obscuring at the near-infrared wavelengths captured by JWST than at the optical wavelengths sampled by Hubble. However, the feature was equally dark in the JWST images, leading the team to rule out the dust-cloud hypothesis.
Instead, they favor a scenario in which the dark feature is due to an absence of stars rather than the presence of obscuring dust. The team estimated that 2 billion solar masses of stars are missing — equivalent to 1% of the stellar mass of the galaxy. What’s more, the cavity is situated in a larger region of constant surface brightness called a core, in which there are fewer stars than expected.
The Dynamical History of A402-BCG
McDonald and coauthors suggested that the missing stars in A402-BCG’s core and cavity were ejected by at least one supermassive black hole binary. They estimated that the core region, which is roughly 6,500 light-years across, was excavated by a 50 billion solar mass black hole. This epic black hole may be the result of a past merger and is likely located at the infrared-bright spot on the border of the cavity, as this source’s spectral energy distribution resembles that of an actively accreting black hole.
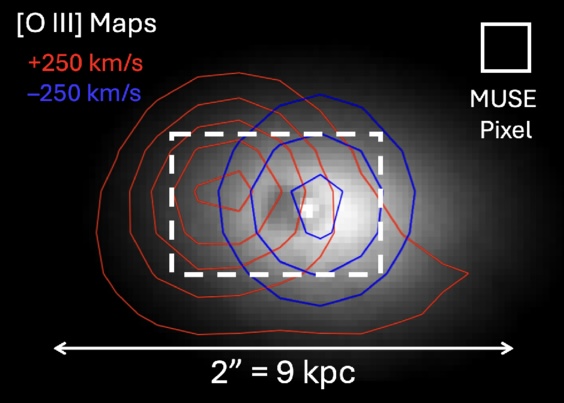
MUSE observations of highly ionized gas in A402-BCG. The blueshifted source on the right coincides with the infrared-bright source, while the redshifted source on the left appears to be embedded within a larger ionized envelope. [Adapted from McDonald et al. 2026]
MUSE spectroscopy provided evidence for a second black hole. These data revealed two pockets of ionized gas — one coincident with the infrared-bright source, the other on the opposite side of the cavity — as well as two distinct sets of emission lines consistent with a black hole binary totaling 60 ± 20 billion solar masses. (The team noted that alternate explanations for the second source, like a compact starburst, were less likely but couldn’t be ruled out.)
The team favors a scenario in which these black holes are slowly spiraling toward one another, ejecting stars from the galaxy’s center as they move and carving out a deep deficit of stars. This stellar cavity sits within a larger region of stellar scarcity that was scooped out by a past supermassive black hole merger that created the ultra-massive black hole present in the galaxy today. Simulations suggest that only about 0.5% of massive galaxies are in this phase of evolution at a time, so we may have caught A402-BCG in a fascinating moment — one that provides new clues about how to search for ongoing black hole mergers in other galaxies.
Citation
“A Kiloparsec-Scale Stellar Cavity in the Center of A402-BCG May Be Caused by Dynamic Interactions with an Ultramassive Black Hole,” Michael McDonald et al 2026 ApJL1002 L19. doi:10.3847/2041-8213/ae5bbe
In 2019, a supermassive black hole in a galaxy 300 million light-years away woke up. Now, it’s puzzling astronomers with an unexpected slowdown in its X-ray bursts.
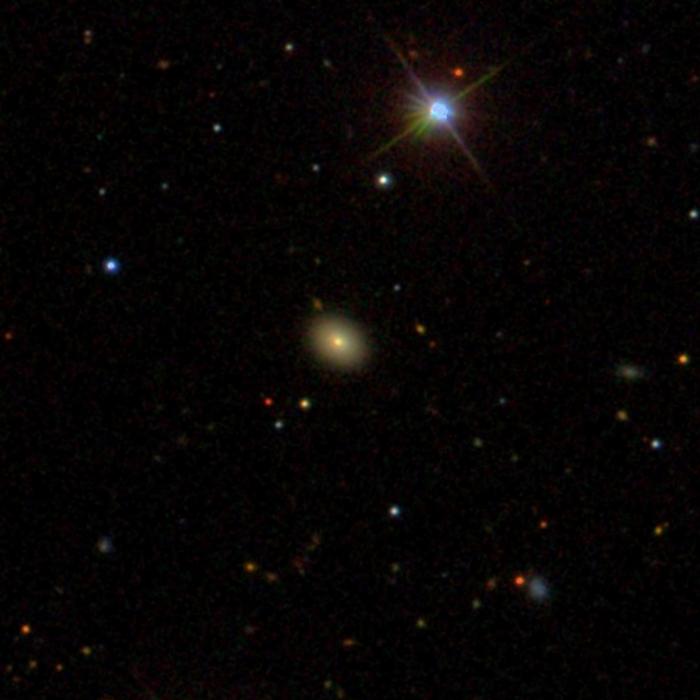
The fuzzy yellow galaxy at the center of this image is home to ZTF19acnskyy. [Sloan Digital Sky Survey]
Ansky Awakens
Nearly seven years ago, the Zwicky Transient Facility saw the galaxy SDSS J133519.91+072807.4 suddenly brighten at optical wavelengths, with the source given the moniker ZTF19acnskyy or “Ansky.” Within the next few years, Ansky brightened at other wavelengths, possibly signaling the first recorded case of a slumbering supermassive black hole grumbling to alertness.
In 2024, Ansky entered a new phase of behavior, exhibiting a series of semi-regular X-ray flares called quasi-periodic eruptions. The leading explanations for these flares, which have been detected from several nearby galaxies, involve a star-sized object spiraling toward a supermassive black hole. The repeating X-ray flares arise when the object crashes through an accretion disk around the black hole, or when the object loses mass each time it passes closest to the black hole. In either scenario, the time between flares is expected to decrease over time — but as new work shows, Ansky is behaving in ways that fail to fit existing theories of quasi-periodic eruptions.
An Unexpected Slowdown
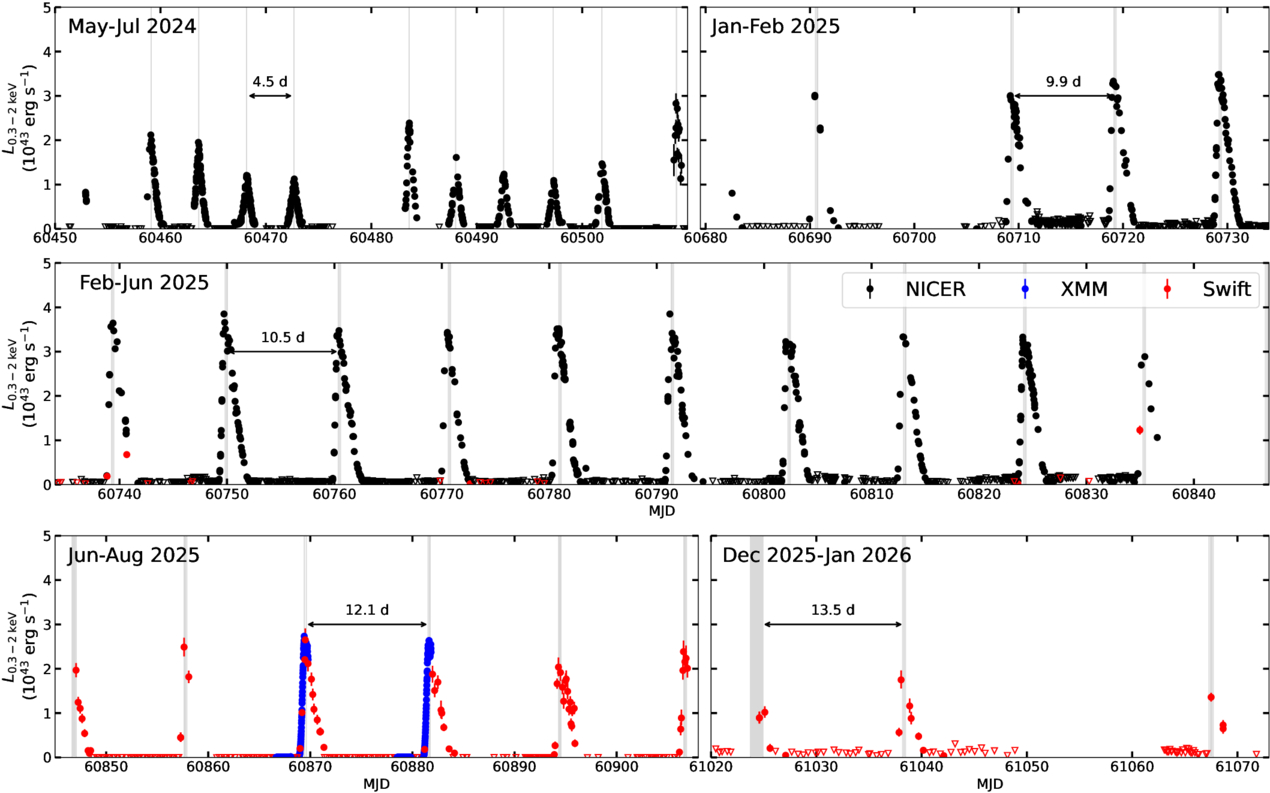
Soft X-ray observations of Ansky’s bursts from 2024 to 2026. These plots clearly show that in 2025 and 2026, the peak luminosities of the bursts have remained roughly constant while the time between bursts has increased. Click to enlarge. [Chakraborty et al. 2026]
Astronomers first reported on Ansky’s strange behavior in 2025, finding evidence that the time between eruptions was increasing rather than decreasing as expected. To investigate this emerging trend, Joheen Chakraborty (Massachusetts Institute of Technology) and collaborators analyzed data from the Neil Gehrels Swift Observatory’s X-ray Telescope, XMM-Newton, and the Neutron star Interior Composition Explorer (NICER).
This X-ray monitoring campaign spanned from January 2025 to January 2026 and captured 23 bursts, including 19 consecutive bursts — the most seen from a quasi-periodic eruption source to date. The bursts each lasted about three days, and the burst luminosity and total energy remained roughly constant, but the time between bursts increased smoothly from 9.9 days in January 2025 to 13.5 days in January 2026.
Possible Explanations
What physical process can produce X-ray bursts that are roughly consistent in energy and peak luminosity, last for approximately three days, and become more spaced out over time? The team considered five possibilities:
A star orbiting a black hole could transfer a bit of mass to the black hole each time it draws close… but it’s not clear whether the energy of each burst would remain the same as the star loses mass, nor is it clear how a three-day eruption duration could be achieved.
A star partially disrupted by a black hole could be kicked progressively farther from the black hole due to asymmetric mass loss or the reformation of its core… but this scenario cannot explain the bursts’ consistent energies and luminosities.
An object orbiting a black hole with an accretion disk could be experiencing general relativistic precession… but no combination of known sources of precession can reproduce Ansky’s behavior.
A second supermassive black hole could cause reflex motion of the inner black hole, changing how far the signal must travel… but even though this scenario can increase the time between bursts, the rate of increase is three orders of magnitude too small.
Instabilities in the black hole’s accretion disk could trigger recurrent bursts of accretion… but it’s not yet clear how an instability scenario could produce such predictable behavior.
While none of these models can fully solve the mystery of Ansky’s slackening X-ray flares, this work provides new avenues for exploration. In the meantime, we may get new clues simply from waiting to see what this source does next!
Citation
“A Positive Period Derivative in the Quasiperiodic Eruptions of ZTF19acnskyy,” Joheen Chakraborty et al 2026 ApJL1001 L6. doi:10.3847/2041-8213/ae548b
What factors impact how long it takes for a supermassive black hole binary to merge? New research investigates the influence of orbital inclination on the population of merging black holes in our universe.
When galaxies merge, the supermassive black holes at their centers are thought to link up in a binary system and eventually merge as well. Evidence for these supermassive black hole pairs and their collisions is piling up: researchers have identified a small but growing number of galaxies containing two accreting supermassive black holes, and the compelling evidence for the gravitational wave background points to the existence of an immense population of supermassive black hole binaries.
With observational evidence for supermassive black hole mergers taking shape, theorists are exploring the details of these mergers. One aspect of this process that hasn’t yet been examined fully is how the relative inclination of the merging galaxies impacts the time it takes for their central black holes to merge — a factor that has the potential to shape the demographics of merging supermassive black holes across our universe.
Ready, Set, Spiral
Sena Ghobadi (Georgia Institute of Technology) and collaborators used 3D dynamical models to explore how the angle at which galaxies collide — and therefore how the black holes’ orbits are tilted relative to one another — impacts the time it takes the supermassive black holes at their centers to merge.
In the simulations, Ghobadi’s team placed a 106–108-solar-mass black hole at the center of a disk galaxy. Then, they sent a second, smaller black hole spiraling toward it from a distance of 1 kiloparsec (3,300 light-years).
The team varied the inclination of the incoming black hole’s orbit relative to the disk of the target galaxy from 0 to 75 degrees. They also explored the impact of changing the black hole masses and the galaxy’s central gas density, disk rotation speed, and gas mass fraction. For each simulation, they recorded how long it took for the incoming smaller black hole to get within 10 parsecs of the larger black hole.
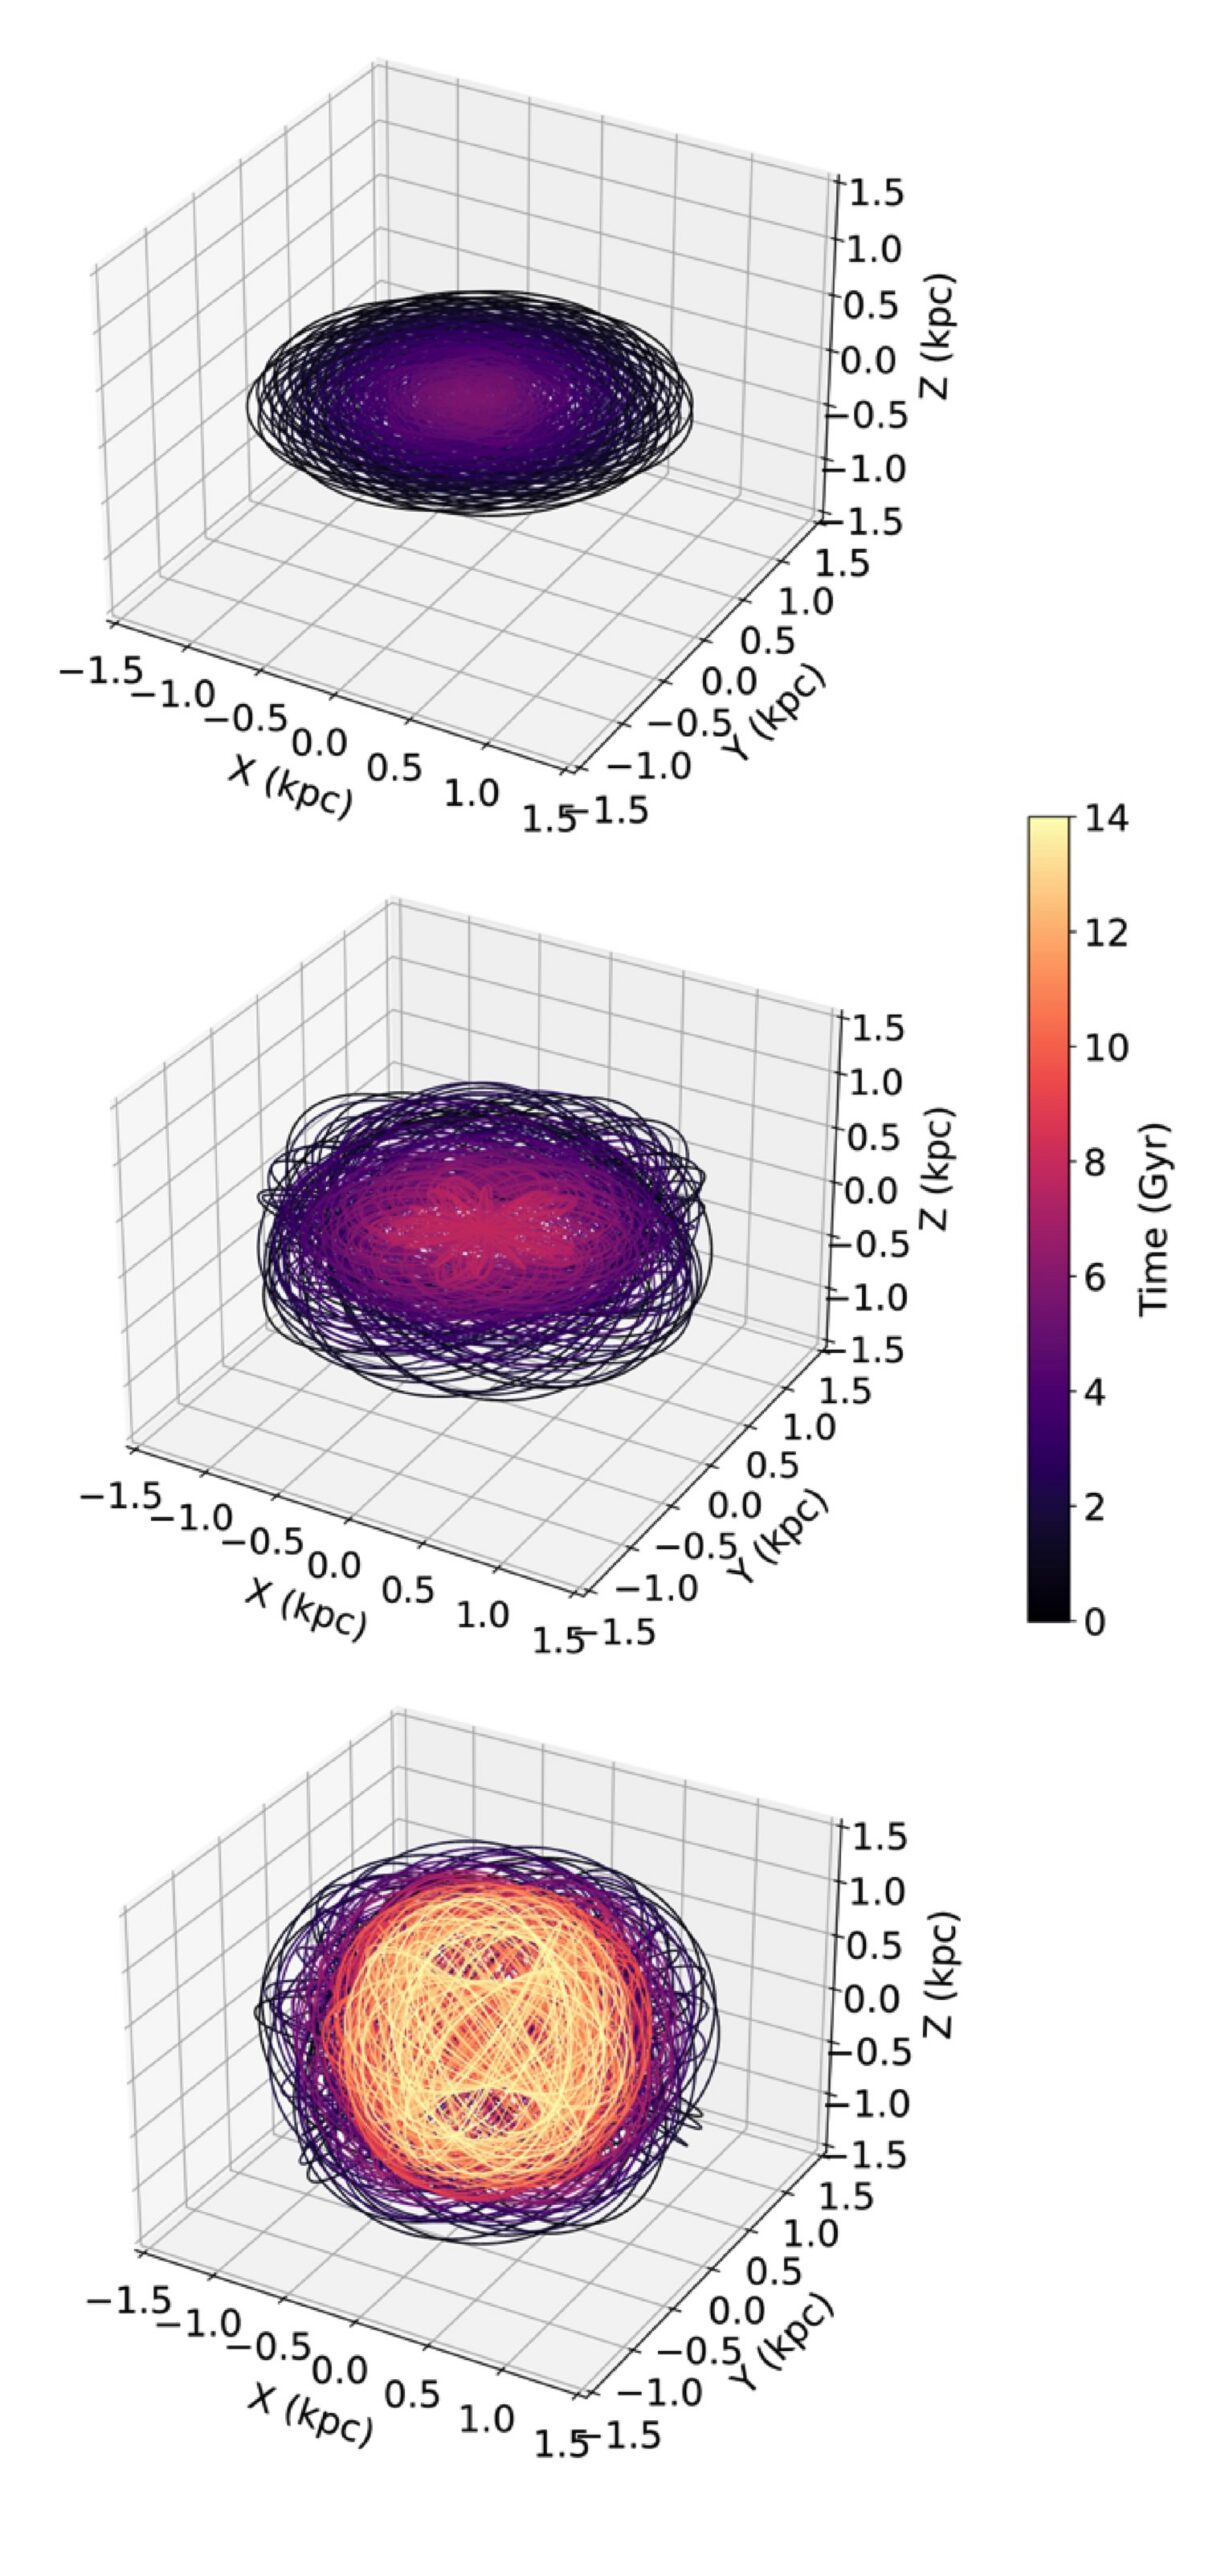
Simulated orbits of black holes with initial inclinations of 0 (top), 25 (center), and 45 (bottom) degrees. For the 0-degree simulation, the black holes merge in 5.75 billion years. For the 25-degree simulation, the merger occurs at 7.90 billion years. The 45-degree simulation fails to merge within the lifetime of the universe. [Adapted from Ghobadi et al. 2026]
(Dis)inclined to Merge
The simulations showed a clear trend with changing inclination: a black hole with an orbital inclination greater than 20 degrees took longer to merge than those with inclinations of 0–20 degrees. For black holes approaching the merger on slightly inclined orbits, dynamical friction between the black hole and the stars and gas of the galaxy worked to drag the black hole down into the disk, decreasing its inclination over time and guiding it toward a merger. Aside from the influence of inclination, the team also found that higher-mass supermassive black holes and more rapidly rotating galactic disks tended to lead to faster mergers.
For inclinations greater than roughly 45 degrees, a dramatic transition took place, with the orbits of the incoming black holes becoming more inclined over time rather than settling down into the disk. These simulated black holes failed to merge in the allotted time of 14 billion years.
With highly inclined binaries failing to merge within the lifetime of the universe, this suggests that the dual active galactic nuclei and the supermassive black hole binaries that produce gravitational waves in the universe today are the result of binaries with initial inclinations of 20 degrees or less.
Citation
“Evolution of Supermassive Black Hole Pairs on Inclined Orbits in Postmerger Galaxies,” Sena Ghobadi et al 2026 ApJ999 131. doi:10.3847/1538-4357/ae40bc
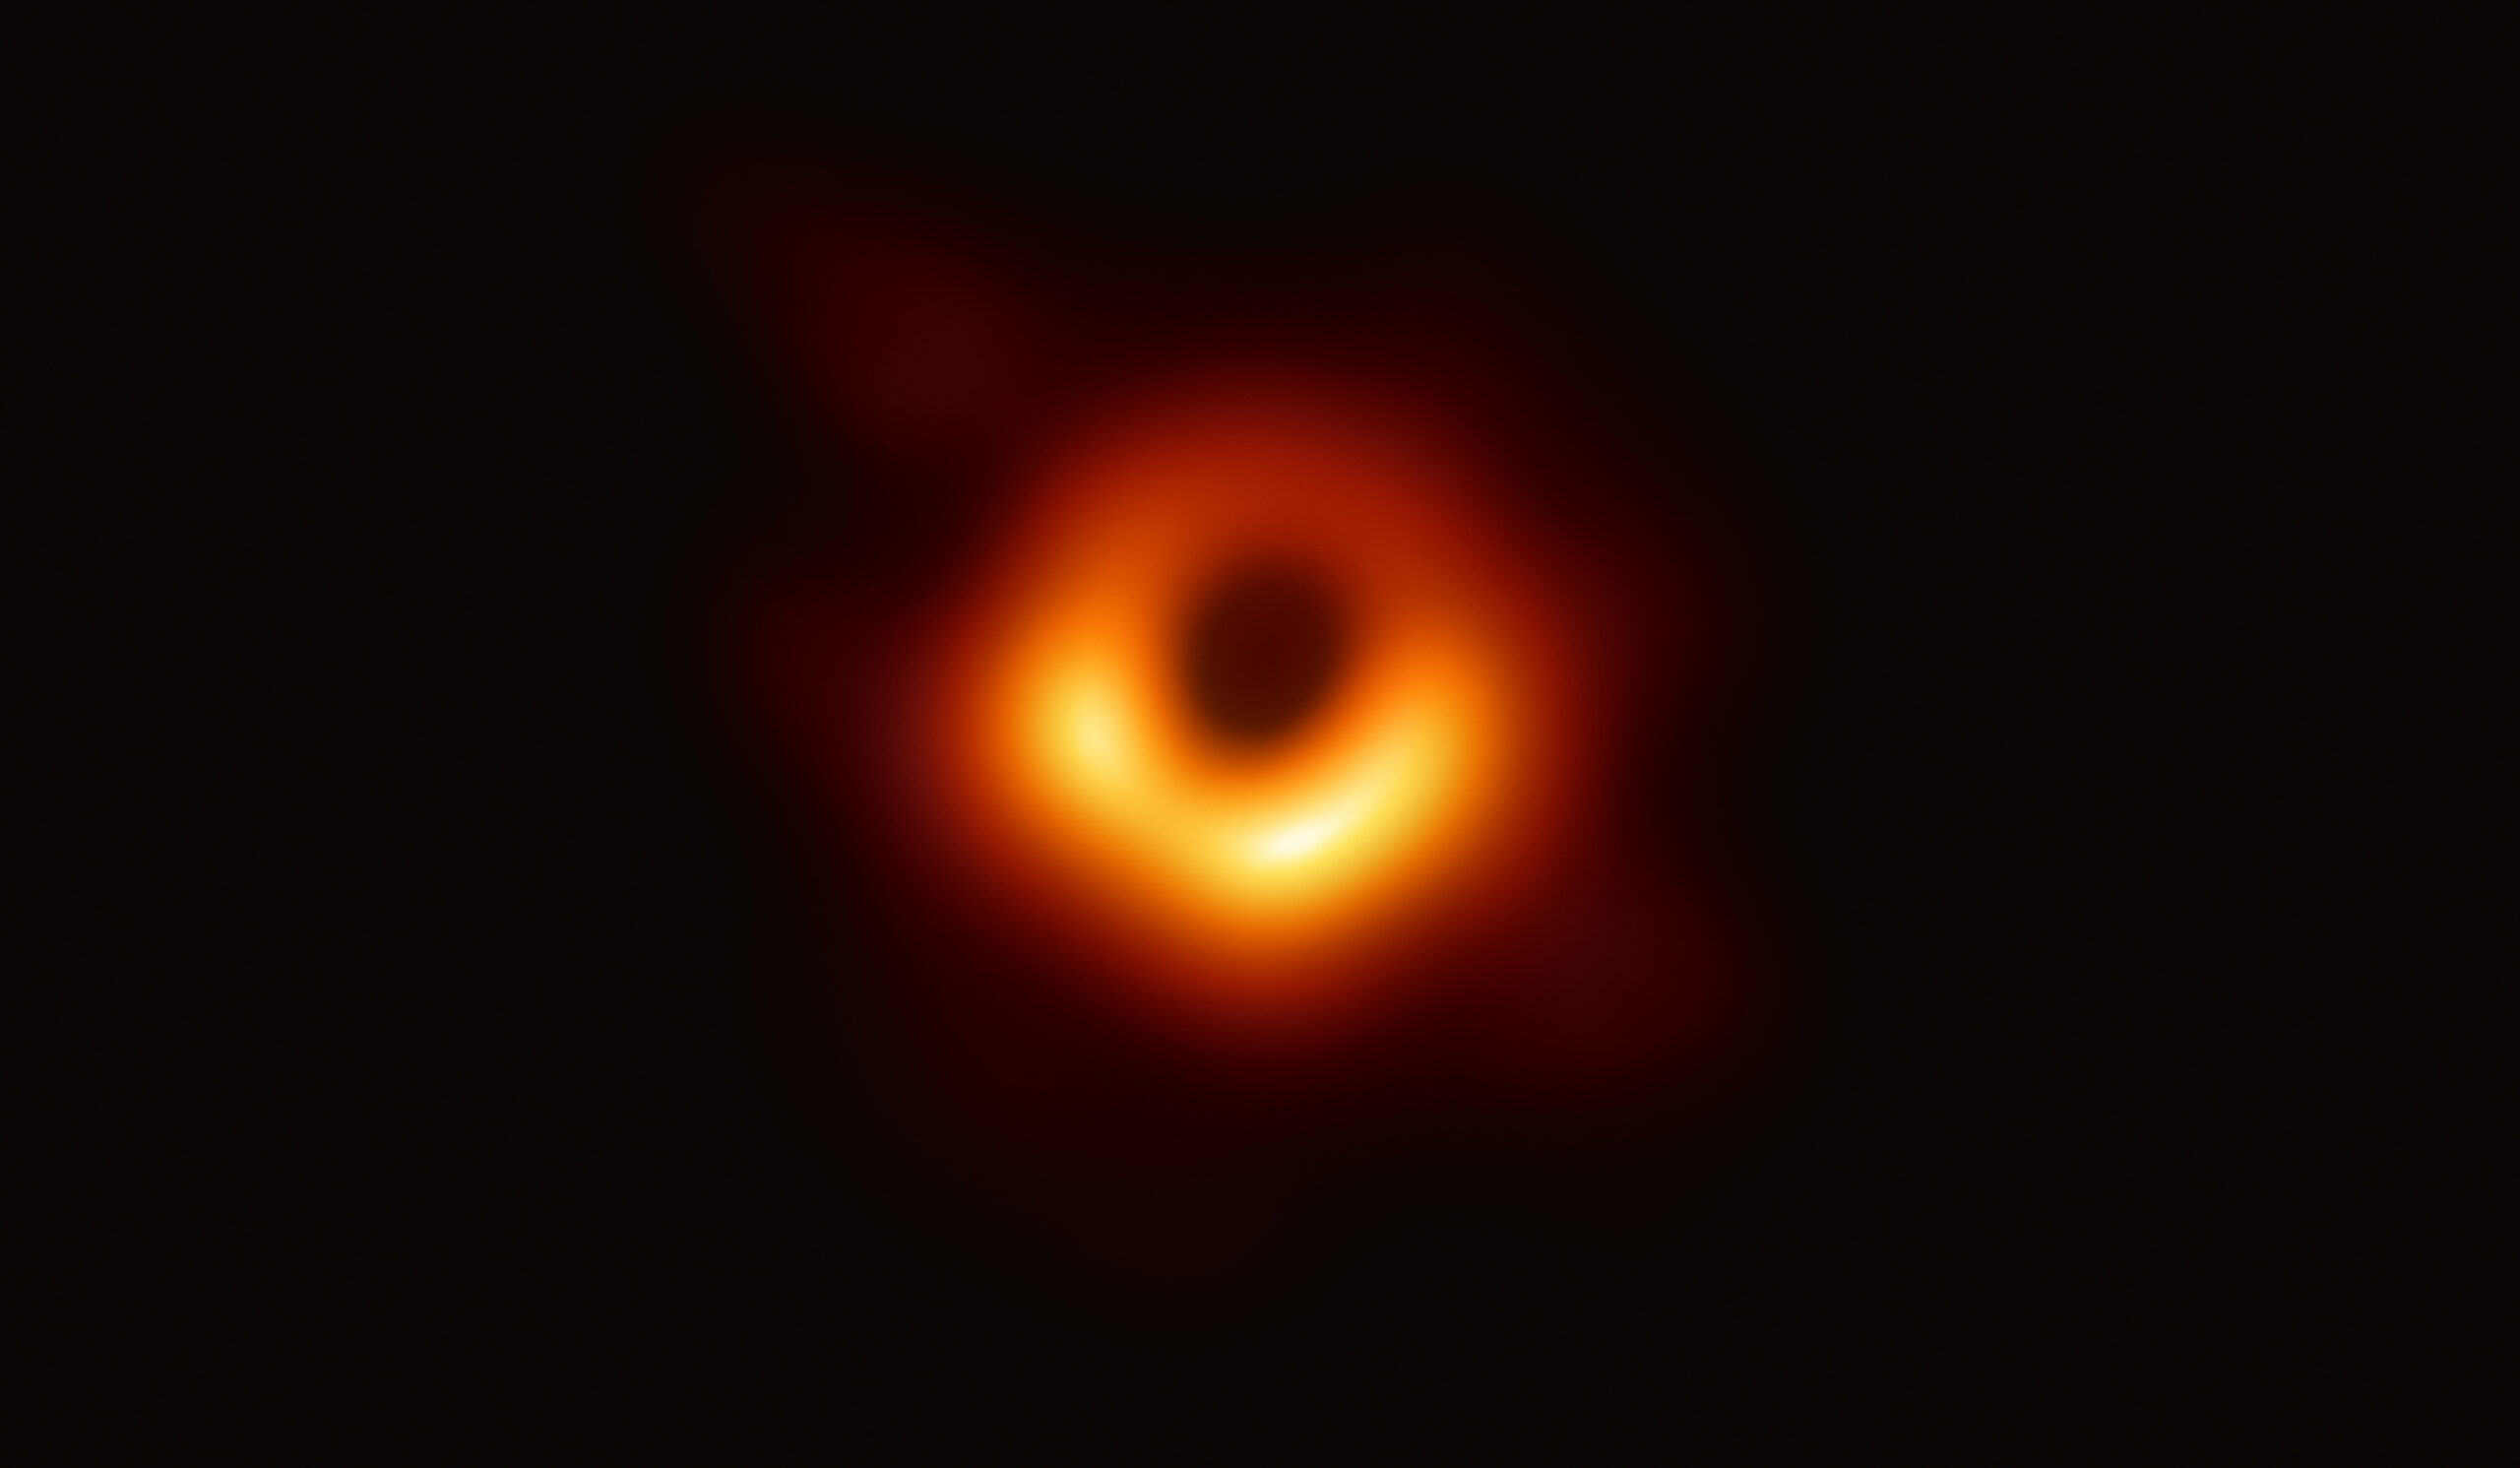
The Event Horizon Telescope (EHT), the facility that delivered humanity’s first-ever picture of a black hole, can produce some of the sharpest images in all of astronomy. But turning the EHT’s raw data into images is a complex process involving messy statistics and powerful algorithms. Recent work presents a potential upgrade to that process: for the first time in long-baseline interferometry, it may be possible to model everything everywhere all at once.
The Hardest Eye Test
The EHT has some of the sharpest eyes in all of astronomy. With its effective resolution of just 20 microarcseconds, in principle you could use it to read a newspaper in New York while sitting at a cafe in Paris. But this planet-spanning instrument (it relies on data from radio telescopes on four continents) doesn’t snap pictures like an ordinary camera. Instead, each pair of telescopes measures something called an “interferometric visibility,” which is related to a single Fourier component of the actual underlying image.
The first image of a black hole, constructed from Event Horizon Telescope data taken in 2017. [EHT Collaboration; CC BY 4.0]
Combining these components into an image is a process fraught with assumptions and modeling choices. Since the EHT doesn’t have an infinite number of telescopes, each measurement can be mapped to infinitely many images. This forces researchers to choose how to “regularize” this space of images to select one best picture. Making things harder, they also must contend with all the typical issues of real-world data collection. Each telescope has slight calibration errors, and every data point is affected by weather and temperature-dependent processes.
Typically researchers break the problem down into several stages: first calibrate the data, then regularize and construct the best-fitting image, then analyze that image to constrain the actual physics you care about like the width of the ring surrounding a black hole. This is how the original EHT publications went about their groundbreaking work on the now-iconic glowing ring around the supermassive black hole in the galaxy Messier 87 (M87*).
A New Approach
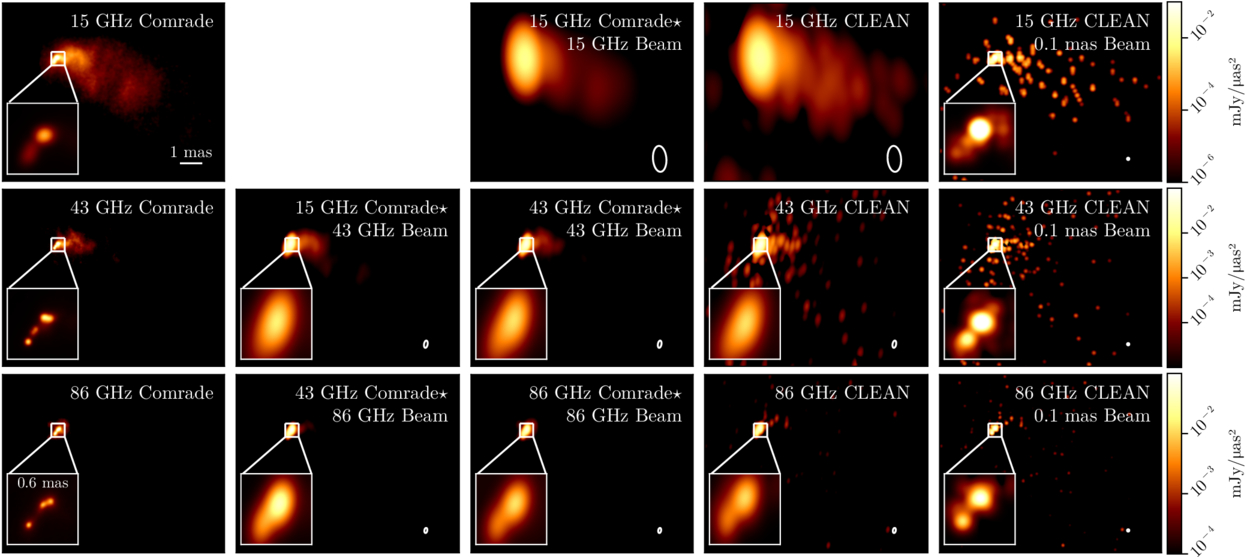
Recent work led by Paul Tiede (Black Hole Initiative at Harvard University) suggests an alternative process. Instead of separating the stages of analysis as described above, the team demonstrated that one could fit everything simultaneously in a framework they call hierarchical interferometric Bayesian imaging, or HIBI.
A comparison of the new HIBI technique (referred to as “Comrade” here) and a traditional algorithm called CLEAN. Click to enlarge. [Tiede et al. 2026]
By fitting all parameters that go into an image together, the method doesn’t select one “best” image. Instead, by allowing the pixel-by-pixel intensities, calibration parameters, and underlying physics to inform one another during inference, HIBI explores the full range of images consistent with the data. This prevents the degeneracies that plague the traditional approach, where image and calibration estimates can trade off against each other in misleading ways. The team validated HIBI on synthetic data mimicking the EHT’s 2017 setup, showing that it reliably recovered a range of source shapes with well-calibrated uncertainty estimates.
Even more exciting, the team demonstrated that it’s possible to skip the image construction step altogether and go straight to the science. By fitting parameters describing the physics underlying a scene, the team was able to constrain the width of the ring around M87* without any reference to a picture. They predict that this technique could be crucial for extracting information when future instruments like the Next Generation Event Horizon Telescope observe more distant black holes that are only marginally resolved. Though we’ll likely have to wait years for these next-generation telescopes, work like this ensures that astronomers will be able to squeeze as much science from them as possible once these new facilities are ready.

 Login