❌

Reading view

How 2 US, European Satellites Are Studying Hurricanes During El Niño

5 min read

How 2 US, European Satellites Are Studying Hurricanes During El Niño
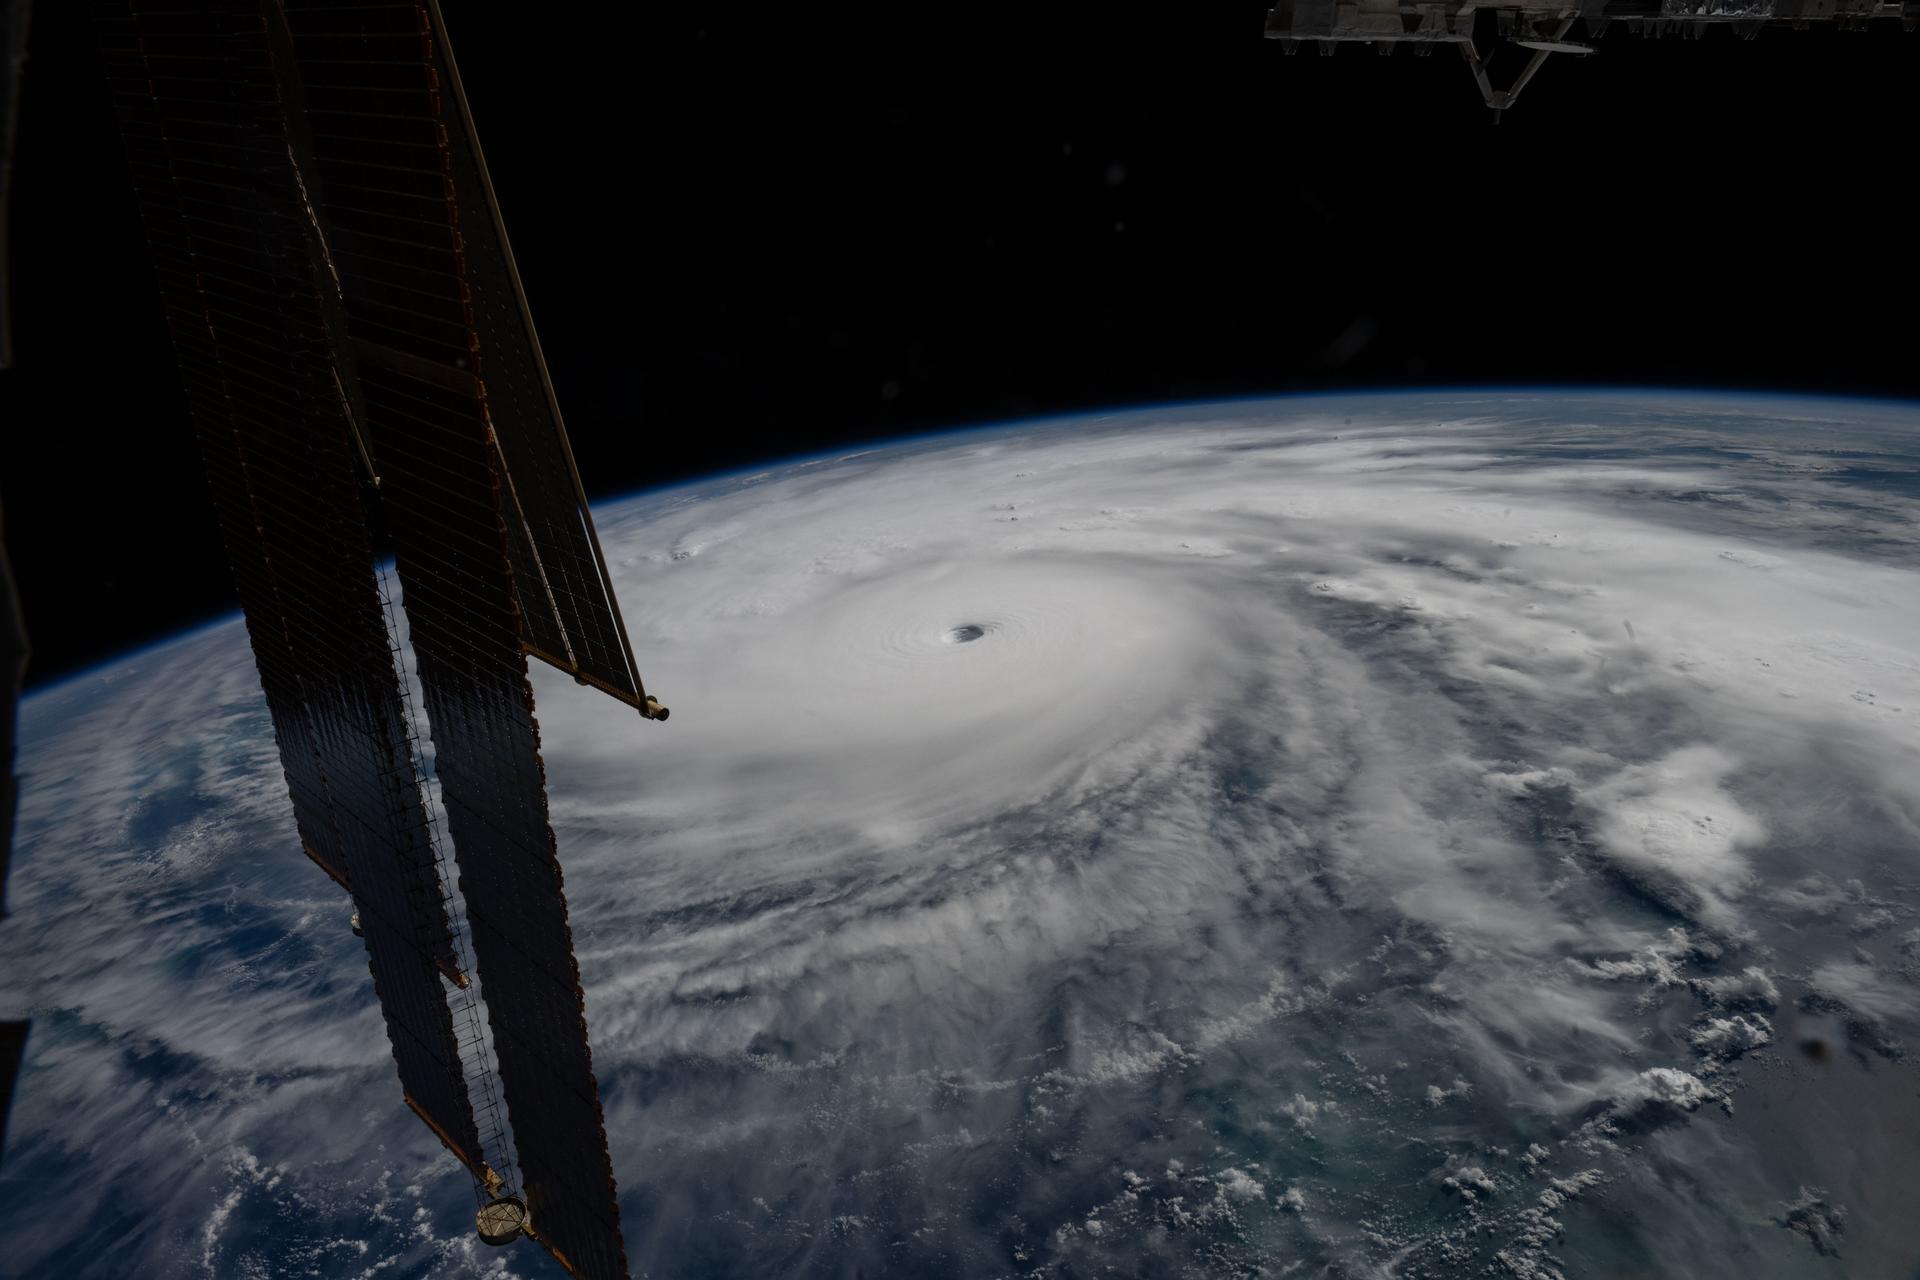
Category 5 Hurricane Melissa, one of the most powerful storms to strike the Caribbean in recent history, is pictured about 50 miles south of Jamaica in this photograph from the International Space Station as it orbited 262 miles above the Yucatan Peninsula.
Hurricane Melissa is seen 50 miles south of Jamaica in this photograph taken from the International Space Station on Oct. 28, 2025.
NASA

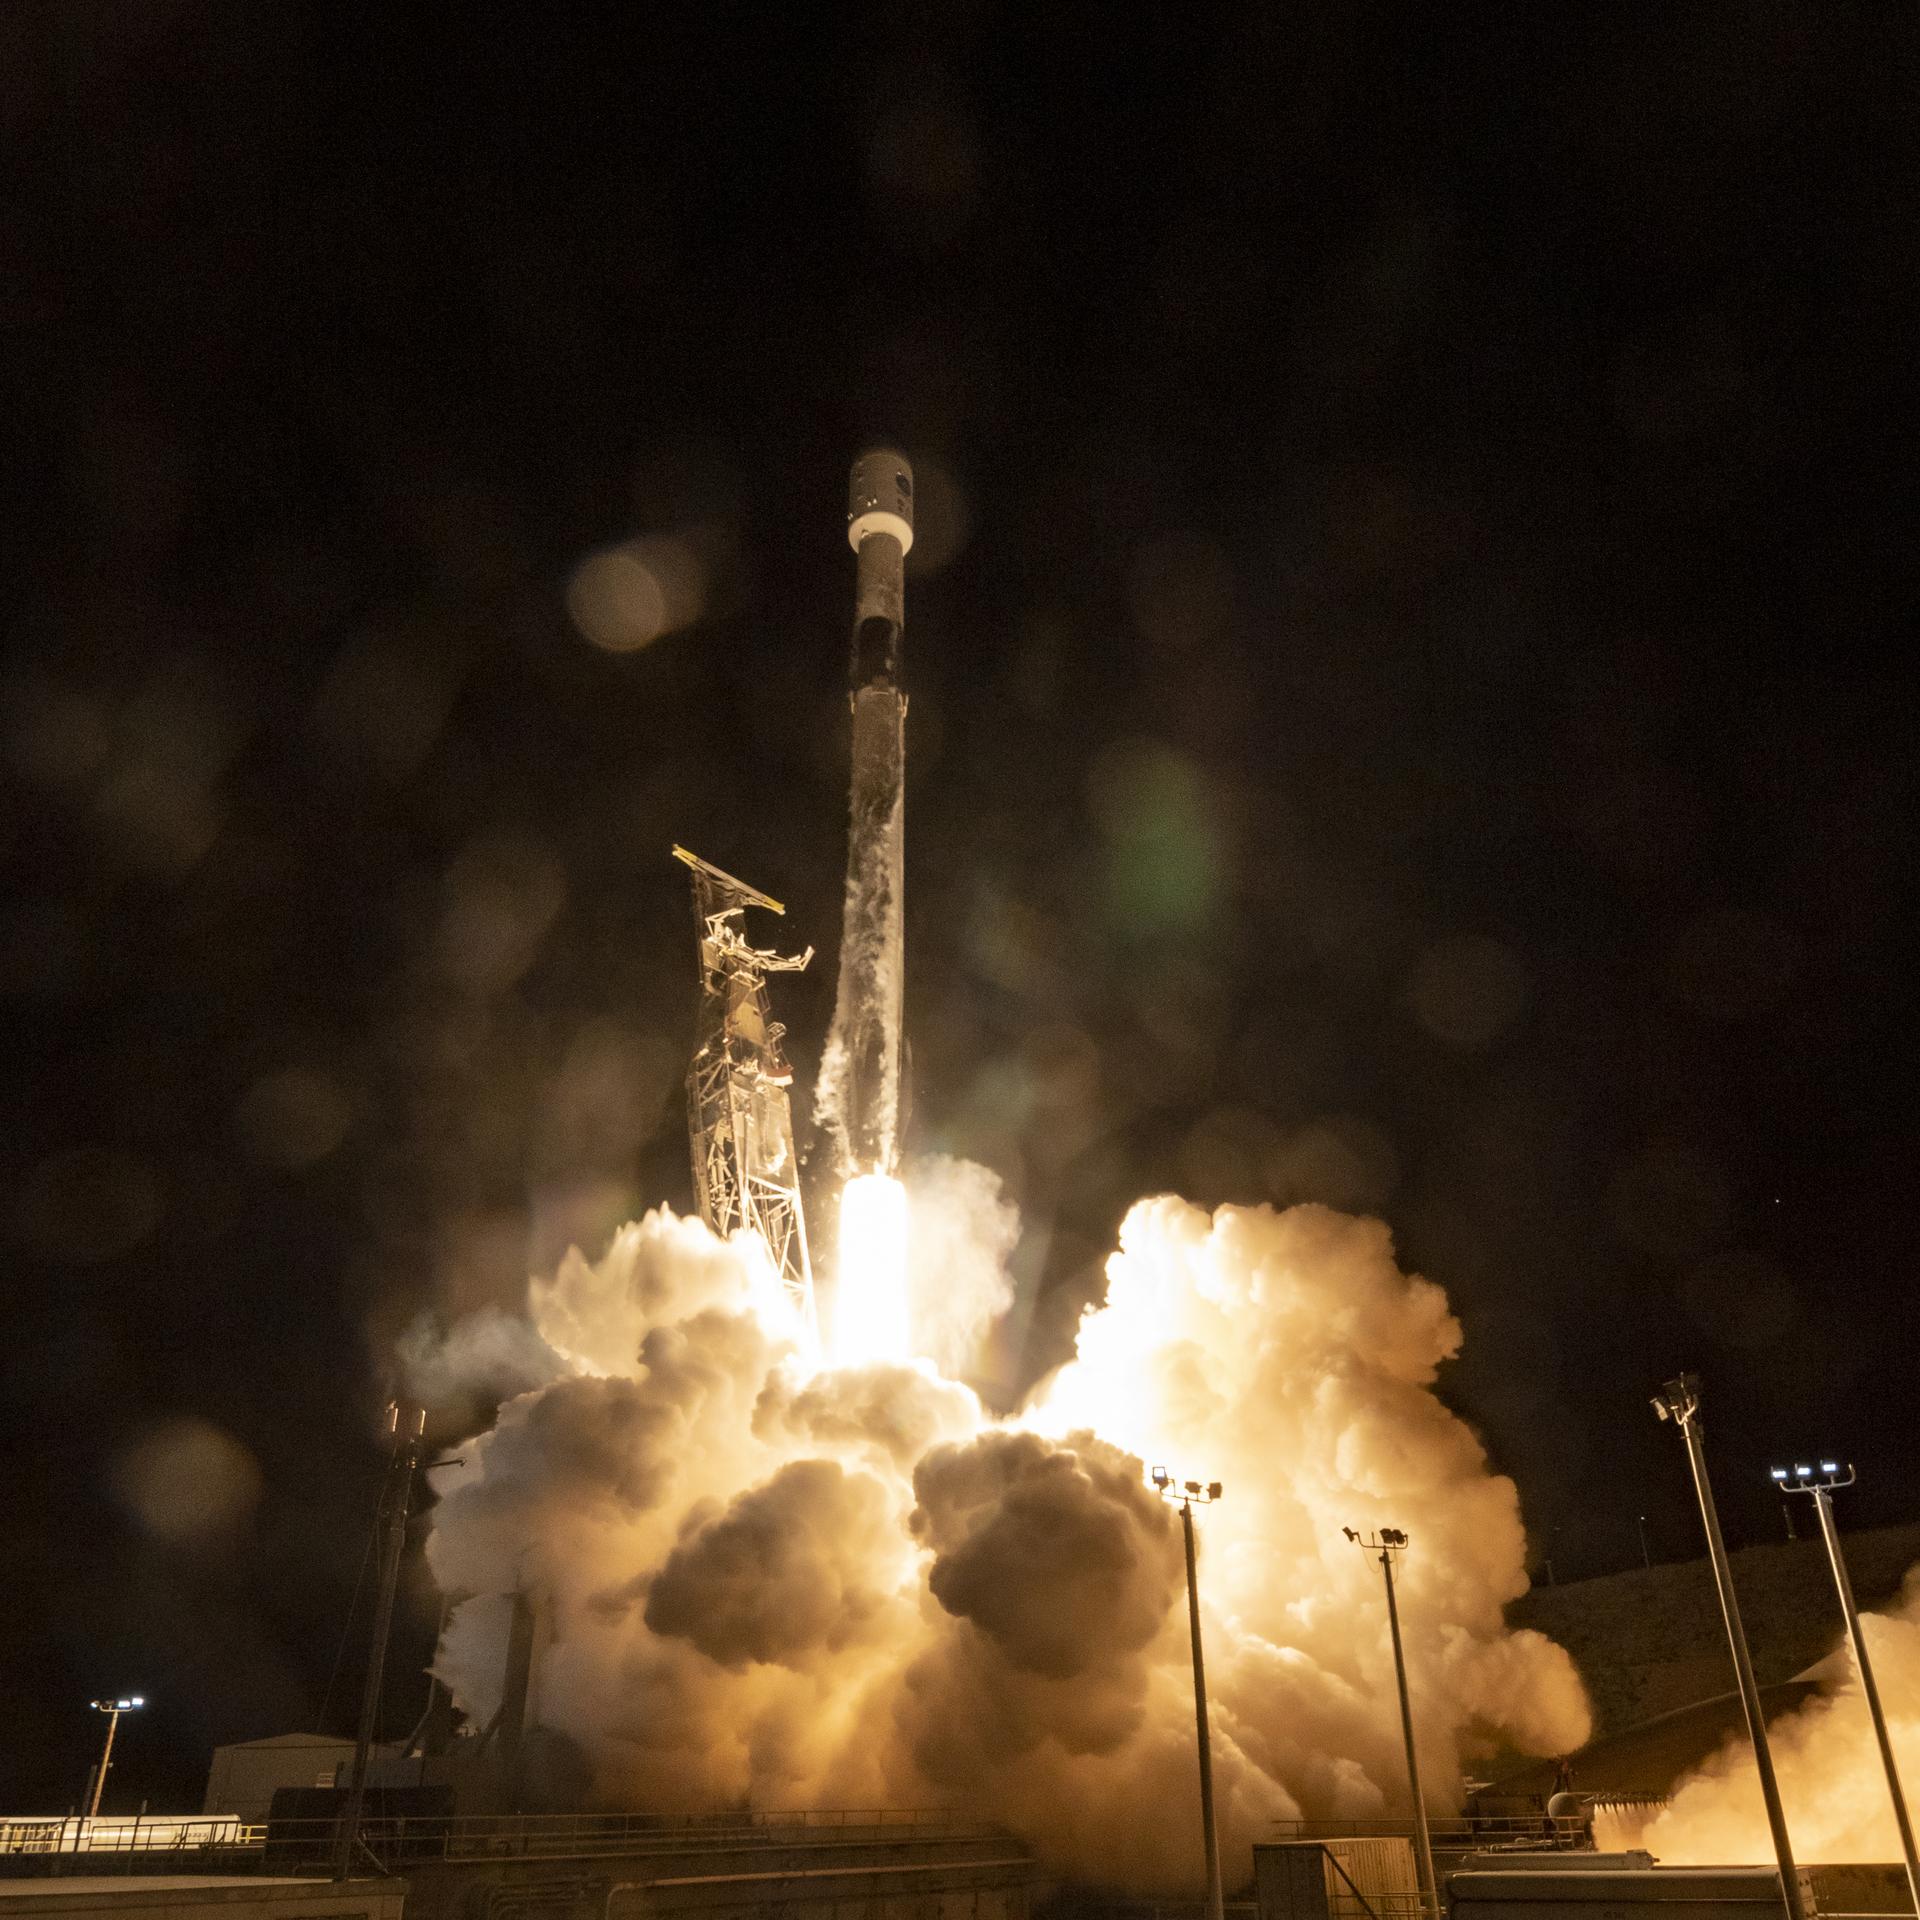
Last November, NASA and its European partners launched the Sentinel-6B satellite to improve hurricane forecasts, help protect infrastructure, and benefit commercial industries, including shipping. The satellite now is flying 30 seconds behind its predecessor, Sentinel-6 Michael Freilich. Both satellites are providing precise sea level height measurements during what oceanographers expect to be a historic El Niño, a naturally occurring oceanic phenomenon in which warmer-than-usual Pacific waters shift global weather patterns.

The two satellites make up the Copernicus Sentinel-6/Jason-CS (Continuity of Service) mission, the latest in a series of ocean-observing radar altimetry missions that have been monitoring Earth’s changing seas continuously since the early 1990s.

The data each satellite is collecting will not only allow scientists to better understand this year’s El Niño but will also help them create more accurate hurricane predictions.

“This El Niño was a late-bloomer,” said Josh Willis, Sentinel-6B’s project scientist at NASA’s Jet Propulsion Laboratory in Southern California. “It didn’t kick off until the middle of the year and is just now reaching a strength similar to what we’ve seen in the satellite record during significant El Niños in 1997 and 2015. We expect it to be big, and it’s already having big impacts.”

El Niños generally scramble weather patterns tied to rainfall and storms, including hurricanes. They also redistribute heat in the ocean, which affects sea level. Normally, Earth’s warmest ocean waters sit along the equator in the western Pacific. During El Niño, weakened winds, which usually blow westward along the equator, result in heat spreading east toward South America. The change in ocean heat shifts hurricane activity from the Atlantic to the Pacific Ocean.

Predicting hurricane strength

On July 15, Sentinel-6B began delivering low-latency data to scientists that could be used for weather predictions. That data will take some time to work its way into the research models on which meteorologists and climate scientists rely, but when it does, those improved models could save lives.

Data from Sentinel-6 satellite missions feeds into hurricane tracking algorithms used by federal and state agencies. Those predictions can activate disaster response efforts, mobilizing resources ranging from sandbag placement to National Guard activation. They also can lead to evacuation orders that require quick but well-informed decisions about logistics at a local level. More severe events may require engaging larger organizations, such as the Federal Emergency Management Agency.

A tropical storm can take a week or more to become a hurricane and make its way to a coastline, but a hurricane can rapidly intensify in the 48 hours prior to landfall, leaving planners little time to prepare.

“Hurricanes have been known to speed up quickly at the last moment, so the window in which to decide what to do is short,” said Deirdre Byrne, an oceanographer and altimetry expert with the National Oceanic and Atmospheric Administration (NOAA). “The goal is to forecast how much and how rapidly intensification will happen so that officials can make the right calls.”

Byrne oversees one of the country’s most crucial hurricane forecasting algorithms, NOAA’s Satellite Ocean Heat Content Suite, which has been operating since 2012.

Each Sentinel-6 satellite measures ocean height, as well as the size of waves and marine wind speed, using a radar altimeter, which bounces thousands of radar pulses a second off the crests and troughs of waves. Ocean height varies from place to place and provides insight into the ocean’s heat content, since warm water expands. That, in turn, helps forecast how fast hurricanes will grow.

The satellites each carry a second instrument, called the Global Navigation Satellite System – Radio Occultation (GNSS-RO), which measures atmospheric properties, such as humidity, pressure, and temperature.

Among the measurements Sentinel-6 is gathering, Byrne is most anticipating the ocean height data, which she plans to begin incorporating into the current Satellite Ocean Heat Content Suite algorithm by the end of the year.

“In terms of data quality, the Sentinel-6 missions are unparalleled,” Byrne said.

Together, the missions are also extending a precise dataset deep into its fourth decade. This record of sea level observations traces back to the TOPEX/Poseidon mission, which launched in 1992, and continues through to the present day with Sentinel-6 Michael Freilich. Sentinel-6B will take over for its predecessor as the reference satellite for global sea level measurements later this year.

“The key is consistency, measuring the same way, every time,” said Severine Fournier, Sentinel-6B deputy project scientist, JPL. “That’s what lets us predict hurricanes, and, in turn, protect coastal communities and infrastructure.”

More about Sentinel-6B

Sentinel-6 Michael Freilich, named after a former director of NASA’s Earth Science Division, is one of two satellites that compose the Copernicus Sentinel-6/Jason-CS mission.

Sentinel-6/Jason-CS, a part of the European Union’s Earth observation program called Copernicus, was jointly developed by ESA (European Space Agency), EUMETSAT (European Organisation for the Exploitation of Meteorological Satellites), NASA, and NOAA, with funding support from the European Commission and technical support on performance from the French space agency CNES (Centre National d’Études Spatiales). Spacecraft monitoring and control, as well as the processing of all the altimeter science data, is carried out by EUMETSAT on behalf of the European Union’s Copernicus Programme, with the support of all partner agencies.

NASA JPL, a division of Caltech in Pasadena, contributed three science instruments for each Sentinel-6 satellite: the Advanced Microwave Radiometer, the GNSS-RO, and the Laser Retroreflector Array. NASA also contributed launch services, ground systems supporting operation of the agency’s science instruments, the science data processors for two of these instruments, and support for the United States members of the international Ocean Surface Topography Science Team.

For more about Sentinel-6B, visit:

https://science.nasa.gov/mission/sentinel-6B

-end-

Media Contacts

Andrew Good / Andrew Wang
Jet Propulsion Laboratory, Pasadena, Calif.
818-393-2433 / 626-379-6874
andrew.c.good@jpl.nasa.gov / andrew.wang@jpl.nasa.gov

2026-060

The post How 2 US, European Satellites Are Studying Hurricanes During El Niño appeared first on NASA Science.
  •  

How 2 US, European Satellites Are Studying Hurricanes During El Niño

5 min read

Preparations for Next Moonwalk Simulations Underway (and Underwater)

Category 5 Hurricane Melissa, one of the most powerful storms to strike the Caribbean in recent history, is pictured about 50 miles south of Jamaica in this photograph from the International Space Station as it orbited 262 miles above the Yucatan Peninsula.
Hurricane Melissa is seen 50 miles south of Jamaica in this photograph taken from the International Space Station on Oct. 28, 2025.
NASA

Last November, NASA and its European partners launched the Sentinel-6B satellite to improve hurricane forecasts, help protect infrastructure, and benefit commercial industries, including shipping. The satellite now is flying 30 seconds behind its predecessor, Sentinel-6 Michael Freilich. Both satellites are providing precise sea level height measurements during what oceanographers expect to be a historic El Niño, a naturally occurring oceanic phenomenon in which warmer-than-usual Pacific waters shift global weather patterns.

The two satellites make up the Copernicus Sentinel-6/Jason-CS (Continuity of Service) mission, the latest in a series of ocean-observing radar altimetry missions that have been monitoring Earth’s changing seas continuously since the early 1990s.

The data each satellite is collecting will not only allow scientists to better understand this year’s El Niño but will also help them create more accurate hurricane predictions.

“This El Niño was a late-bloomer,” said Josh Willis, Sentinel-6B’s project scientist at NASA’s Jet Propulsion Laboratory in Southern California. “It didn’t kick off until the middle of the year and is just now reaching a strength similar to what we’ve seen in the satellite record during significant El Niños in 1997 and 2015. We expect it to be big, and it’s already having big impacts.”

El Niños generally scramble weather patterns tied to rainfall and storms, including hurricanes. They also redistribute heat in the ocean, which affects sea level. Normally, Earth’s warmest ocean waters sit along the equator in the western Pacific. During El Niño, weakened winds, which usually blow westward along the equator, result in heat spreading east toward South America. The change in ocean heat shifts hurricane activity from the Atlantic to the Pacific Ocean.

Predicting hurricane strength

On July 15, Sentinel-6B began delivering low-latency data to scientists that could be used for weather predictions. That data will take some time to work its way into the research models on which meteorologists and climate scientists rely, but when it does, those improved models could save lives.

Data from Sentinel-6 satellite missions feeds into hurricane tracking algorithms used by federal and state agencies. Those predictions can activate disaster response efforts, mobilizing resources ranging from sandbag placement to National Guard activation. They also can lead to evacuation orders that require quick but well-informed decisions about logistics at a local level. More severe events may require engaging larger organizations, such as the Federal Emergency Management Agency.

A tropical storm can take a week or more to become a hurricane and make its way to a coastline, but a hurricane can rapidly intensify in the 48 hours prior to landfall, leaving planners little time to prepare.

“Hurricanes have been known to speed up quickly at the last moment, so the window in which to decide what to do is short,” said Deirdre Byrne, an oceanographer and altimetry expert with the National Oceanic and Atmospheric Administration (NOAA). “The goal is to forecast how much and how rapidly intensification will happen so that officials can make the right calls.”

Byrne oversees one of the country’s most crucial hurricane forecasting algorithms, NOAA’s Satellite Ocean Heat Content Suite, which has been operating since 2012.

Each Sentinel-6 satellite measures ocean height, as well as the size of waves and marine wind speed, using a radar altimeter, which bounces thousands of radar pulses a second off the crests and troughs of waves. Ocean height varies from place to place and provides insight into the ocean’s heat content, since warm water expands. That, in turn, helps forecast how fast hurricanes will grow.

The satellites each carry a second instrument, called the Global Navigation Satellite System – Radio Occultation (GNSS-RO), which measures atmospheric properties, such as humidity, pressure, and temperature.

Among the measurements Sentinel-6 is gathering, Byrne is most anticipating the ocean height data, which she plans to begin incorporating into the current Satellite Ocean Heat Content Suite algorithm by the end of the year.

“In terms of data quality, the Sentinel-6 missions are unparalleled,” Byrne said.

Together, the missions are also extending a precise dataset deep into its fourth decade. This record of sea level observations traces back to the TOPEX/Poseidon mission, which launched in 1992, and continues through to the present day with Sentinel-6 Michael Freilich. Sentinel-6B will take over for its predecessor as the reference satellite for global sea level measurements later this year.

“The key is consistency, measuring the same way, every time,” said Severine Fournier, Sentinel-6B deputy project scientist, JPL. “That’s what lets us predict hurricanes, and, in turn, protect coastal communities and infrastructure.”

More about Sentinel-6B

Sentinel-6 Michael Freilich, named after a former director of NASA’s Earth Science Division, is one of two satellites that compose the Copernicus Sentinel-6/Jason-CS mission.

Sentinel-6/Jason-CS, a part of the European Union’s Earth observation program called Copernicus, was jointly developed by ESA (European Space Agency), EUMETSAT (European Organisation for the Exploitation of Meteorological Satellites), NASA, and NOAA, with funding support from the European Commission and technical support on performance from the French space agency CNES (Centre National d’Études Spatiales). Spacecraft monitoring and control, as well as the processing of all the altimeter science data, is carried out by EUMETSAT on behalf of the European Union’s Copernicus Programme, with the support of all partner agencies.

NASA JPL, a division of Caltech in Pasadena, contributed three science instruments for each Sentinel-6 satellite: the Advanced Microwave Radiometer, the GNSS-RO, and the Laser Retroreflector Array. NASA also contributed launch services, ground systems supporting operation of the agency’s science instruments, the science data processors for two of these instruments, and support for the United States members of the international Ocean Surface Topography Science Team.

For more about Sentinel-6B, visit:

https://science.nasa.gov/mission/sentinel-6B

-end-

Media Contacts

Andrew Good / Andrew Wang
Jet Propulsion Laboratory, Pasadena, Calif.
818-393-2433 / 626-379-6874
andrew.c.good@jpl.nasa.gov / andrew.wang@jpl.nasa.gov

2026-060

  •  

El Niño Is Underway

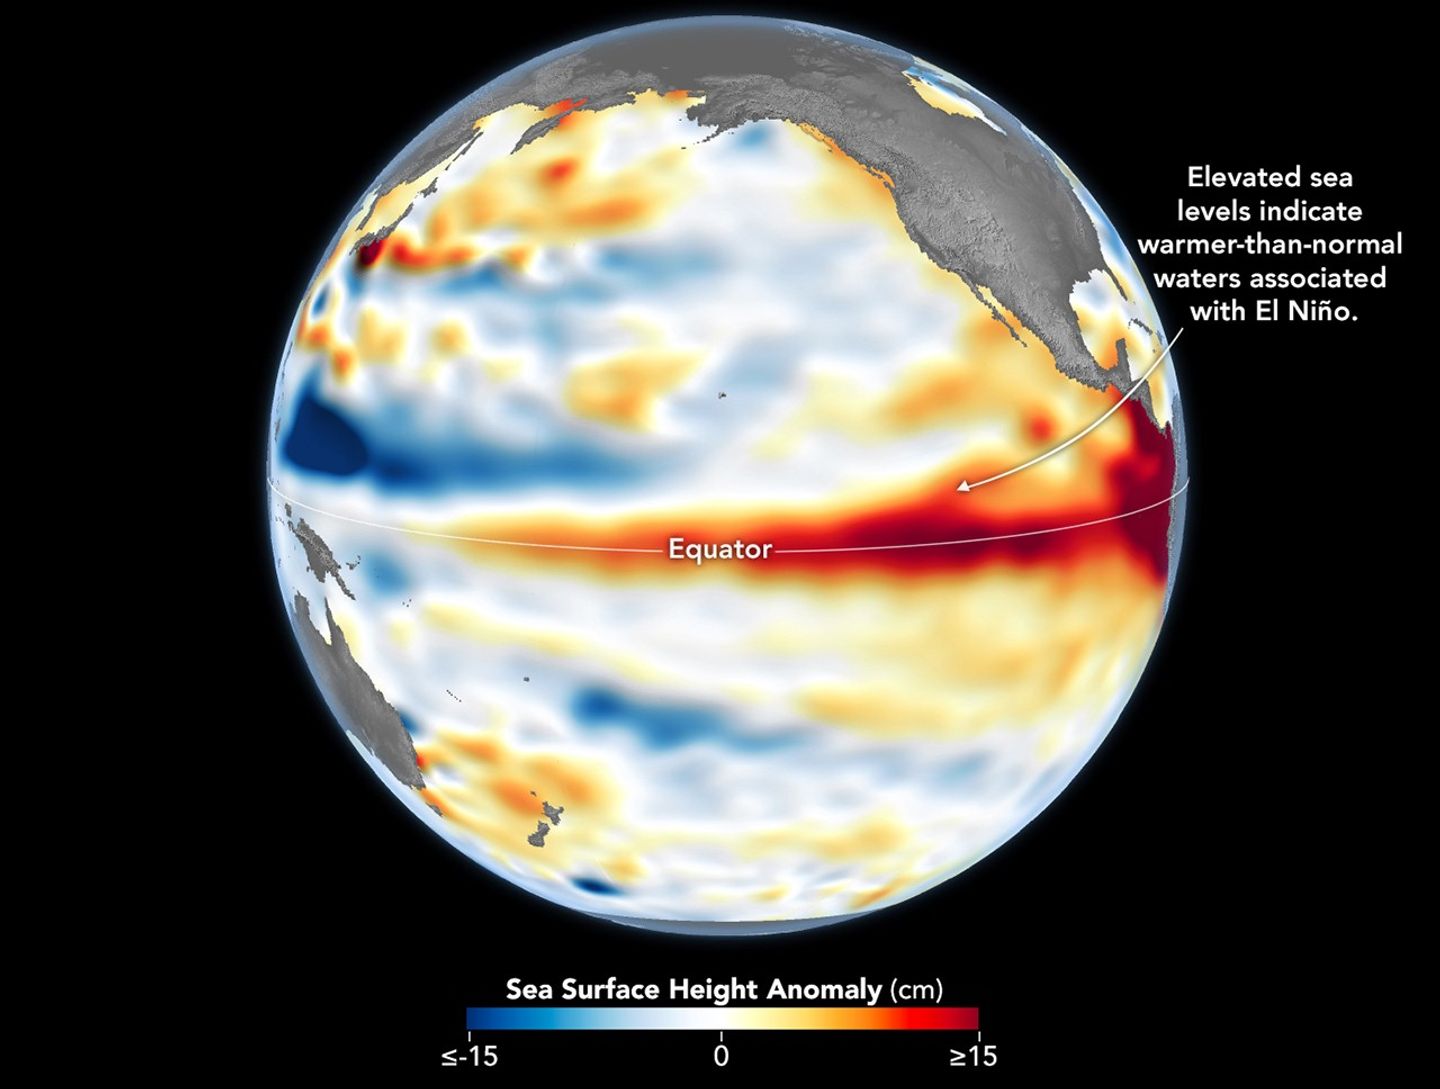
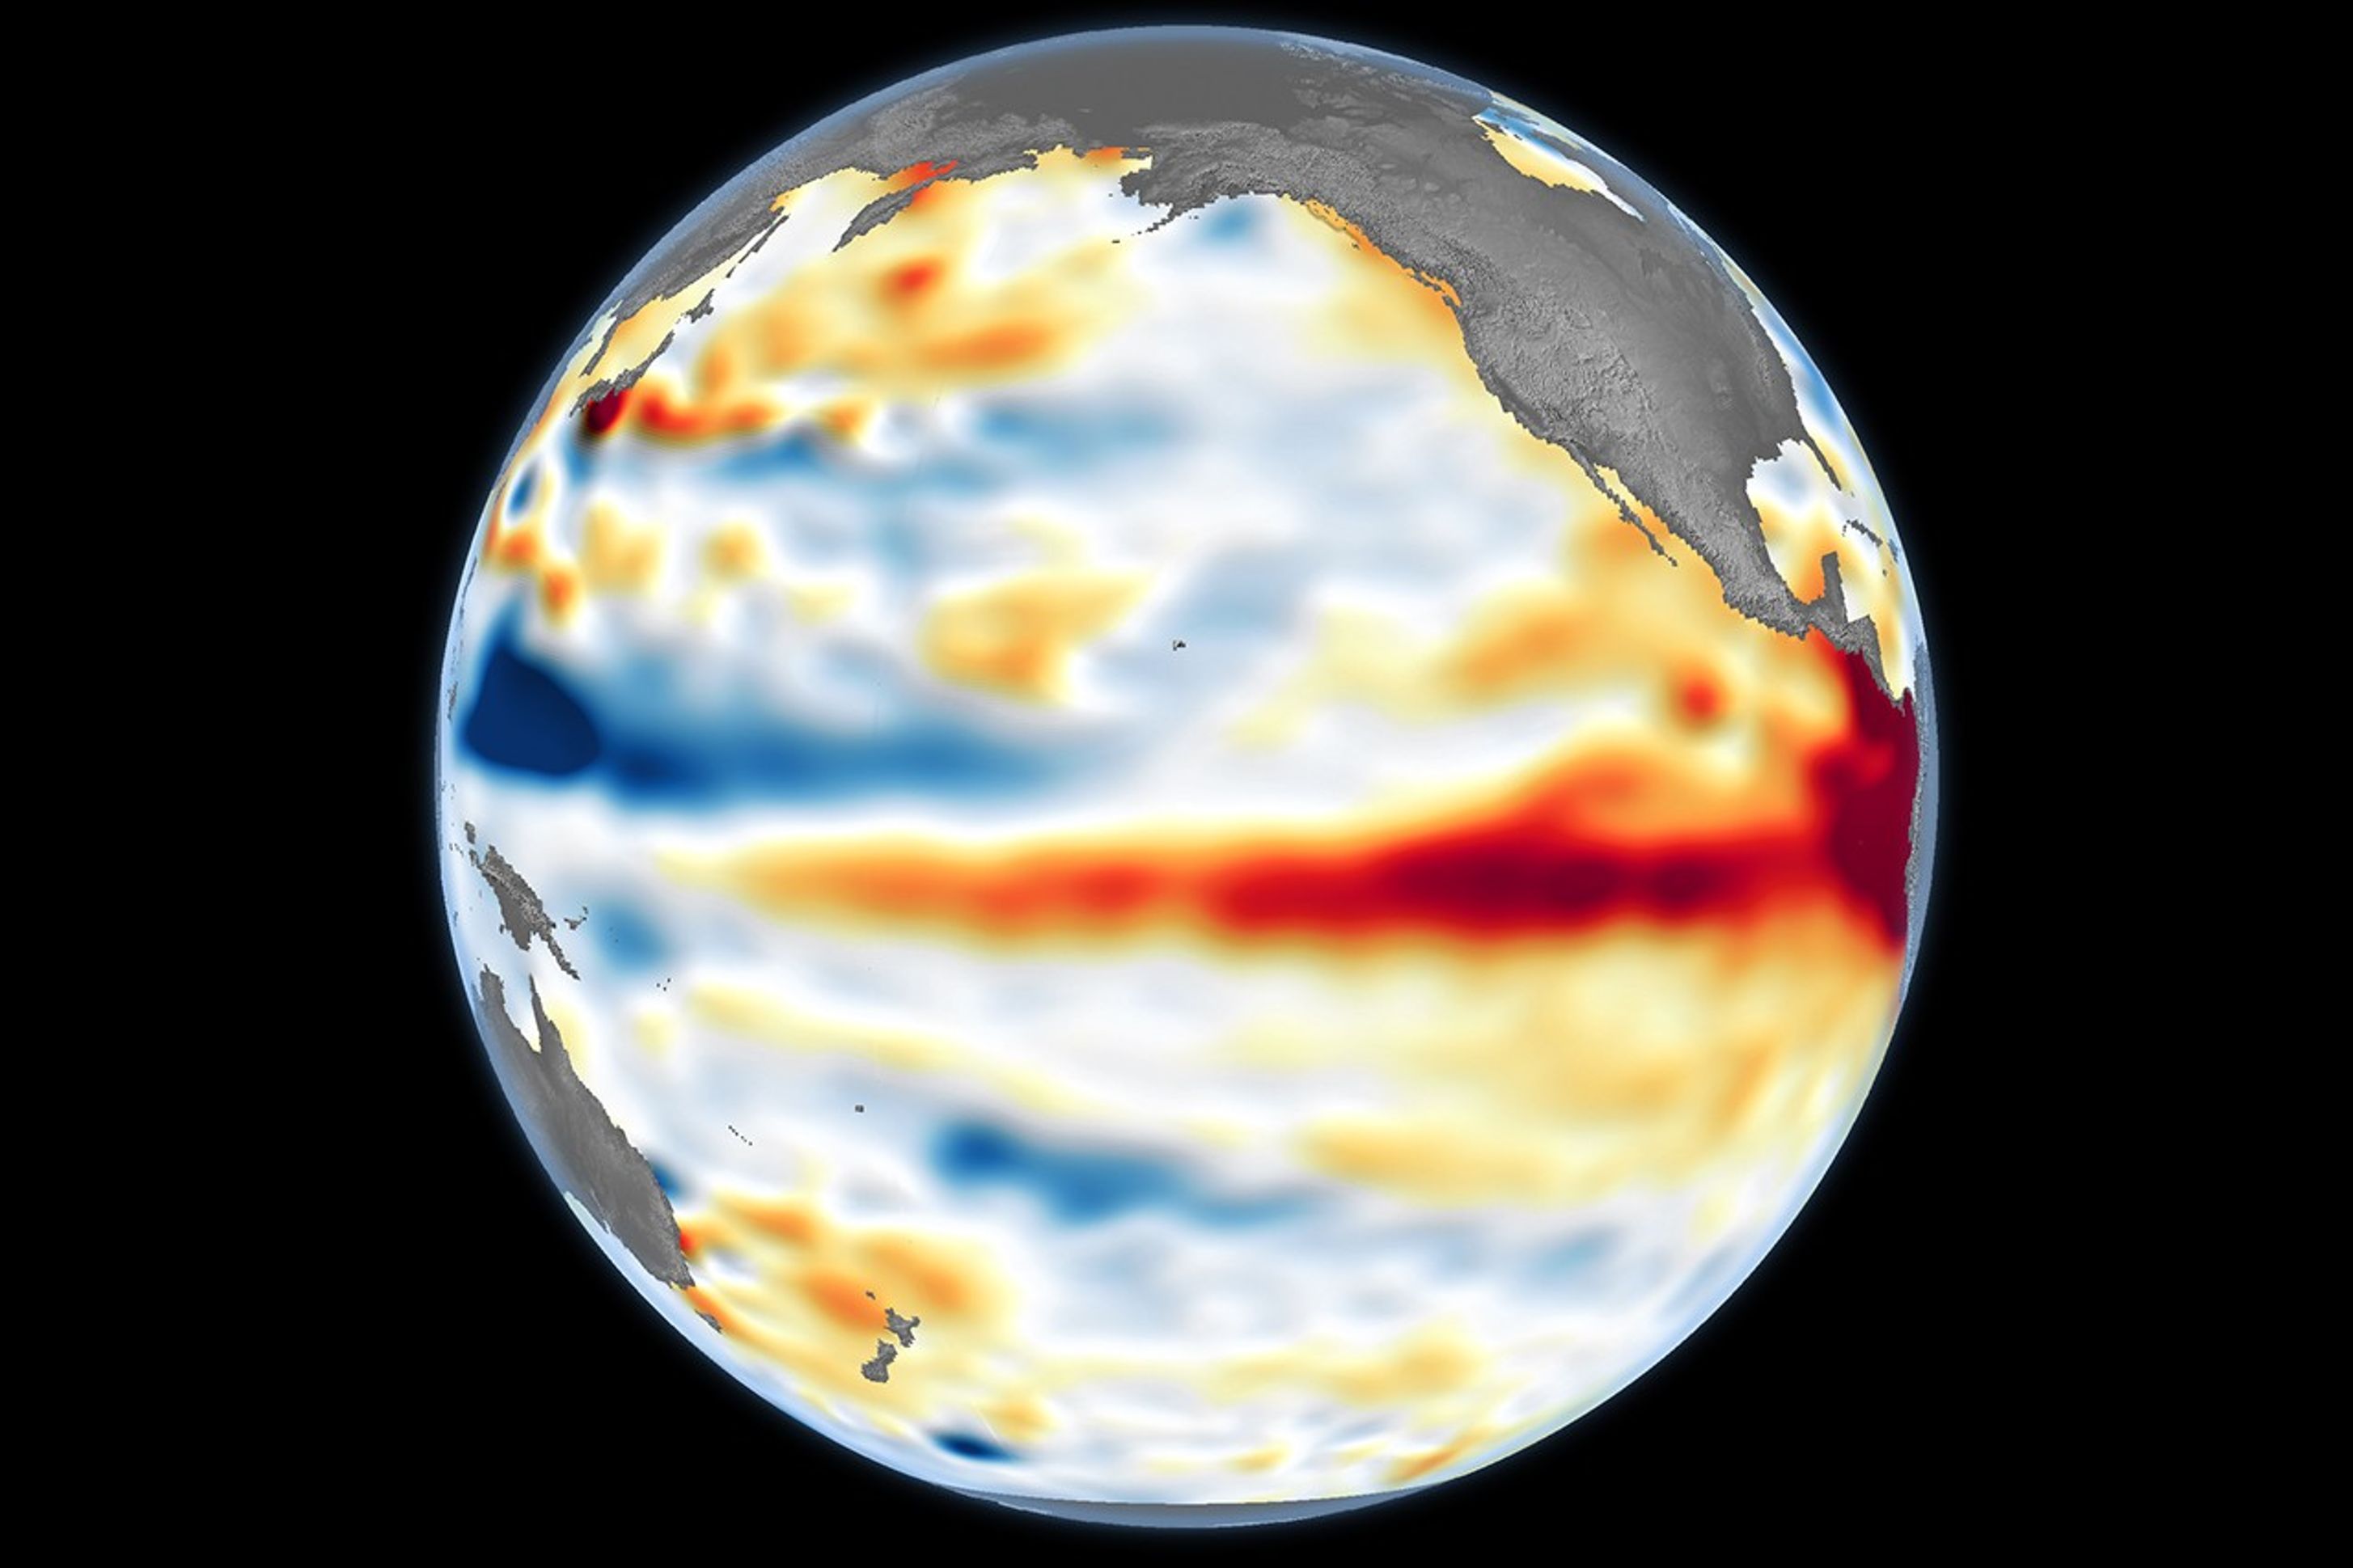
A global map centered on the Pacific Ocean shows a band of red, higher-than-normal water levels across the central and eastern equatorial Pacific and a broad patch off the coast of South America.
Higher-than-normal sea surfaces (red) are visible in the central and eastern Pacific on June 8, 2026, a few days before El Niño was declared. Data for the map were acquired by the Sentinel-6 Michael Freilich satellite and processed by scientists at NASA’s Jet Propulsion Laboratory (JPL).
NASA Earth Observatory/Lauren Dauphin

El Niño, characterized by warmer-than-normal water temperatures in parts of the equatorial Pacific, made its return in June 2026. Observations of sea surface height from the Sentinel-6 Michael Freilich satellite that month indicated that the 2026 event was continuing to strengthen.  

The natural, recurring phenomenon can have widespread effects, typically bringing wetter conditions to the U.S. Southwest and drought to countries in the western Pacific, such as Indonesia and Australia. NOAA declared an El Niño on June 11, after sea surface temperatures in the central and eastern equatorial Pacific measured at least 0.5 degrees Celsius above average for several consecutive months.

Meanwhile, NASA scientists have been observing a complementary sign of El Niño: areas of elevated sea surface height. When ocean water warms, it expands in volume and causes the sea surface to rise—making the water’s height a reliable indicator of ocean temperatures. Warmer-than-normal temperatures, hence higher sea surface heights, in parts of the equatorial Pacific Ocean are associated with El Niño.

The map above depicts sea surface height anomalies across the central and eastern Pacific Ocean as observed on June 8, 2026. Shades of red indicate sea levels that were higher than average. Normal sea level conditions appear white, and lower areas are blue.  

Data for the map were acquired by the Sentinel-6 Michael Freilich satellite—launched in 2020 by NASA and led by ESA (European Space Agency)—and processed by scientists at NASA’s Jet Propulsion Laboratory (JPL). Note that signals related to seasonal cycles and long-term trends have been removed to highlight sea level anomalies associated with El Niño and other short-term natural phenomena.

Earlier in spring 2026, the satellite started to detect precursor signs of El Niño as swells of warm water hundreds of miles wide, known as Kelvin waves, moved from the western Pacific to the eastern Pacific. That happens when trade winds in the western equatorial Pacific weaken and then temporarily reverse to blow from the west. Warm water piles up in the east, deepening the warm surface layer, lowering the thermocline, and suppressing the upwelling that usually keeps waters along the Pacific coasts of the Americas cooler.

This buildup of heat beneath the water’s surface is what sea surface height observations capture. It goes beyond surface temperature measurements to indicate how much heat is stored in the subsurface. That’s important because a shallow warm layer might not have much impact on climate and weather, while a large reservoir of heat below the surface can matter more.

According to JPL sea level researcher Severine Fournier, deputy project scientist for Sentinel-6 Michael Freilich, conditions in the western Pacific on June 8 looked similar to those from the same time in 1997, a year when an exceptionally strong El Niño emerged. Warm conditions in the eastern Pacific in 2026 have lagged behind, however, with fewer Kelvin waves built up by the same date.

Still, more warm Kelvin waves appeared to be approaching the eastern Pacific, meaning El Niño was still strengthening. Whether it catches up to 1997 depends on ocean activity in the coming weeks. “For now, it looks like it’s going to be a big one—more so than I would have said last week—but we still need more observations to know what’s going to happen.”

NASA Earth Observatory image by Lauren Dauphin, using modified Copernicus Sentinel data (2023) processed by the European Space Agency and further processed by Josh Willis, Severin Fournier, and Kevin Marlis/NASA/JPL-Caltech. Story by Kathryn Hansen.

Downloads

A global map centered on the Pacific Ocean shows a band of red, higher-than-normal water levels across the central and eastern equatorial Pacific and a broad patch off the coast of South America.

June 8, 2026

JPEG (1.19 MB)

References & Resources

You may also be interested in:

Stay up-to-date with the latest content from NASA as we explore the universe and discover more about our home planet.

Barents Sea Tied to Low Arctic Sea Ice
4 min read

Patches of open water in the region contributed to low sea ice extent across the Arctic in March 2026, which…

Article
New Eruption in the Bismarck Sea
5 min read

Satellite imagery shows a surge of new volcanic activity in the ocean near Papua New Guinea.

Article
Color Off the Mid-Atlantic Coast
4 min read

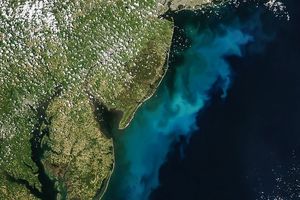
Something is brewing in shallow waters offshore of Delaware, New Jersey, Maryland, and Virginia.

Article

The post El Niño Is Underway appeared first on NASA Science.
  •  

El Niño Is Underway

A global map centered on the Pacific Ocean shows a band of red, higher-than-normal water levels across the central and eastern equatorial Pacific and a broad patch off the coast of South America.
Higher-than-normal sea surfaces (red) are visible in the central and eastern Pacific on June 8, 2026, a few days before El Niño was declared. Data for the map were acquired by the Sentinel-6 Michael Freilich satellite and processed by scientists at NASA’s Jet Propulsion Laboratory (JPL).
NASA Earth Observatory/Lauren Dauphin

El Niño, characterized by warmer-than-normal water temperatures in parts of the equatorial Pacific, made its return in June 2026. Observations of sea surface height from the Sentinel-6 Michael Freilich satellite that month indicated that the 2026 event was continuing to strengthen.  

The natural, recurring phenomenon can have widespread effects, typically bringing wetter conditions to the U.S. Southwest and drought to countries in the western Pacific, such as Indonesia and Australia. NOAA declared an El Niño on June 11, after sea surface temperatures in the central and eastern equatorial Pacific measured at least 0.5 degrees Celsius above average for several consecutive months.

Meanwhile, NASA scientists have been observing a complementary sign of El Niño: areas of elevated sea surface height. When ocean water warms, it expands in volume and causes the sea surface to rise—making the water’s height a reliable indicator of ocean temperatures. Warmer-than-normal temperatures, hence higher sea surface heights, in parts of the equatorial Pacific Ocean are associated with El Niño.

The map above depicts sea surface height anomalies across the central and eastern Pacific Ocean as observed on June 8, 2026. Shades of red indicate sea levels that were higher than average. Normal sea level conditions appear white, and lower areas are blue.  

Data for the map were acquired by the Sentinel-6 Michael Freilich satellite—launched in 2020 by NASA and led by ESA (European Space Agency)—and processed by scientists at NASA’s Jet Propulsion Laboratory (JPL). Note that signals related to seasonal cycles and long-term trends have been removed to highlight sea level anomalies associated with El Niño and other short-term natural phenomena.

Earlier in spring 2026, the satellite started to detect precursor signs of El Niño as swells of warm water hundreds of miles wide, known as Kelvin waves, moved from the western Pacific to the eastern Pacific. That happens when trade winds in the western equatorial Pacific weaken and then temporarily reverse to blow from the west. Warm water piles up in the east, deepening the warm surface layer, lowering the thermocline, and suppressing the upwelling that usually keeps waters along the Pacific coasts of the Americas cooler.

This buildup of heat beneath the water’s surface is what sea surface height observations capture. It goes beyond surface temperature measurements to indicate how much heat is stored in the subsurface. That’s important because a shallow warm layer might not have much impact on climate and weather, while a large reservoir of heat below the surface can matter more.

According to JPL sea level researcher Severine Fournier, deputy project scientist for Sentinel-6 Michael Freilich, conditions in the western Pacific on June 8 looked similar to those from the same time in 1997, a year when an exceptionally strong El Niño emerged. Warm conditions in the eastern Pacific in 2026 have lagged behind, however, with fewer Kelvin waves built up by the same date.

Still, more warm Kelvin waves appeared to be approaching the eastern Pacific, meaning El Niño was still strengthening. Whether it catches up to 1997 depends on ocean activity in the coming weeks. “For now, it looks like it’s going to be a big one—more so than I would have said last week—but we still need more observations to know what’s going to happen.”

NASA Earth Observatory image by Lauren Dauphin, using modified Copernicus Sentinel data (2023) processed by the European Space Agency and further processed by Josh Willis, Severin Fournier, and Kevin Marlis/NASA/JPL-Caltech. Story by Kathryn Hansen.

Downloads

A global map centered on the Pacific Ocean shows a band of red, higher-than-normal water levels across the central and eastern equatorial Pacific and a broad patch off the coast of South America.

June 8, 2026

JPEG (1.19 MB)

References & Resources

You may also be interested in:

Stay up-to-date with the latest content from NASA as we explore the universe and discover more about our home planet.

Barents Sea Tied to Low Arctic Sea Ice
4 min read

Patches of open water in the region contributed to low sea ice extent across the Arctic in March 2026, which…

Article
New Eruption in the Bismarck Sea
5 min read

Satellite imagery shows a surge of new volcanic activity in the ocean near Papua New Guinea.

Article
Color Off the Mid-Atlantic Coast
4 min read

Something is brewing in shallow waters offshore of Delaware, New Jersey, Maryland, and Virginia.

Article
  •  
❌