Discover the cosmos! Each day a different image or photograph of our fascinating universe is featured, along with a brief explanation written by a professional astronomer.
Discover the cosmos! Each day a different image or photograph of our fascinating universe is featured, along with a brief explanation written by a professional astronomer.
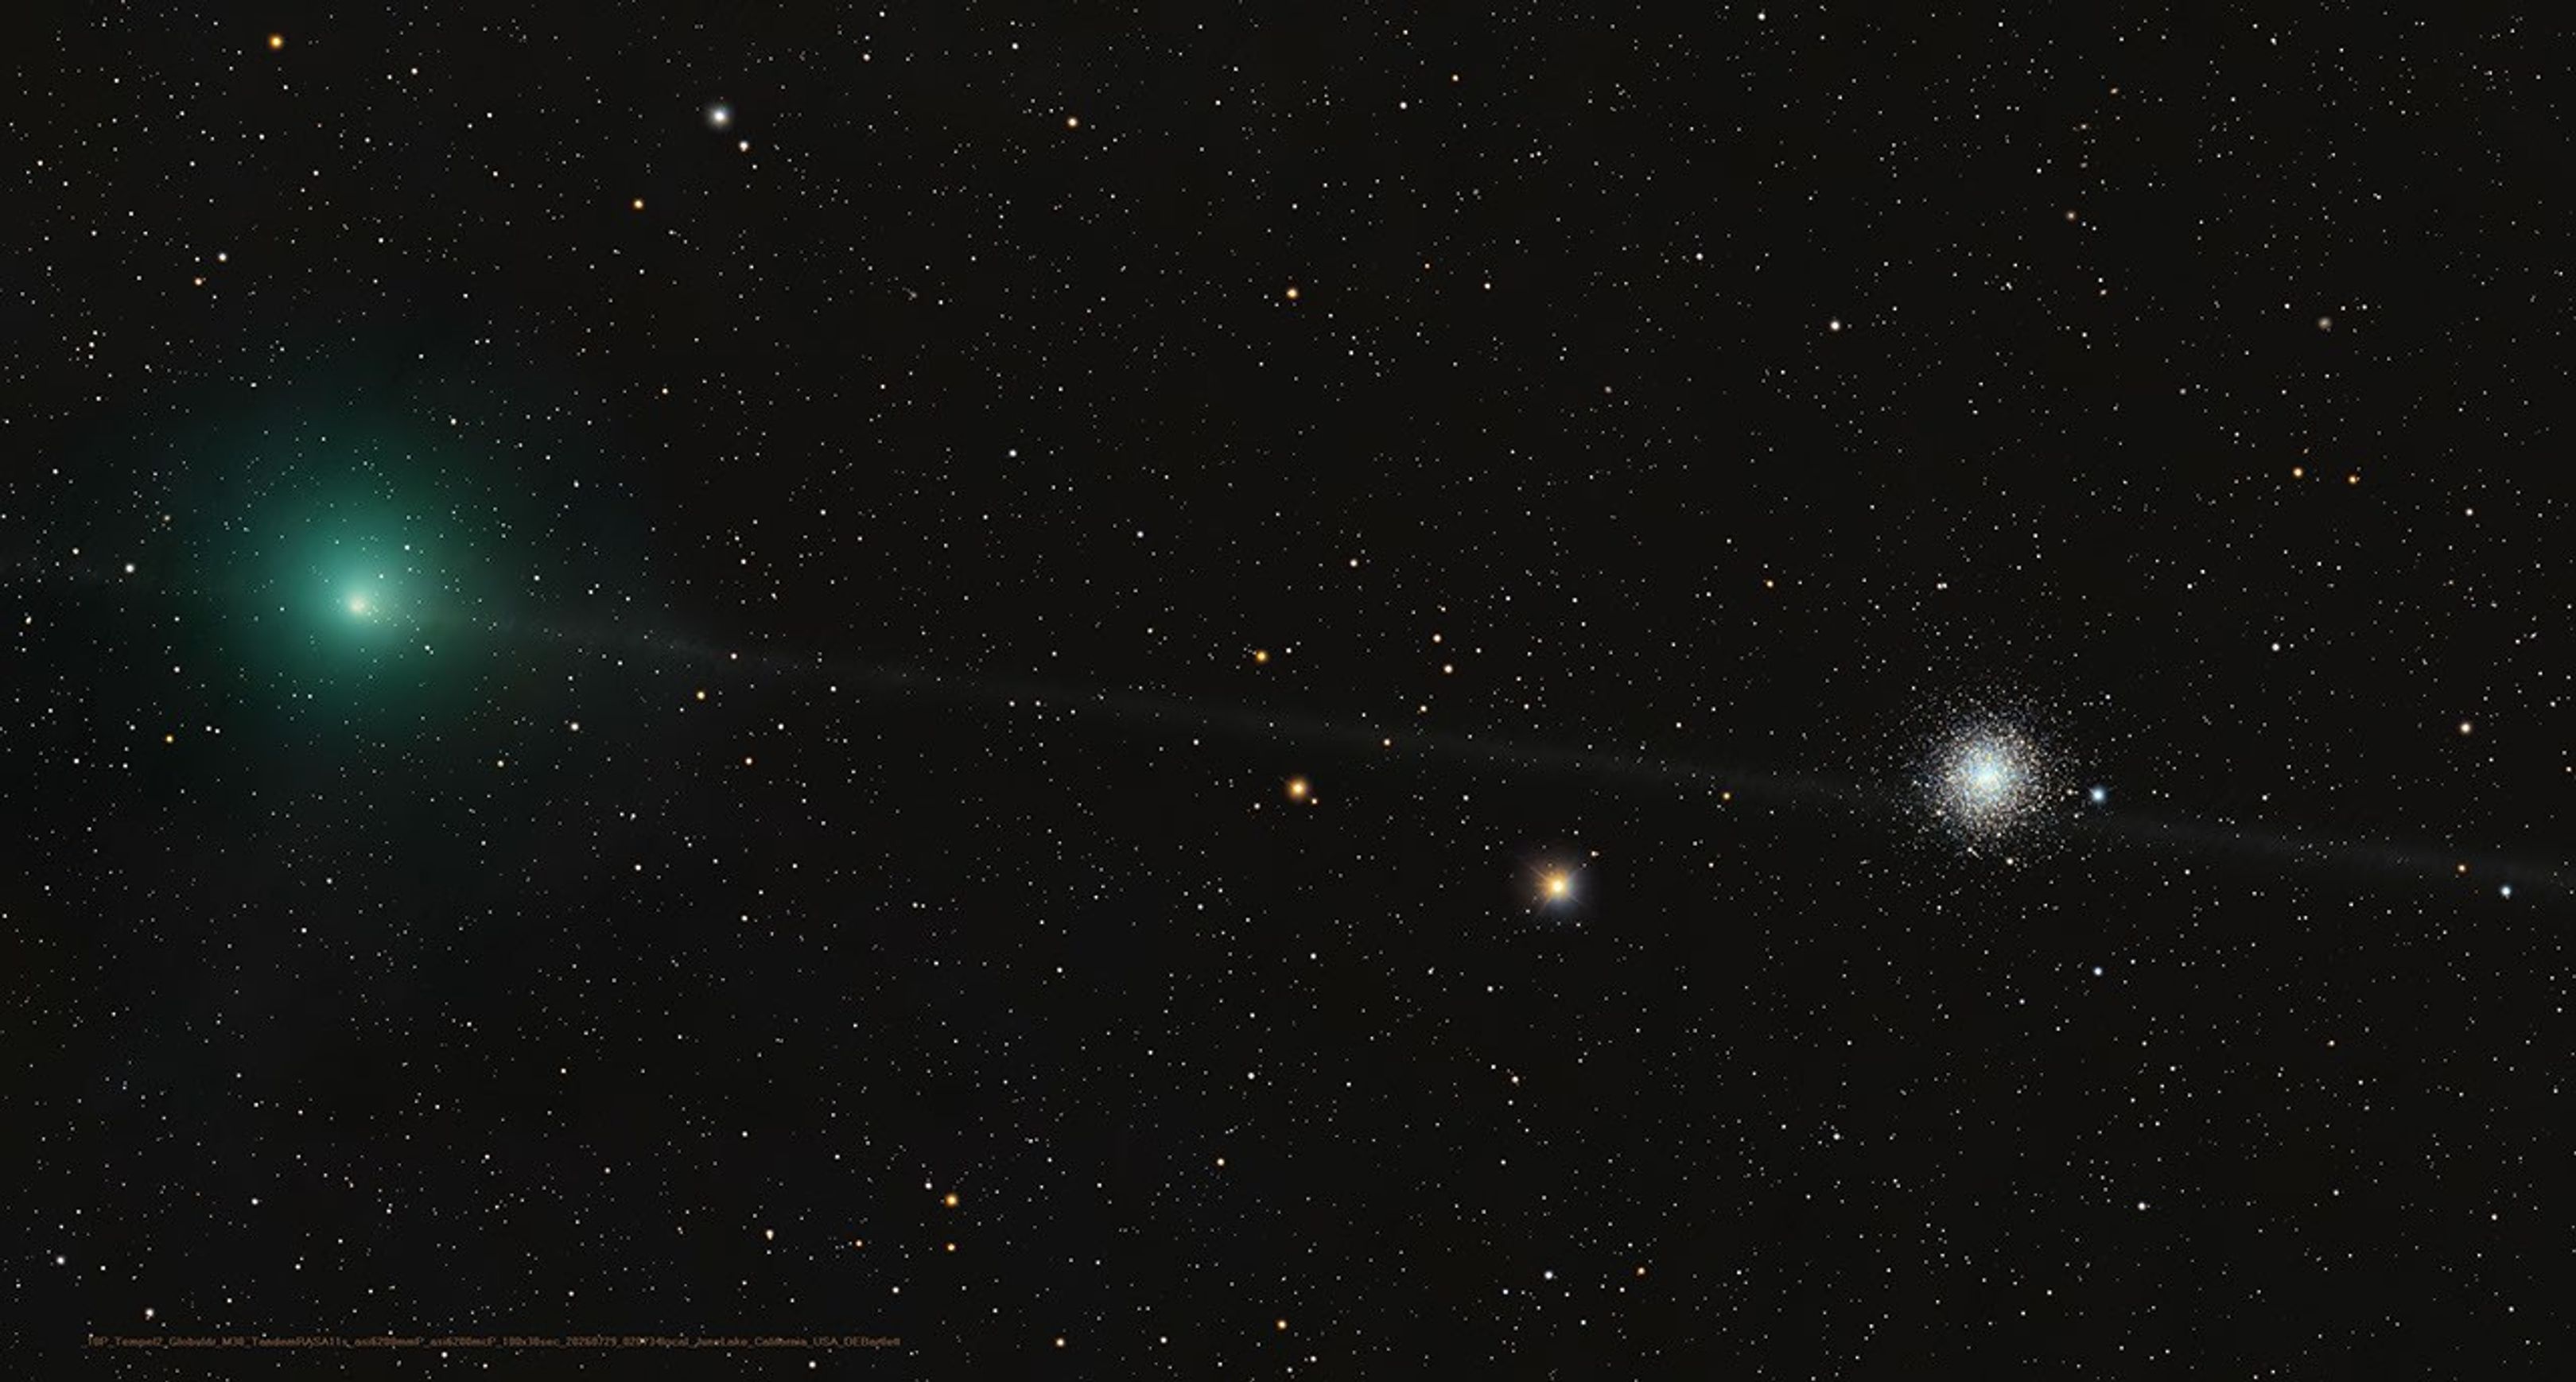
A Messier Moment for Tempel 2
Explanation: Which of these is not a comet? You guessed it – the one on the right is a globular star cluster. The diffuse greenish coma of periodic comet 10P/Tempel 2 is at left in the frame. In fact the globular star cluster is Messier 30, also known as M30, or the 30th entry in astronomer Charles Messier’s catalog of things which are not comets. The well-known 18th century astronomer kept a list of objects he observed, now his famous Messier Catalogue of Nebulae and Star Clusters, which did not move from night to night against the background stars and so were not the comets he was hunting for. So the famous comet hunter would get the correct answer too, even though his telescope would show both 10P/Tempel 2 and distant star cluster as similar looking faint and fuzzy objects in his field of view. Recorded on July 29, this modern telescopic image captures periodic comet Tempel 2 as it briefly swept close on the sky to M30. While the periodic comet’s faint, narrow, orbital dust trail seems to pierce the globular star cluster, Tempel 2 was a mere 3.5 light-minutes away. Messier 30 is some 28,000 light-years distant.
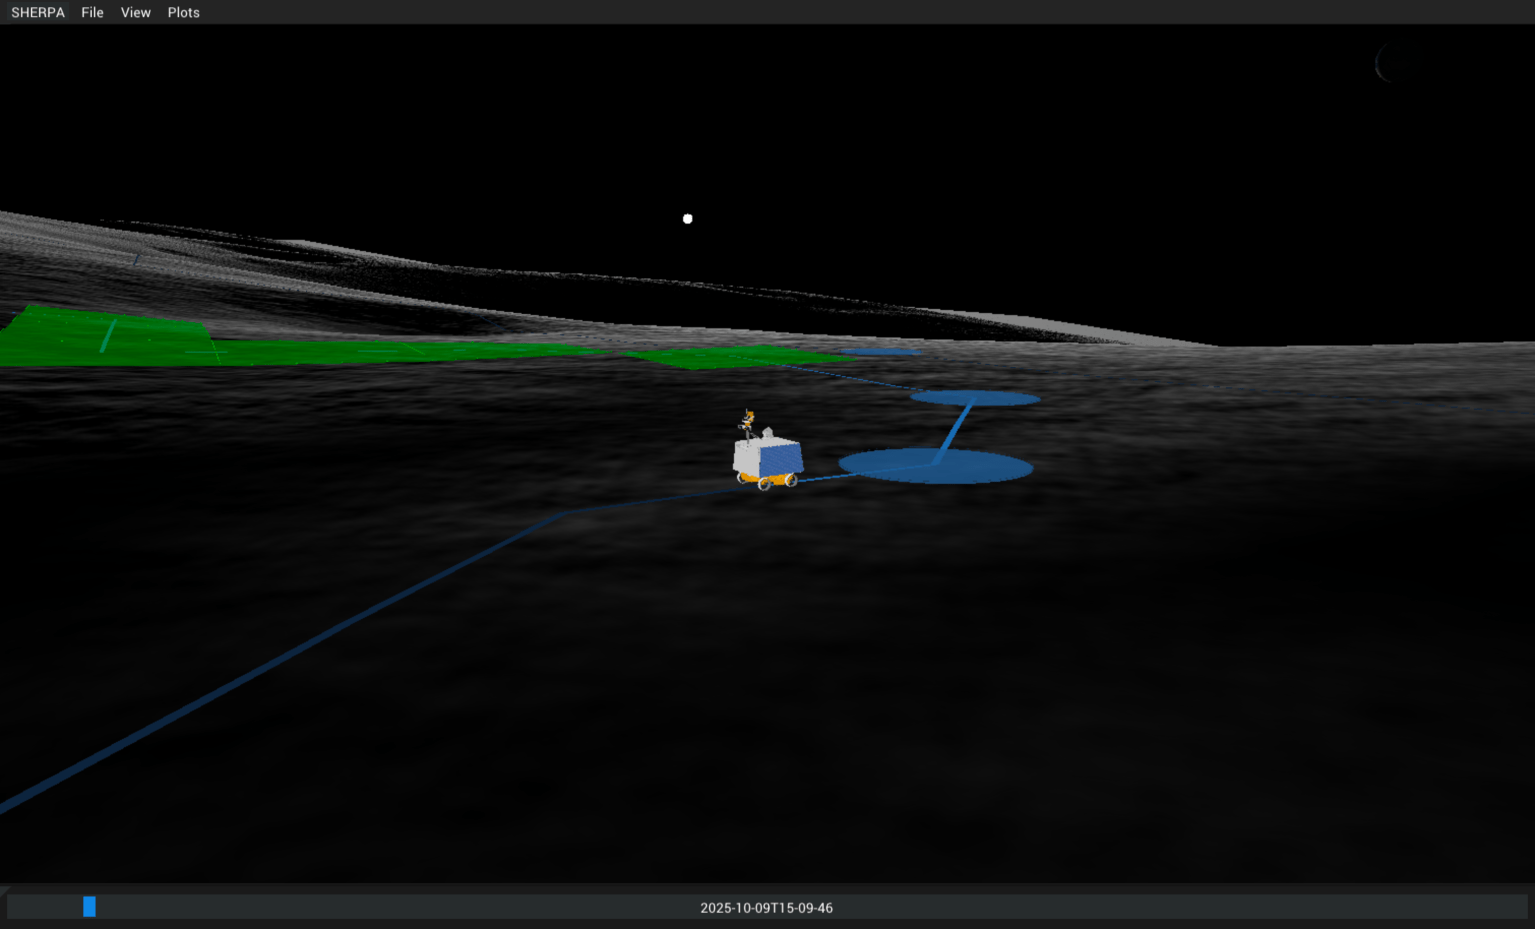
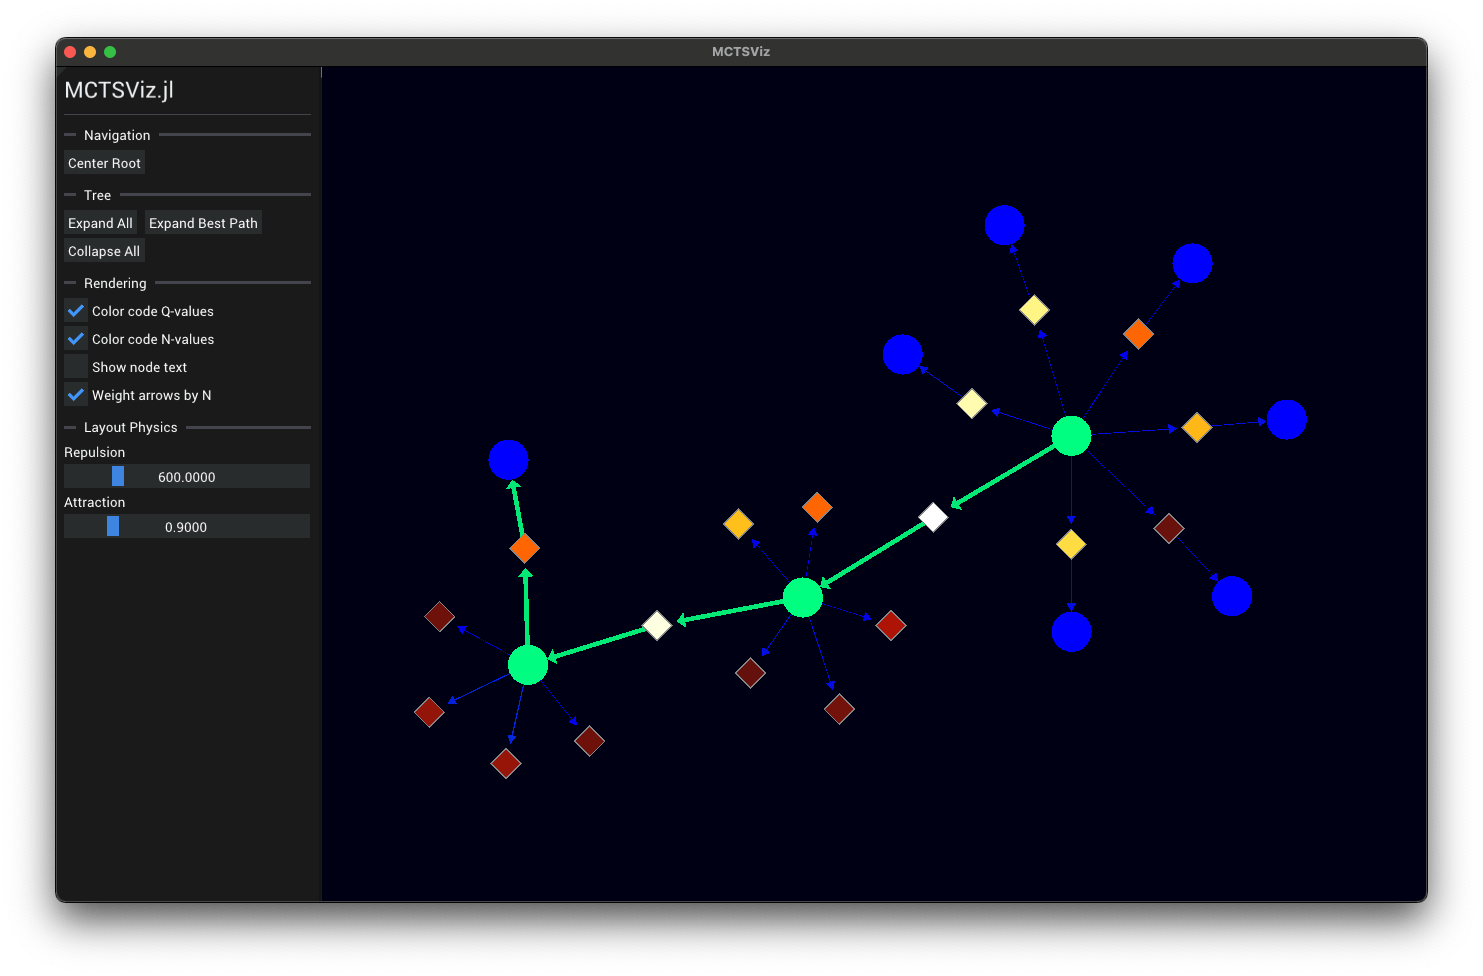
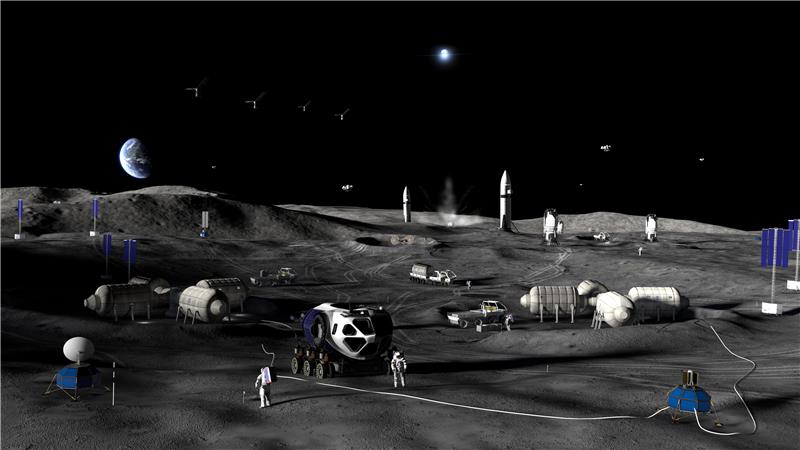
Strategic planning and simulation tool used for many lunar rover projects such as VIPER, Artemis Pressurized Rover, and CT-4. Utilizes AI methods for decision making under uncertainty such as Markov decision processes (MDPs) and partially observable Markov decision processes (POMDPs) for automated optimal mission planning.
State of the art map computation for off-world missions
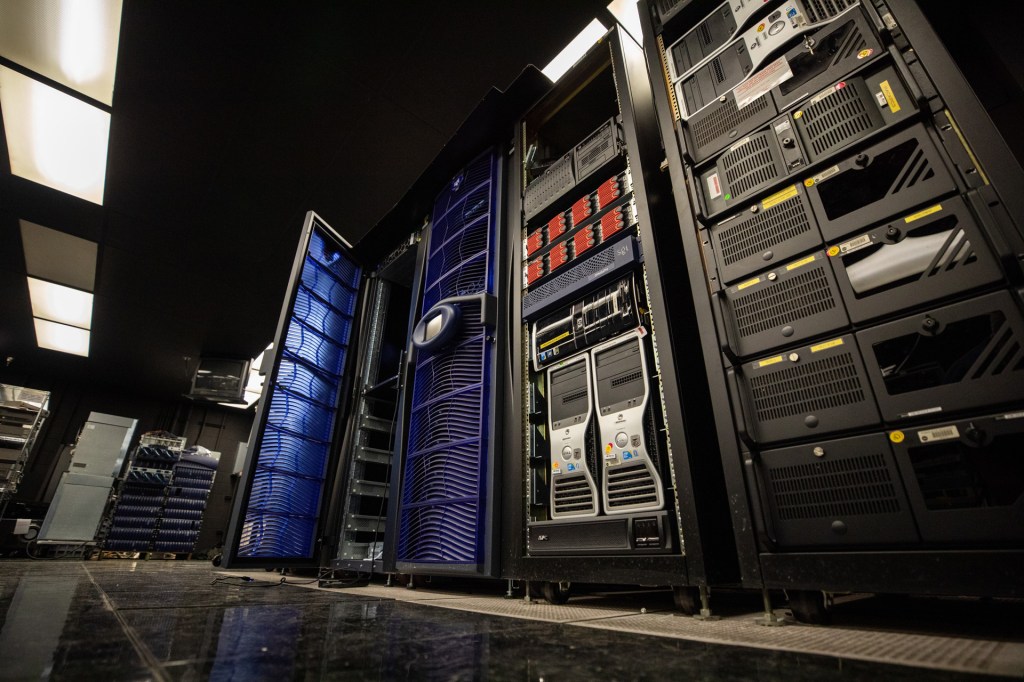
Running on the NASA Ames supercomputer, Hyperion is used for multiple missions to simulate conditions off-world. For VIPER, Artemis, and Moon Base missions, Hyperion is used to compute lighting conditions ahead of time in different operating regions near the lunar south pole for use in mission planning software such as SHERPA.
Pushing the state of the art of AI, MDPs, and POMDPs for missions which must make autonomous real-time decisions far from home.
In development for highly autonomous missions including deep space missions, SHERPA-RPA is used to construct extensively tested and validated decision making policies ahead of time that will be autonomously executed onboard. This enables new types of missions which do not need to rely on extensive human operator support.
Library for developing desktop GUIs in Julia with real-time 2D and 3D graphics.
Originally built for the SHERPA GUI, Mirage.jl powers all of ADMG’s graphical tools. From inspecting in the internals of MDPs and POMDPs, to visualizing rover missions on the lunar south pole, Mirage.jl seamlessly integrates into the Julia language ecosystem and enables developer friendly 2D and 3D real-time rendering.
Edward Balaban Zachary Booth Evan Astle Grace Kim Michelle Ho Kirthika Ashokkumar
Alumni
Tomer Arnon Somrita Banerjee Saylor Brisson Thomas Cannon Wyatt Cannon Jennifer Chang Sophia Eichholz Sarah Feng Alex Gao Miguel Garcia Leyton Ho Chandler Kilpatrick Logan Kilpatrick Robert Moss Molly O’Connor Joshua Ott Nobel Truong Hailey Warner
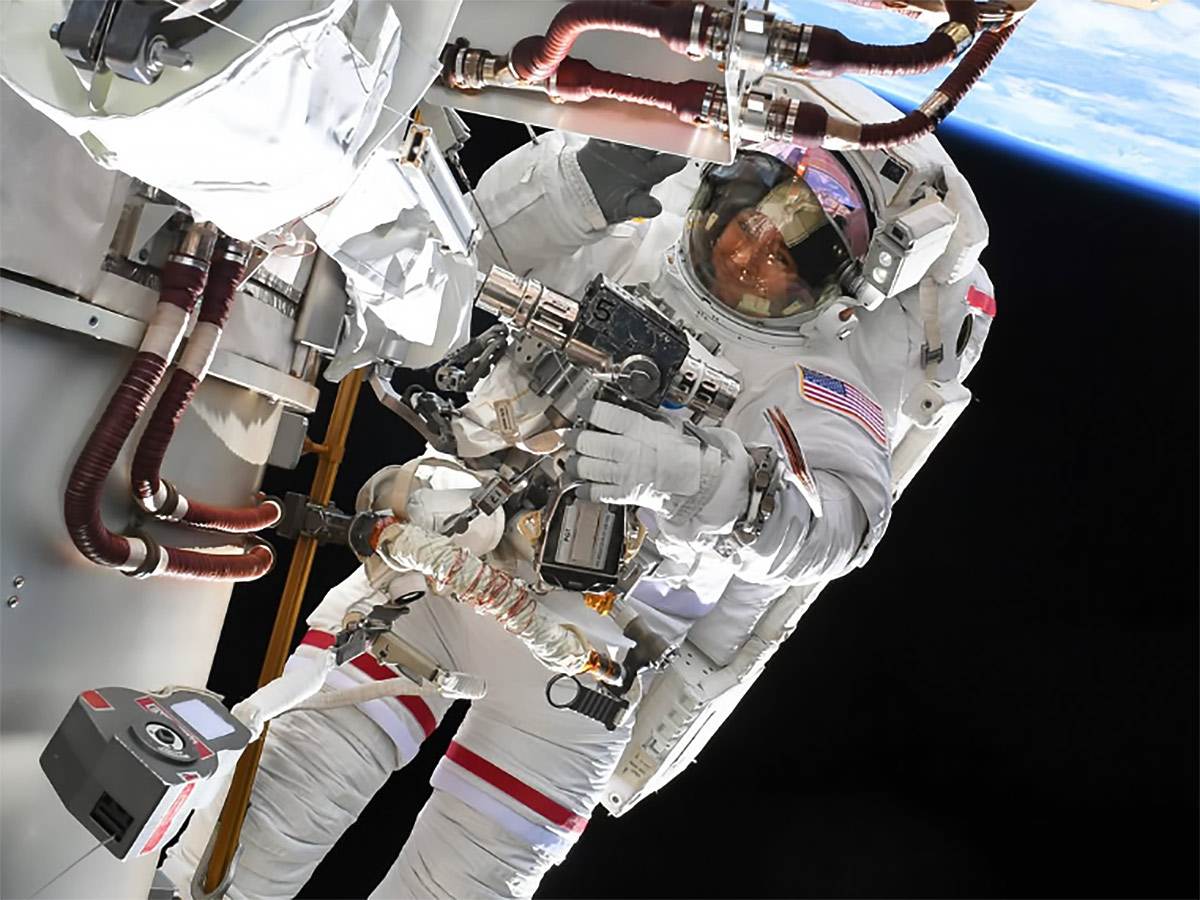
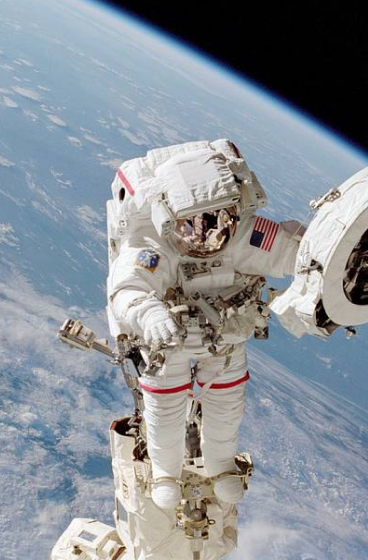
NASA astronaut Jessica Meir shared a pictured of herself during a spacewalk on her Instagram page taken by NASA astronaut Anil Menon.
Instagram/@Astro_Jessica
On Aug. 6, NASA astronauts Jessica Meir and Anil Menon concluded a 6-hour, 27-minute spacewalk outside the International Space Station. Meir and Menon successfully completed their primary objective of preparing the 3B power channel for the future installation of a roll out solar array. Toward the end of the spacewalk, a carbon dioxide sensor on Menon’s spacesuit indicated an unexpected data reading. Menon reported no other issues during the spacewalk.
Although the sensor returned to normal readings following removal of the suit, engineers on the ground will continue to evaluate over the coming days whether to change suits for the next spacewalk. As a result, NASA will move the next spacewalk to replace a Space-to-Ground antenna on the space station to Tuesday, Aug. 18. As of now, the third planned spacewalk this month remains scheduled on Tuesday, Aug. 25. The agency will provide additional spacewalk details early next week.
On Friday, NASA astronaut Jack Hathaway of studied Canadarm2 robotic arm operations planned to support the next spacewalk. NASA will soon name the spacewalkers who will replace a space-to-ground antenna to maintain high-speed data and communication transmissions between Mission Control Center and the space station.
ESA (European Space Agency) astronaut Sophie Adenot was back on exercise research working out with new and advanced gear to inform countermeasures that may improve muscle and bone health in microgravity. She first wore the EasyMotion-2 suit that sent electrical impulses and triggered muscle contractions to supplement her workout session on the advanced resistive exercise device in the Tranquility module. Afterward, she moved into the Columbus laboratory module and performed rope pull exercises on the European Enhanced Exploration Exercise Device (E4D). Researchers are evaluating the E4D’s effectiveness for use on missions to the Moon, Mars, and beyond.
Numerous science investigations and lab maintenance tasks also kept the three Expedition 75 cosmonauts busy at the end of the week. Roscosmos flight engineer Andrey Fedyaev started his shift measuring his blood pressure while wearing a series of cuffs on his arm, wrist, and fingers for a circulation system study. He wrapped up his day inspecting and cleaning smoke detectors in the Rassvet module. Flight engineer Pyotr Dubrov set up an automated Earth photography session to capture European and Asian landmarks then tested artificial intelligence tools to improve crew operations. Flight engineer Anna Kikina worked in the Zarya module photographing areas to identify optimal stowage locations and locate hardware.
Discover the cosmos! Each day a different image or photograph of our fascinating universe is featured, along with a brief explanation written by a professional astronomer.
Discover the cosmos! Each day a different image or photograph of our fascinating universe is featured, along with a brief explanation written by a professional astronomer.
Buck Moon and Belt of Venus
Explanation:The Buck Moon is a traditional name for the full moon of July. In this colorful Adriatic sea and skyscape captured on July 28 from Krk Island along the coast of Croatia, a full Buck Moon is just rising over distant mountains. Since a full moon rises as the Sun sets, Earth’s shadow also rises in the twilight scene, a diffuse gray band extending above the mountainous southeastern horizon. Above Earth’s shadow band is the pinkish antitwilight arch. That subtly tinted band of backscattered sunlight is more widely known as the Belt of Venus. As it shares the eastern horizon with the atmospheric shadow of Earth and Belt of Venus, this full Buck Moon seems to set the stage for the New Moon to come. The New Moon of August 12 will cast its own shadow on planet Earth in a much anticipated total solar eclipse.
A solar eclipse, the Perseids, bright Venus after sunset, and a deep partial lunar eclipse highlight August’s skywatching.
Skywatching Highlights
Aug. 5: Last Quarter Moon
Aug. 12: Total solar eclipse across northern Russia, Greenland, Iceland, northern Spain, and part of Portugal; partial eclipse in parts of the U.S.; New Moon
Aug. 12-13: Perseid meteor shower peak under dark skies
Aug. 14-16: Venus reaches greatest eastern elongation and shines low in the west after sunset
Aug. 27-28: Partial lunar eclipse visible from much of North and South America and parts of Europe and Africa
Transcript
A solar eclipse, one of the year’s best meteor showers, Venus at its brightest in the evening sky, and a lunar eclipse to close out the month.
That’s “What’s Up” for August.
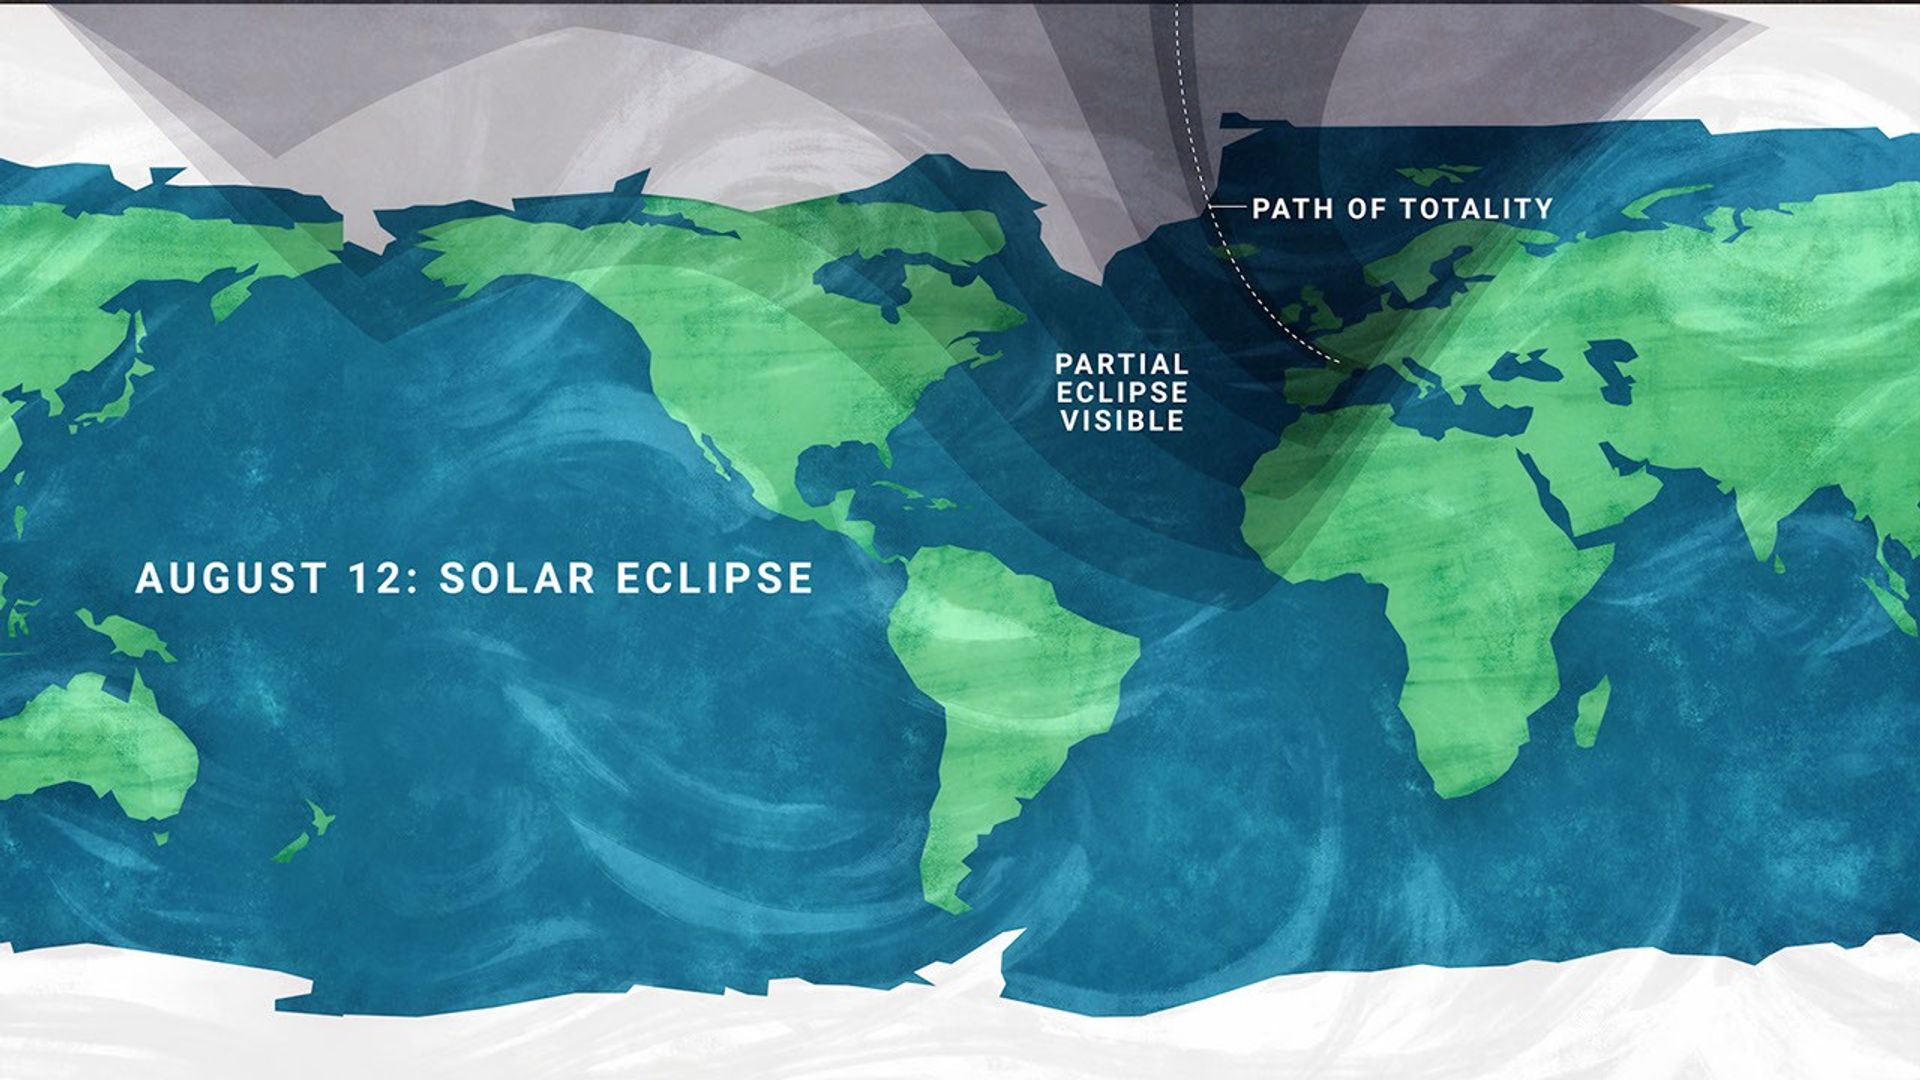
On Aug. 12, a total solar eclipse crosses northern Russia, Greenland, Iceland, and northern Spain, with a small corner of Portugal inside the path of totality.
In parts of the United States, from Alaska to North Carolina, the eclipse is partial. The Moon will take only a small bite out of the Sun, and the amount of coverage will vary with location.
A map showing viewing areas of the August 2026 total solar eclipse.
NASA/JPL-Caltech
Remember to watch safely. Use certified eclipse glasses or a safe solar viewer any time any part of the Sun is visible. Regular sunglasses are not safe. And never use binoculars, a telescope, or a camera without a solar filter made for the front of the optics.
Later that same night, the Perseid meteor shower will light up the sky, peaking the evening of Aug. 12 into the early morning hours of the 13th. And with a New Moon arriving on the 12th, the skies will be ideally dark.
The Perseids happen every year when Earth passes through a debris stream left behind by Comet Swift-Tuttle. As those tiny bits of comet dust hit our atmosphere at high speed, they burn up as bright streaks of light.
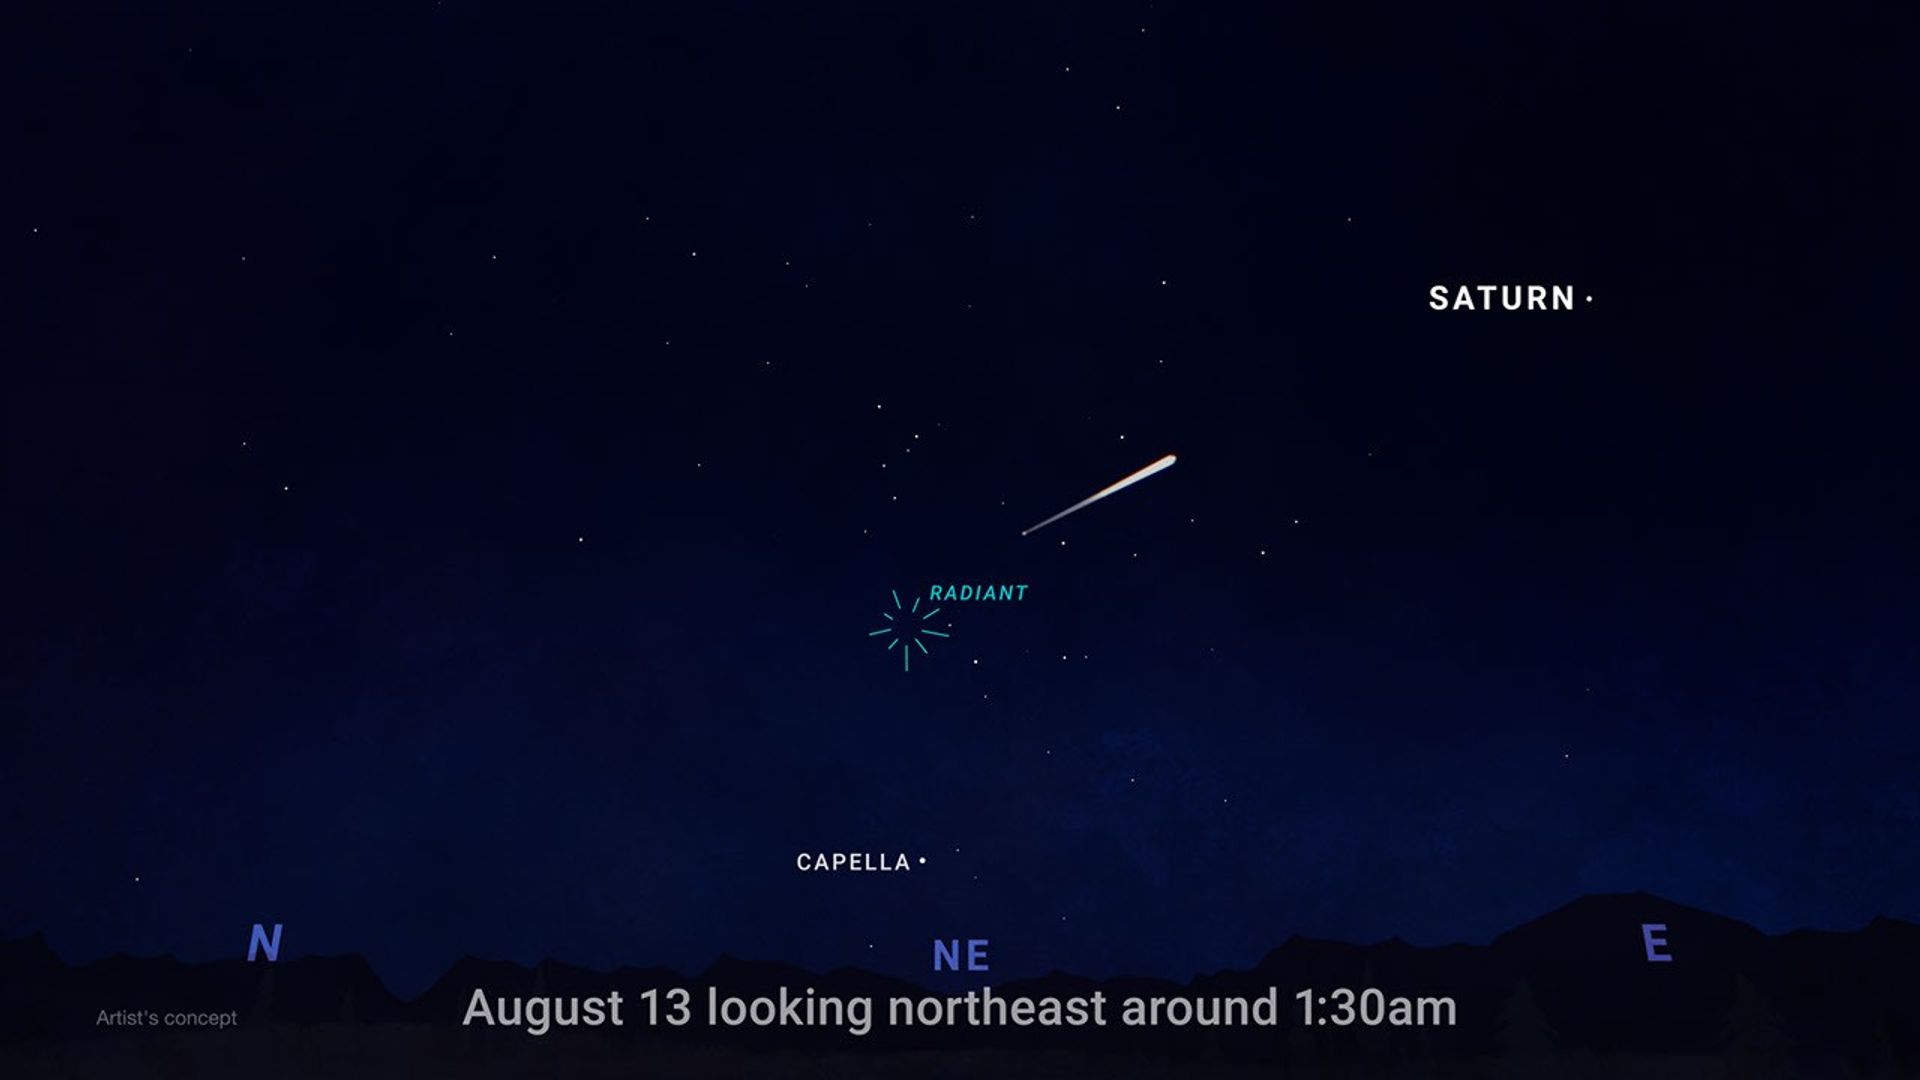
To view this meteor shower, look toward the northeast once it’s fully dark and watch for the constellation Perseus to clear the horizon. This is where the meteors originate, but let your eyes wander, because they can flash across any part of the sky.
For the best view, stay out late as the stars climb higher, find a dark open spot, and give your eyes 30 minutes to adjust.
This illustration shows where in the night sky to look for the Perseid meteor shower.
NASA/JPL-Caltech
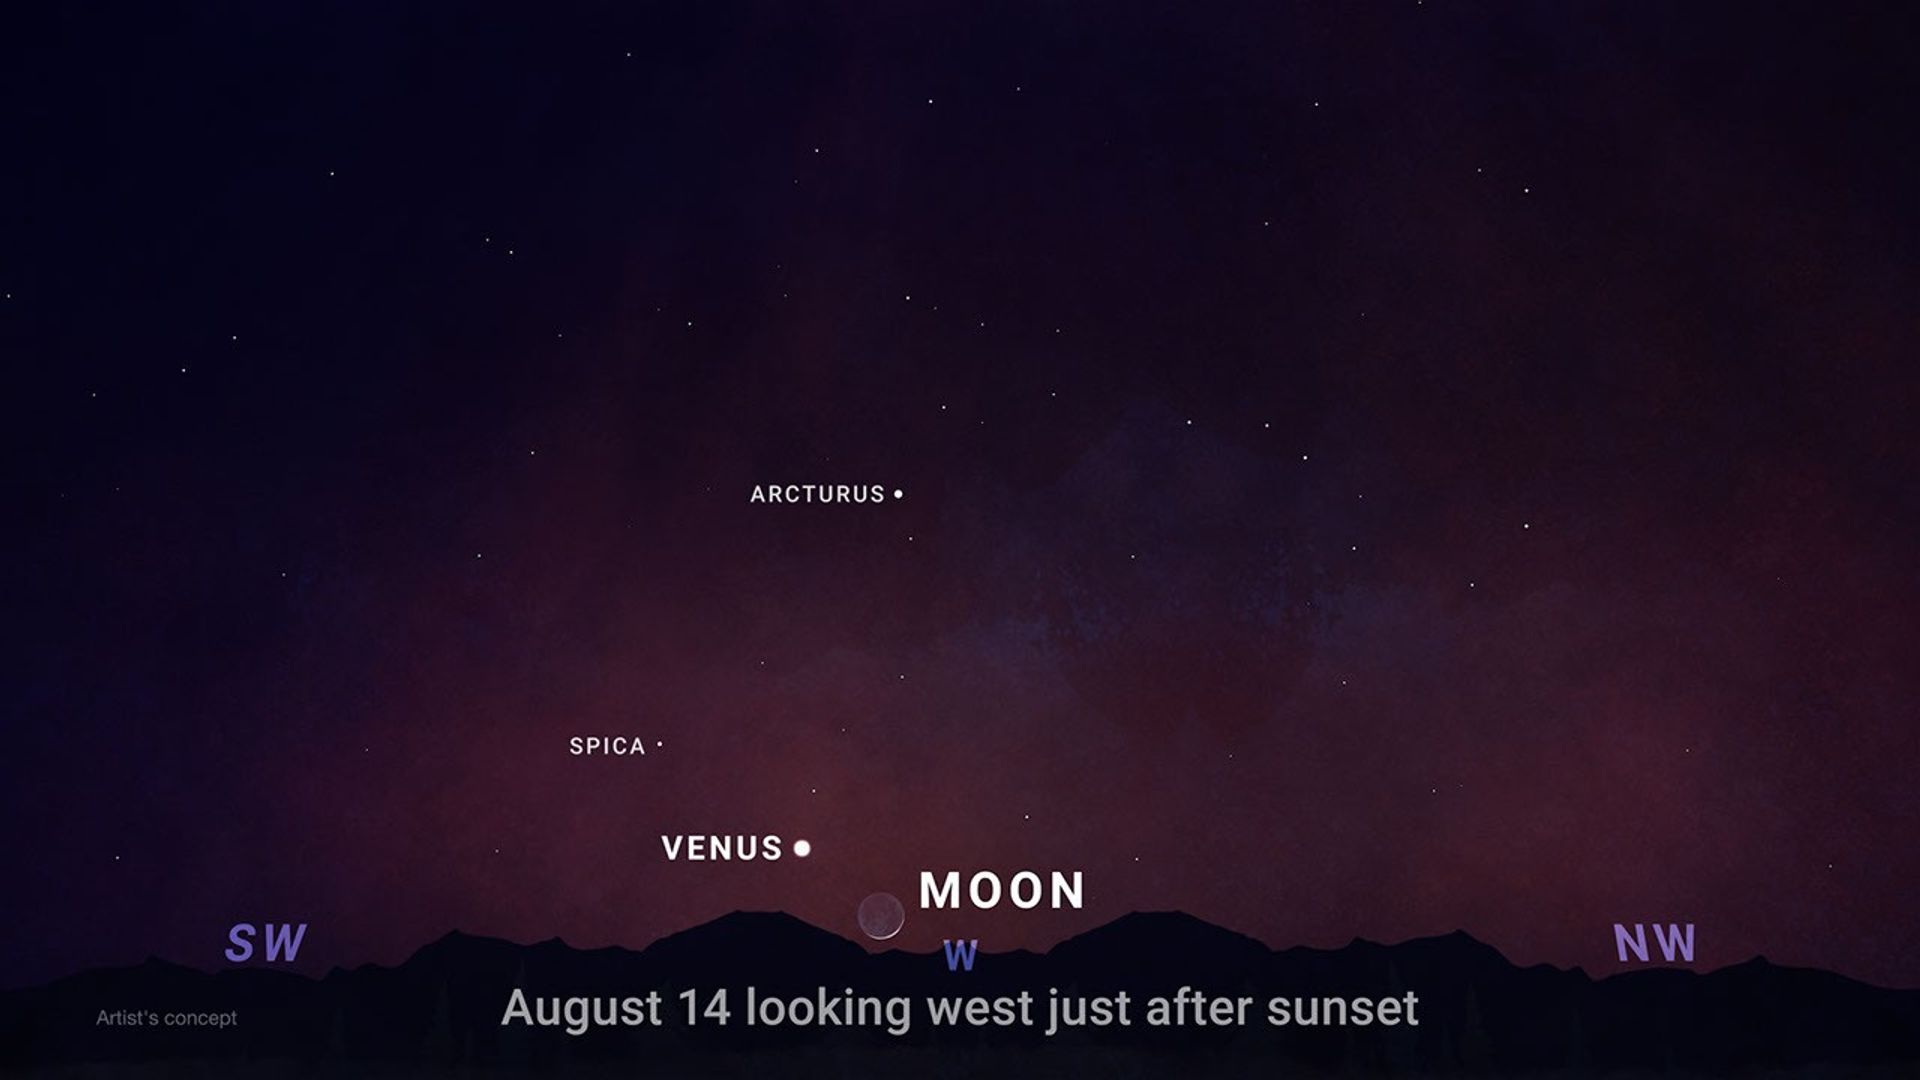
Aug. 14-16, Venus reaches its greatest eastern elongation, which is its widest apparent separation from the Sun during this evening appearance.
Look low in the western sky shortly after sunset for the bright object that will outshine every star around it. Through a telescope after sunset, Venus will look close to half lit, like a tiny lunar phase.
This illustration shows where to observe Venus after sunset in August.
NASA/JPL-Caltech
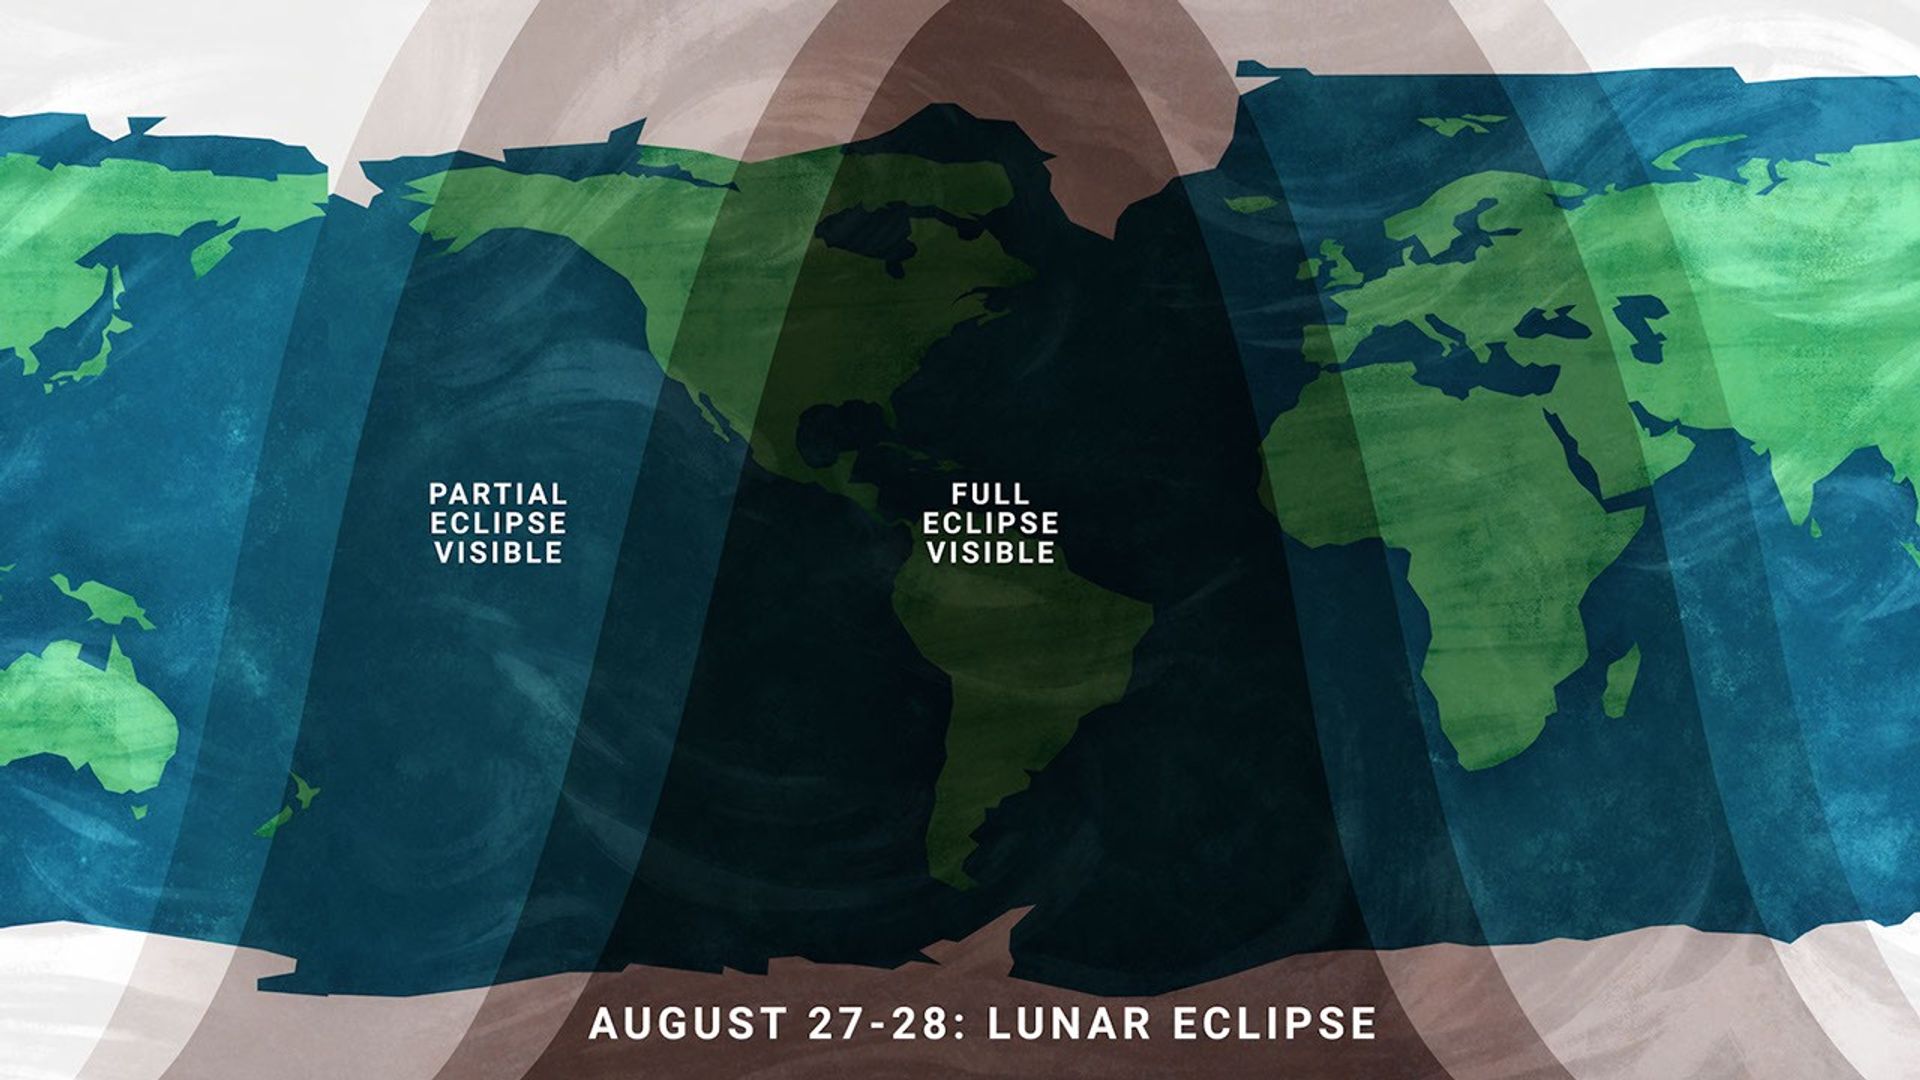
On the night of Aug. 27, continuing into Aug. 28 for some time zones, the Full Moon slips through Earth’s shadow, resulting in a partial lunar eclipse. It will be visible from much of North and South America and parts of Europe and Africa.
Viewing areas for the August 2026 lunar eclipse.
NASA/JPL-Caltech
At maximum eclipse, about 93% of the Moon’s diameter will be inside Earth’s dark central shadow, called the umbra. The Moon will not be completely covered, but it can look dramatically darkened, with a rusty, coppery tint along the covered edge.
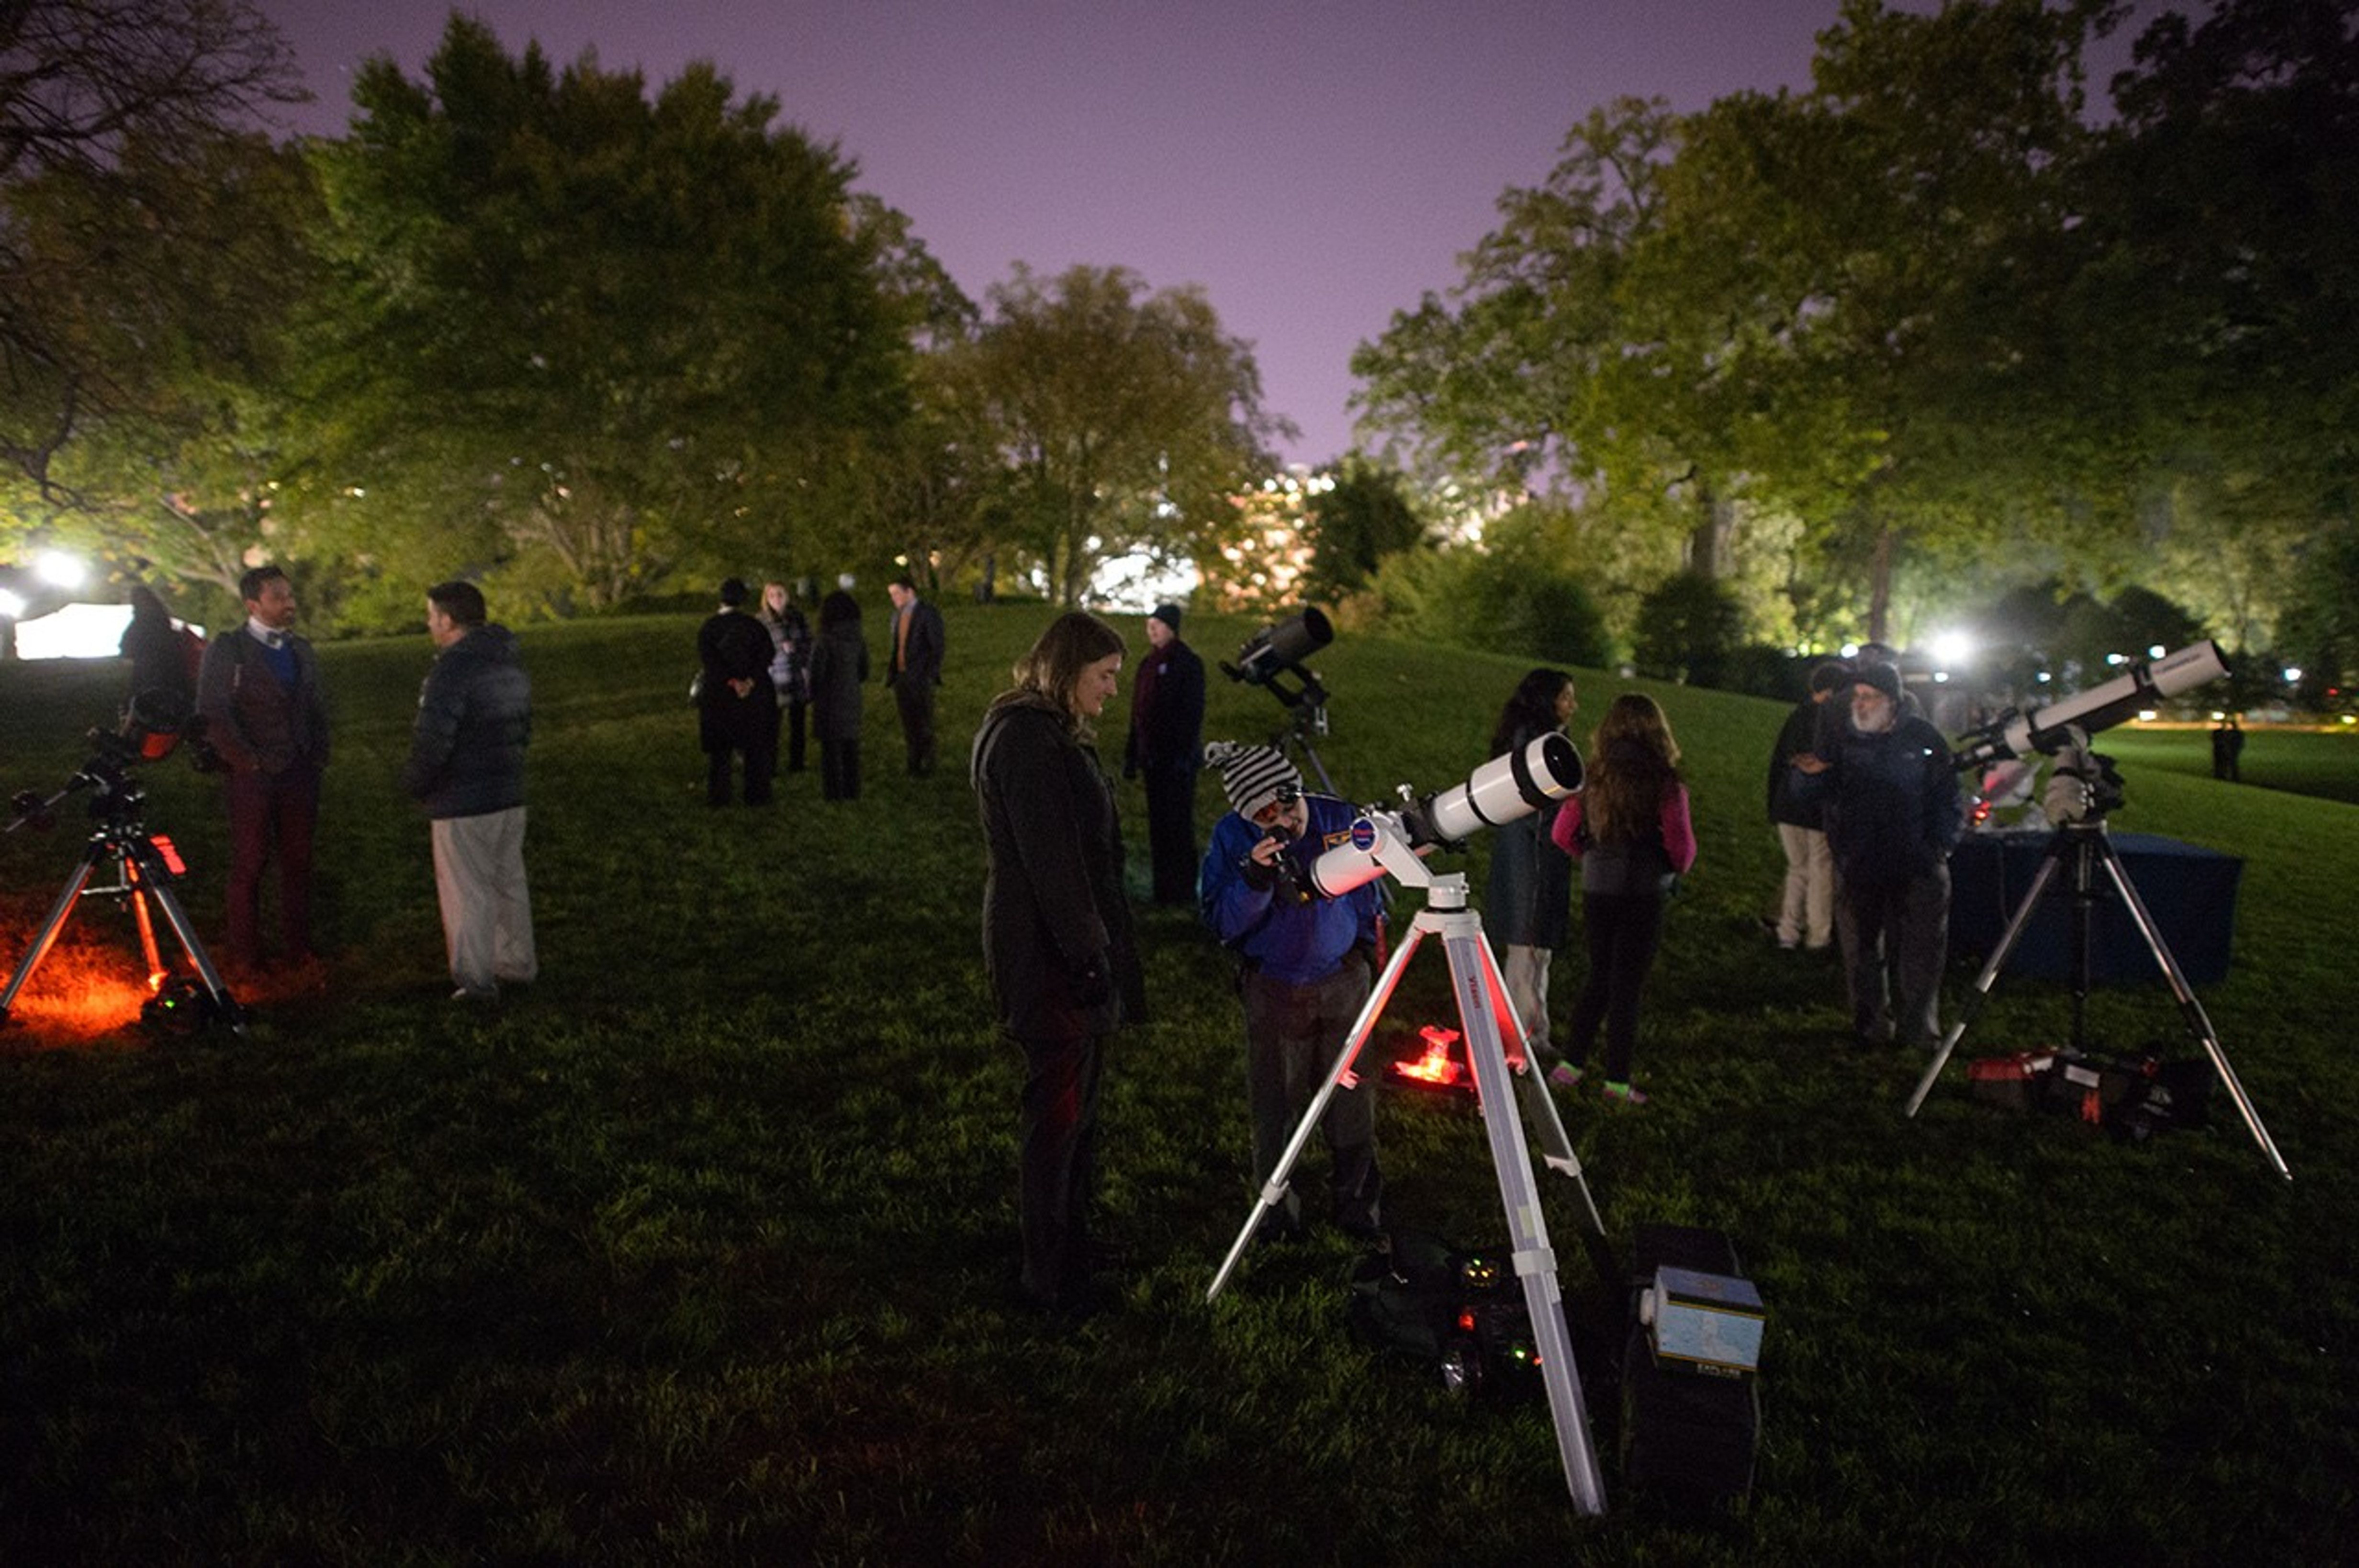
Unlike a solar eclipse, a lunar eclipse is safe to watch with just your eyes. Binoculars or a small telescope can give you a closer view of Earth’s curved shadow moving across the Moon.
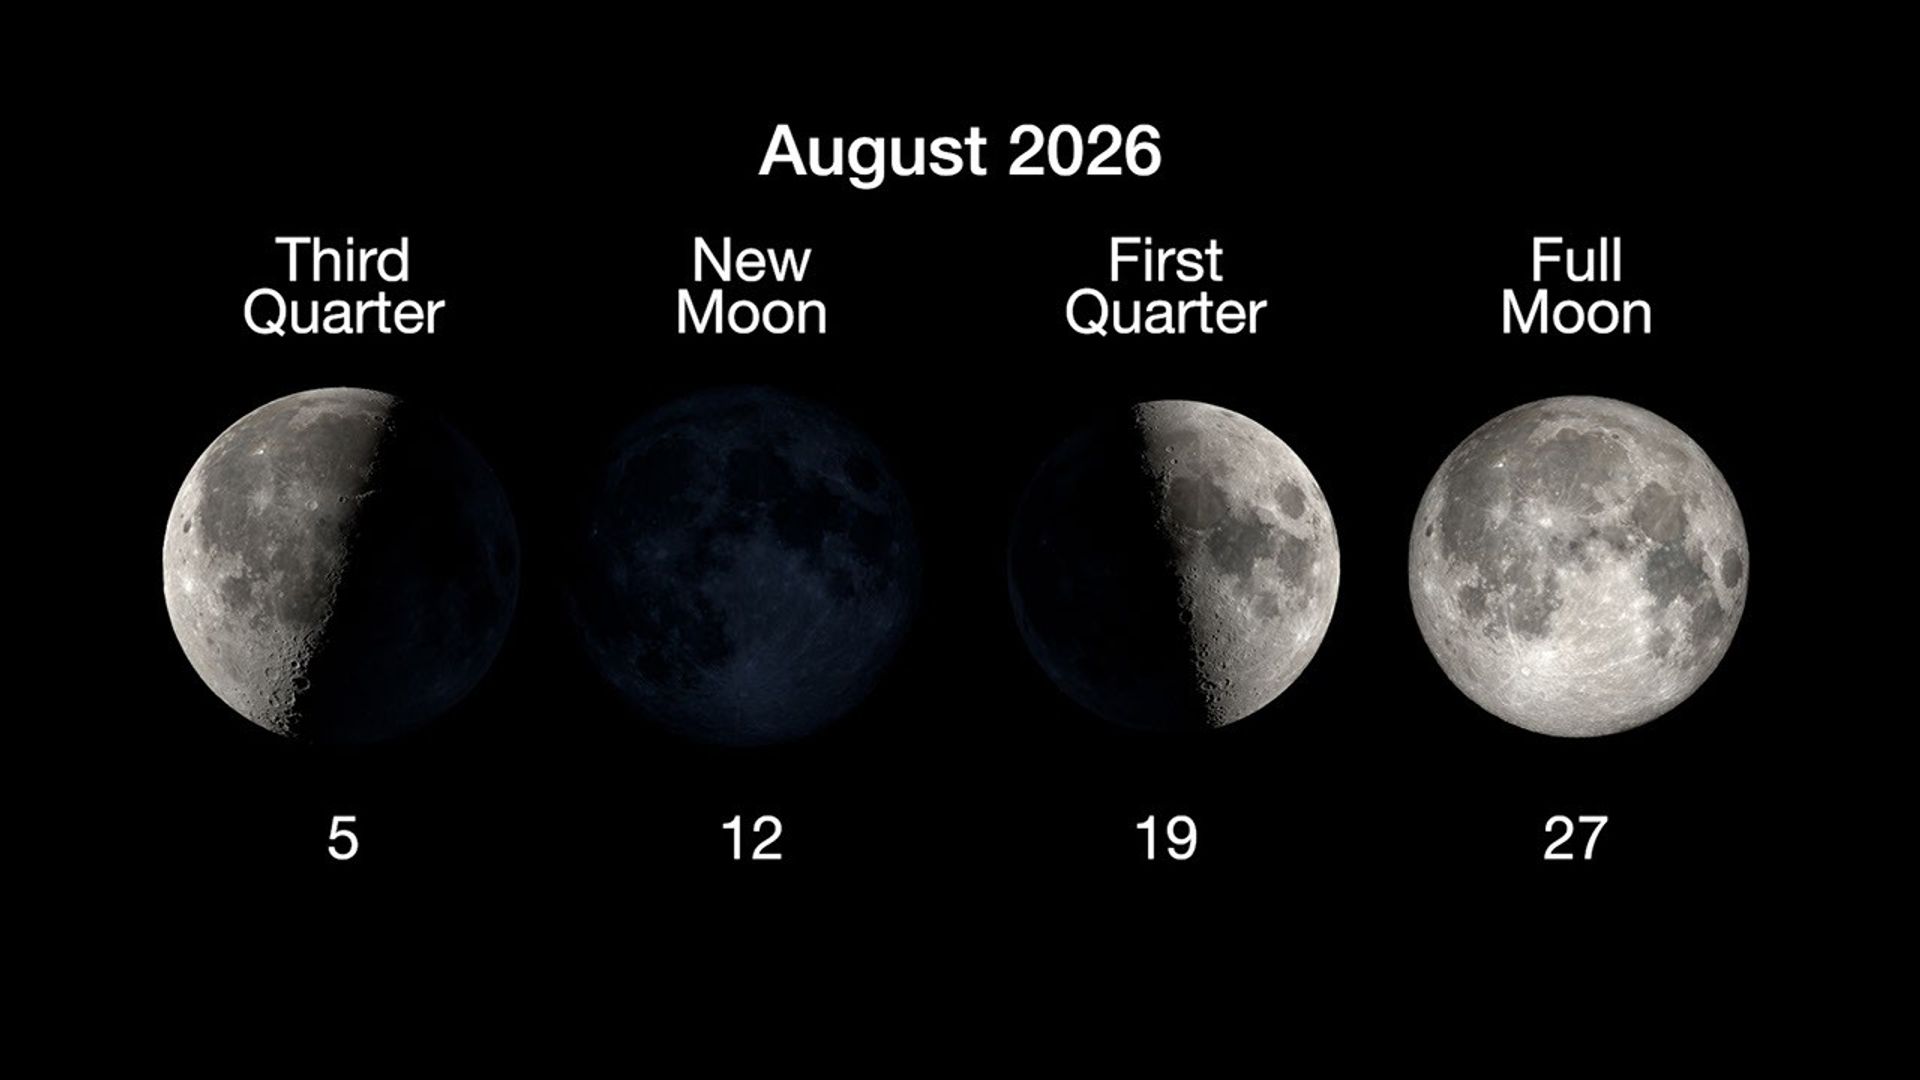
Here are the phases of the Moon for August.
NASA/JPL-Caltech
You can stay up to date on all of NASA’s missions exploring the solar system and beyond at science.nasa.gov. I’m Raquel Villanueva from NASA’s Jet Propulsion Laboratory, and that’s What’s Up for this month.
A solar eclipse, one of the year's best meteor showers, Venus at its brightest in the evening sky, and a partial lunar eclipse to close out the month.On Augu...
Teams at Katalyst Space are making progress slowing the spin of their LINK spacecraft, which is designed to boost the orbit of NASA’s Neil Gehrels Swift Observatory. A series of thruster burns this week reduced the rate of spin from approximately 9 degrees per second to less than 4 degrees per second. Katalyst is continuing with this approach to restabilize the spacecraft in the coming days.
Teams also further evaluated LINK’s functionality and determined there are still potential paths forward for a boost. NASA is working closely with Katalyst to consider revised, innovative approaches. The agency will continue to provide updates about stabilization of LINK and next steps for the mission. LINK is now expected to approach Swift around the end of August.
Learn more from Katalyst, and monitor NASA’s Swift blog for continued updates:
Explorer for Artemis Geology, Lunar, and Earth — a NASA satellite program to study surface biology and geology on Earth, with technologies that could support future missions to the Moon and Mars.
Future Mission
NASA’s EAGLE program — Explorer for Artemis Geology, Lunar, and Earth — will be a series of satellite missions studying surface properties using technologies for Earth observation that will also benefit future missions to the Moon and Mars, where they could identify critical resources and safe landing sites.
The satellites making up the first two EAGLE missions will study biology and geology on Earth’s surface to support agriculture, disaster response, and other needs. Each mission will carry a different instrument with capabilities that complement each other. The first mission (EAGLE-VSWIR) is scheduled to take flight in 2028.
Mission Type
Orbiter
Target
Earth, Moon, Mars
Launch
No earlier than 2028
Objective
Study surface composition and changes
EAGLE-VSWIR
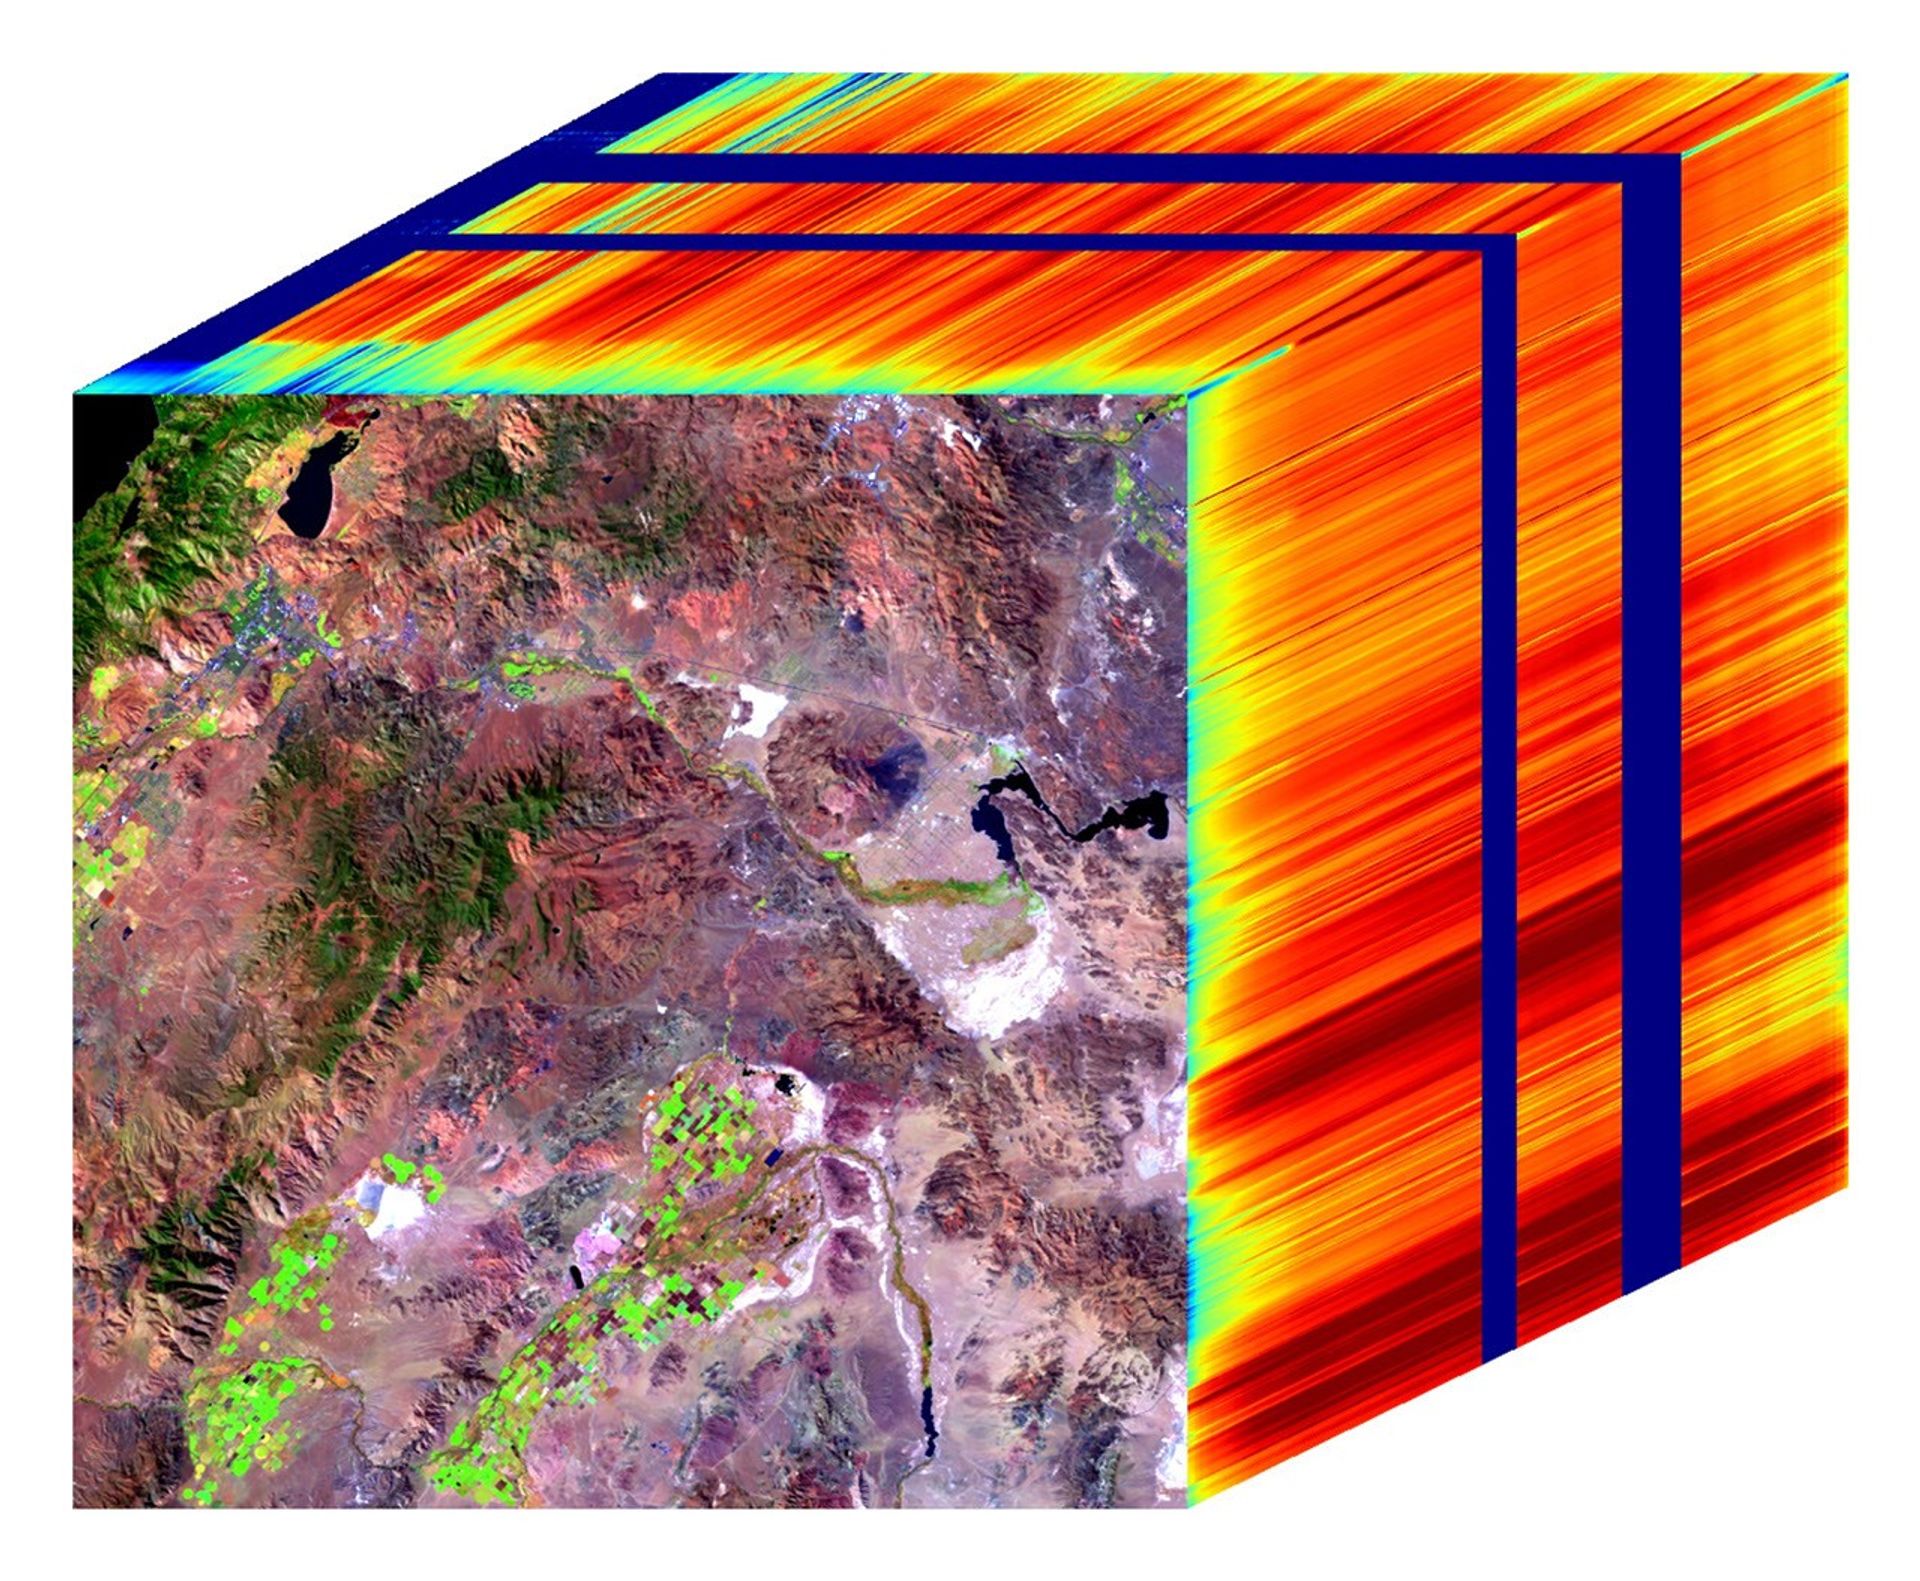
EAGLE-VSWIR (Visible to Shortwave Infrared) will observe the Earth’s surface every 16 days with a high-resolution imaging spectrometer, which measures light reflected from the planet’s surface, separating wavelengths across the visual and into the infrared spectrum. The patterns created by light being reflected or absorbed across this spectral range act like fingerprints, letting scientists identify the composition of the surface.
A similar instrument, NASA’s EMIT (Earth Surface Mineral Dust Source Investigation), has been monitoring Earth from the International Space Station since July 2022, characterizing the surface mineral composition of Earth’s arid lands, monitoring ecosystem status, and tracking health and safety hazards — such as methane leaks and acid mine drainage — among other applications.
EAGLE-VSWIR will have 25 times more capability than EMIT has today. This technological leap will allow scientists to map surface deposits of critical and rare-earth minerals, strengthen food security, and aid wildfire prevention and recovery. It can also highlight environmental hazards such as oil spills or landslide risks, and monitor water quality and availability.
The front of this image cube shows a region in Nevada observed by NASA’s EMIT imaging spectrometer; the cube’s sides show the spectral fingerprint for every point in the image and can be used to discover mineral resources. EAGLE-VSWIR will have 25 times greater performance beyond NASA’s current state-of-the-art EMIT.
NASA/JPL-Caltech
EAGLE-TIR
The EAGLE-TIR mission will provide Thermal InfraRed (TIR) imagery when it launches two to three years after EAGLE-VSWIR, measuring energy emitted from the surface and producing data that scientists can use to map temperature, composition, and critical mineral deposits. On Earth that would let researchers monitor wildfires and volcanic activity, track drought and water use by crops, study urban heat islands, observe the rates that snow or ice accumulates or melts, and better understand Earth’s resilient ecosystems.
EAGLE-TIR follows on from ECOSTRESS (ECOsystem Spaceborne Thermal Radiometer Experiment on Space Station), which has been observing Earth from the International Space Station since 2018. ECOSTRESS was designed to study how different ecosystems respond to drought and water stress, and the data has provided a vital understanding of how plants’ water use changes throughout the day. Since ECOSTRESS also measures emitted energy in the thermal infrared, its surface-temperature products have also been used for urban planning and wildfire monitoring.
Further innovation and lessons learned from ECOSTRESS has led to EAGLE-TIR, which will carry a multi-band thermal radiometer. EAGLE-TIR’s great strength compared to existing missions is that it provides detailed imagery of the entire globe every two days, day and night, at multiple wavelengths not available from other instruments.
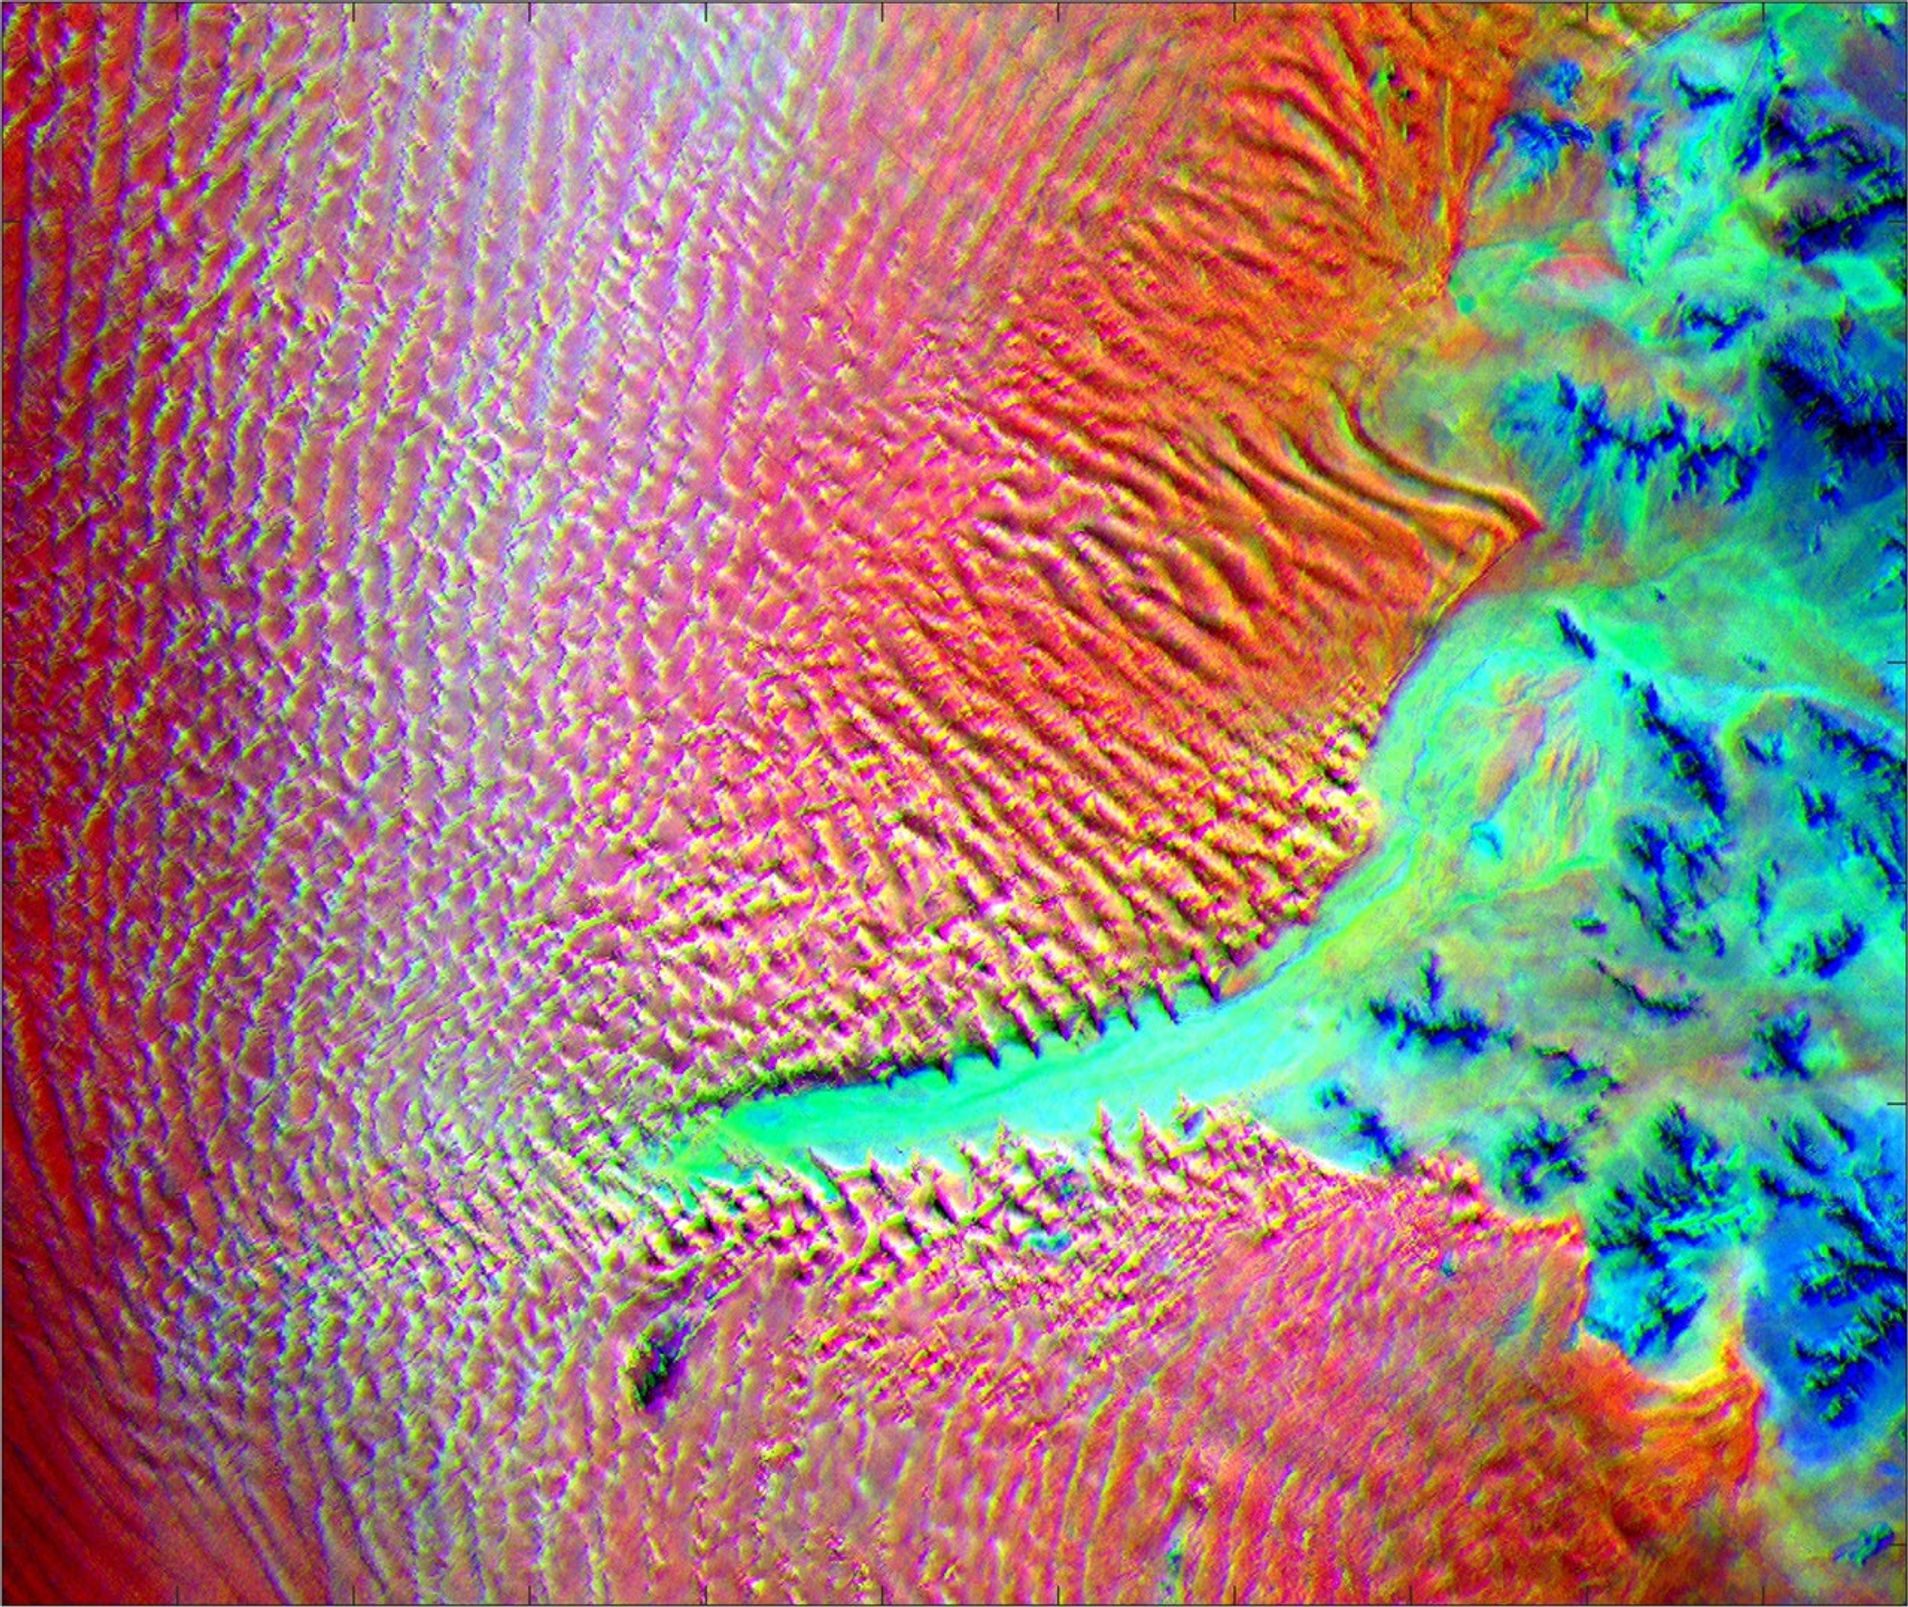
This image shows the minerals contained in Namibian dunes using ECOSTRESS data. EAGLE-TIR will have more spectral channels to enable even better mineral discrimination.
NASA/JPL-Caltech
EAGLE Program
By advancing vital techniques for measuring our planet’s surface composition, resources, and hazards, the EAGLE program addresses critical needs in Earth observation, with technologies that can also transfer to planetary exploration, where they’ll serve as pathfinders for future missions to the Moon and Mars.
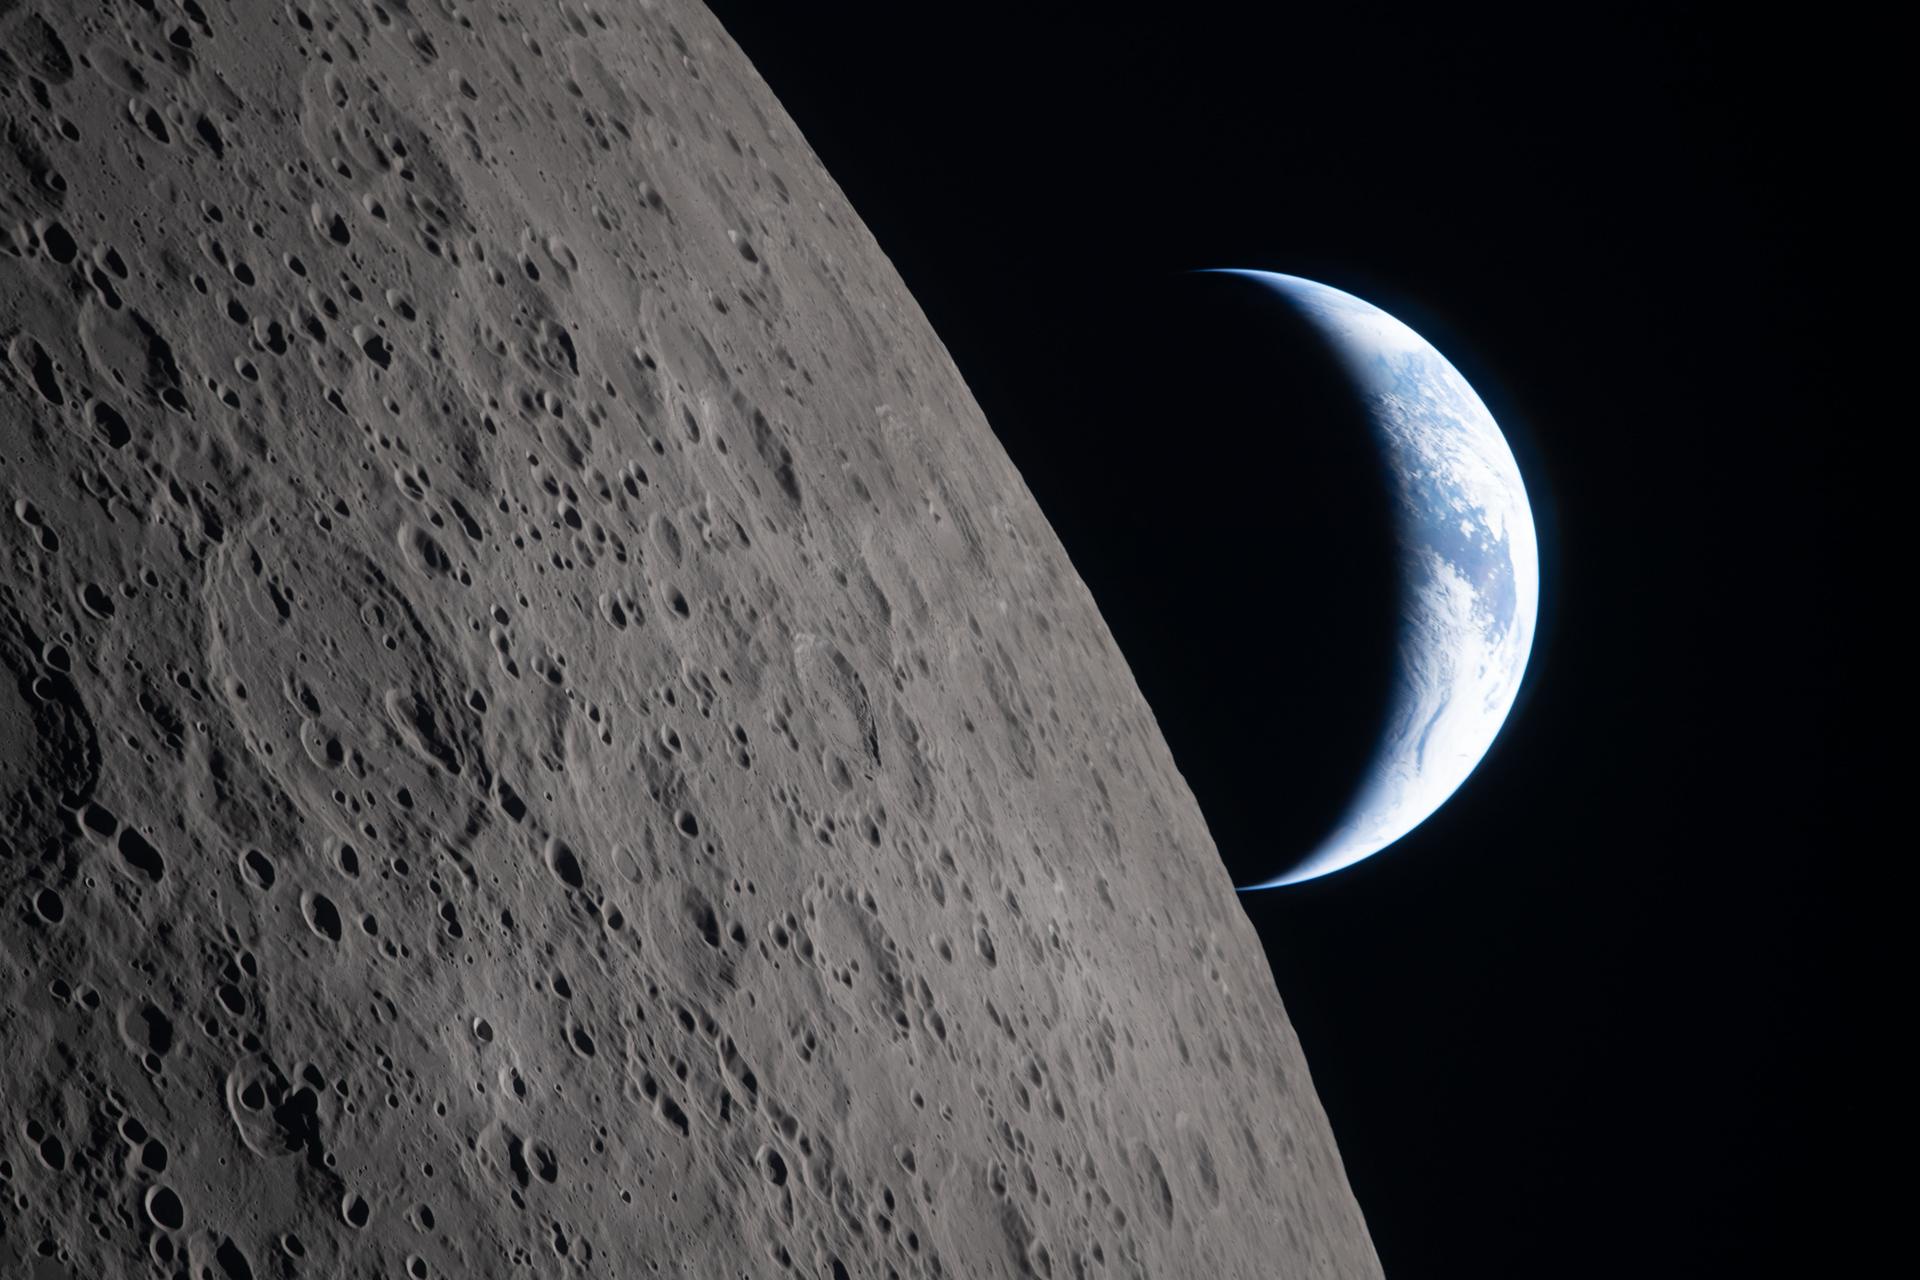
As the Artemis II crew came close to passing behind the Moon and experiencing a planned loss of signal, they captured this image of a crescent Earth setting on the Moon’s limb on April 6, 2026.
NASA
Featured Video
EAGLE
NASA unveiled the EAGLE program as one part of its “Ignition” event on March 24, 2026, when it announced a wide-ranging series of transformative agencywide initiatives. With EAGLE (the Explorer for Artemis Geology, Lunar, and Earth missions), NASA will deploy breakthrough hyperspectral images across Earth with later missions anticipated for the Moon and Mars in rapid succession. On Earth they’ll identify critical minerals for national security, enable precision agriculture, and support disaster response. On Earth and at Mars they will locate critical minerals and resources such as ice for propellants, rare-earth elements for technology, and construction materials for habitats.
EMIT
EMIT (Earth Surface Mineral Dust Source Investigation) measures the mineral composition of Earth’s dust source regions, to help scientists understand how they heat or cool our planet.
Join us for continuing coverage as our leaders discuss the agency's implementation of the National Space Policy and our plans to advance science and discover...
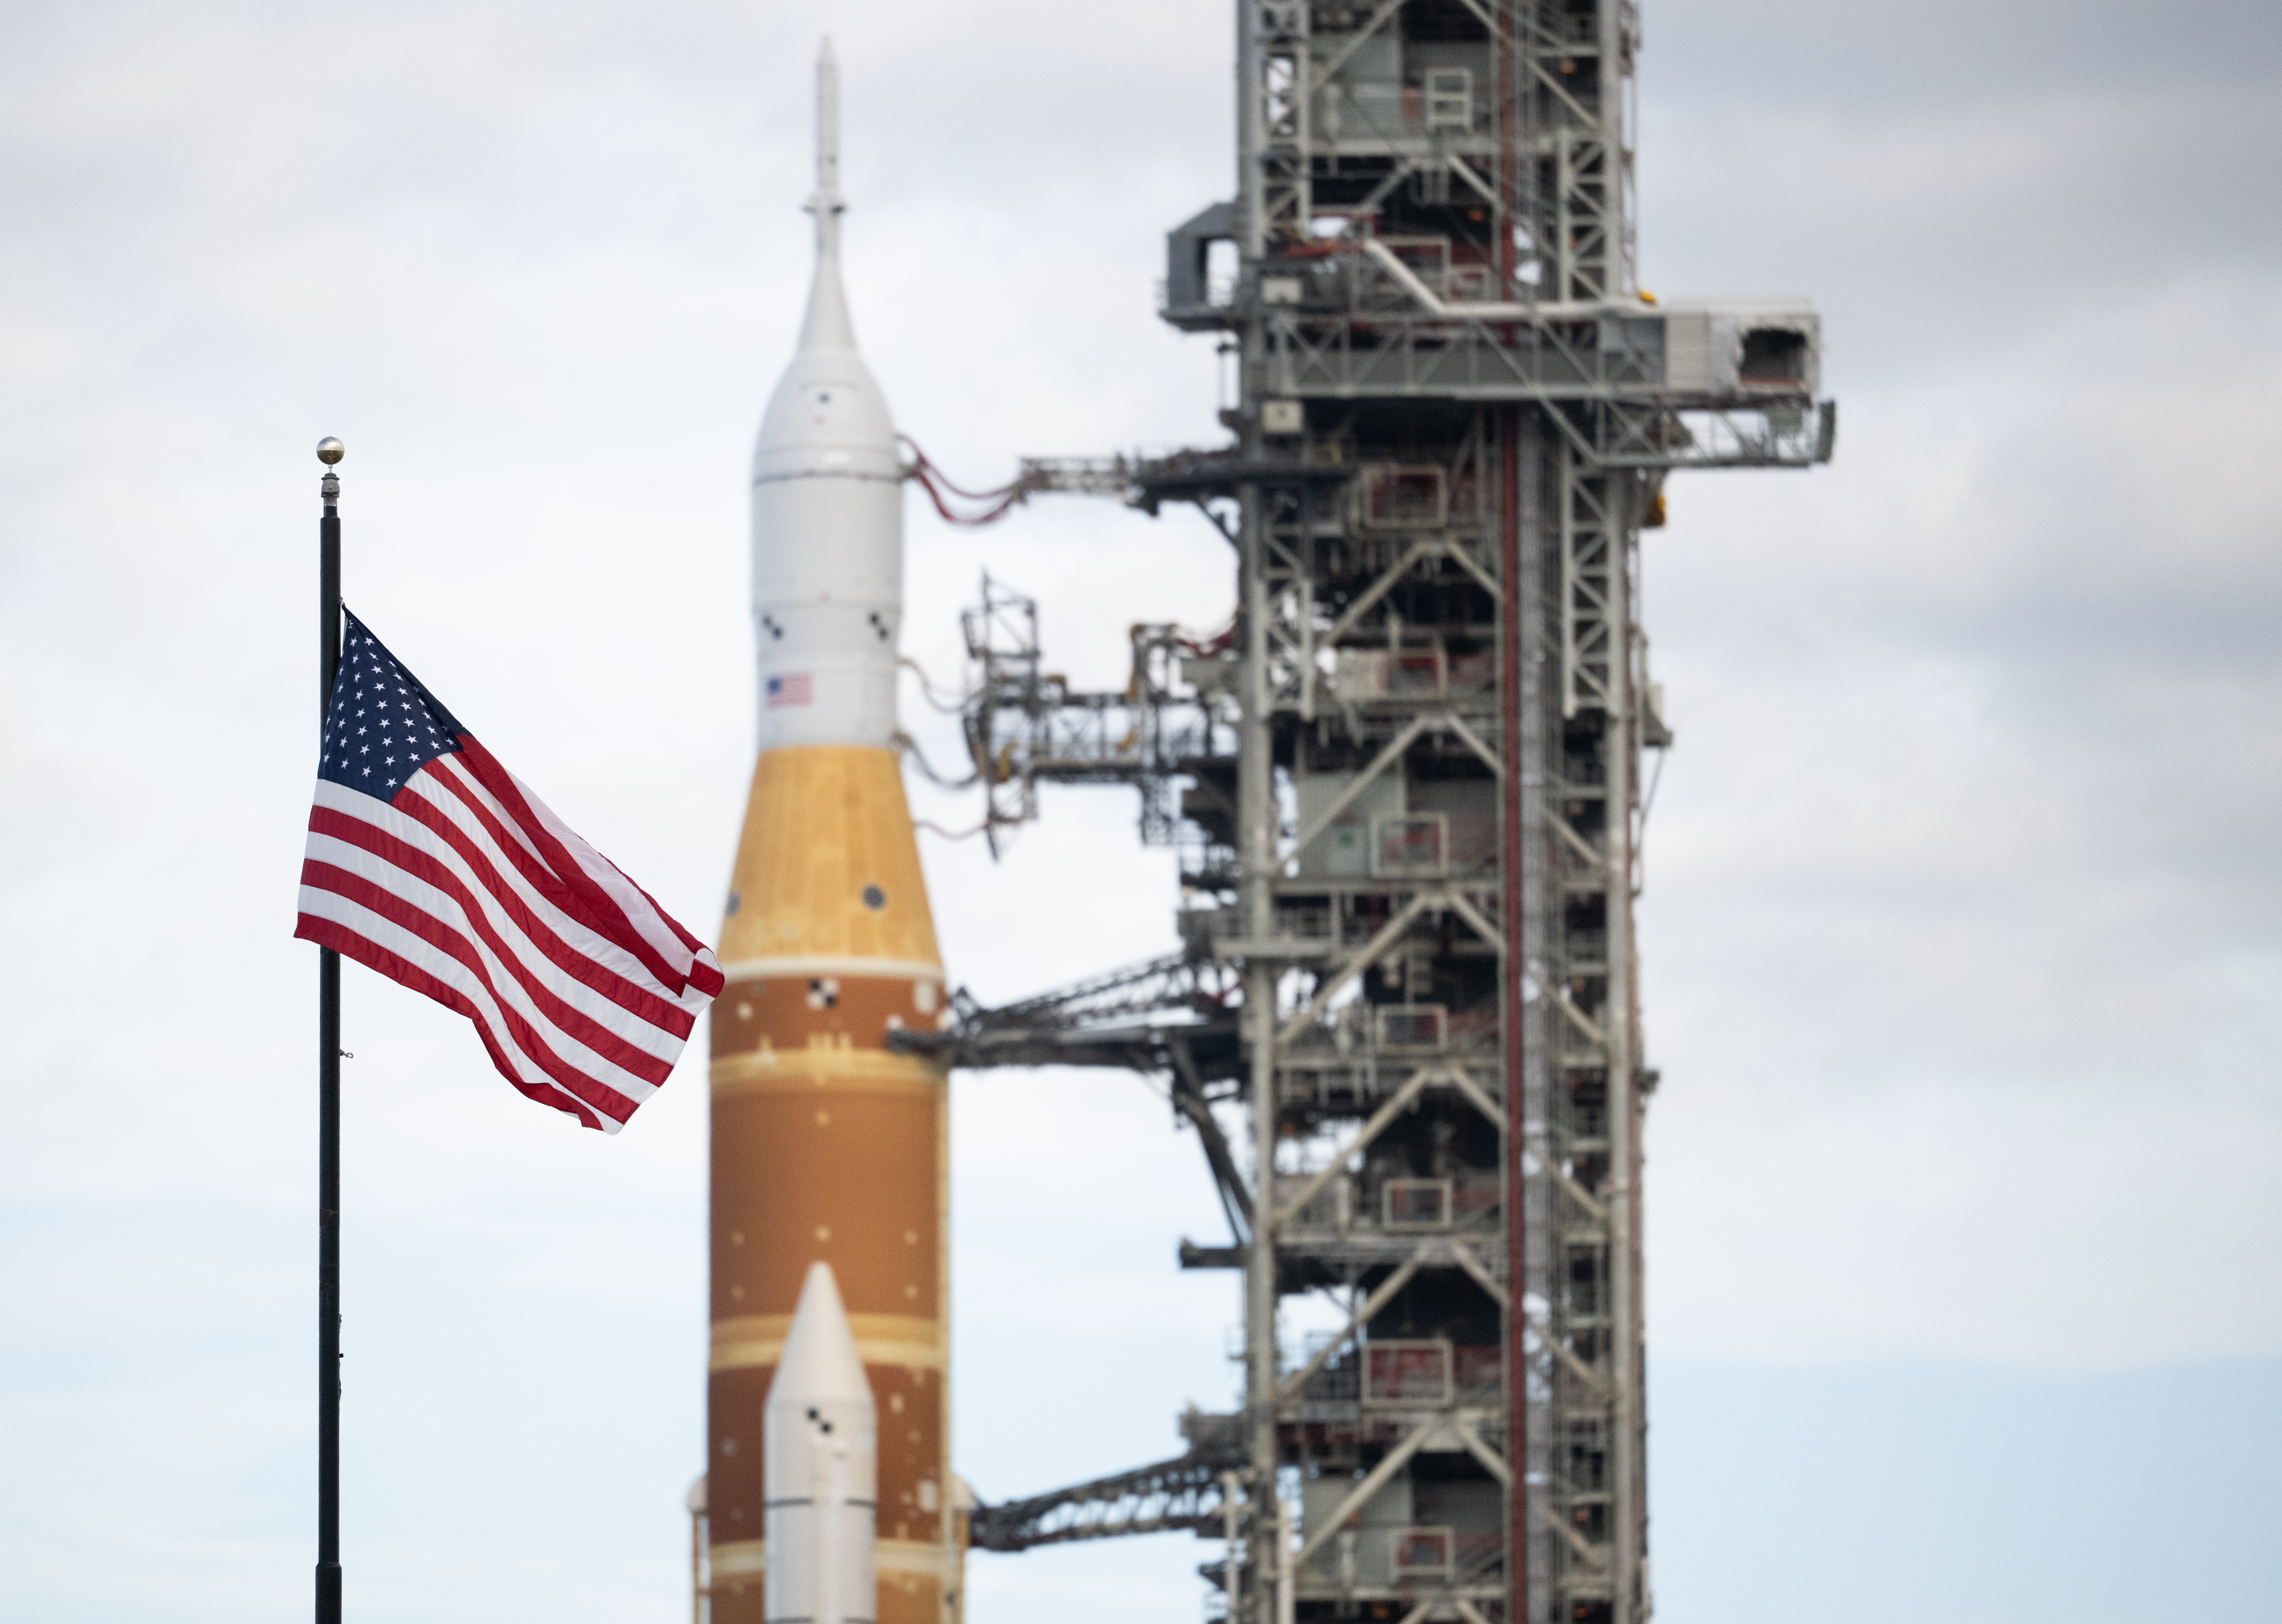
An American flag is seen in front of NASA’s SLS (Space Launch System) rocket and Orion spacecraft at NASA’s Kennedy Space Center in Florida on Jan. 17, 2026, ahead of the historic Artemis II test flight. NASA will host a news conference at NASA Kennedy on Friday, Aug. 14, to highlight American leadership in space and aviation.
Credit: NASA/Joel Kowsky
NASA will hold a news conference at 2:30 p.m. EDT, Friday, Aug. 14, live from the agency’s Kennedy Space Center in Florida, and media and digital creators are invited to attend in person.
The announcement, held in the XLV Hangar at the Shuttle Landing Facility, will preview a new event at NASA Kennedy later this year tied to America’s 250th anniversary, showcasing American leadership in aviation, space exploration, and emerging technologies while bringing together the public, industry leaders, innovators, and the next generation of explorers.
Participants include:
NASA Administrator Jared Isaacman
NASA leadership
Members of Congress
The agency will stream this news conference live through a variety of platforms:
From left to right: Casey Swails, NASA deputy associate administrator; Mike Waller, vice president of BL Harbert International Federal Division; Edward C. Forst, administrator of the U.S. General Services Administration; NASA Administrator Jared Isaacman; Dr. Trina Dyal, director of NASA’s Langley Research Center; Rep. Robert “Bobby” Scott (D-Va.); Virginia Lt. Gov. Ghazala F. Hashmi; Jimmy Gray, mayor, City of Hampton; and Amit Kshatriya, NASA associate administrator, pose for a photo before cutting the ribbon to open the Flight Dynamics Research Facility, NASA’s newest wind tunnel, Friday, July 31, 2026, at NASA’s Langley Research Center in Hampton, Virginia.
The state-of-the-art facility will support research and technology development that will advance the agency’s aeronautics, exploration, and science goals, including establishing a sustained human presence on the lunar surface through the Artemis program and the development of a Moon Base.
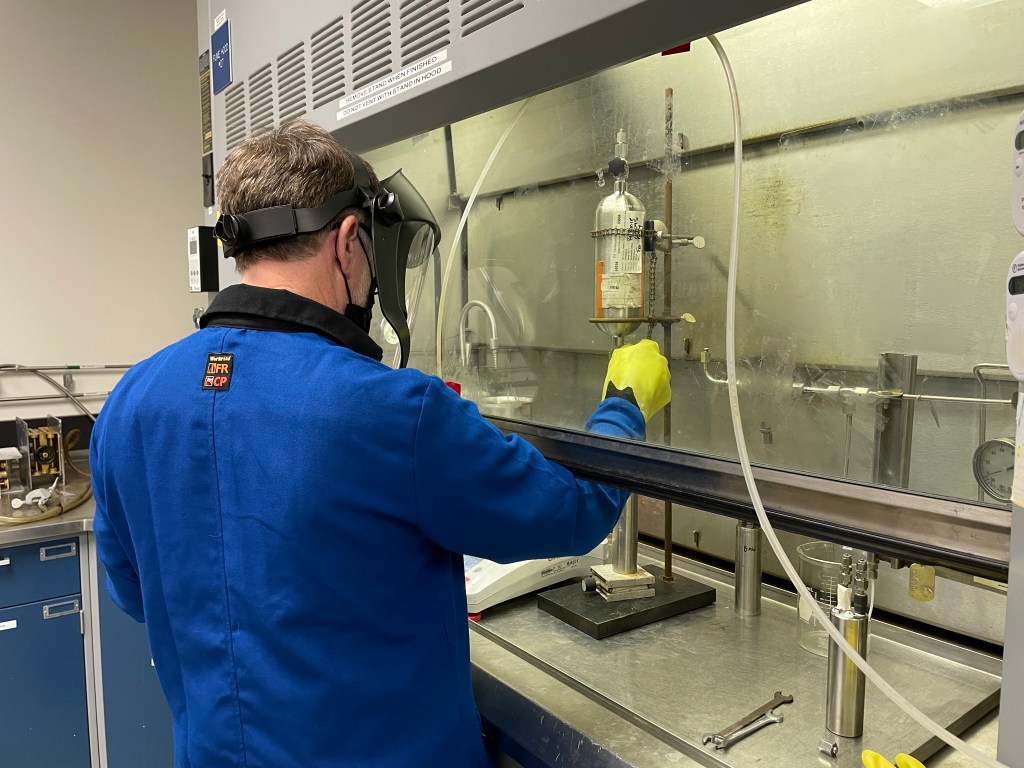
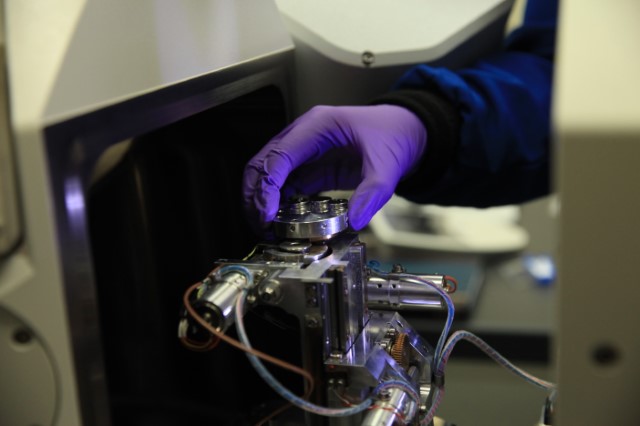
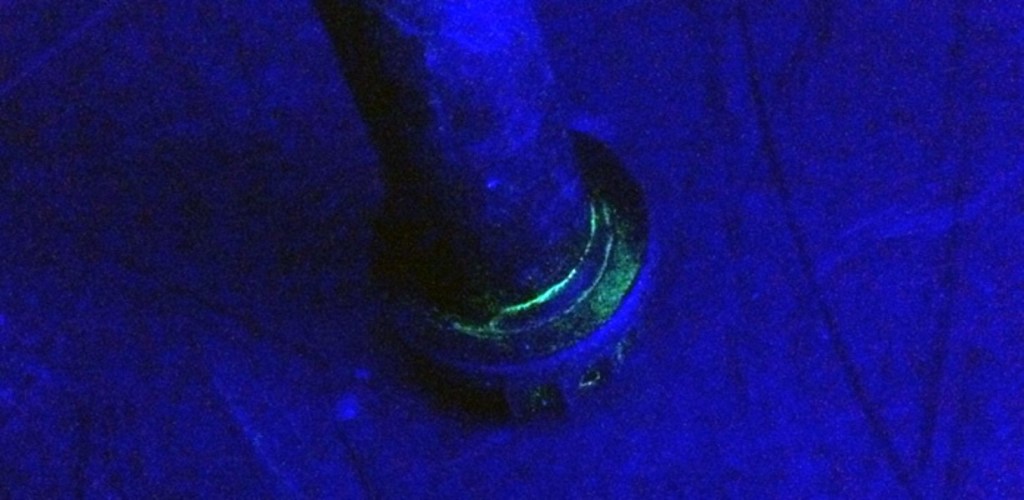
Flammability test results for commercial-off-the-shelf webbings that meet NASA flammability requirements are reported for use in elevated oxygen environments anticipated for future lunar and Martian missions. Testing demonstrated that a webbing composed of 60% Kevlar®/40% polybenzimidazole (PBI) from Sturges Manufacturing Company, Inc., specifically the natural version, passed flammability testing per NASA-STD-6001B Test 1 using a surface ignition in J-configuration at 37% oxygen and 8.2 psia. Offgassing data are also provided for the natural webbing, which is gold colored. These findings support their potential use as suitable webbings for softgoods applications, although final performance and wear characteristics must be validated in full configuration.
Background An elevated oxygen environment is planned for future crewed missions to the Moon and Mars to reduce the prebreathe time before extravehicular activities. In this study, materials are being evaluated for use at 37% oxygen and 8.2 psia. An enriched oxygen environment increases the flammability risk and the need for improved fire-resistant materials. The NASA Engineering and Safety Center (NESC) developed a strategy to ensure textile materials that meet NASA flammability requirements in this environment are available to the aerospace community as the building blocks to softgoods flight hardware. The strategy is being implemented by the Mars Campaign Office and Johnson Space Center with support from the NESC. The first phase is testing commercial-off-the-shelf (COTS) textiles with high potential to meet flammability requirements.
Problem/Issue Description Narrow woven fabrics, commonly referred to as webbing or woven tape, are used in multiple softgood applications, including crew mobility aids, restraint nets, and storage bag handles. The standard meta-aramid or nylon webbings do not meet the flammability requirements in elevated oxygen.
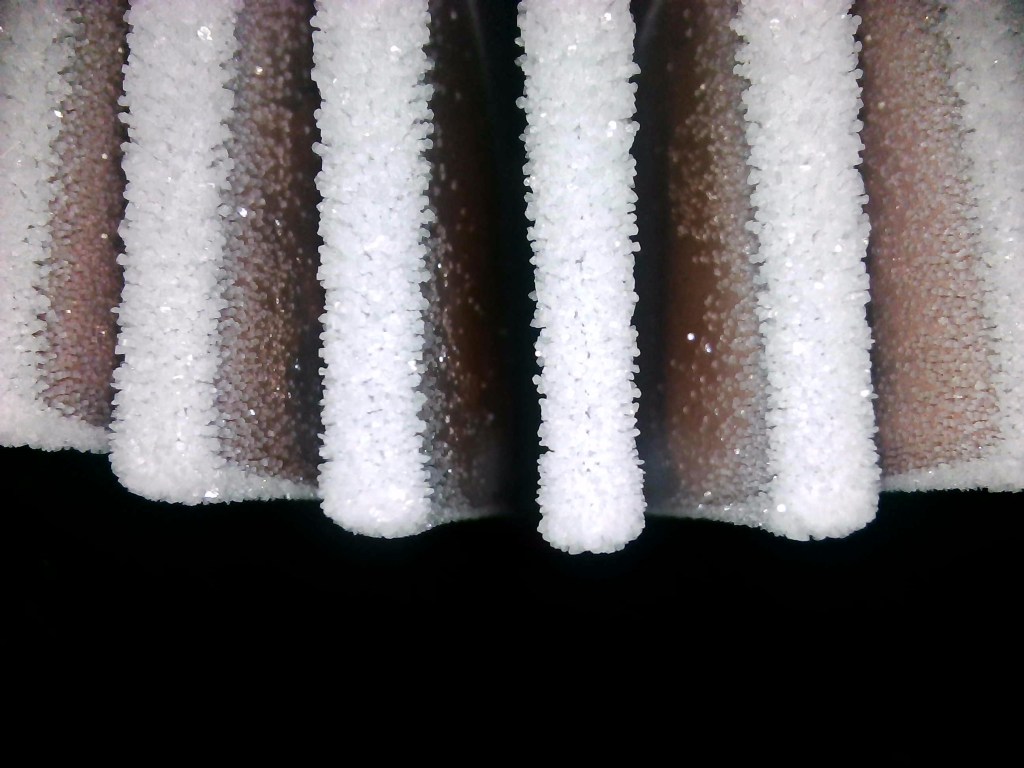
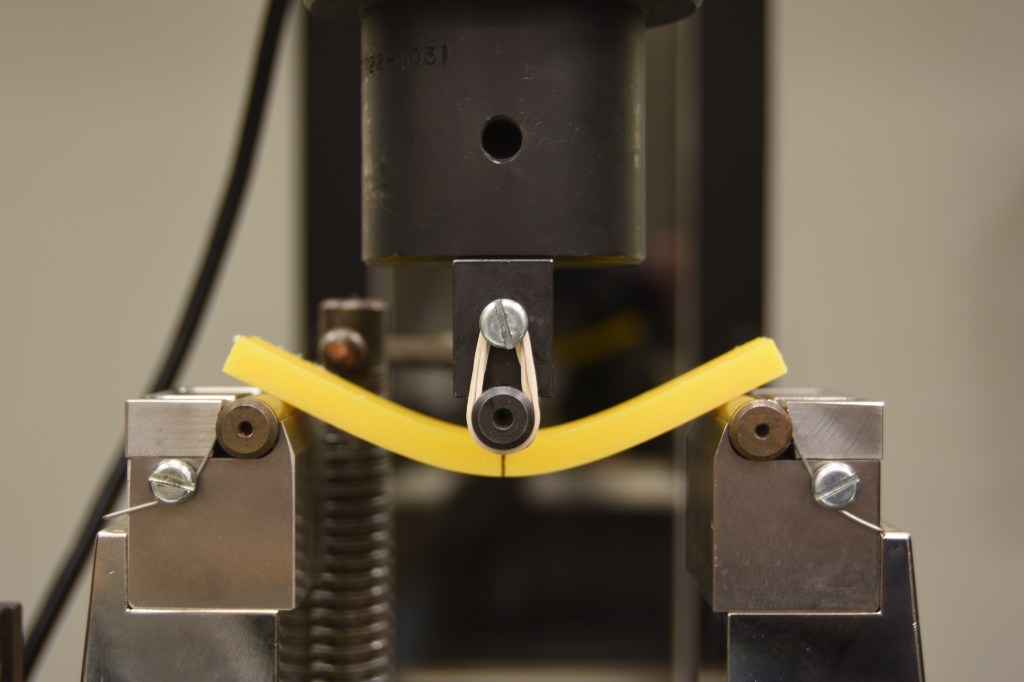
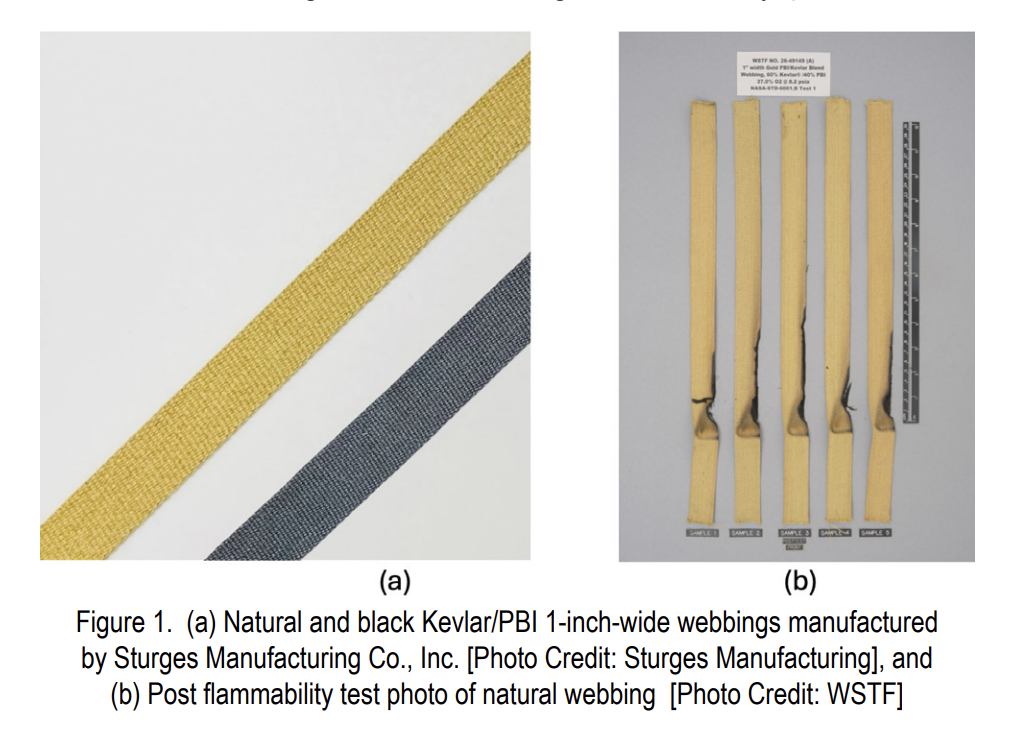
Test Methods/Data Collection NASA-STD-6001B Test 1 was performed on the webbing candidates at White Sands Test Facility (WSTF) to determine the maximum oxygen concentration (MOC) at a pressure of 8.2 psia. The test was performed in an unshielded J configuration, where the cut edge of the webbing was not exposed to the flame and the igniter impinged on the front surface of the material, which included the lateral free edge of the webbing. Flammability performance after wear and tear was not assessed. The MOC test refers to the maximum oxygen concentration at which a minimum of five samples tested pass the NASA-STD-6001B criteria at a fixed pressure. One-inch-width natural and black webbings, composed of 60% Kevlar and 40% PBI produced by Sturges Manufacturing (see Figure 1), were tested. The available webbing widths range from ¼ to 8 inches.
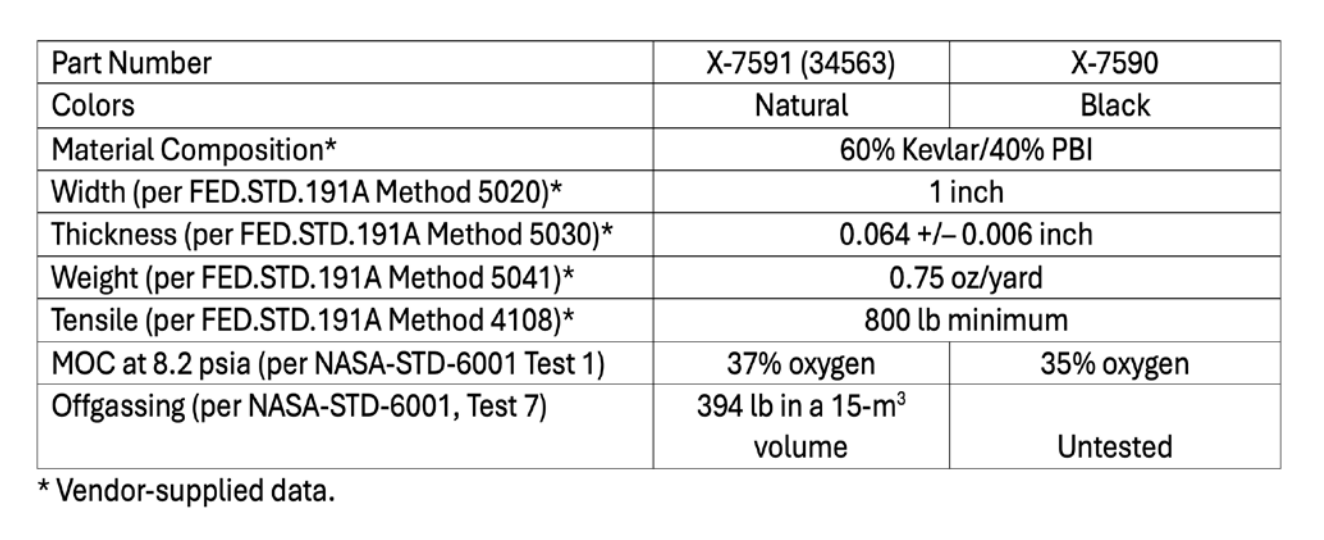
Analysis and Results Table 1 summarizes the webbing properties and test results. The webbings had MOCs of 37% and 35% oxygen for the natural and black webbing, respectively, at 8.2 psia. In addition, offgas testing was performed on natural webbing per NASA-STD-6001B Test Detailed test results can be found in MAPTIS links listed in the reference section. These results should be used to select materials for incorporation into a final softgood product. The final flammability result will depend on the other components of the end item and must be tested in configuration to ensure the final product meets requirements. Individual textile results do not guarantee the performance of the finished assembly. Variations on this webbing (i.e., including but not limited to dimensions, weave type and yarn size, density, treatments, color, fiber blend, edge finish technique, the addition of features like hook and loop fasteners, and wear and tear) may affect flammability characteristics and should be evaluated before use.
References
Black color webbing: Flammability Report WSTF 26-49145, https://maptis.ndc.nasa.gov/matsel/app/material/73441?sender=global-search
Natural color webbing: Flammability and Offgassing Report WSTF 26-49149, https://maptis.ndc.nasa.gov/matsel/app/material/73442?sender=global-search
John L. Barker died in early July at age 88. He worked with the Landsat program for more than 30 years; his calibration and characterization work made science-grade Landsat data a reality.
John L. Barker, a seminal force behind Landsat’s science-grade data, died on Monday, July 6, 2026. He was 88.
Barker was instrumental in transforming Landsat from a technology demonstration satellite that produced pictures of Earth into a well-understood science mission collecting images made from physically-based spectral measurements of Earth’s surface. The calibration standards relentlessly pursued by Barker have broadly informed NASA’s calibration criteria for land remote sensing.
Described as hard-working, gregarious, extremely sincere, and fun-loving, Barker was a “number chaser” known for his boundless energy, pursuit of precision, and love of data and dance.
Landing on Landsat
Barker trained as a nuclear- and cosmo-chemist at the University of Chicago’s Enrico Fermi Institute, where his doctoral research focused on the chemical history of cosmic matter in deep-sea sediments. He received his PhD in 1967 and began teaching at the University of Maryland College Park a year later. In 1969, Barker joined the Unitarian Universalist Church of Silver Spring. Doing volunteer work there, he met Charlie Schnetzler, Earth Resources Branch Chief at NASA’s Goddard Space Flight Center.
When a position became available at NASA Goddard, Schnetzler — who had long recognized Barker’s brilliance — encouraged him to apply. Barker got the position. He started working at Goddard in 1973, a year after Landsat 1 — the very first land Earth-observing satellite — was launched.
Barker soon became interested in doing environmental research with Landsat and started using the satellite data to monitor sediments in Swift Creek Lake near Richmond, Virginia. He also worked with famed oceanographer Jacques Cousteau and his son Philippe, participating in a proof-of-concept study that received, processed, and relayed Landsat satellite data collected off the coast of Mississippi to Cousteau’s research vessel, the Calypso, within 24 hours. As the Calypso plied the Gulf waters, Landsat satellite data was relayed to Cousteau’s crew to help them find plankton upwellings and sediment plumes. This near-real-time data processing, which took an extraordinary amount of effort at Goddard, was considered a computational feat at a time when it would typically take two months or more to get Landsat images to researchers.
During this effort, Barker and his data processing collaborators discovered that if the Landsat Multispectral Scanner System’s (MSS) green and red spectral data were collected in high-gain mode (a setting that amplified the sensor’s electrical signal), the higher sensitivity enabled bathymetric measurements to be made in areas where ocean waters were clear. The follow-on NASA-Cousteau Bathymetry Experiment pioneered the field of satellite-derived bathymetry.
With so much to discover, the energy and pace of work during Barker’s early years at Goddard was intense. Sixty-hour workweeks were the norm (until an energy-saving decision to turn large mainframe computers off at night cut back extensive working hours).
As Barker continued to use Landsat data for environmental studies, he realized that no one understood the performance of the MSS instruments or the calibration of the data very well. How well did the satellite data match physical measurements made on the ground? How stable were Landsat measurements over time?
A year after Landsat launched in 1972, Barker began his career with NASA. He was an early, avid Landsat data user. “The Landsat program was created in the United States in the heady scientific and exploratory times associated with taming the atom and going to the Moon,” he remarked years later.
“Much to my surprise, after many years of work on it, I found out that we really didn’t understand the calibration of the Landsat’s MSS systems very well at all,” Barker explained in a 2005 interview.
Barker, used to making exacting measurements in the world of chemistry, wanted to find out exactly how well-calibrated Landsat data was.
“I basically decided that, where I could make the biggest contribution — since I had a[Text Wrapping Break]background in physics, engineering, and chemistry… was in the characterization of the instrument,” Barker shared in 2005.
He spent the next three decades doing just that.
Knowing the Numbers
After digging into the calibration of the MSS sensors carried aboard the first three Landsat satellites as Landsat Associate Project Scientist, Barker became the point person for defining the calibration performance requirements of subsequent Landsat satellites. Specifically, he heavily influenced the design, characterization, and sustained calibration effort for Landsat’s 4, 5, and 7.
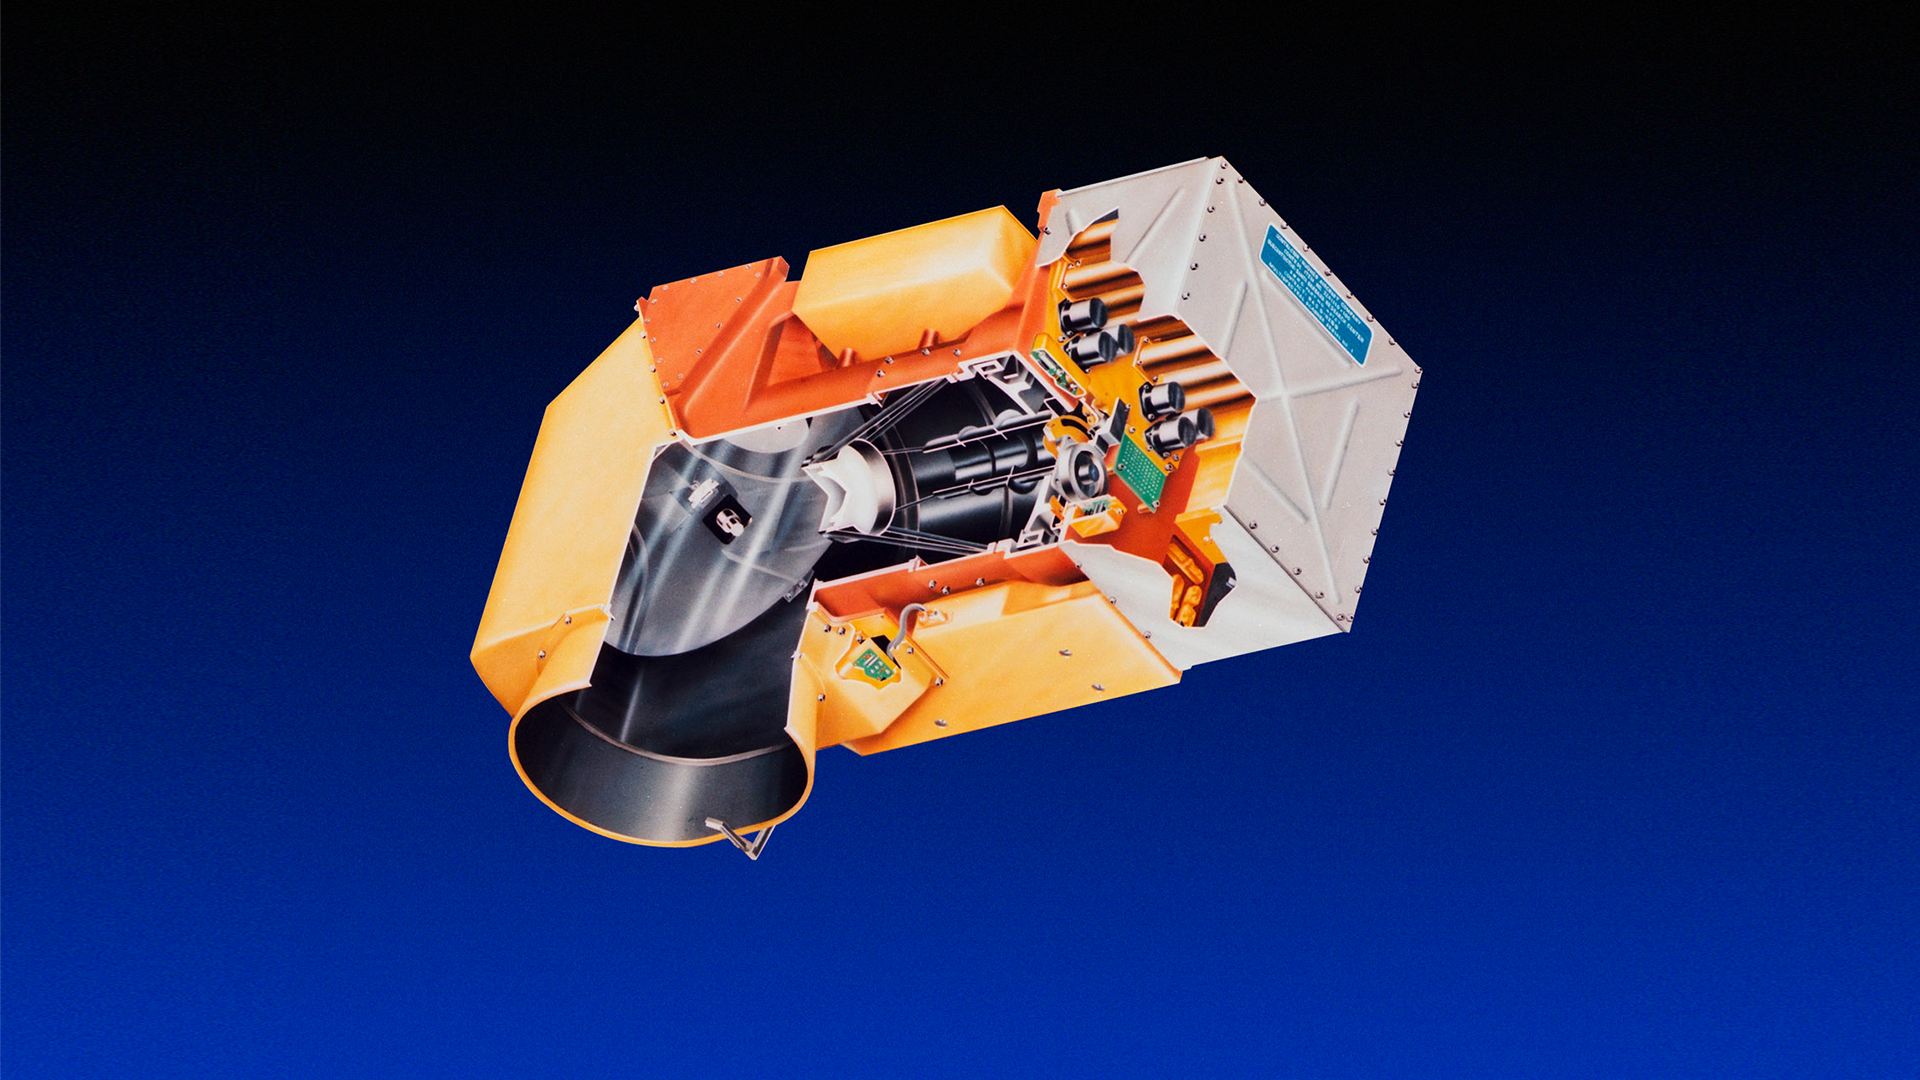
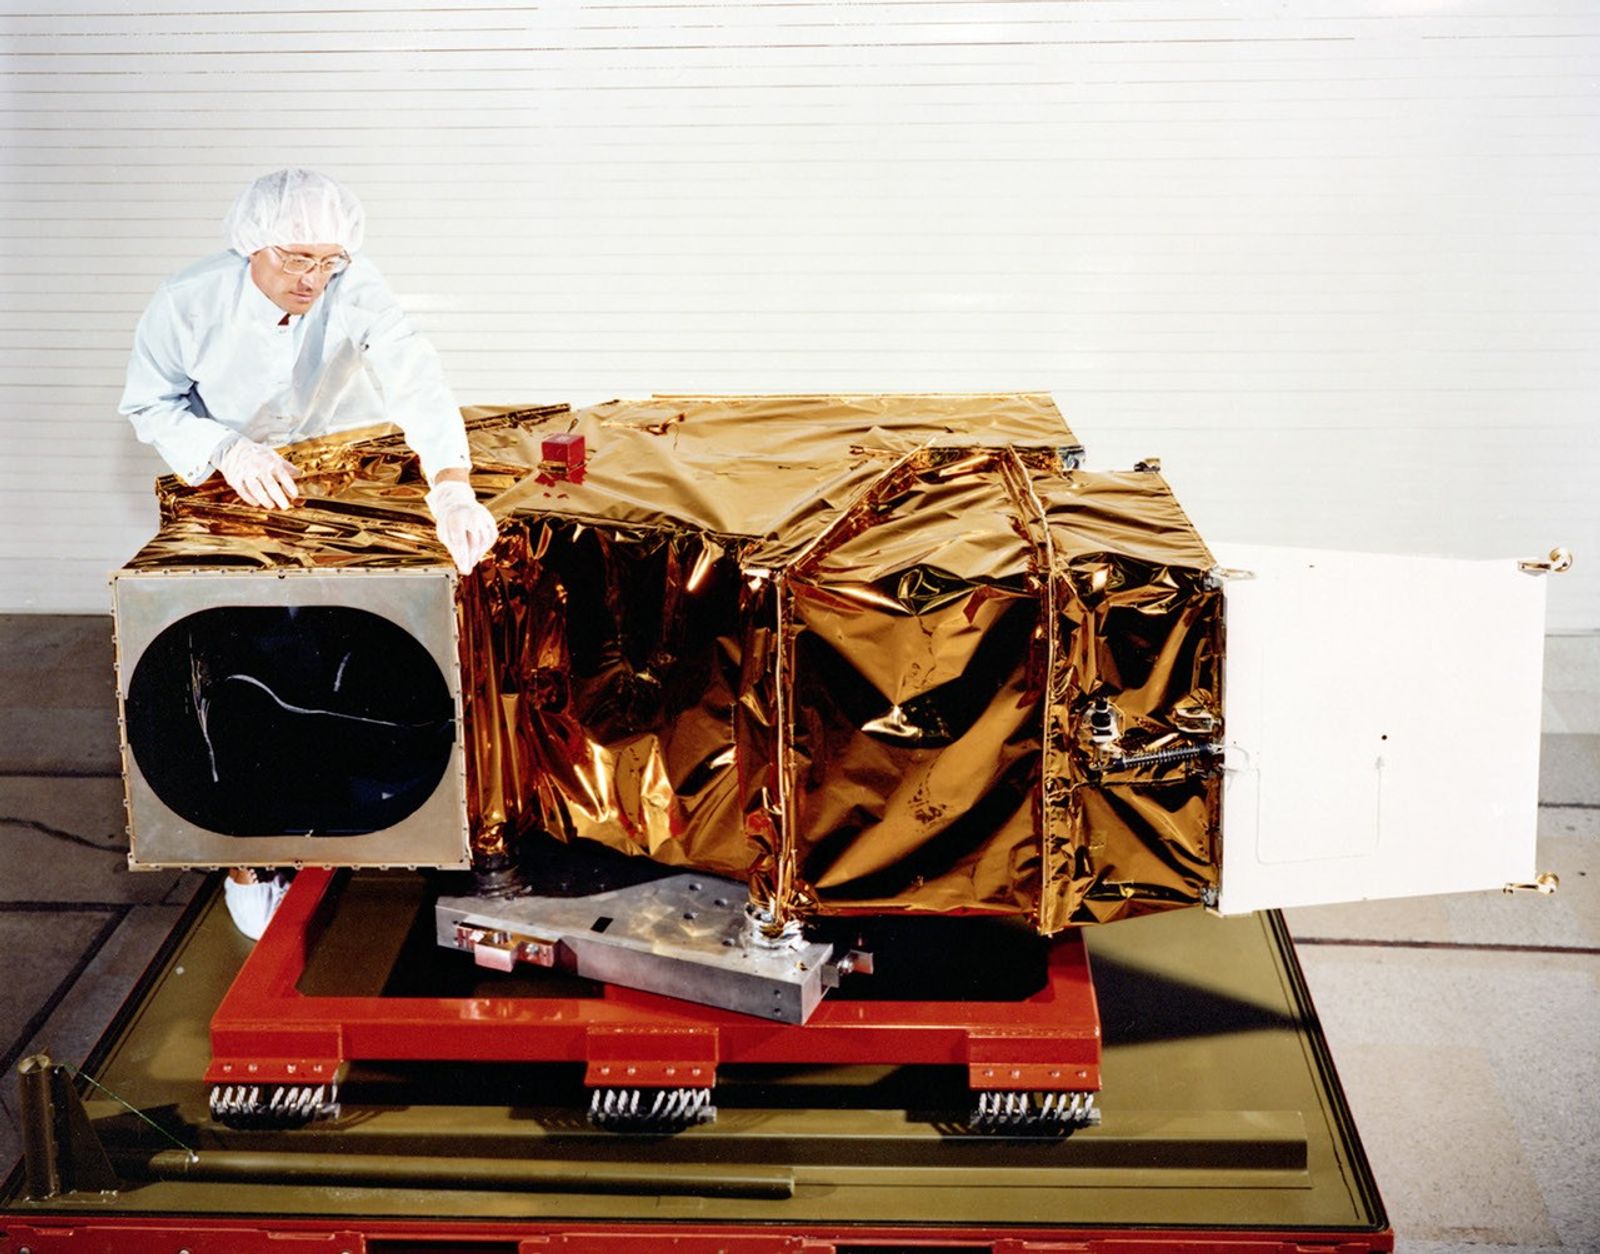
During the development and build of the MSS and Thematic Mapper (TM) instruments for Landsat 4 and 5, Barker spent long stretches of time with the Hughes Santa Barbara engineers doing the instrument build and testing. Despite a tremendously arduous and stressful development cycle for the next-generation Thematic Mapper instrument, what stood out to Barker most from that time was the teamwork and camaraderie between NASA and industry Landsat builders.
The “embedded NASA scientist” role that Barker initiated in the late 1970s is now a formal position written into the satellite contracts with every new Landsat build.
With Barker’s encouragement and then-Landsat Assistant Project Scientist Darrel Williams’ and Project Scientist Vince Salomonson’s endorsement, NASA Goddard made characterizing the performance of Landsat 4 and 5 a key mission objective.
Barker led this characterization effort, called the Landsat Image Data Quality Assessment, or LIDQA. The end-to-end Landsat infrastructure, from sensors to ground processing, was carefully scrutinized to ensure the best image data quality. The effort involved more than 400 external investigators working together with Barker’s Goddard-based team. Barker brought a young scientist named Brian Markham on board, and together they assembled what could be considered Barker’s opus: a six-volume NASA publication of Technical Memorandums that reported on the LIDQA assessments of Landsat 4 and 5. Barker meticulously documented the characterization work of his team in this publication. The printed volumes originally had thick orange covers, and were affectionately referred to as the “Orange Books.”
“He was certainly instrumental in taking the Landsat sensor data from the pretty picture for analog interpretation to scientific data for digital analyses,” Markham notes.
The calibration methodology established by Barker and the LIDQA team and documented in the Orange Books has been described as the “first quantitative documentation of the Landsat sensors and their data” and has widely influenced land remote sensing calibration.
As Williams shares, “John’s work vis-a-vis calibration had a tremendous impact on the wider remote sensing community, showing both what was needed and what was possible.”
Pursuit of Precision
Barker was only a peripheral presence during the build of the failed Landsat 6 commercial satellite, turning his attention to the calibration of NASA’s MODIS satellites. When government responsibility for Landsat 7 was restored, Barker, together with Markham, were back at it.
Barker had a singular focus on improving radiometric accuracy. His drive for data precision was insatiable. This was perhaps a combination of nature and nurture. His father John L. Barker, Sr. invented the radar speed gun, establishing a ±2 mph accuracy, which he had to defend in court.
Pre-PowerPoint, Barker would roll a carry-on suitcase full of viewgraphs to meetings. “No short and sweet chart sets for him!” recalls former Landsat Systems Engineer and close friend, Terry Arvidson.
Described as a perfectionist, Barker was always striving for 0.1% precision — or better.
“The last decimal point is exciting,” Barker exclaimed in a 2005 oral history interview.
The well-understood and consistent, 50-plus-year data record of Landsat is a result of Barker’s dogged pursuit of precision. But this trait could be both a strength and struggle for Barker. He rarely published his work in peer-reviewed journals because he always thought he could get better results. And his tenaciousness could be a challenge for managers who had to balance his insistence of excellence with the limits of agreed-upon satellite specifications and cost considerations.
Barker’s work characterizing and calibrating Landsat data earned many awards over the decades. In April 2001, he received the NASA Distinguished Service Medal — NASA’s top honor for federal employees — for his work advancing the U.S. Space Program.
Fortunately, Markham, who Barker had taken under his wing, was able to document and publish much of the work done during this period. A long list of Markham and Barker papers can be found in peer-reviewed literature.
Markham recalls Barker’s extraordinary energy and excitement and his need for little sleep, even recalling fondly Barker’s uncanny ability to start a long (90 minutes-plus!) calibration conversation just as the work day was ending.
There were two key lessons he learned from Barker: (1) a number without an uncertainty (±n) is almost meaningless and (2) always have three ways to measure something so you can check for agreement; this will help with the difficult goal of demonstrating accuracy.
“John was instrumental in creating the philosophy that Landsat was, first and foremost, a scientific instrument that collected calibrated data, not just pictures,” explains former Landsat 9 and Deputy Landsat 8 Project Scientist Jeff Masek.
“It’s hard to separate his impact from Brian Markham’s since they worked so closely together, but as a team, they always sought to improve the calibration of the on-orbit instruments and use that information to achieve a consistent radiometric record going straight back to 1972.”
Trailblazer and Mentor
Barker and Markham were instrumental in shaping the calibration methodology used by Landsat and most NASA land-observing satellites today. The use of desert test sites for vicarious calibration, data collection by newly launched satellites as they under-fly their predecessors during their climb into orbit, pre-launch calibration and testing requirements, multiple onboard calibration sources, spectral band-to-band comparisons across satellites, and the use of the Moon as a calibration target are all concepts Barker championed, adopted, and shared with fellow NASA, U.S. Geological Survey, and university collaborators. This multifaceted methodology is what creates Landsat’s robust scientific data set.
“We have a calibrated archive now primarily because of John’s seminal efforts to chase down every electron,” says Williams, a longtime Landsat 7 Project Scientist.
Barker’s influence also extended to every aspect of data integrity. He worked closely with instrument builders and the U.S. Geological Survey’s Landsat calibration team to set up verification processes that ensure satellite instrument data flows correctly from sensor to spacecraft to ground station to data user.
“He was passionate about Landsat and worked with all levels of the program to make sure we had the best satellite, instruments, data, and products possible,” states Masek.
During the days of Landsat 7, Barker and Masek worked closely to shape Barker’s calibration presentations into talks that could be grasped by non-calibration scientists. Along the way, Masek, who had formerly known little about calibration, developed a detailed and nuanced understanding of it.
“I didn’t feel talked down to, I felt like part of the process. He was a great mentor. He helped us all be the best we could be,” Masek recalls.
Barker’s mentorship extended from the technical to the interpersonal. Jim Irons, later to become Landsat 8 Project Scientist and the Director of the Earth Sciences Division at Goddard, recounts feeling genuinely consoled by thoughtful advice Barker gave him early in his career as he dealt with a difficult professor during his PhD studies.
Zeal for Calibration, Zest for Life
While Barker poured himself into his quest for quality data, it was not his only passion. For decades, he was the President of the Goddard Dance Club, a social ballroom dancing organization with nearly 200 members.
After his 2007 retirement from NASA, Barker could be found dancing 11 hours a week. When the pandemic temporarily shuttered the dancing facilities, Barker and his wife Noni continued to dance for nearly an hour a day at home.
He danced the samba in Brazil, rode camels in Egypt and Morocco.
“He was full of life, always had a smile, and had the best laugh ever,” Arvidson shares.
He loved a good argument and was rarely bitter or angry.
Masek sums it up this way: “John was a lovely guy.”
Barker was surrounded by Noni and his two children, Lauren and David, when he passed away in early July at the hospital where he was being treated after a fall.
His influence marches on. Jeff Pedelty, who Barker mentored on Landsat 7, became the embedded NASA scientist for the Landsat 8 and 9 builds and now supports Landsat 10. He has long kept a photograph of Barker on his desk, with a sticky note reminder: “All the data. All the time.”
John and Noni were married for 67 years. They had two children, Lauren and David, and danced together around the world and through the decades.
Thank you to Darrel Williams, Jim Irons, Brian Markham, Jeff Pedelty, Terry Arvidson, and Jeff Masek for sharing their thoughts and memories about John.

 Login