❌

Normal view

NASA concerns about Russian repairs prompted ISS safe haven decision

6 June 2026 at 18:33
The International Space Station, photographed in 2021. Credit: NASA

NASA directed astronauts on the ISS to shelter in a Crew Dragon spacecraft after Russian cosmonauts planned to perform repairs the agency thought created “elevated risk” to the station.

The post NASA concerns about Russian repairs prompted ISS safe haven decision appeared first on SpaceNews.

Toyzie: aponte a câmara a um brinquedo e a IA diz-lhe quanto vale

6 June 2026 at 18:21

Com recurso a inteligência artificial, o Toyzie identifica Hot Wheels, figuras de ação, Funko Pops, cartas TCG e muito mais, e diz-lhe, em segundos, o que tem na coleção e quanto vale cada peça no mercado atual.

The post Toyzie: aponte a câmara a um brinquedo e a IA diz-lhe quanto vale appeared first on Tek Notícias.

Hints for Massive Galaxy Evolution from Dusty Star-Forming Galaxies

15 May 2026 at 17:00

NGC 972

How do massive galaxies form and evolve? A recent study traces the stellar and dust distributions across evolutionary phases of massive galaxies to better understand how massive dusty star-forming galaxies fit into the picture.

Dusty Massive Galaxies

Massive galaxies, like the Milky Way or even larger, undergo phases of active star formation and quiescent phases of inactivity, but exactly how these galaxies evolve through these stages is not yet fully understood. Dusty star-forming galaxies, which are undergoing a period of intense star formation and shrouded in dust, might be the missing evolutionary step between star-forming and quiescent phases of massive galaxy evolution. 

Currently, the leading explanation for massive galaxy formation and evolution is inside-out growth — star formation and quenching start in the inner regions of a galaxy and progress outward. However, it’s not clear whether dusty star-forming galaxies also follow the favored inside-out pathway, or if they instead proceed outside-in, first growing their disks and then assembling a central bulge.

JWST NIRCam images

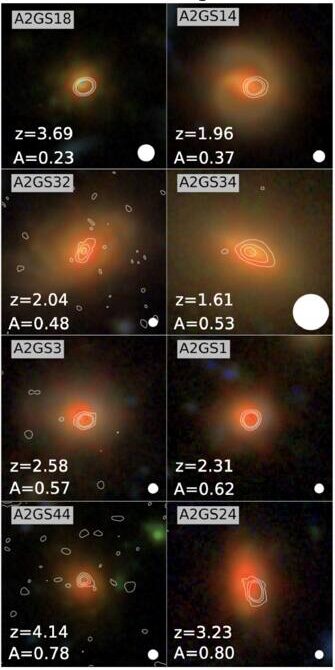
Example of JWST NIRCam images with ALMA contour lines overlaid for select dusty star-forming galaxies in the sample. [Modified from Bodansky et al 2026]

The spatial distribution (or morphology) of the stars and dust within dusty massive galaxies can help us trace their evolution. Thanks to high-resolution observations from JWST and the Atacama Large Millimeter/submillimeter Array (ALMA), researchers can now directly compare the morphologies of distant star-forming, quiescent, and dusty galaxies during the height of our universe’s star formation. Filling this gap will reveal how dusty star-forming galaxies may connect star-forming and quiescent galaxies in massive galaxy evolution.

Multiwavelength Morphological Comparisons

To directly compare the star and dust morphologies across massive galaxies, Sarah Bodansky (University of Massachusetts, Amherst) and collaborators selected a sample of 33 dusty star-forming galaxies from the GOODS-ALMA 2.0 survey that searched the sky for 1.1-mm dust emission as well as star-forming and quiescent comparison samples drawn from JWST observations. Combining the ALMA survey data with JWST imaging, the authors studied the rest-frame optical (stars) and rest-frame near-infrared (dust) morphologies of dusty, star-forming, and quiescent galaxies at redshifts around cosmic noon (a few billion years after the Big Bang).

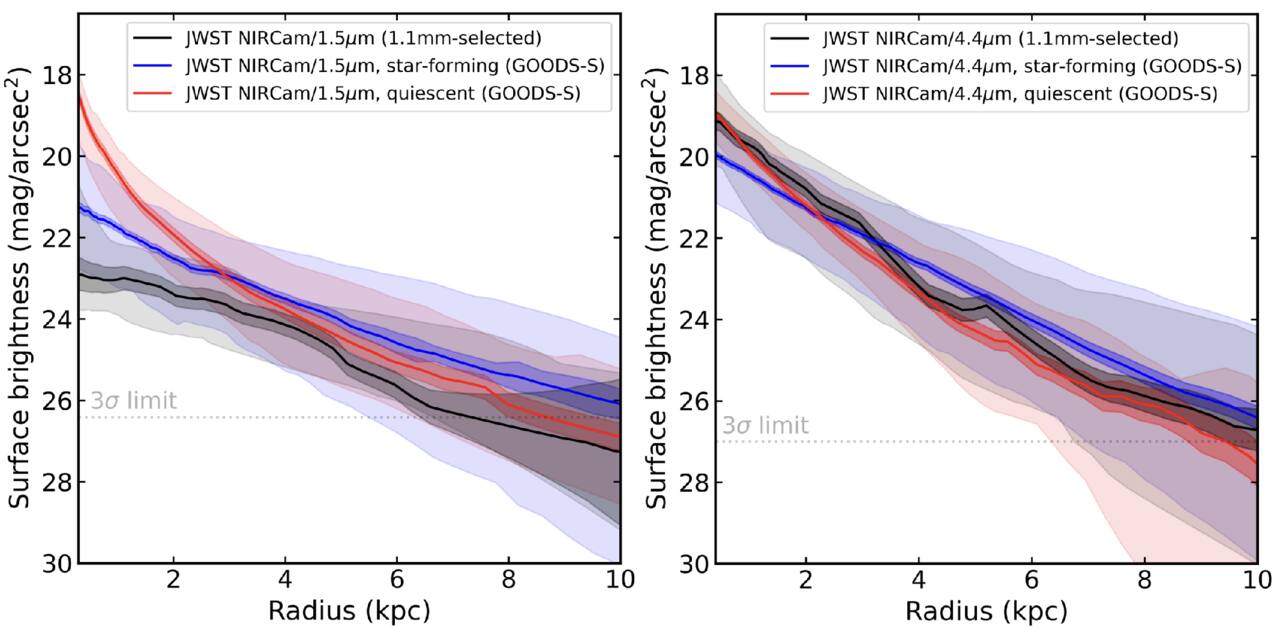
When comparing optical morphologies, the authors found that dusty star-forming galaxies and typical star-forming galaxies had similar distributions, but their near-infrared morphologies showed clear differences. Dusty galaxies tended to show more compact near-infrared emission, with dust tracing their stellar populations and more concentrated in the galaxies’ central regions. Though clearly different from star-forming galaxies, the authors noted striking similarities between the near-infrared morphologies of the dusty star-forming and quiescent galaxies, especially within their centers.

Surface brightness profiles

Average surface brightness profiles for the rest-optical (left) and rest-near-infrared (right) for the dusty (black), star-forming (blue), and quiescent (red) galaxies. In the near-infrared, the dusty star-forming galaxy profile appears very similar to the quiescent galaxy profile. [Bodansky et al 2026]

All of these properties suggest that dusty star-forming galaxies have built up stellar mass and dust in their cores, potentially forming a central bulge first and supporting an inside-out model of massive galaxy growth. This points to dusty star-forming galaxies as possible direct progenitors of early massive quiescent galaxies, hanging onto their last bit of star formation before becoming quiet as well. While this study morphologically distinguishes dusty galaxies from their star-forming and quiescent counterparts, future spectroscopic studies comparing the kinematics of these populations and investigations of molecular gas distributions are necessary to better pin down the evolutionary connection between star-forming, dusty, and quiescent massive galaxies.

Citation

“JWST+ALMA Reveal the Buildup of Stellar Mass in the Cores of Dusty Star-forming Galaxies at Cosmic Noon,” Sarah Bodansky et al 2026 ApJ 1001 235. doi:10.3847/1538-4357/ae4f64

The post Hints for Massive Galaxy Evolution from Dusty Star-Forming Galaxies appeared first on AAS Nova.

A New View of the Spectroscopic Universe

8 May 2026 at 17:00

A photograph of a telescope opened at dusk.

The Sloan Digital Sky Survey (SDSS) fundamentally changed the way modern astronomy research is done. This “grand and bold thing” is not frozen in a museum exhibit, however: instead, the SDSS telescopes and team have continued to iterate. The collaboration recently described the fifth generation of this groundbreaking survey in The Astronomical Journal.

Roots in History

Astronomy is now without question a “big data” science. While a lucky few researchers still occasionally travel to distant mountaintops to sojourn with the stars, most astronomers who can describe their work as “observational” rarely ever leave their laptops. Petabytes of historical data, including images, spectra, enormous simulation archives, and more, are available the instant one’s fingers touch a keyboard. As a result, the speed of discovery has increased exponentially, and the barriers to cutting-edge research have dramatically shrunk.

A cartoon of the Earth with three telescopes roughly geographically distributed as they are for the SDSS V survey.

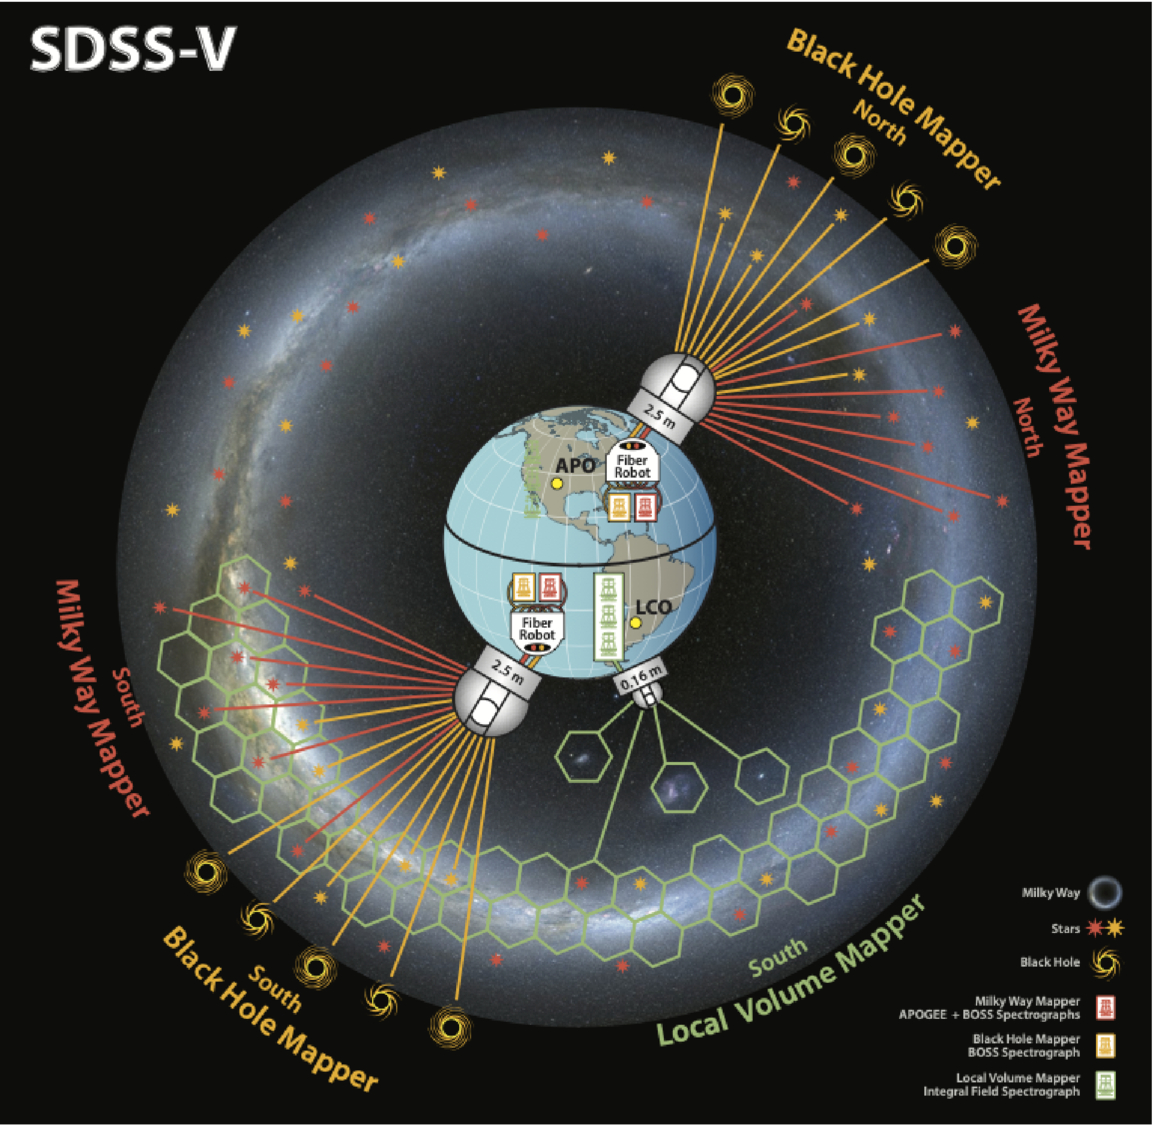
A schematic of the SDSS-V survey facilities and targets. Click to enlarge. [Kollmeier et al. 2026]

While no paradigm shift can be pinned to an exact date, astronomy’s turn towards the data-rich era arguably began in 1998 when SDSS first began collecting data. This was among the first of the “industrial” surveys that observed large swaths of the sky with electronic detectors and used automated pipelines for bulk data processing. In the years since, larger robotic telescopes have begun to mimic the SDSS strategy of “mowing the sky.” The latest of these successors, which itself may usher in another paradigm shift in terms of data volume and availability, is the soon-to-begin Legacy Survey of Space and Time at the Vera C. Rubin Observatory.

While SDSS’s twin 2.5-meter telescopes (one in New Mexico and one in Chile, allowing the survey to observe the entire sky) are dwarfed by Rubin’s 8-meter mirror, there is still thrilling science to be done with these moderate-sized observatories. This is especially true after a series of upgrades to the spectrographs and thanks to a deep expertise in not only survey-style science, but also in project management and survey planning. In 2021, in the middle of COVID-19 delays and distancing requirements, the team began upgrades to their existing facilities and construction of a brand new telescope to kick off the latest survey, SDSS-V.

The Next Generation

A two-panel figure showing top-down views of the milky way galaxy with different density contours overlaid.

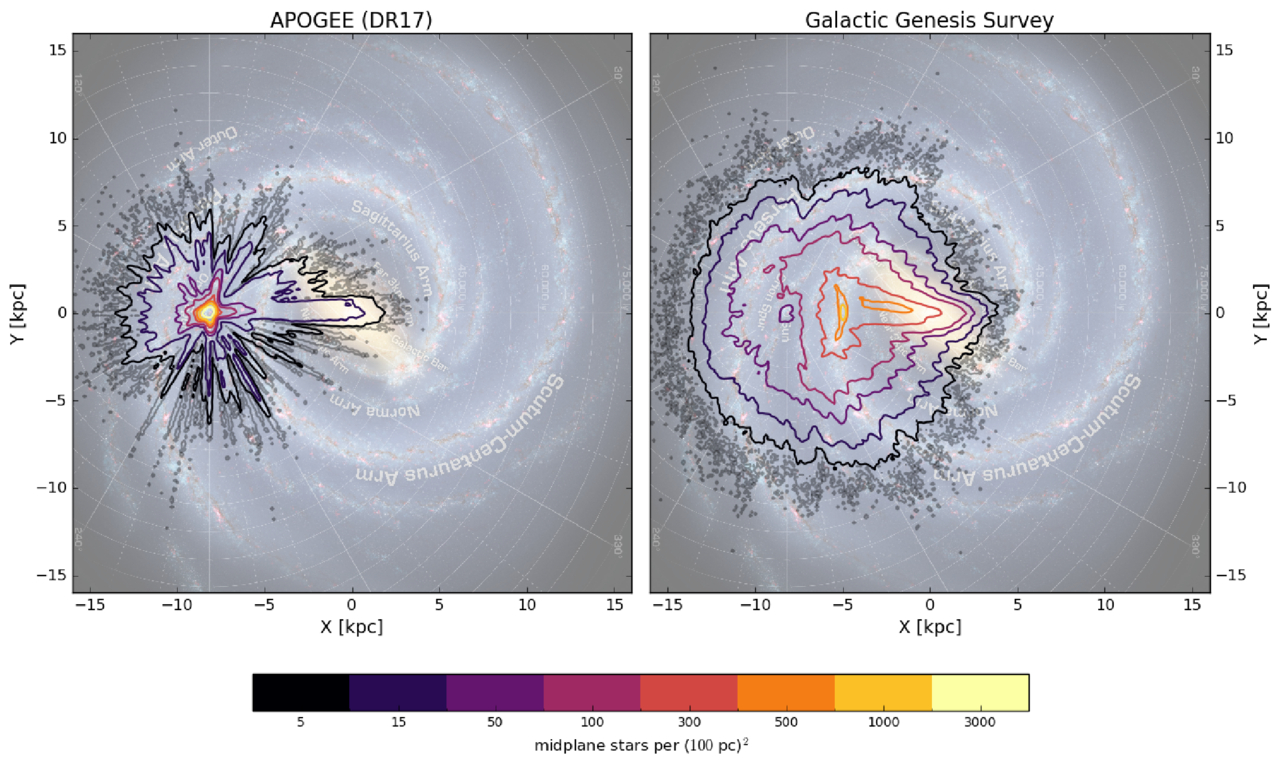
The density of target stars for the SDSS-V survey compared to a previous spectroscopic survey. Click to enlarge. [Kollmeier et al. 2026]

In a wide-ranging publication that references not only astronomy research articles but also Plato, the Bhagavad Gita, an Egyptian tomb, and Tolstoy, the large collaboration describes that this latest survey is divided into three parts: the Milky Way Mapper, the Black Hole Mapper, and the Local Volume Mapper. The preexisting telescopes, which are outfitted with hundreds of tiny robots that can swivel fiber optic cables into place to collect spectra of up to 500 objects at a time, will handle the first two of these “mappers.” A brand-new facility in Chile that’s specifically designed to map the structure of nearby gas will handle the last mapper. Instead of aiming the fibers at a known star or galaxy, this telescope will instead collect a spectrum for every point across an area the size of the full Moon with every exposure.

By the end of the survey, SDSS-V will have collected optical and near-infrared spectra for roughly 6 million objects spread across the whole sky, as well as time-series spectra from about a million of these sources. This dataset, which is unprecedented in both its spatial and temporal coverage, will allow researchers to probe questions ranging from how quasars evolve over time to how commonly young stars have brown-dwarf companions. Long since SDSS initiated the era of industrial survey astronomy, this latest publication shows how the survey continues to lead the way.

Citation

“Sloan Digital Sky Survey. V. Pioneering Panoptic Spectroscopy,” Juna A. Kollmeier et al 2026 AJ 171 52. doi:10.3847/1538-3881/ae0576

The post A New View of the Spectroscopic Universe appeared first on AAS Nova.

Black Hole Baby Photos: JWST and Chandra Observe M31-2014-DS1

4 March 2026 at 17:00

illustration of M31-2014-DS1

One of the most luminous supergiant stars in the Andromeda Galaxy, M31-2014-DS1, has disappeared, potentially leaving behind a black hole shrouded in dusty gas. What do new infrared and X-ray observations tell us about this event?

Failure to Explode?

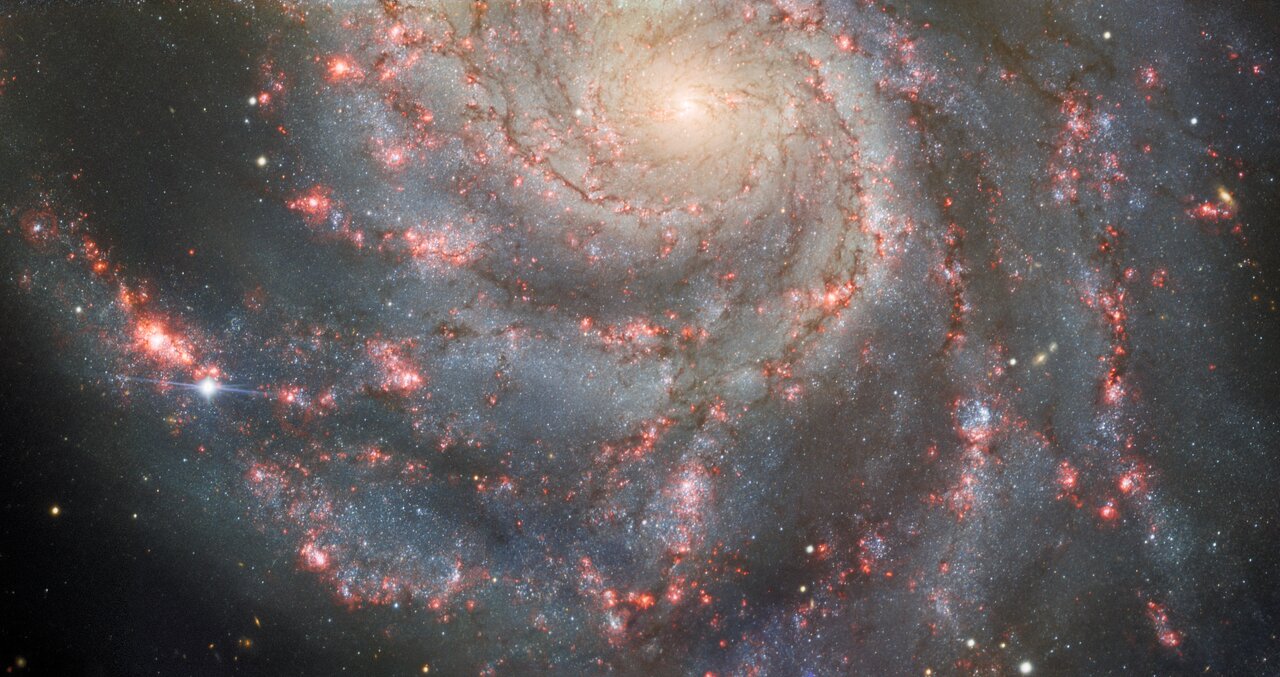
SN 2023ixf in Messier 101

This image from Gemini North shows the supernova SN 2023ixf along one of the spiral arms of Messier 101. Though less showy than core-collapse supernovae, “failed” supernovae may be another way to form stellar-mass black holes. [International Gemini Observatory/NOIRLab/NSF/AURA; CC BY 4.0]

Massive stars are famous for going out with a bang. After swelling into supergiants, these stars bring their brief lives to a close in a cosmic fireworks show: a supernova explosion that creates a neutron star or a black hole.

But a splashy supernova explosion may not be the only way for a massive star to go out. As observations have begun to suggest, some massive stars may — for reasons not yet fully understood — quietly collapse in upon themselves, going out with a whimper rather than a bang. Though less spectacular and far harder to spot, these “failed” supernovae highlight a possible pathway for the formation of stellar-mass black holes.

A Newborn Black Hole in a Dense, Dusty Blanket

Just last month, researchers reported their discovery of a potential failed supernova. The supergiant M31-2014-DS1 suddenly brightened in 2014 before fading to obscurity, leading researchers to suspect that the star had experienced a failed supernova and created a black hole. The event shared similarities with another failed supernova candidate, NGC6946-BH1.

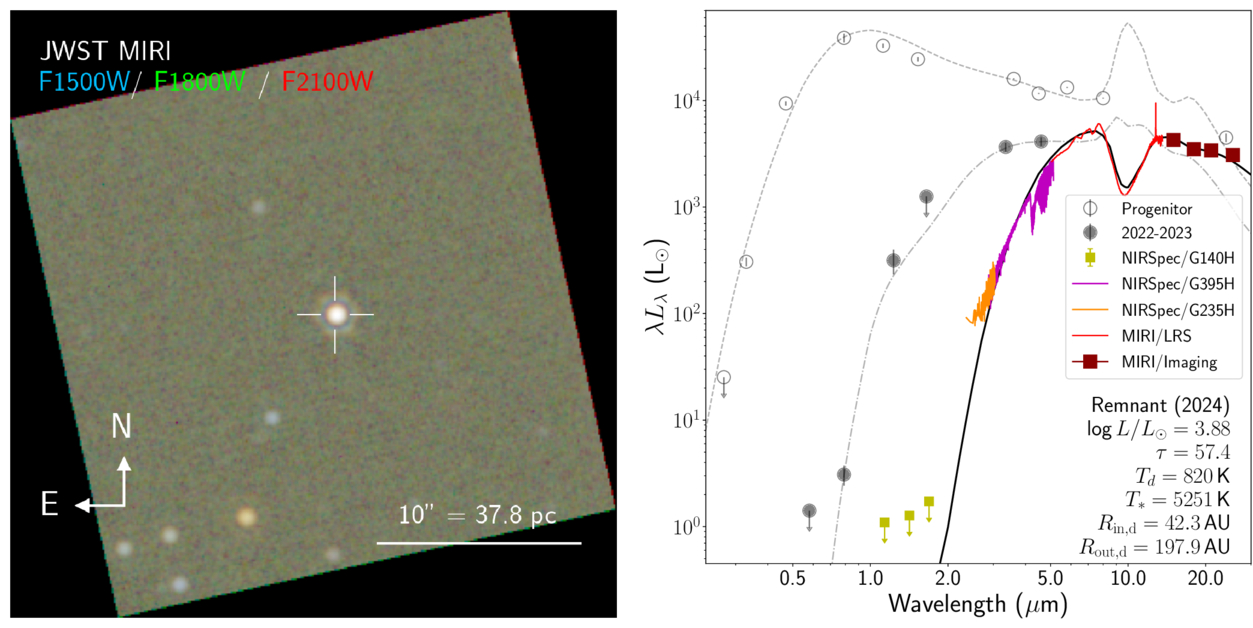
JWST data of M31-2014-DS 1

Left: A JWST image of M31-2014-DS 1. Right: Spectral energy distributions of the progenitor star/the remnant using data from 2005 to 2012 (empty circles), 2022 to 2023 (filled circles), and 2024 (colored lines). Click to enlarge. [De et al. 2026]

In a new article published in the Astrophysical Journal Letters, Kishalay De (Columbia University; Flatiron Institute) and coauthors have used JWST and the Chandra X-ray Observatory to learn more about what remained after M31-2014-DS1 disappeared. The JWST observations show an extremely red object that has faded considerably in just a few years, with a deep absorption feature from silicate dust and numerous narrow molecular absorption lines. Chandra did not detect any X-rays.

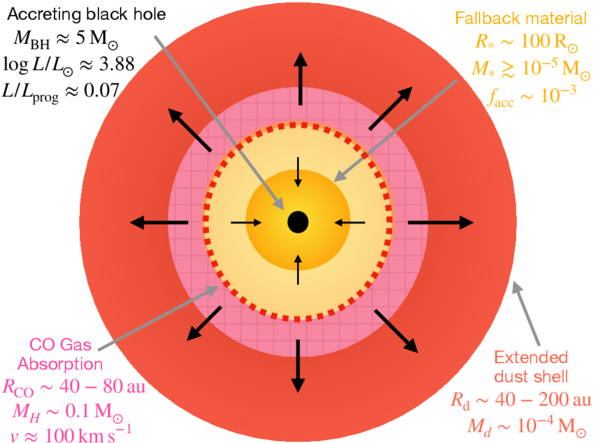
Together, these observations support a model in which the collapsing star ejected its outer layers in a relatively low-energy event (somewhere in the broad ballpark of one hundred-millionth to one ten-thousandth the energy of a typical core-collapse supernova) and formed a black hole. Some of the ejected material fell backward and fed the newborn black hole, while the remainder created a dense blanket that blocked the light from the accreting black hole from view.

Continued Evolution

schematic of the gas surrounding a newborn black hole

Cartoon showing the authors’ model and the model parameters inferred from the observations. Click to enlarge. [De et al. 2026]

In observations from 2024, the source had faded to just 7% of the progenitor star’s luminosity, supporting the conclusion that the star has disappeared and what lies beneath the dusty ejecta is a black hole. De’s team expects that as time goes on, the gas that obscures the accretion-powered luminosity of the newborn black hole will expand and become less dense along our line of sight. At some point — estimated to be no sooner than about 27 years from now — the X-ray emission from the accreting black hole should pierce the dusty shroud and become visible to sensitive X-ray observatories. In the infrared, JWST will be able to track the source’s evolution caused by continued dust creation in the expanding shell.

Thanks to its location in a neighboring galaxy, M31-2014-DS1 has granted astronomers a front-row seat to a poorly understood pathway for black hole formation. Going forward, we can expect further insights into M31-2014-DS1 and, hopefully, the discovery of many more sources like it.

Citation

“Fading into Darkness: A Weak Mass Ejection and Low-Efficiency Fallback Accompanying Black Hole Formation in M31-2014-DS1,” Kishalay De et al 2026 ApJL 999 L25. doi:10.3847/2041-8213/ae468d

The post Black Hole Baby Photos: JWST and Chandra Observe M31-2014-DS1 appeared first on AAS Nova.

How Solar Flares Hint That They’re About to Happen

1 December 2025 at 17:00

Images of a solar flare at different wavelengths

Forecasting solar flares is one of the major challenges facing solar physicists today. New research finds that non-thermal emission can precede a solar flare by more than an hour, and this early emission may signal whether the flare will be accompanied by an explosion of plasma.

Flare Flavors

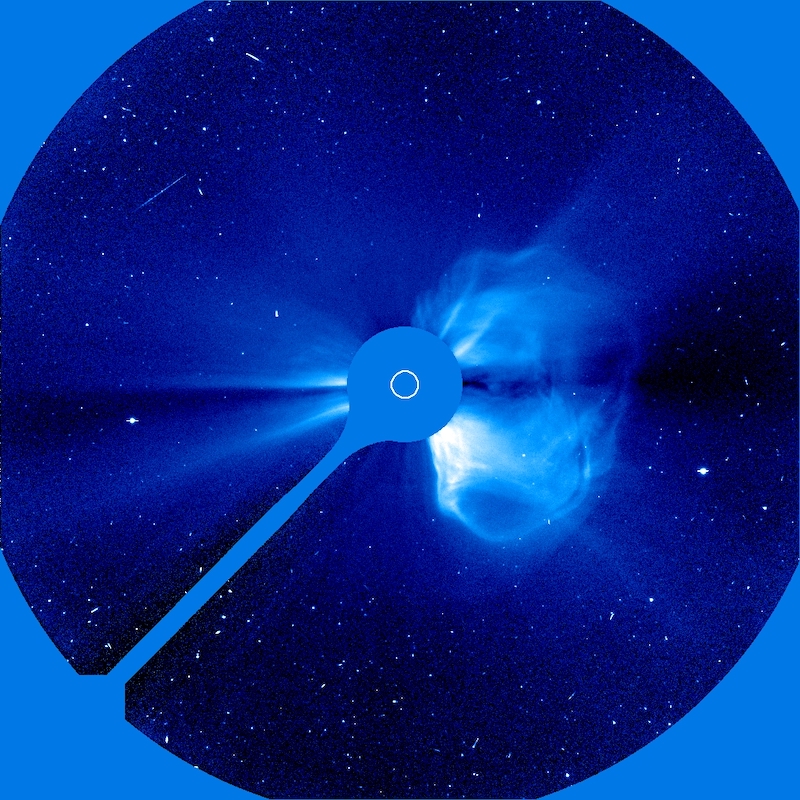
photograph of a coronal mass ejection

The Solar & Heliospheric Observatory (SOHO) took this coronagraphic image of a coronal mass ejection on 20 April 1998. [SOHO (ESA & NASA)]

Solar flares come in two basic flavors: eruptive and confined. Eruptive flares are accompanied by the launch of tangled clouds of plasma and magnetic fields called coronal mass ejections. Confined flares, so called because the solar plasma remains confined to the Sun, feature only a brief blast of high-energy radiation.

Both solar flares and coronal mass ejections can disrupt everyday life on Earth, with flares knocking out radio communications and coronal mass ejections threatening spacecraft electronics and power grids. Given these real-life risks, as well as the potential for probing the physics behind the activity on the Sun and other stars, it’s critical to be able to identify signs of upcoming flares.

Looking at the Lead-Up

Luckily, there’s growing evidence that the Sun sends out subtle signals that a flare is soon to happen. One early sign of an impending flare is an increase in the non-thermal velocity of the plasma at the flare’s location. This phenomenon has been spotted in individual flares, but it hasn’t been studied and characterized for a large sample of flares — until now.

example of increasing non-thermal velocity before a solar flare

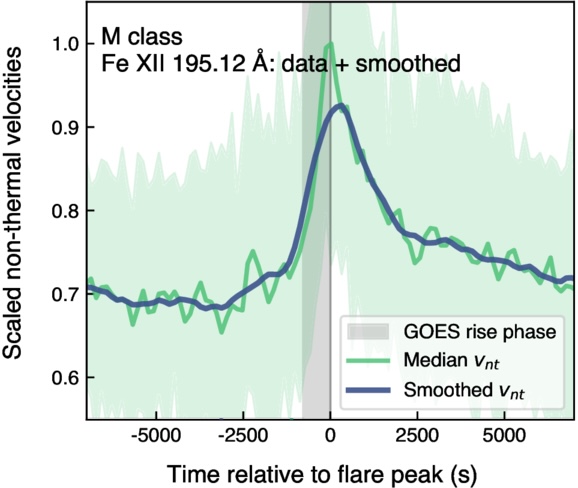
Demonstration of the increase in non-thermal velocity seen in an M-class flare compared to the onset and rise time of the soft X-ray flux (gray shaded area). [Adapted from To et al. 2025]

A recent research article led by Andy S. H. To (European Space Agency) takes the first systematic, large-scale approach to studying the non-thermal velocity changes that precede solar flares. The team amassed a sample of 1,449 solar flares that were seen by the Hinode spacecraft, the Geostationary Operational Environmental Satellite (GOES), and the Solar Dynamics Observatory (SDO). Hinode provided the spectral information needed to identify increases in the non-thermal velocity, GOES provided the flare start times, and SDO provided detailed information on the location and appearance of each flare.

Of the flares in the sample, 83% were moderately powerful C-class flares, 18% were stronger M-class flares, and 1% were the most powerful X-class flares. To’s team identified a clear trend across all types of flares: the non-thermal velocity increases 4–25 minutes before the flare’s X-ray emission begins to rise, peaks when the X-ray emission peaks, and decays as the flare decays. The team found some evidence that for smaller flares, the velocity increase begins in spectral lines that trace cooler plasma before spreading to lines probing hotter plasma, but more work is needed to confirm this trend.

More Details

Examples of flares with and without coronal mass ejections

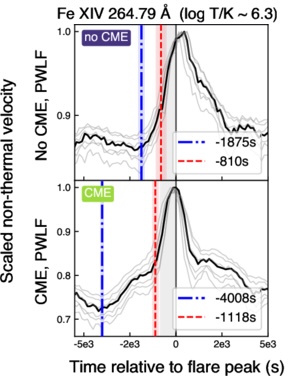
Examples of flares with and without coronal mass ejections. [Adapted from To et al. 2025]

Certain flares give even earlier hints of upcoming activity. M-class flares and some C-class flares exhibit what To’s team calls “precursor emission,” which emerges roughly 30–60 minutes before the flare’s X-ray emission peaks. The team also identified differences in precursor emission between confined and eruptive flares: eruptive flares display precursor emission over a broad range of spectral lines starting 45–74 minutes before the flare peaks, while confined flares show precursor emission later (31–54 minutes before peak) and in only a few spectral lines.

These results suggest that changes in the non-thermal velocity of solar plasma can not only signal when and where a flare is likely to arise, but also whether the flare will be accompanied by a potentially destructive coronal mass ejection. Upcoming missions like the Multi-slit Solar Explorer and SOLAR-C will give an even better view of the early stages of solar flares, helping to illuminate the physics behind them and enhancing our ability to forecast them.

Citation

“Systematic Nonthermal Velocity Increase Preceding Soft X-Ray Flare Onset: A Large-Scale Hinode/EIS Study,” Andy S. H. To et al 2025 ApJ 993 102. doi:10.3847/1538-4357/ae07de

The post How Solar Flares Hint That They’re About to Happen appeared first on AAS Nova.

Chandra Spies a Supernova Shock Front Speeding Along

7 November 2025 at 17:00

Supernova remnant N132D

Beautiful bubbles of hot ionized gas, supernova remnants trace the dying days of massive stars. A recent study uses the Chandra X-ray Observatory to detail the motion and understand the origins of one supernova remnant.

Retracing Supernova Remnants

Massive stars, about 8 solar masses or larger, will end their short lives in violent core-collapse supernovae. These explosions barrel into any surrounding interstellar medium, carving out low-density cavities and blowing material outward. Appearing as a bubble or shell of hot gas, a supernova remnant carries the signatures of the type of star that produced it and the ways that star shaped its environment throughout its life. 

Nearby, in the Large Magellanic Cloud, is the 2,500-year-old supernova remnant N132D — the most X-ray luminous supernova remnant within the Local Group. Though N132D’s size, likely progenitor mass, and chemical composition are well constrained, astronomers have yet to nail down the velocity of the X-ray shock front — the outer edge of the supernova remnant that rams into the interstellar medium. This measurement is critical to understanding the local conditions the supernova first encountered and how its expansion will continue to impact the interstellar medium over time.

Chandra Observations of N132D

Determining the shock front velocity requires astronomers to focus on the thin outer edge of the soaring supernova remnant — how do we measure the motion of such a narrow strip of gas? X-ray spectroscopy of N132D yields a measurement from a single epoch of observations, but it cannot isolate the narrow shock front, making a reliable velocity measurement difficult to attain.

supernova remnant velocity

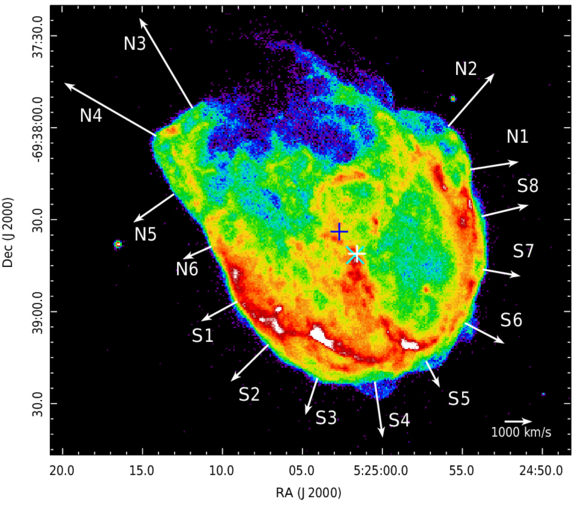
The expansion of supernova remnant N132D around the rim for each of the regions analyzed in this study. The arrow lengths are proportional to their estimated expansion velocities. Click to enlarge. [Long et al 2025]

Circumventing the challenges of spectral analyses, Xi Long (University of Hong Kong) and collaborators used two sets of X-ray observations of N132D from the Chandra X-ray Observatory taken about 14.5 years apart to measure the motion of the shock front across the sky over time. This measurement, known as proper motion, compares the location of the foreground supernova remnant to stationary background stars to estimate its angular speed. 

The authors focus on small regions on the very edge of the supernova shock front, six northern and eight southern, to carefully measure the motion of the shock between the two sets of observations. In separating the shock front into smaller regions, the authors can determine any variations in speed along the shock front. The southern edge of N132D moves with the same expansion rate of 1,620 km/s. The northern edge has an average expansion rate of 3,820 km/s, but its speed is more varied, which isn’t unexpected given its blown-out appearance.

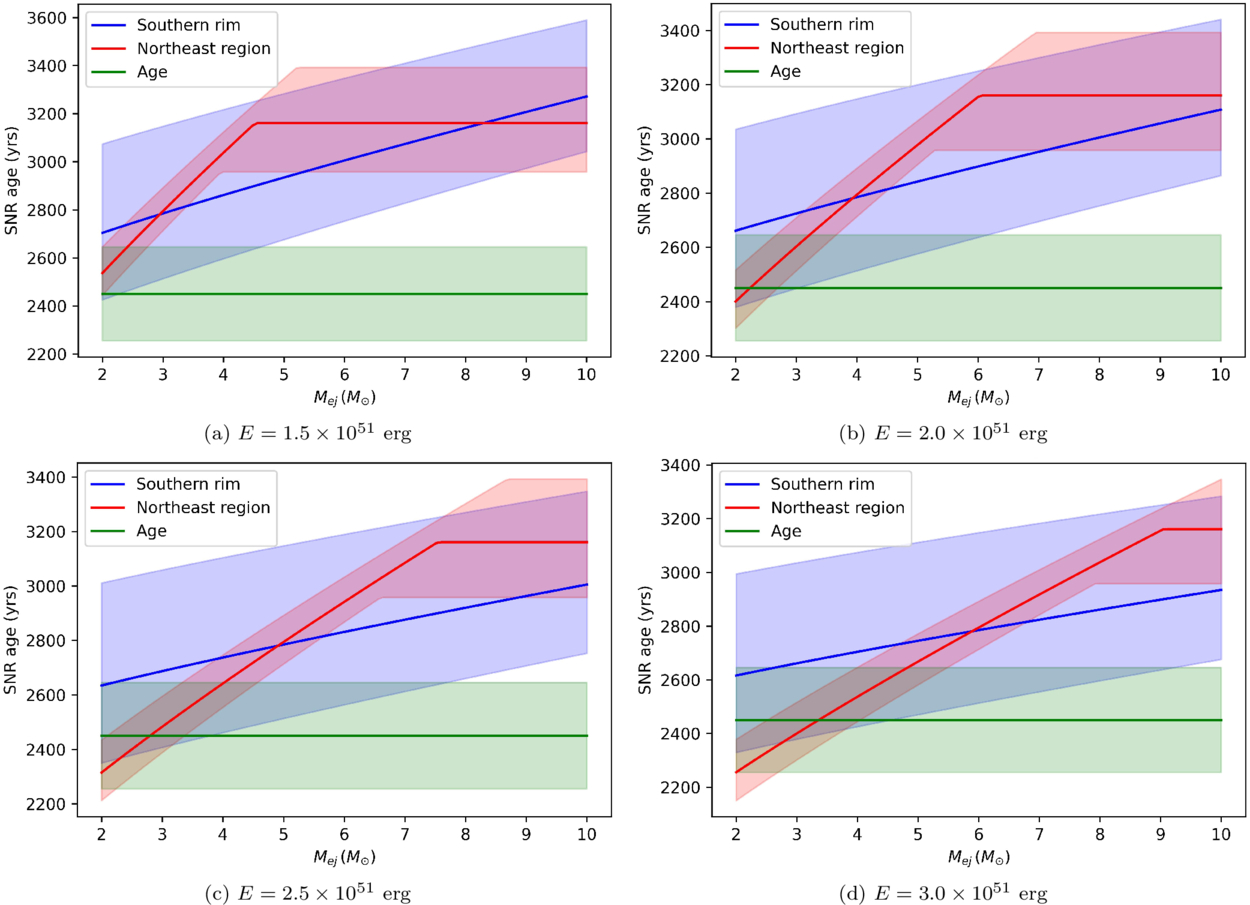
Modeling results showing the supernova age versus ejecta mass for the northern (red) and southern (blue) regions compared to the age estimate from an optical study of N132D. For the explosion energies and estimated ejecta masses between 2 and 6 solar masses, the models are consistent for all three. Click to enlarge. [Long et al 2025]

Comparing to Prior Studies

In addition to determining the velocity of the forward shock, the authors model the evolution of the supernova remnant to estimate the initial conditions of N132D including progenitor star mass, explosion energy, and ejecta mass. Their results agree with other studies that suggested N132D originated from a roughly 15-solar-mass star that exploded 2,500 years ago into a low-density cavity. 

This study showcases the unique ability of Chandra’s high-resolution instruments to carefully measure the evolution of supernova remnants, and further studies will continue to determine the detailed characteristics of supernova remnants across the Local Group.

Citation

“Chandra Large Project Observations of the Supernova Remnant N132D: Measuring the Expansion of the Forward Shock,” Xi Long et al 2025 ApJ 993 136. doi:10.3847/1538-4357/ae07c7

The post Chandra Spies a Supernova Shock Front Speeding Along appeared first on AAS Nova.

A Close Look at an Ancient Moon

5 September 2025 at 17:00

A photograph of a heavily cratered moon on a black background.

By piecing together observations from dozens of radio telescopes in Chile, planetary scientists recently completed the first-ever map of Callisto’s emission at millimeter wavelengths.

Old and Cold

In striking contrast to Io’s frenzied volcanism and Europa’s cracking ice shell, Jupiter’s moon Callisto is much quieter and colder than its Galilean siblings. Though a liquid water ocean hypothetically sloshes beneath its frigid surface, it’d be hard to infer that just by looking at the moon. Callisto’s terrain is ancient, static, and bears the scars of the millennia of exposure to space. There are no volcanoes, plate tectonics, or any other features to disturb what researchers call “evolved ruins” of the numerous craters. These have names like Valhalla, Asgard, and Lofn, since Callisto’s geologic features are named after settings and characters in Norse mythology to further reinforce their freezing existence.

This never-reset canvas makes Callisto an ideal laboratory for studying the long-term effects of asteroid impacts, dust accumulation from nearby natural satellites, and other processes that modify a planetary surface over time. One way to infer the composition and structure of the first few meters of material is to observe the way the temperature changes over the course of a day. For example, ice and rock respond differently to temperature changes; similarly, small-grains of either material warm up and cool down at different speeds than their larger-grain counterparts.

An image of a purple-orange blob against a black background.

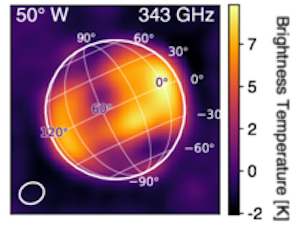
The residuals from one of ALMA’s observations of Callisto. [Adapted from Camarca et al. 2025]

In theory, planetary scientists can measure the temperature of a moon by noting how bright each patch of its surface appears in millimeter-wavelength observations. However, this is easier said than done, as only a handful of telescopes are capable of seeing Callisto as anything more than a fuzzy blob at those wavelengths. Back in 2016–2017, planetary scientists used the Atacama Large Millimeter/submillimeter Array (ALMA), a radio interferometer in Chile, to attempt the challenging feat of making a map of Callisto’s surface.

Mapping from Afar

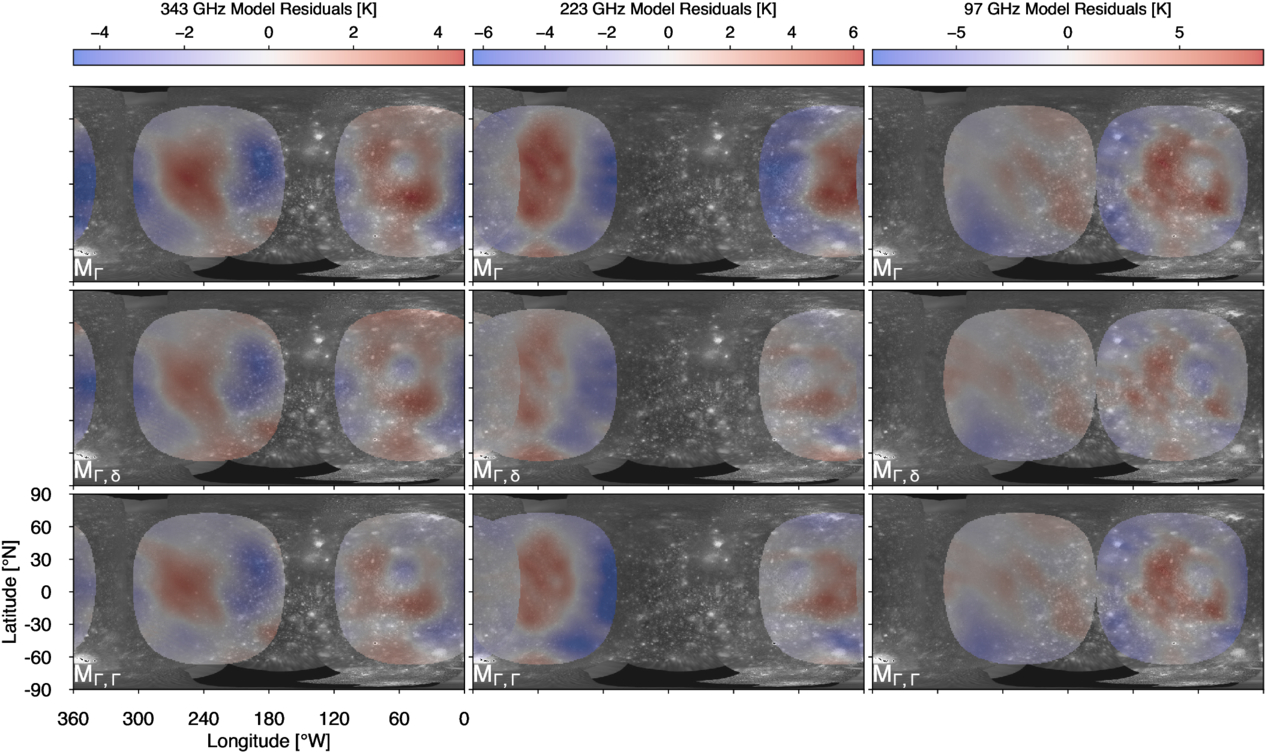
A team led by Maria Camarca, California Institute of Technology, just finished churning through all of the data and assembling their map of Callisto’s temperature residuals. Though the final spatial resolution was at best a few hundred kilometers, meaning a comparable map of Earth would blur all of New England together, this represents the most detailed thermal map of Callisto yet. The map was detailed enough to easily spot the largest craters, and several impact craters including Valhalla stood out as being 3–5K colder than all of the surrounding terrain. The team spotted another anomalously cold region that coincides with the location of maximum carbon dioxide gas density recently seen with JWST.

A multi-panel figure of a black and white surface beneath transparent red and blue blobs.

A map of Callisto’s thermal emission (red/blue) overlaid atop visible images of the surface collected by spacecraft. Click to enlarge. [Camarca et al. 2025]

The team also found that their data could not be explained by a simple model for Callisto’s surface that assumed one dominant material and structure. Instead, their images were better explained by more complex simulations that use two different thermal inertias. Though they are not sure yet why this may be, it is clear that Callisto, often overlooked compared to its flashier siblings, is a complex world worthy of further study. Luckily, the upcoming Jupiter Icy Moons Explorer mission and ALMA’s Wideband Sensitivity Upgrade will bring new knowledge of Callisto’s ancient surface.

Citation

“A Multifrequency Global View of Callisto’s Thermal Properties from ALMA,” Maria Camarca et al 2025 Planet. Sci. J. 6 183. doi:10.3847/PSJ/ade7ee

The post A Close Look at an Ancient Moon appeared first on AAS Nova.

Get a Kick Out of This: Researchers Waited 15 Years to Measure a Neutron Star’s Journey

1 August 2025 at 17:00

Crab Nebula

With a measurement 15 years in the making, astronomers have pinned down the path of a neutron star launched by a collapsing star. This finding helps to explain how neutron stars are “kicked” into space by supernovae.

Just for Kicks

Crab Nebula pulsar

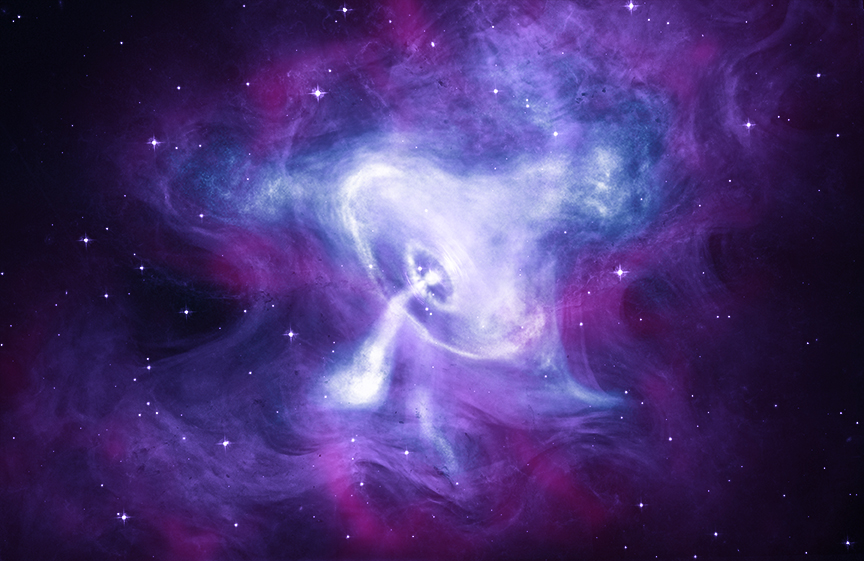
This multiwavelength image shows the pulsar — a type of neutron star — at the center of the Crab Nebula supernova remnant. [X-ray: NASA/CXC/SAO; Optical: NASA/STScI; Infrared: NASA-JPL-Caltech]

When massive stars reach the end of their lives, they expire in a final, fantastic cosmic display: a core-collapse supernova. These events can leave behind remnants called neutron stars, which are composed of highly compressed neutrons arranged in a sphere roughly as wide as the island of Manhattan is long.

Many neutron stars have been observed to zip through space at hundreds of kilometers per second, which suggests that these stars get a “kick” when they’re born in a supernova. However, the details of this kick are not yet clear. Are neutron stars launched into space in the opposite direction from the material ejected in the explosion, as some studies suggest? Or is the neutron star’s motion determined by the burst of neutrinos that carries off most of the supernova’s energy, as other studies hint?

Worth the Wait

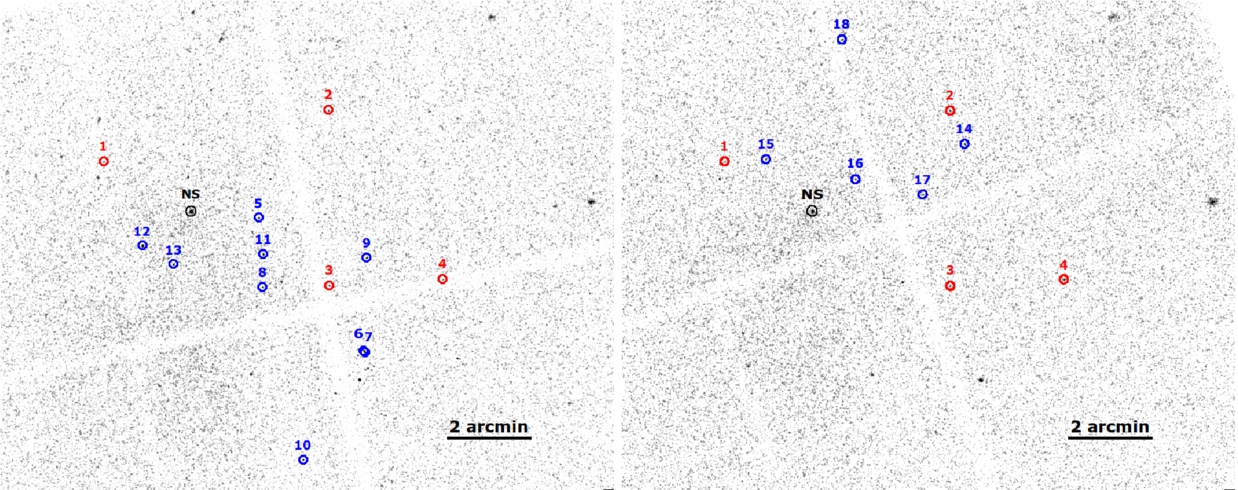
To answer these questions, astronomers must compare the velocities of young neutron stars to the movement of their associated supernova remnants. In a recent research article, Tyler Holland-Ashford (NASA Goddard Space Flight Center) and collaborators measured the motion of the neutron star affiliated with the G18.9–1.1 supernova remnant, using Chandra observations made 15 years apart in September 2009 and July 2024.

Chandra images of the field containing the neutron star

Chandra images from 2009 (left) and 2024 (right; this image is the merged product of two observations). The neutron star is shown in black. Blue and red sources were used for astrometric correction. The red sources were present in both observations. Click to enlarge. [Holland-Ashford et al. 2025]

Making this measurement is trickier than it sounds, requiring more finesse than simply charting the location of the neutron star at different times. Holland-Ashford’s team used measurements from the ultra-precise star-mapping Gaia spacecraft to account for the proper motions of other sources in the images and to put the observations from the two time periods into the same frame of reference. After these adjustments, they measured the proper motion of the neutron star to be 24.7 milliarcseconds per year.

Because the distance to the supernova remnant is uncertain, this proper motion could correspond to a range of transverse velocities. For distance estimates of 6,800 and 12,400 light-years, this puts the neutron star’s transverse velocity at 264 or 474 km/s, respectively.

A Distinct Offset

supernova remnant and neutron star location

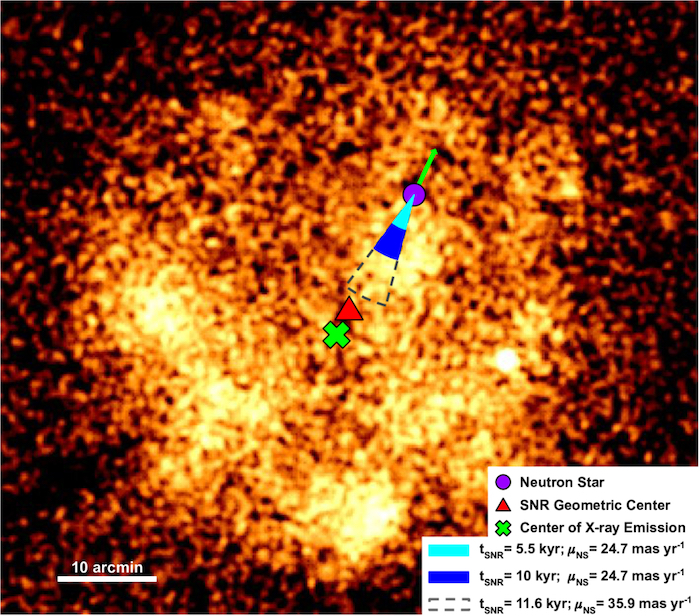
Current location of the neutron star (purple) compared to the geometric center of the supernova remnant (red) and the center of its X-ray emission (green). Even assuming the oldest reasonable age for the supernova remnant, there is a distinct offset between the neutron star’s birthplace and the center of the remnant. Click to enlarge. [Holland-Ashford et al. 2025]

What does this velocity tell us about the kick this neutron star received at birth? To probe the origin of the kick, the team first used the neutron star’s measured velocity and the likely age of the supernova remnant to trace the neutron star’s trajectory back to its birth site. This showed that the neutron star’s birthplace is offset from the center of the supernova remnant by several arcseconds, though both locations fall along the trajectory set by the neutron star’s motion. This suggests that the ejected stellar material and the newborn material were kicked in opposite directions by the supernova, most likely by a theorized “conservation-of-momentum-like” process.

Currently, Chandra is the only X-ray observatory with fine enough resolution to make the kind of measurement needed in this study. Luckily, Chandra’s observations of neutron stars stretch back to 1999, and combining this wealth of data with sensitive measurements from future high-resolution X-ray instruments should provide the long time baselines needed to trace the trajectories of more neutron stars and further explore the origins of neutron star kicks.

Citation

“Proper Motion of the Neutron Star in the Supernova Remnant G18.9–1.1,” Tyler Holland-Ashford et al 2025 ApJ 988 218. doi:10.3847/1538-4357/adeb7e

The post Get a Kick Out of This: Researchers Waited 15 Years to Measure a Neutron Star’s Journey appeared first on AAS Nova.

Minding the Gaps in Solar Wind Data

9 July 2025 at 17:00

solar wind

Spacecraft scattered throughout the solar system keep tabs on the solar wind, but the measurements are dotted with data gaps. How can scientists prevent these gaps from biasing their studies of the solar wind?

Sampling the Solar Wind

intracluster medium

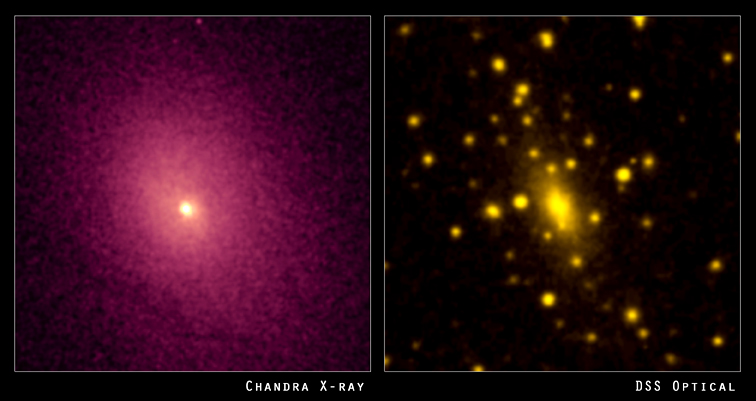
Left: the distribution of hot gas between the galaxies in the cluster Abell 2029. Right: the visible light from the galaxies in the cluster. [X-ray: NASA/CXC/UCI/A.Lewis et al. Optical: Pal.Obs. DSS]

The solar wind is a tenuous, fast-moving, turbulent plasma that constantly streams out from the Sun. Studying the solar wind is important for understanding how potentially damaging space weather events like coronal mass ejections travel through the solar system. Solar wind studies also have far-reaching implications, since solar-wind-like plasmas exist throughout the universe, such as in the sparse medium between galaxies in a cluster.

Luckily, there are many spacecraft that sample the solar wind from various locations within our solar system. Unluckily, many of these spacecraft do not continuously monitor the solar wind. For example, when a spacecraft orbiting a planet dips into the planet’s atmosphere, this detour creates an hours-long gap in solar wind monitoring.

The Impact of Data Gaps

How do these data gaps affect studies of the solar wind? In a recent research article, Daniel Wrench and Tulasi Parashar (Victoria University of Wellington) approached this question in terms of how gaps affect the structure function: a mathematical description of how the solar wind fluctuates over different length or time scales.

Wrench and Parashar introduced random artificial gaps into data from the Parker Solar Probe, which monitors the solar wind continuously, and compared the structure functions calculated from the continuous and interrupted data sets. They used the difference between the true structure function — calculated from the continuous data set — and the structure functions from the artificially gapped data sets to develop a correction factor.

bar plot of correction method performance

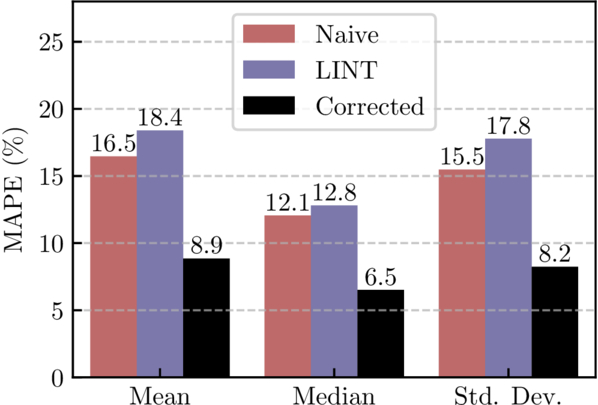
Performance of the correction factor method (black) compared to the uncorrected, gapped data (red) or gaps filled using linear interpolation (blue). MAPE is the mean absolute percentage error. [Wrench & Parashar 2025]

The team then tested their correction factor using data from the Wind spacecraft, which continuously monitors the solar wind from the L1 Lagrange point. The team calculated the structure function from 1) the continuous data set, 2) the artificially gapped data, 3) the gapped data with linear interpolation used to fill the gaps, and 4) the gapped data with the correction factor applied. This test showed that the correction factor performs better than other commonly used gap-handling methods, such as linear interpolation, which can systematically underestimate the structure function. Using the correction factor, the error in the structure function remained below 50% even when 95% of the data were missing.
plot of structure function from Voyager 1 data

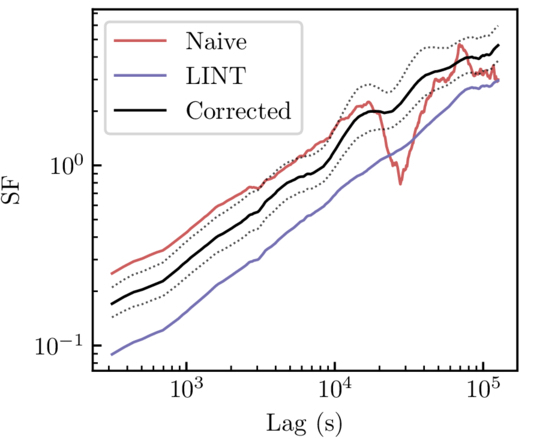
Structure function calculated from uncorrected Voyager 1 data (red), linearly interpolated data (blue), and corrected data (black). Both the linear interpolation method and the correction factor method remove the artifact around a lag of 3×10⁴ seconds, but the correction factor method does not suppress the signal like the linear interpolation method does. [Adapted from Wrench & Parashar 2025]

Correcting Voyager 1

Finally, the authors applied their validated method to data from Voyager 1. Data from the two Voyager spacecraft are extremely scientifically valuable — no other spacecraft have ventured as far from the Sun and can measure the solar wind at such large distances. The data are also extremely sparse; one segment used in this work was missing 85% of the data. This means that an effective method of correcting these data has potentially huge scientific significance.

Wrench and Parashar applied their correction factor to the Voyager 1 data, showing that this method handily removes artifacts while avoiding the underestimation introduced by linear interpolation. While the authors saved the interpretation of the newly corrected Voyager 1 data for future research, this study makes it clear that even large data gaps needn’t hinder studies of the solar wind.

Citation

“Debiasing Structure Function Estimates from Sparse Time Series of the Solar Wind: A Data-Driven Approach,” Daniel Wrench and Tulasi N. Parashar 2025 ApJ 987 28. doi:10.3847/1538-4357/addc6a

The post Minding the Gaps in Solar Wind Data appeared first on AAS Nova.

Citizen Science Born in the Pandemic: The Hubble Image Similarity Project

2 July 2025 at 17:00

images from the Hubble Image Similarity Project

Motivated by a desire to support community members financially during the coronavirus pandemic, researchers employed 30 local citizen scientists in the Hubble Image Similarity Project. This project quantified the similarities between astronomical images, providing a way to test the results of image-search algorithms.

Seeking Similarities

Eagle Nebula

The Eagle Nebula, pictured here in an image from Kitt Peak National Observatory, is a star-forming region in the Milky Way. [T.A.Rector (NRAO/AUI/NSF and NOIRLab/NSF/AURA) and B.A.Wolpa (NOIRLab/NSF/AURA); CC BY 4.0]

Say you have an image of a star-forming region, featuring eye-catching gas clouds, dense and dusty knots, and newborn stars. How would you go about finding other images that resemble yours?

You might start your search with an astronomical image database, using filters for object type or instrument to sift through thousands and thousands of options. But even filtering out everything but star-forming regions might yield vastly different results, given the widely varying shapes, colors, and sizes of these regions.

Or maybe you’ll feed your image into a neural network that has been trained to spot similar images. The results may seem promising, but how can you tell whether the algorithm has found the images that are the most similar? Would another algorithm do better?

The Hubble Image Similarity Project

Astronomical image collections rarely contain information about similarities between images in their metadata, and while neural networks appear to excel at gathering similar images, the results of these models are generally unverified. The Hubble Image Similarity Project, led by Richard White (Space Telescope Science Institute) and Josh Peek (Space Telescope Science Institute and Johns Hopkins University), addressed these issues with a team of citizen scientists who generated similarity information for astronomical images, providing a quantitative means to test the results of neural networks.

example of how the Hubble Image Similarity Project selects image cutouts for study

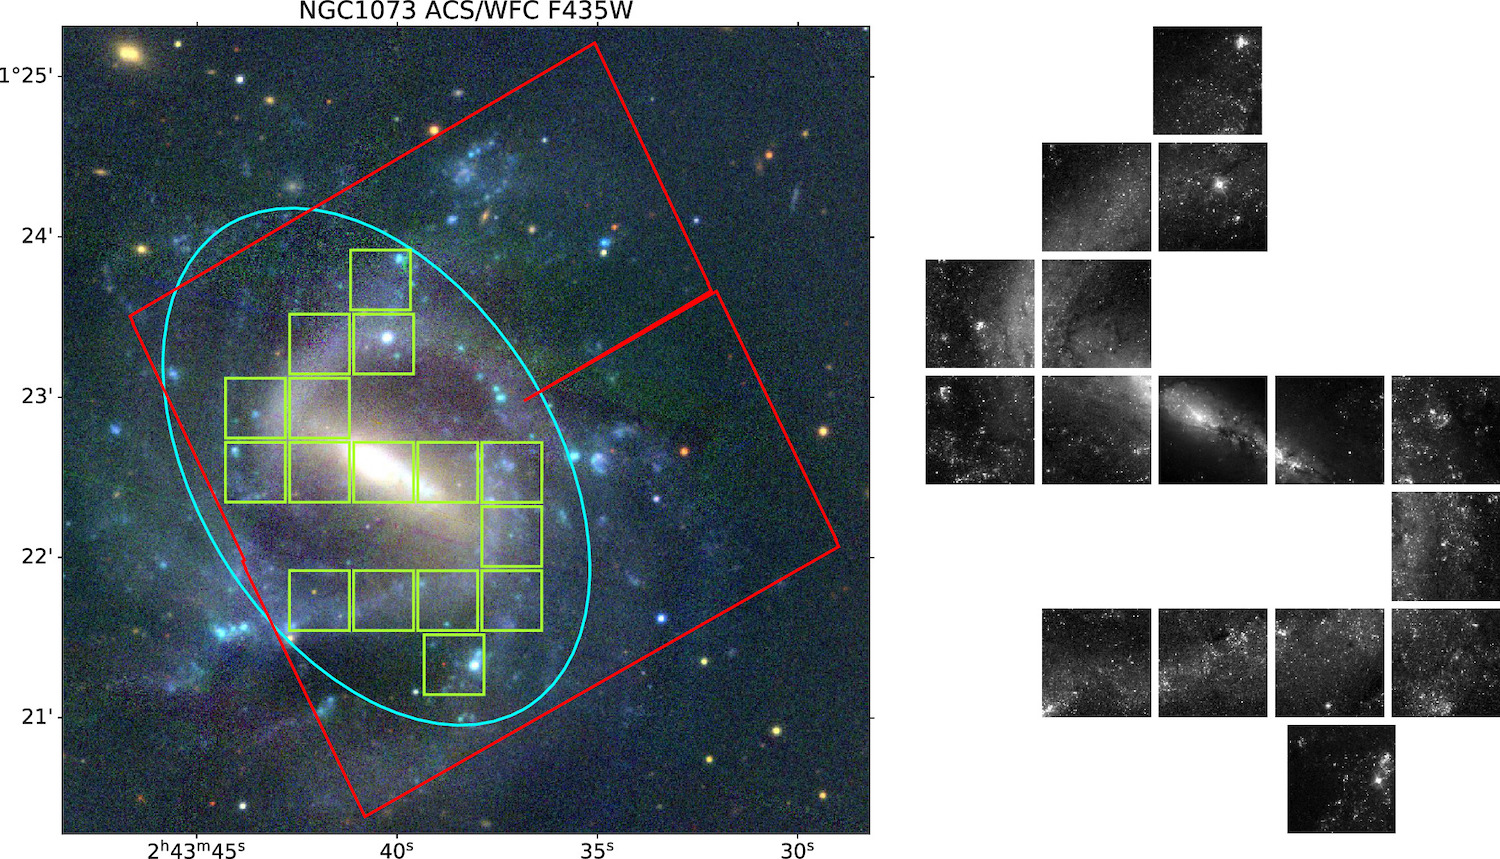
An example of individual test images (green squares) extracted from a Hubble Legacy Archive image (red square). Low-contrast areas have been excluded, leaving the galaxy’s spiral arms for analysis. Click to enlarge. [White & Peek 2025]

White and Peek began by amassing a sample of images from the Hubble Legacy Archive. This sample included many different object types, such as galaxies, planetary nebulae, star-forming regions, and star clusters. After trimming and binning the images, converting them to 8-bit grayscale, filtering out low-contrast images, and eliminating satellite trails, image artifacts, and repeated observations of the same patch of sky, 2,098 images of 666 objects remained.

Citizen Scientists, Assemble

White and Peek recruited 30 members of the community within walking distance of the Space Telescope Science Institute to identify similar astronomical images, and the reviewers were paid for their work. In the three phases of the project, reviewers considered test images one at a time and 1) selected all similar images from a set of 15 comparison images, 2) selected the most similar image from a narrowed-down set of 6 comparison images, and finally 3) selected the most similar image from a set of 3 comparison images.

similar images from the Hubble Image Similarity Project and a visualization of the data

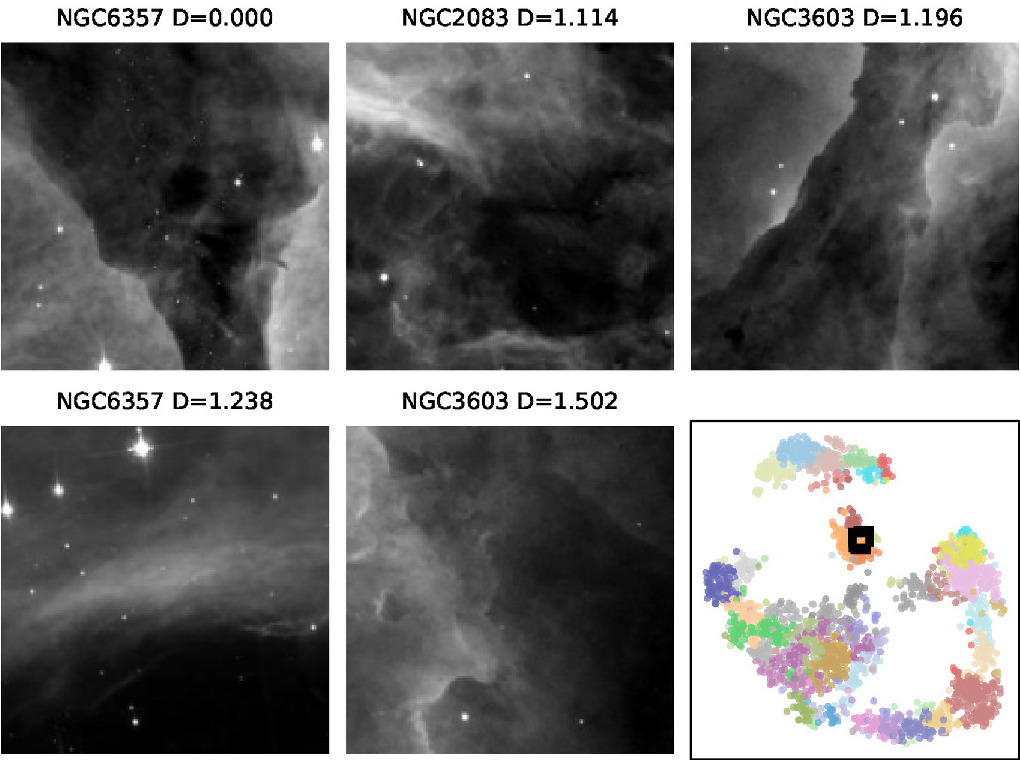
Examples of similar images according to the image similarity matrix. In the lower-right corner is a visualization of the similarity data. The semicircle of data points in the bottom half of this visualization represents galaxies, while star clusters occupy the small arc near the top and nebulae sit in the island in the center of the plot. Click to enlarge. [Adapted from White & Peek 2025]

The citizen science team ultimately compared 5.4 million pairs of images, and White and Peek used these comparisons to produce an image similarity matrix. The matrix describes the metaphorical “distance” between the images, with the most similar images being the smallest distance apart.

Similar images resemble one another in terms of structure, texture, and other factors that White and Peek say are “difficult even to describe in words” — for example, the diffuse glow of a galaxy interrupted by a bright star with diffraction spikes, or a nebula speckled with stars and dense dusty clumps. The similarity data from this study are available online and can be used to test the performance of image-search algorithms. In future work, the authors plan to carry out a similar project using images of the Martian landscape.

Citation

“The Hubble Image Similarity Project,” Richard L. White and J. E. G. Peek 2025 AJ 169 306. doi:10.3847/1538-3881/adcb43

The post Citizen Science Born in the Pandemic: The Hubble Image Similarity Project appeared first on AAS Nova.

NCIS JWST: Analyzing the Aftermath of the Bullet Cluster’s Collision

20 June 2025 at 17:00

multi-wavelength image of the Bullet Cluster

Editor’s Note: Astrobites is a graduate-student-run organization that digests astrophysical literature for undergraduate students. As part of the partnership between the AAS and astrobites, we occasionally repost astrobites content here at AAS Nova. We hope you enjoy this post from astrobites; the original can be viewed at astrobites.org.

Title: A High-Caliber View of the Bullet Cluster Through JWST Strong and Weak Lensing Analyses
Authors: Sangjun Cha et al.
First Author’s Institution: Yonsei University
Status: Published in ApJL

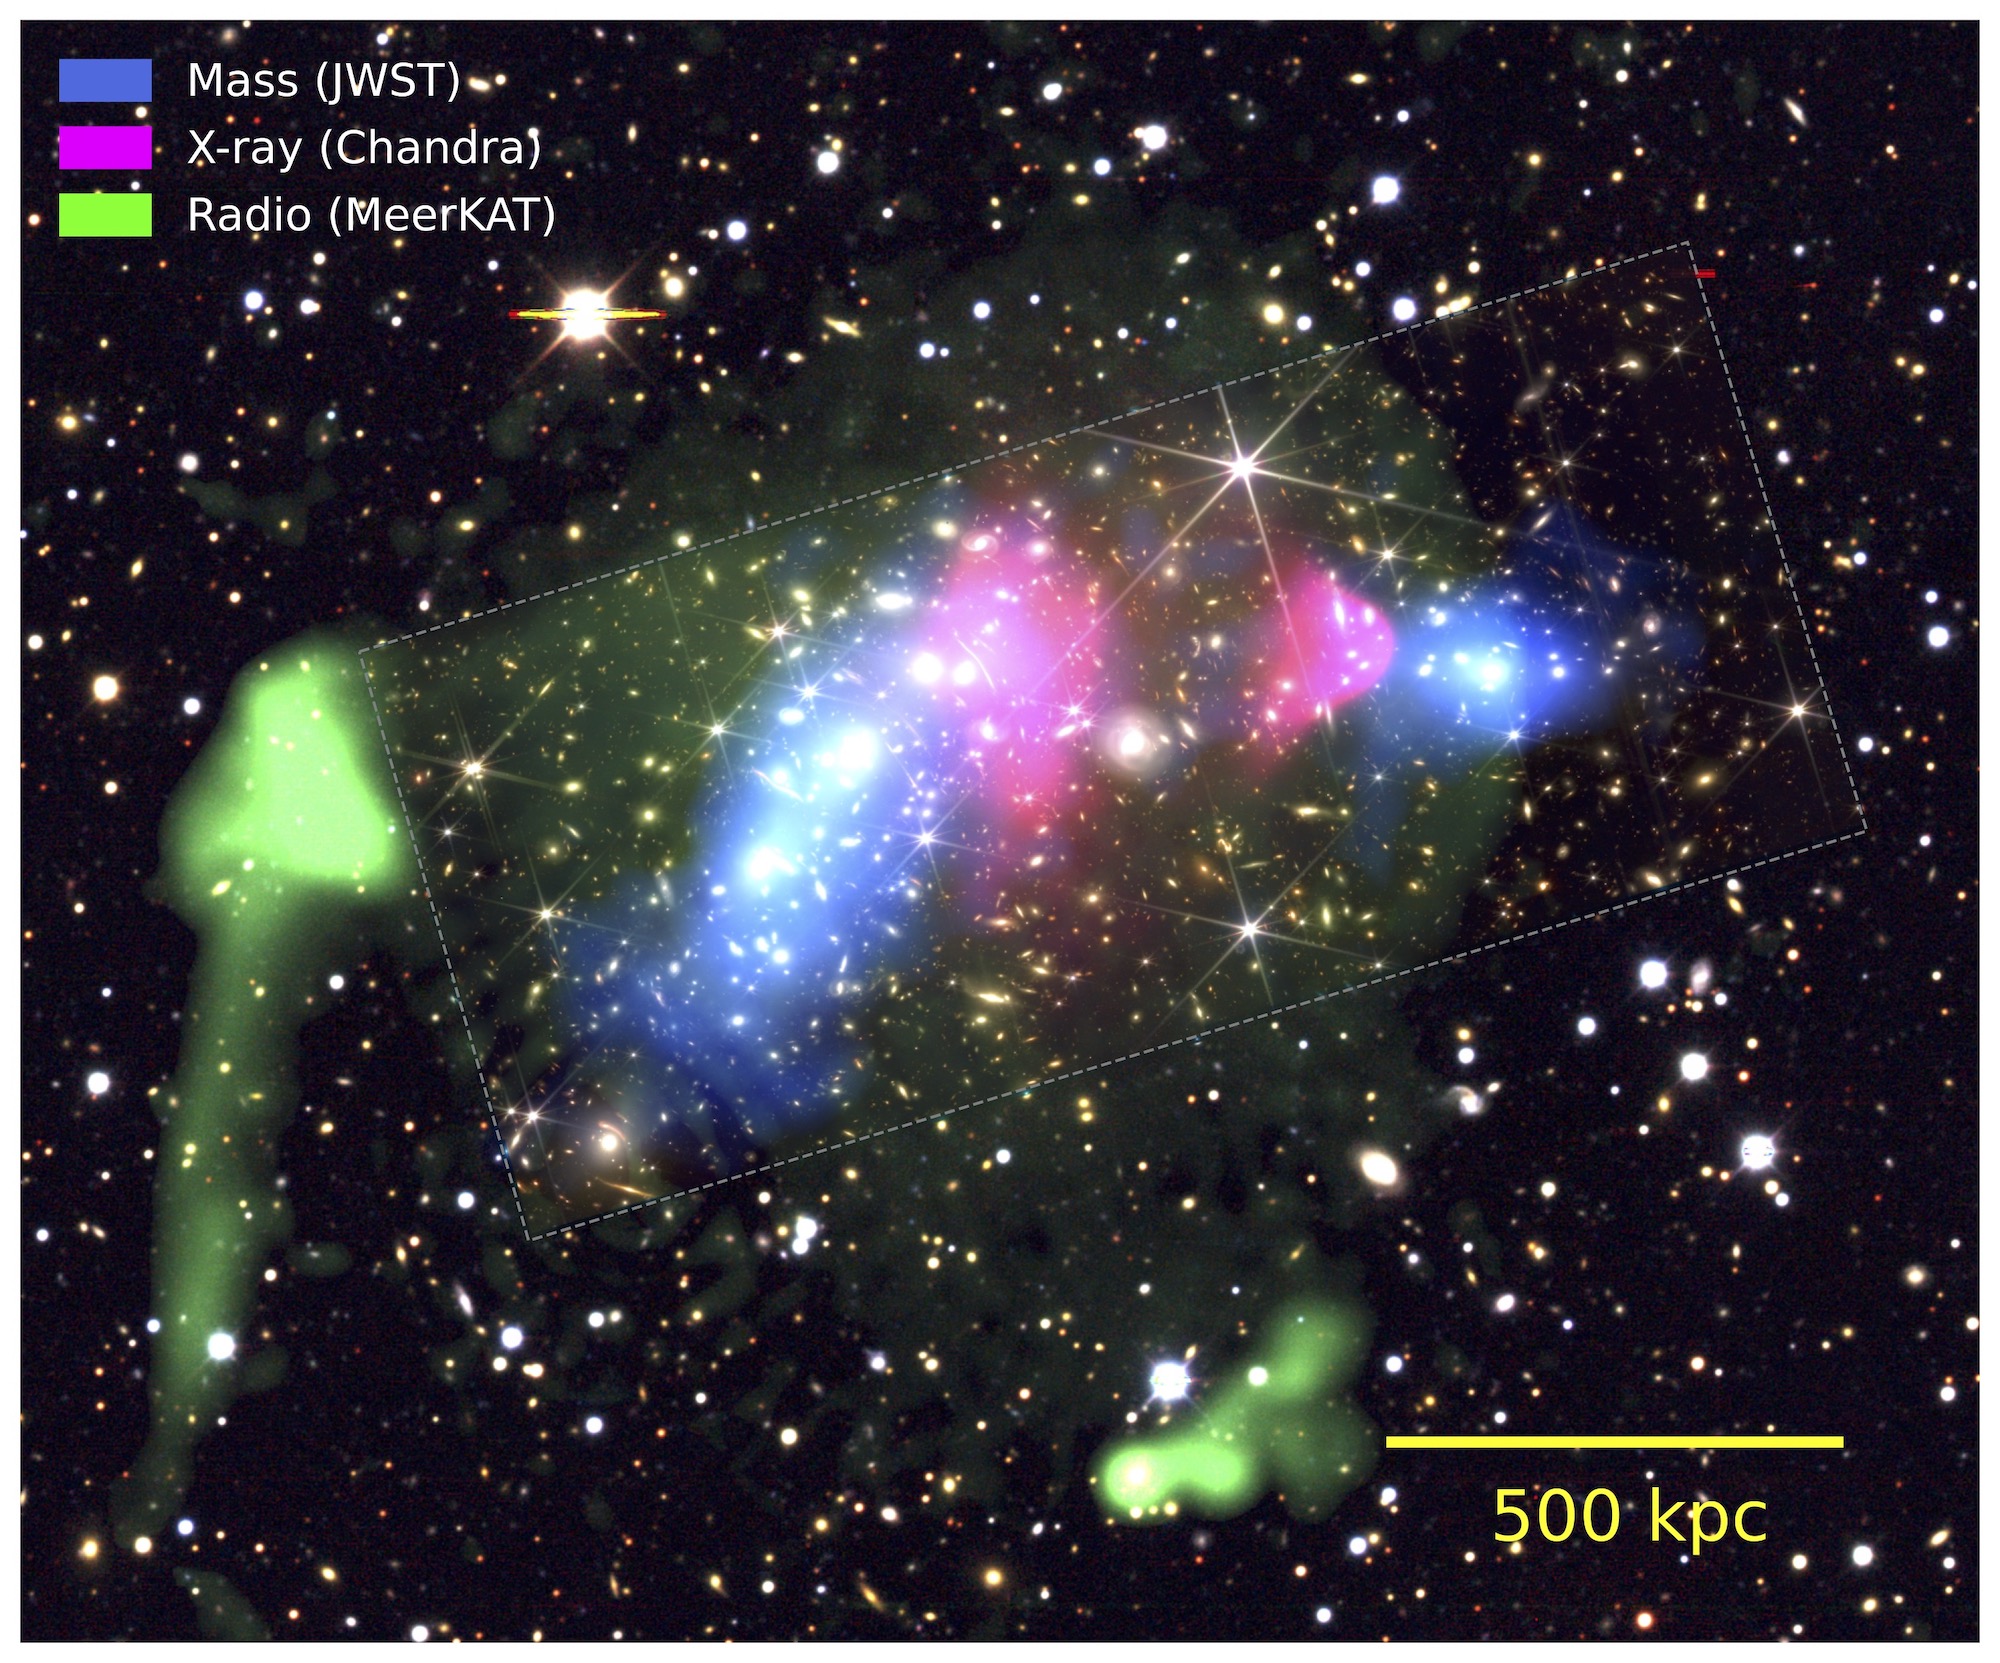
Despite the extreme depth and resolution of JWST observations, there’s still no smoking gun to be found in the hunt for dark matter. Yet, the extremely high-velocity collision in today’s article might aid in the search for what this mysterious material is made of. The target of today’s article is the Bullet Cluster (Figure 1). Despite its name, the Bullet Cluster is not one, but actually two massive clusters of galaxies gravitationally interacting with one another. Due to the high speed with which the smaller “bullet” subcluster collided and passed through the larger one, a strong bow shock caused the gas in the system to compress and heat to millions of degrees. Typically, this alone would make this system interesting to astronomers, but the real kicker here is that this collision was powerful enough to separate the dark matter from the normal, luminous matter. This has made the Bullet Cluster an important testing ground for theories on the nature of dark matter and is exactly what the authors of today’s article attempt to use it for.

multi-wavelength view of the Bullet Cluster

Figure 1: The Bullet Cluster, colour coded based on the strong and weak lensing–based mass reconstruction (blue/JWST), X-ray intensity (pink/Chandra), and radio intensity (green/MeerKAT) using three different telescopes. The dashed rectangle indicates JWST’s smaller field of view compared to Chandra and MeerKAT. [Cha et al., in press]

Mapping Hidden Mass

The authors used JWST imaging of the majority of the Bullet Cluster system to obtain high-resolution, multi-wavelength data. They then identified over 146 areas in the image subject to strong lensing, which is when the light from a background galaxy is bent around mass in the foreground Bullet Cluster system, since that mass distorts spacetime. They also obtained a weak lensing model for the image through statistical analysis, since the effects of weak lensing, while similar, are much more subtle than strong lensing. They then created a mass map for the system by feeding their strong lensing and weak lensing model into a reconstruction algorithm. Essentially, this algorithm creates the most likely distribution of mass, both dark matter and normal matter, that would re-create all the lensing that they observed.

What’s special about the algorithm that they used here is that it does not assume that light traces mass. In general, this assumption is correct, so other algorithms use it to get the most accurate mass estimate. But the authors here wanted to confirm that even in extreme environments like the Bullet Cluster that this is still the case, so they sent their algorithm in “blind.”

Comparing How the Light Traces the Dark

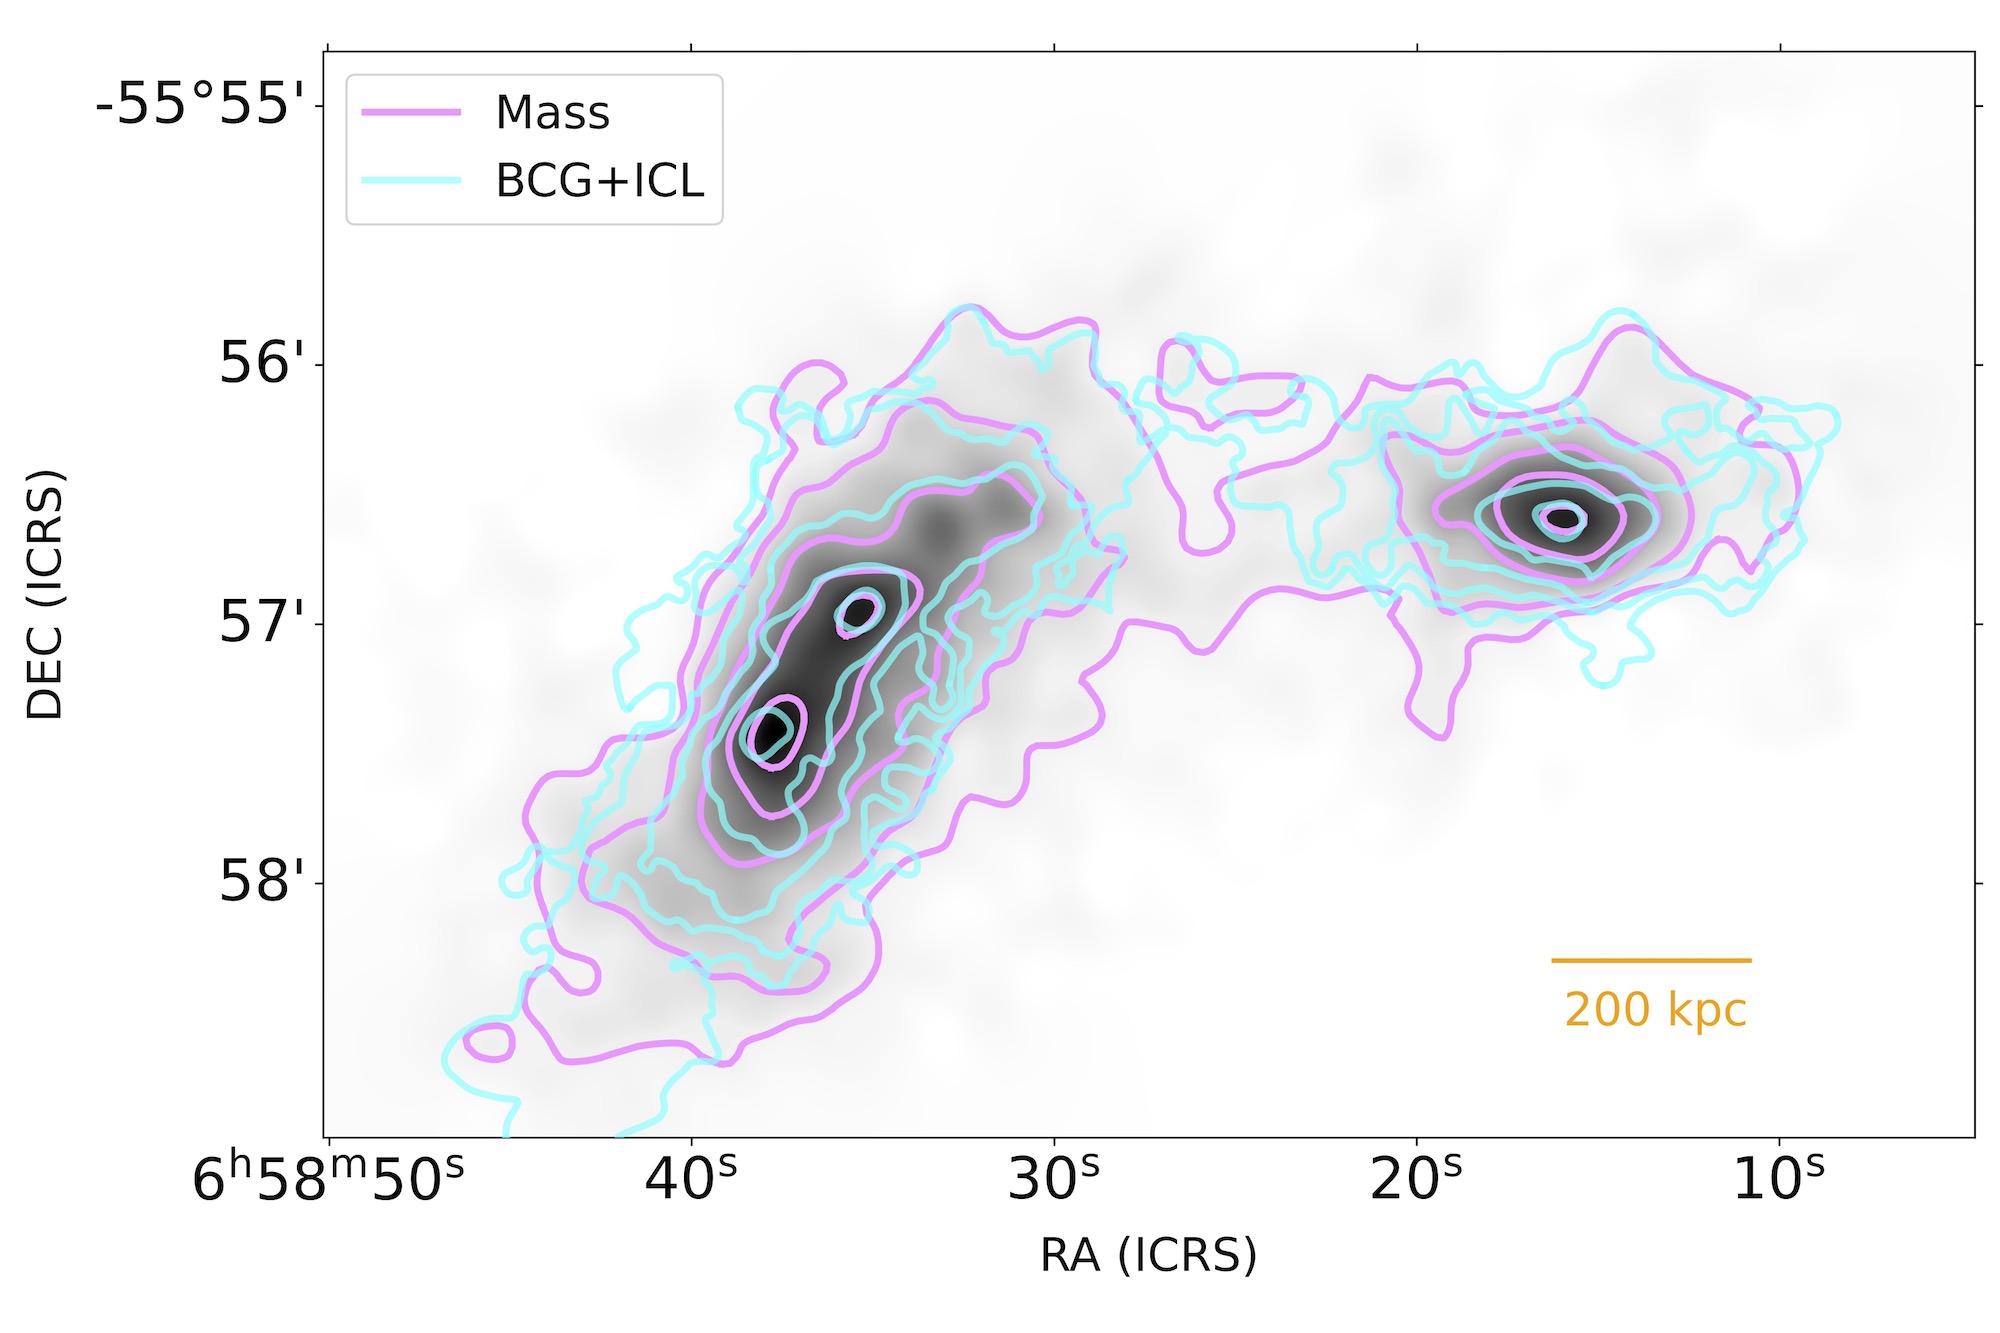
Once they had their mass map, which is dominated mostly by the dark matter in the system, they could compare it to the optical light between the system’s galaxies, referred to as the intracluster light (ICL). They used a statistical test called the modified Hausdorff distance to determine how similar the distribution of ICL and dark matter were to each other. They found that, despite the extreme gravitational interactions going on in the Bullet Cluster, the ICL still does an excellent job overall of tracing the system’s mass (see Figure 2).

comparison of dark matter mass map and distribution of light

Figure 2: Comparison of the dark matter mass map from the strong and weak lensing data (pink) and the distribution of light from the ICL and the most massive galaxy, also known as the brightest cluster galaxy (BCG), combined (blue). Note how the bottom-most centroid’s dark matter and ICL contours are offset from one another. [Cha et al., in press]

Next, they compared their mass map to the distributions of hot plasma, as observed in X-ray wavelengths with Chandra, and of hydrogen gas, as observed in radio wavelengths with MeerKAT (see Figure 1). They found that the dark matter was offset from both of these distributions, which was already known about this system. However, their measurement of these mass offsets indicated that it is unlikely that the Bullet Cluster was formed from a merger between just two galaxy clusters. The authors suggest that the Bullet Cluster’s formation is much more complicated than previously thought, but they aren’t able to give any guesses about the initial conditions.

What a Massive Cluster Tells Us About a Tiny Particle

Finally, the authors were able to use their mass map to put some constraints on one of the theories of dark matter: self-interacting dark matter. If dark matter particles interact with each other, then they have a cross section that can be calculated. Here, the authors calculate it from the offset between the position of the most massive galaxy in the Bullet Cluster and the position of the highest density of dark matter, which is about 60,000 light-years (see Figure 2). They were able to determine that the upper limit of this cross section is 0.5 cm2/g. This is the tightest constraint on self-interacting dark matter’s cross section to date, but we still have that pesky “per gram” in our units since we don’t know the mass of a dark matter particle (but this is being studied!).

This cross section is near the lower limit of what is thought to be a reasonable range for self-interacting dark matter theories (about 0.5–2 cm2/g), but it certainly doesn’t rule anything out. For further context, when dividing by mass, the cross section of a hydrogen atom is about 1.7×107 cm2/g, which is much bigger, but we would expect that when comparing an atom to a potential subatomic dark matter particle.

Altogether, the authors of this article were able to use both the precision of JWST and the impartiality of their mass-reconstruction algorithm to learn new things about both the structure of the Bullet Cluster and the nature of dark matter. Although there are still some open questions that will need to be answered, this study certainly is not just a shot in the dark!

Original astrobite edited by Maggie Verrico.

About the author, Veronika Dornan:

Veronika is a final-year PhD candidate at McMaster University. Her research is in observations of extragalactic globular star clusters and what they can tell us about galaxy evolution and dark matter distribution in the universe.

The post NCIS JWST: Analyzing the Aftermath of the Bullet Cluster’s Collision appeared first on AAS Nova.

Monthly Roundup: A Deep View of Planet-Forming Disks with ALMA

28 May 2025 at 17:00

radio images of eight protoplanetary disks

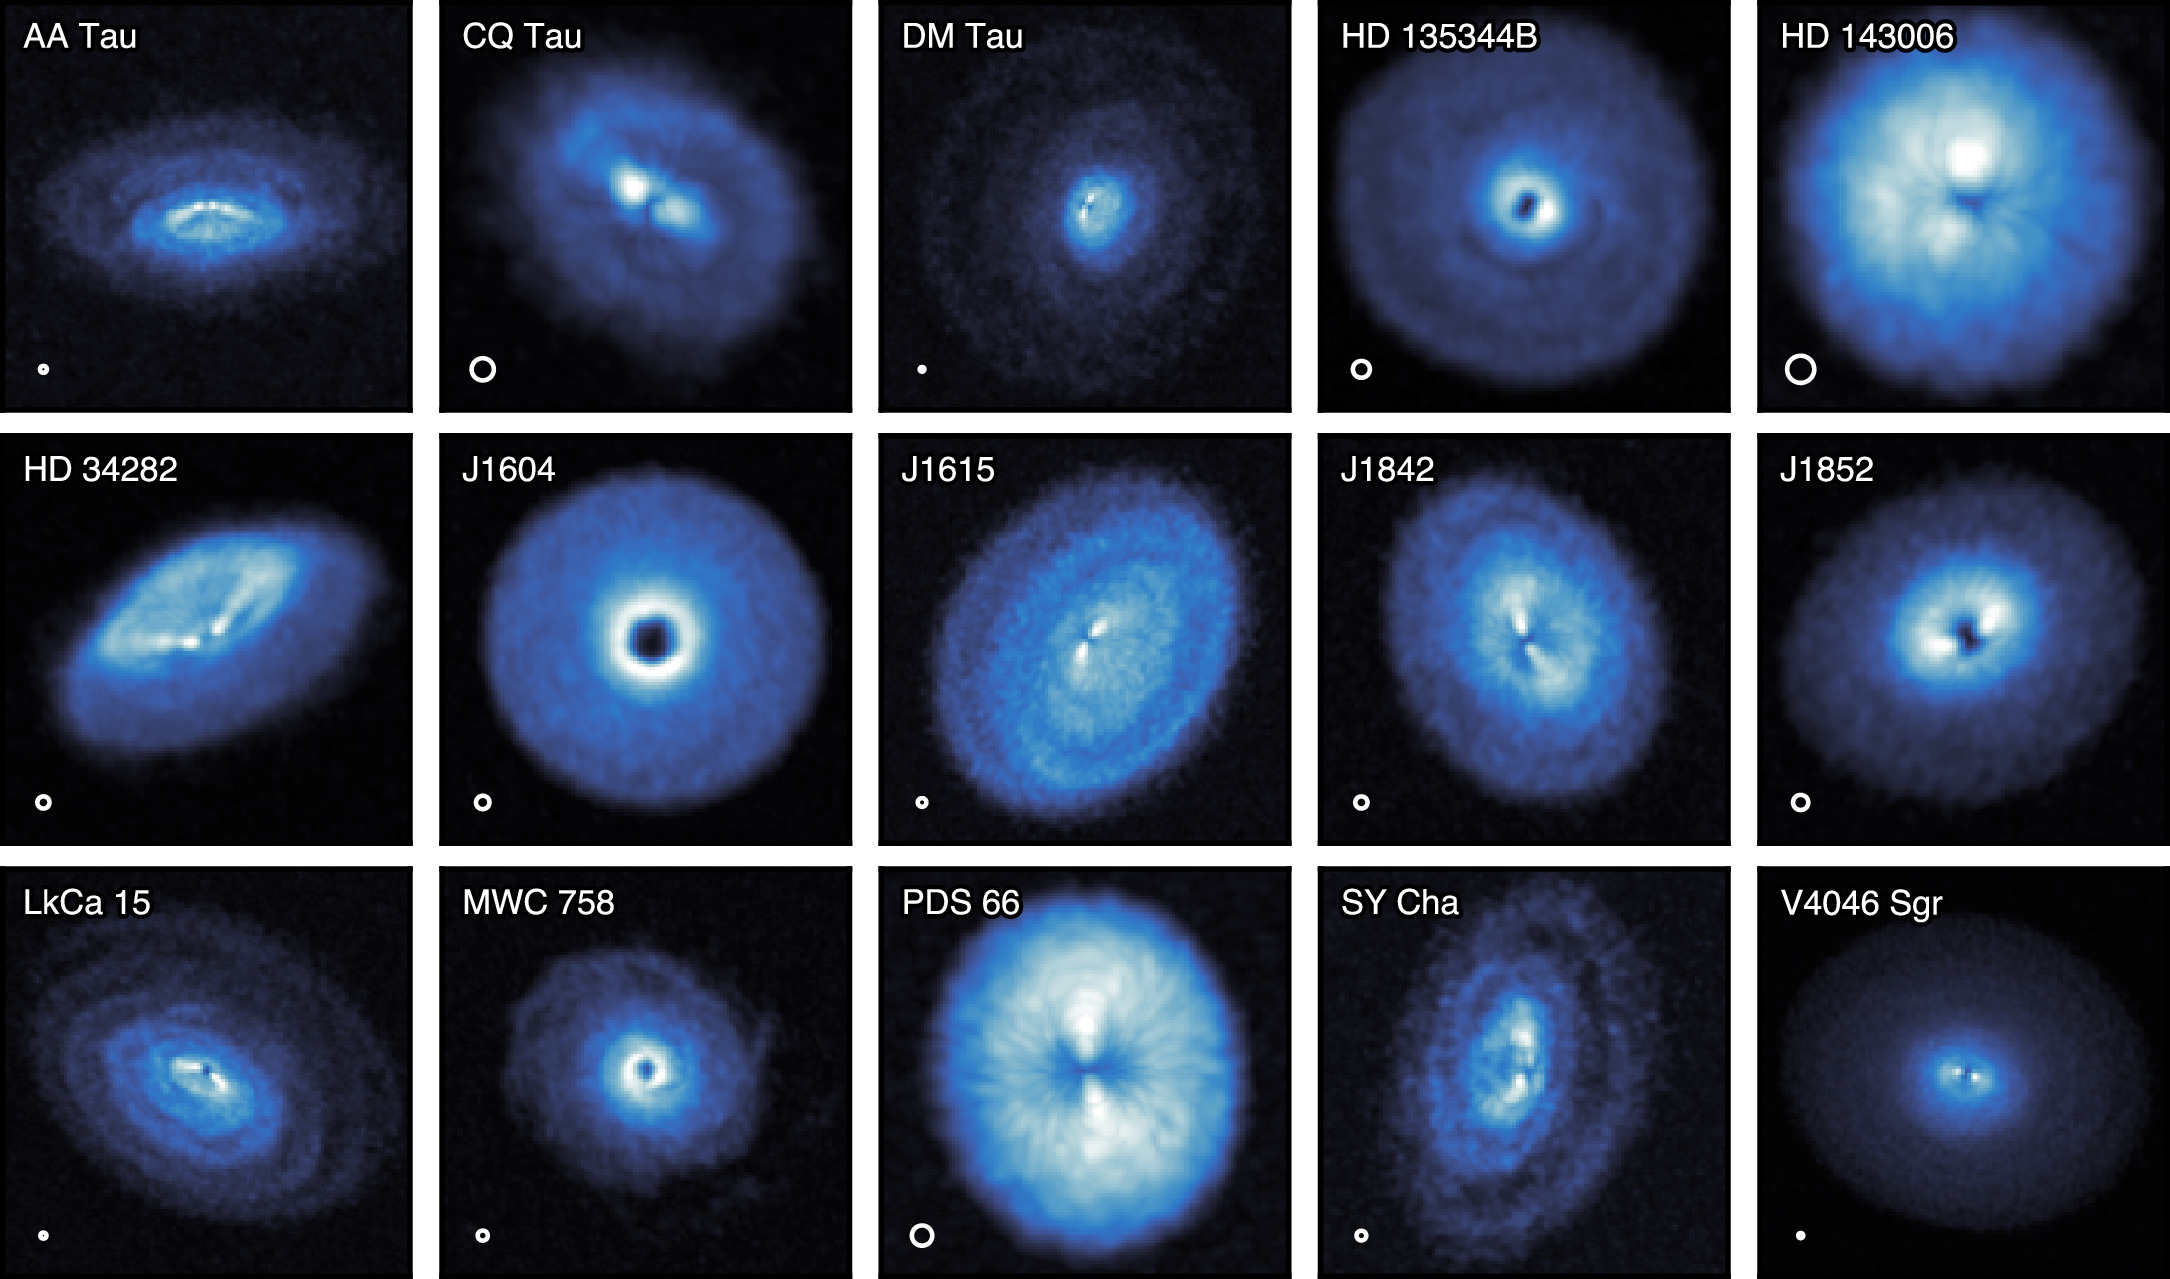
Protoplanetary disks, the sites of planet formation around young stars, are rich and complex objects. An in-depth investigation of 15 protoplanetary disks has recently been published in a Focus Issue of the Astrophysical Journal Letters. This investigation leveraged the exquisite resolution and sensitivity of the Atacama Large Millimeter/submillimeter Array (ALMA), a moveable network of 66 radio dishes in the Atacama Desert in Chile.

Featuring high-resolution observations of multiple gas species, updated image processing techniques, and state-of-the-art modeling, the exoALMA project examines the early stages of planet formation, when protoplanets embedded within dusty disks induce rings, gaps, spirals, and other structures.

This Monthly Roundup consists of quick snippets describing each of the currently published research articles in the exoALMA Focus Issue of the Astrophysical Journal Letters. Each snippet links to the corresponding research article, and the Focus Issue landing page is linked at the bottom of this post.

Introducing exoALMA

exoALMA disks

The full exoALMA sample. All 15 disks show evidence of substructure in their gas emission. [Teague et al. 2025]

First up, exoALMA project PI Richard Teague (Massachusetts Institute of Technology) and collaborators introduced the survey, the disk sample, and the science goals. The team mapped the dust and gas distributions of 15 protoplanetary disks that were selected for their brightness, large size, lack of obscuration, and low inclination angles. The three key science goals were to 1) detect protoplanets hidden within the disks, 2) study the disks’ dynamical structures, especially as these structures relate to instabilities that can perturb the disks and determine their lifetimes, and 3) determine the disks’ density and temperature structure.

Interpreting interferometric data from ALMA requires special care, as Ryan Loomis (National Radio Astronomy Observatory) and coauthors show in their overview of the data calibration and imaging pipeline. The team described their methods of processing the data, including a recently developed alignment method that greatly reduces the number of artifacts that could be mistaken for planet-induced velocity perturbations.

plot of emitting surface of J1615

Emitting height from images processed using the standard method (CLEAN) and using regularized maximum likelihood (RML). [Adapted from Zawadzki et al. 2025]

Although extreme care was taken not to introduce spurious signals through the calibration process, it’s critical to perform additional tests to confirm that detected signals are real, rather than artifacts. To that end, Brianna Zawadzki (Wesleyan University) and coauthors presented exoALMA images processed with a procedure called regularized maximum likelihood. The regularized maximum likelihood–processed images showed the same non-Keplerian features as the images processed with the standard algorithm, suggesting that these features are real.

Analysis Methods and Toolkit Testing

Analyzing observations of protoplanetary disks is challenging, motivating Thomas Hilder (Monash University) and collaborators to take the first step toward addressing issues like beam smearing, the creation of probabilistic data products, and incorporating a realistic noise model. Using their newly developed methods, the team analyzed several disks in the exoALMA sample, finding velocity substructures at greater velocities than existing methods.

Vertical structure and Keplerian rotation of the exoALMA sample

Vertical structure and Keplerian rotation of the exoALMA sample as inferred from modeling. Click to enlarge. [Izquierdo et al. 2025]

Andrés Izquierdo (University of Florida; Leiden University; European Southern Observatory) and collaborators described their methodology for investigating gas structure in the exoALMA sample. The team’s fitting method allowed them to separate the contribution of a disk’s front and back sides from the rest of its emission, leading to estimates of the orientation and vertical profile of each disk.

Jaehan Bae (University of Florida) and collaborators drew attention to the tools astronomers use to interpret observations of protoplanetary disks — namely, forward models. Bae’s team used five different hydrodynamics models to simulate a protoplanetary disk harboring an embedded giant planet. Then, they used two radiative transfer models to simulate carbon monoxide channel maps and calculate the temperature of the disk. Finally, they extracted the location of the synthetic planet. This investigation ultimately showed good agreements between the model outputs, showing that any combination of the models tested in this work is suitable.

plots of nonaxisymmetry of the exoALMA sample

Residual signal-to-noise ratio for the exoALMA sample, ordered from least to most nonaxisymmetric. Rings and gaps are marked with solid and dashed ellipses, respectively. Click to enlarge. [Curone et al. 2025]

Seeking Structure

A team headed by Pietro Curone (University of Milan; University of Chile) examined the rich ALMA dataset for signs of structure within the disks. The team modeled each disk with an axisymmetric model, then subtracted off the best-fitting model to reveal substructures and asymmetries in the disks. Several features were revealed, including shadows, offsets between inner and outer disks, spiral structures, and crescent-shaped asymmetries. Though one disk, PDS 66, was apparently without any internal structure, this investigation showed that structures are common in this sample of large, bright disks. Further work is needed, however, to explore whether these features are common in the disk population as a whole.

Maria Galloway-Sprietsma (University of Florida) and collaborators identified the disk surfaces that emit particular spectral lines. The team found that 12CO traced the upper atmosphere of the disks, while 13CO — an isotopologue of the more common molecule 12CO — and CS (carbon monosulfide) probed deeper regions. In addition, nearly all of the disks showed evidence of localized substructure, highlighting the need for theoretical work to explain the wide variety of disk structures and behaviors.

Evidence for Planets

exoALMA images of disks with velocity kinks due to the presence of a planet

From top to bottom: velocity kinks associated with an embedded planet; 12CO observations with the identified velocity kinks; filtered ALMA observations, showing the location of the planetary wake; exoALMA continuum emission; and polarimetric images. The blue circles show the locations of the purported planets. Click to enlarge. [Pinte et al. 2025]

Christophe Pinte (University Grenoble Alpes; Monash University) and collaborators analyzed substructures revealed by 12CO emission. These images revealed arcs, spiral arms, and kinks in 13 out of the 15 disks in the sample. Of these, six were consistent with wakes forming due to planets with masses between 1 and 5 Jupiter masses orbiting at 80–310 au.

Charles Gardner (Rice University; Los Alamos National Laboratory) and coauthors focused on LkCa 15, a disk that appears markedly different in dust and gas emission. The disk’s dust continuum emission shows a 40-au-wide region depleted of dust, while the gas emission, traced by CO, shows no depletion of gas in the same region. Though previous infrared observations have suggested that this dust-depleted region could host massive planets, Gardner’s team concluded that a chain of small planets or processes unrelated to planet formation likely excavated the region instead.

A team led by Jochen Stadler (Côte d’Azur University) searched for deviations from Keplerian rotational velocity — potential evidence for embedded protoplanets. The team discovered deviations up to 15% from the background velocity, with deviations appearing at both large and small radial scales. Rings and gaps visible in the dust emission tended to align with gas pressure maxima and minima, respectively. However, the team also found gas pressure structures in the outer disk that were beyond the dust emission and were not accompanied by rings or gaps.

Comparison of kinematic and emission-line-derived masses for the exoALMA sample

Comparison of kinematic and emission-line-derived masses. Click to enlarge. [Trapman et al. 2025]

Masses and Abundances

A team led by Cristiano Longarini (University of Cambridge; University of Milan) put the disks of the exoALMA sample on the scale. By modeling the rotation curves of 12CO and 13CO, the team constrained the masses of 10 disks and their central stars. Leon Trapman (University of Wisconsin-Madison) and collaborators also considered the problem of disk masses. The team used CO and N2H+ emission to measure the gas masses of 11 disks in the exoALMA sample and compared the results to previous kinematic measurements. The two sets of measurements tend to agree within a factor of three.

Giovanni Rosotti (University of Milan) and collaborators introduced a new model that connects the emitting height of CO molecules to the gas surface density and temperature. Unlike existing models, the team’s new model can be applied to optically thick observations. Comparing the results of this new method with dynamical estimates relying on interstellar medium abundances of CO yields lower gas masses, suggesting that the CO abundance in the protoplanetary disks studied is depleted relative to the interstellar medium.

Turbulence, Traps, and Vortices

Protoplanetary disks are expected to experience turbulence, large-scale gas motions, and instabilities. Marcelo Barraza-Alfaro (Massachusetts Institute of Technology) and collaborators investigated whether a program like exoALMA could detect signs of these processes at work. The team used 3D numerical simulations to explore the observational signatures of the vertical shear instability, the magnetorotational instability, and the gravitational instability. They found that rings, arcs, and spirals can arise from instabilities. While spirals present in the disks in the exoALMA sample could feasibly be due to the magnetorotational instability or the gravitational instability, ring-like and arc-like features due to the vertical shear instability were not detected.

Tomohiro Yoshida (National Astronomical Observatory of Japan; The Graduate University for Advanced Studies) and collaborators reported on their detection of pressure-broadened emission-line wings in RX J1604.3−2130 A. This detection allowed the team to constrain the disk’s gas surface density — a critical property related to the mass available to form planets. They also clearly showed a dust ring coinciding with a gas pressure maximum, proving that gas pressure maxima can create dust traps. The gas-to-dust surface density ratio at the location of this dust trap suggests that the disk has already birthed protoplanets or the dust trapping efficiency is low.

dust crescents in four protoplanetary disks

Locations of crescent-shaped dust clumps in the four disks from this study. Click to enlarge. [Adapted from Wölfer et al. 2025]

Vortices are theorized to shepherd dust grains into crescent-shaped traps, providing an environment for dust grains to clump together and grow into planetesimals and eventually planets. Lisa Wölfer (Massachusetts Institute of Technology) and collaborators searched for kinematic signatures of dust-trapping vortices in CO line emission from four disks that exhibit crescent-shaped concentrations of dust. None of the four disks exhibited the clear signature of a vortex, and higher-resolution data or observations of emission lines that trace motions closer to the midplane of the disk may be necessary to probe this signal further.

The full list of articles in this Focus Issue can be found here.

Citation

“exoALMA. I. Science Goals, Project Design, and Data Products,” Richard Teague et al 2025 ApJL 984 L6. doi:10.3847/2041-8213/adc43b

The post Monthly Roundup: A Deep View of Planet-Forming Disks with ALMA appeared first on AAS Nova.

Scientists Discover Key Alzheimer’s “Tipping Point” That May Decide Who Gets Dementia

Amyloid Plaques Neurons Alzheimer's DementiaA new study suggests that subtle changes in the brain’s immune cells could help explain why some people remain mentally sharp despite Alzheimer’s pathology. For decades, Alzheimer’s research has focused on the buildup of amyloid plaques and tau tangles, the two hallmark features of the disease. Yet a puzzling reality has continued to challenge scientists: [...]

Audi Nuvolari é o supercarro híbrido de 1.001 cv que marca o regresso da marca à sua melhor forma

6 June 2026 at 16:45

Apresentado na Côte d’Azur à sombra do Grande Prémio do Mónaco de Fórmula 1, o Nuvolari é o automóvel mais rápido e mais potente alguma vez produzido pela Audi. Limitado a 499 unidades e com entrega prevista para 2027, é também uma declaração sobre o futuro da marca.

The post Audi Nuvolari é o supercarro híbrido de 1.001 cv que marca o regresso da marca à sua melhor forma appeared first on Tek Notícias.

Fighting Fire With Fire

5 June 2026 at 05:01
Several gray smoke plumes are visible drifting over a green landscape.
Smoke streams from fires in Australia’s Northern Territory in an image captured by the MODIS (Moderate Resolution Imaging Spectroradiometer) on NASA’s Aqua satellite on May 28, 2026.
NASA Earth Observatory/Michala Garrison

In May and June of most years, NASA satellites typically begin to detect large numbers of wildland fires throughout the Top End and Arnhem Land regions of Australia’s Northern Territory. On some days, especially in the afternoon, the blazes can resemble sizable wildfires in satellite imagery, spreading widely and producing expansive smoke plumes.

That was the case when NASA’s Aqua satellite acquired this image of smoke and fires on the afternoon of May 28, 2026. Often, however, fires burning in this area look smaller and less imposing. In the mornings just a few days earlier and later, for instance, NASA satellites detected little smoke despite observing many thermal anomalies, or hotspots, that indicated fire activity.

The pattern of burning, location, and timing are consistent with prescribed fires lit intentionally to manage the landscape. Land managers tend to light fires in the morning, and smoke builds over the course of the day. The process sometimes creates sizable plumes when there are updrafts and winds of moderate strength that carry smoke away from the fires, as happened on May 28 and again on June 2. The fires typically burn through the fire-adapted grasses, underbrush, and scattered trees in the region’s tropical savanna ecosystems.

Over the past few decades, the region’s land managers have combined deep-rooted Indigenous land management practices and modern technologies to establish large-scale landscape management programs such as the West Arnhem Land Fire Abatement project and Arnhem Land Fire Abatement. The goal of such efforts is to intentionally burn some of the savanna underbrush to create firebreaks and reduce fuel loads early in the dry season, reducing more destructive and emissions-intensive fires later in the season. The dry season generally begins in May and extends through September, according to Australia’s Bureau of Meteorology.

While research is ongoing, there are signs that the prescribed burning efforts are having the intended effect. Analysis of satellite observations of the fires suggests that prescribed burning efforts have shifted fire activity from late to early in the dry season, leading to a reduction in high-intensity fires and emissions.

NASA Earth Observatory image by Michala Garrison, using MODIS data from NASA EOSDIS LANCE and GIBS/Worldview. Story by Adam Voiland.

Downloads

Several gray smoke plumes are visible drifting over a green landscape.

May 28, 2026

JPEG (1.82 MB)

References & Resources

You may also be interested in:

Stay up-to-date with the latest content from NASA as we explore the universe and discover more about our home planet.

Fires Tear Through Nebraska Grasslands

3 min read

Dry, warm, and windy conditions across the U.S. Great Plains led to extreme fire activity in March 2026.

Article

Fires Rage in Georgia

3 min read

Firefighters are battling two destructive blazes in the southern part of the state as drought grips the U.S. Southeast.

Article

Fire’s Footprint on Santa Rosa Island

3 min read

A wildland fire charred grassland, coastal sage scrub, and chaparral across one-third of the island, the second largest of the…

Article

Interstellar Comet 3I/ATLAS Reveals Strange Chemistry Beyond Our Solar System

By: NASA
6 June 2026 at 13:33
Interstellar Comet 3I ATLASAn interstellar comet just revealed hidden methane and chemical clues from another star system. NASA’s James Webb Space Telescope has achieved another milestone by capturing the first mid-infrared chemical fingerprint of an interstellar object. The observations focused on comet 3I/ATLAS, a rare visitor from beyond our solar system, and the findings have been published in [...]

Serviços secretos russos alegam ter desmantelado esquema de espionagem que transformava smartphones em dispositivos de vigilância

6 June 2026 at 12:51

O FSB afirma ter descoberto um esquema sofisticado de ciberespionagem que terá utilizado spyware para recolher dados, monitorizar conversas e espiar o ambiente em redor dos dispositivos móveis de altos responsáveis do Estado, com a captura de áudio e vídeo. No entanto, não apresenta provas de tal alegação.

The post Serviços secretos russos alegam ter desmantelado esquema de espionagem que transformava smartphones em dispositivos de vigilância appeared first on Tek Notícias.

All the new EVs you can buy with 0% financing in June 2026

6 June 2026 at 12:30

Lease deals get all the hype, but a lot of people would still rather buy their vehicles. If that sounds like you, you’re in luck, because there’s a whole bunch of great EVs you can buy with 0% financing this month – including the best-selling Tesla Model Y!

❌