Un trou noir supermassif a été surpris en pleine action… loin de chez lui. Pour la première fois, des astronomes ont observé un de ces monstres « orphelins » dévorer une étoile en périphérie d’une galaxie. Une découverte inédite qui ouvre la voie à une chasse aux trous noirs errants dans tout...
Teams at Katalyst Space are making progress slowing the spin of their LINK spacecraft, which is designed to boost the orbit of NASA’s Neil Gehrels Swift Observatory. A series of thruster burns this week reduced the rate of spin from approximately 9 degrees per second to less than 4 degrees per second. Katalyst is continuing with this approach to restabilize the spacecraft in the coming days.
Teams also further evaluated LINK’s functionality and determined there are still potential paths forward for a boost. NASA is working closely with Katalyst to consider revised, innovative approaches. The agency will continue to provide updates about stabilization of LINK and next steps for the mission. LINK is now expected to approach Swift around the end of August.
Learn more from Katalyst, and monitor NASA’s Swift blog for continued updates:
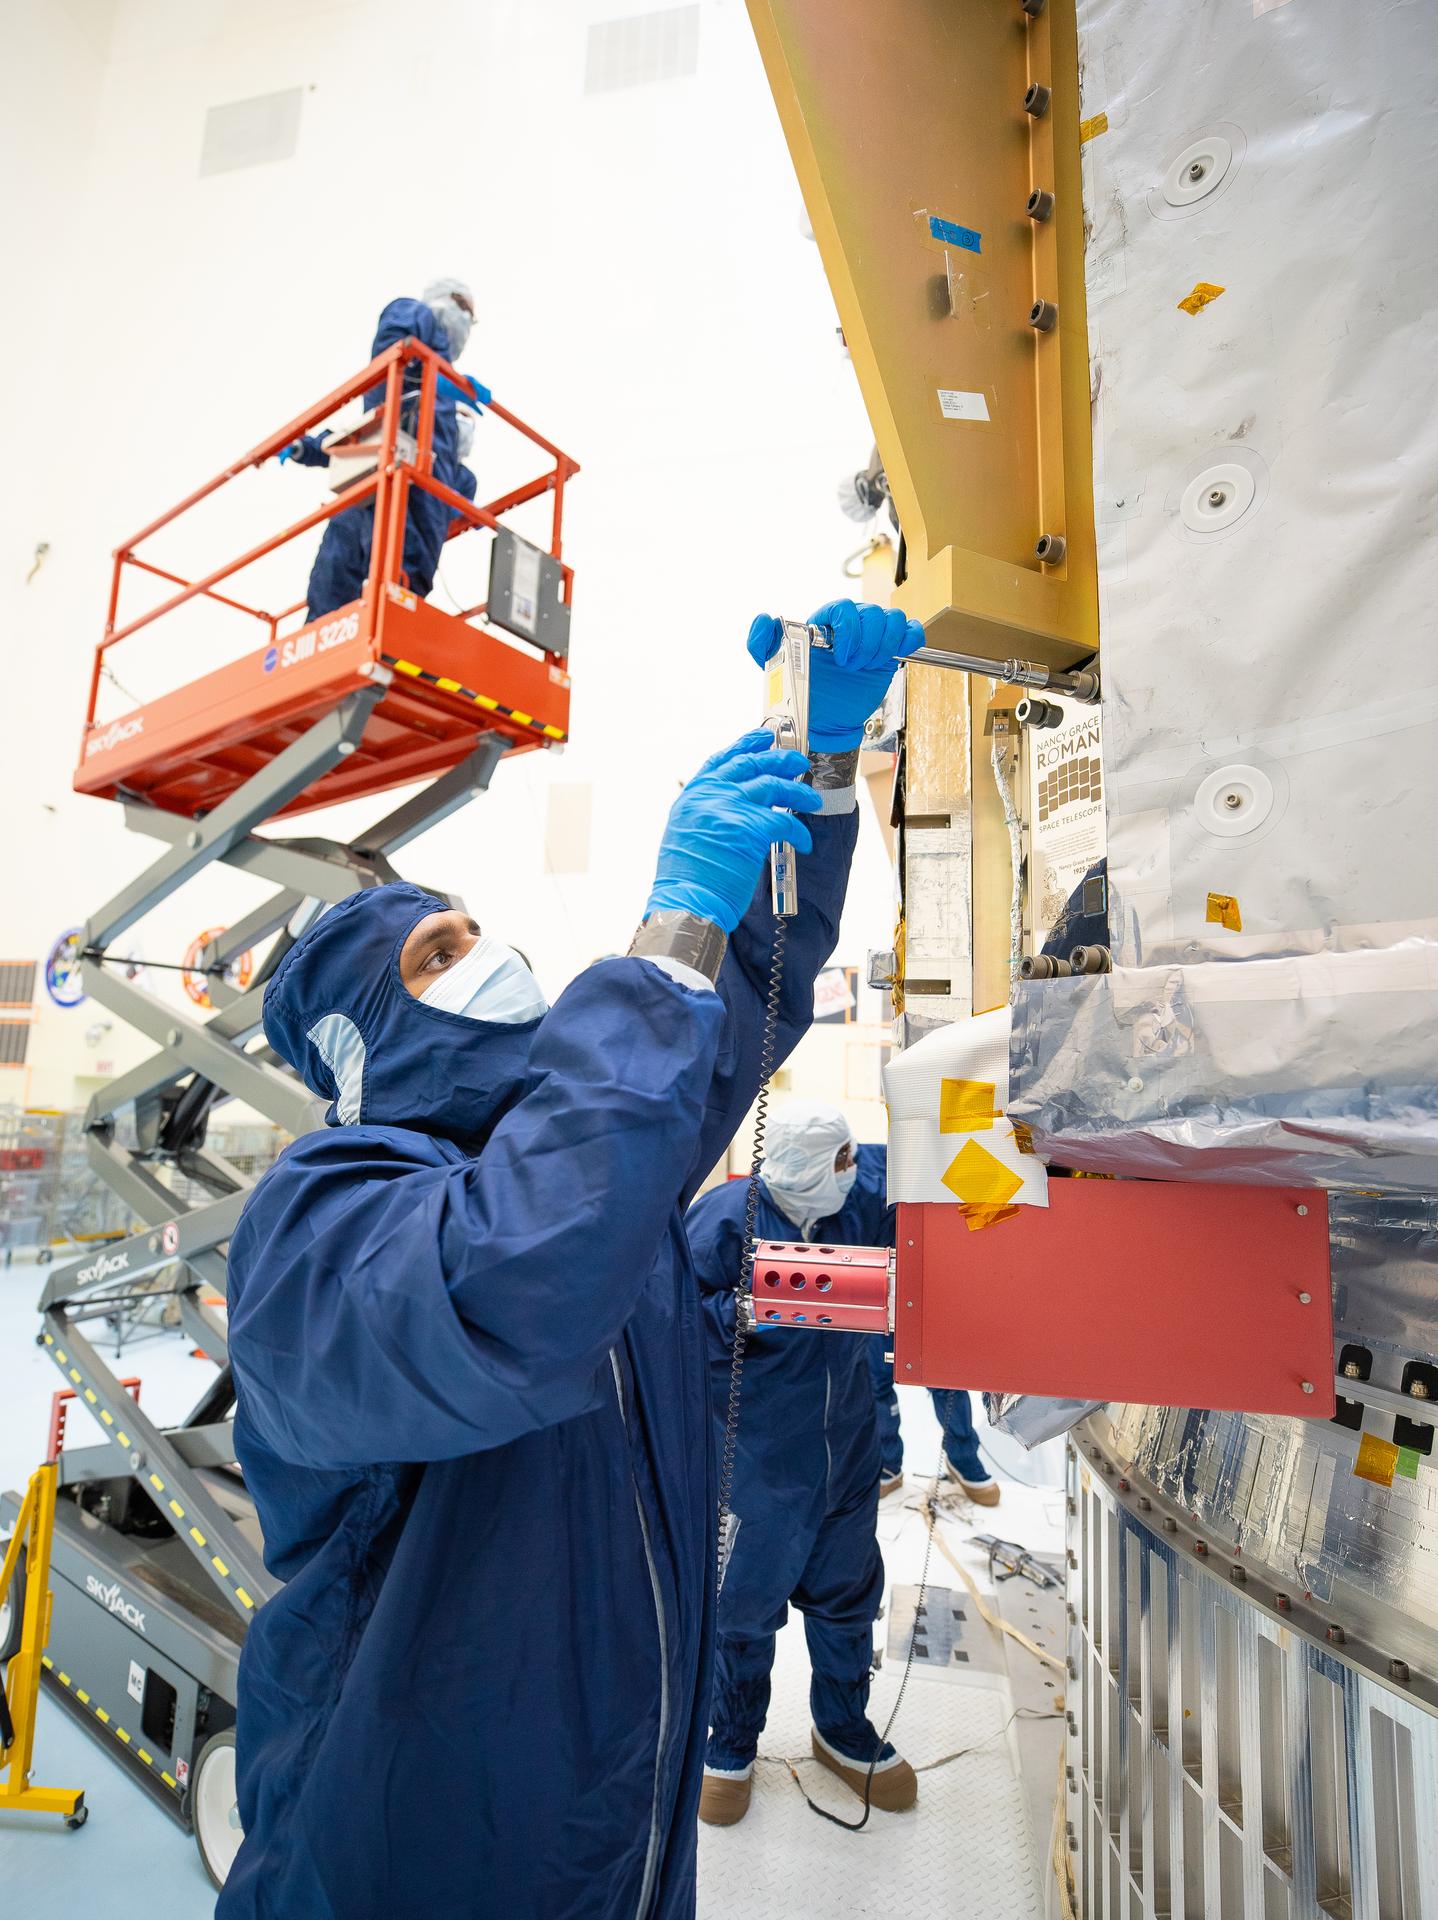
On July 27, technicians at NASA’s Kennedy Space Center in Florida installed a memory card containing 1,350,144 names as part of a commemorative plaque on the Nancy Grace Roman Space Telescope. The names were submitted by people globally, including astronauts from Artemis II and Artemis III. The memory card will travel with the Roman observatory to the Sun-Earth Lagrange point 2, or L2, about one million miles from Earth, where the Sun’s and Earth’s gravity balance out.
Roman is named after Dr. Nancy Grace Roman, NASA’s first chief astronomer and one of the architects of the agency’s modern science program. Roman championed space-based observatories that could study the universe from above Earth’s hazy atmosphere while making their data broadly available to the scientific community.
NASA and SpaceX are targeting launch for no earlier than 7:26 a.m. EDT Sunday, Aug. 30 aboard a SpaceX Falcon Heavy from Launch Complex 39A at Kennedy.
This map, based on data from the OCI (Ocean Color Instrument) on NASA’s PACE (Plankton, Aerosol, Cloud, ocean Ecosystem) satellite, shows Sargassum highly concentrated in the tropical Atlantic in June 2026.
NASA Earth Observatory/Lauren Dauphin
Sargassum, a type of brown floating algae, has shifted its range in recent decades, thinning out in the North Atlantic’s Sargasso Sea while proliferating in the tropical Atlantic. That trend, underway since 2011, continued in 2026 as the algae, commonly known as a type of seaweed, reached its annual peak in June across a stretch of ocean known as the Great Atlantic Sargassum Belt.
The belt’s Sargassum abundance in June 2026 made it the second-highest Sargassum year in the satellite record, slightly behind 2025, according to scientists at the University of South Florida (USF) College of Marine Science. Regionally, the Caribbean Sea and the Gulf of America (Gulf of Mexico) both hit record highs, according to USF’s June 2026Sargassum outlook. The western and eastern Caribbean saw 3.6 and 9 million metric tons, respectively, while the Gulf saw 5 million metric tons—nearly double its previous record, also set in 2025.
“The belt is a basin-scale phenomenon that can have devastating local-scale impacts throughout the Caribbean and Gulf, and satellite observations are the only method that captures both scales on a daily basis,” said Brian Barnes, a marine scientist at the Optical Oceanography Laboratory at USF. “The tracking done by our lab helps communities know the current extent of Sargassum and prepare for what’s to come.”
In moderate amounts in the open ocean, Sargassum provides habitat for turtles, invertebrates, fish, and birds, and adds oxygen to the water through photosynthesis. But too much of it near shore can tangle and suffocate marine life, and mats that sink can smother corals and seagrasses. On beaches, decomposing Sargassum releases hydrogen sulfide, a rotten-egg-smelling gas that’s a potential problem for both ecosystems and tourism.
The map above shows Sargassum density in the tropical Atlantic Ocean in June 2026. Red and orange areas are where Sargassum densities were the highest. Note that although the “belt” appears continuous, discrete Sargassum mats are scattered across the ocean surface. The map is based on satellite measurements of how much of the ocean surface was covered by the seaweed, averaged per pixel across all observations made in June by the OCI (Ocean Color Instrument) on NASA’s PACE (Plankton, Aerosol, Cloud, ocean Ecosystem) satellite.
This detailed view of the same PACEOCI map highlights Sargassum concentrations across the Caribbean Sea and Gulf of America, both of which saw record-high amounts of the floating algae in June 2026.
NASA Earth Observatory/Lauren Dauphin
Ocean currents and winds shape the Sargassum belt, which, despite the patchiness, stretches nearly continuously from West Africa to the Gulf and holds a fairly steady “width” from the western tropical Atlantic westward, explained Chuanmin Hu, also an optical oceanographer at USF. The ocean currents have also spared Florida’s west coast from inundation this summer, while delivering large amounts of seaweed to the Florida Keys and the state’s east coast. The bulk of the Sargassum, however, is visible in the Caribbean Sea, shown in detail above, where problems associated with inundation have been more severe, Hu said.
Data for the maps were provided by Lin Qi, an oceanographer at NOAA’s Center for Satellite Applications and Research, who has been working to generate Sargassum maps based on data from PACE, which was launched in February 2024. The work extends that of Qi and colleagues at USF’s Optical Oceanography Laboratory. This team first developed Sargassum detection techniques using MODIS (Moderate Resolution Imaging Spectroradiometer) on NASA’s long-running Terra and Aqua satellites and VIIRS (Visible Infrared Imaging Radiometer Suite) on the NOAA-20 satellite—data that have been a key component of USF’s Sargassum Watch System and of research into the seaweed’s longer-term trends.
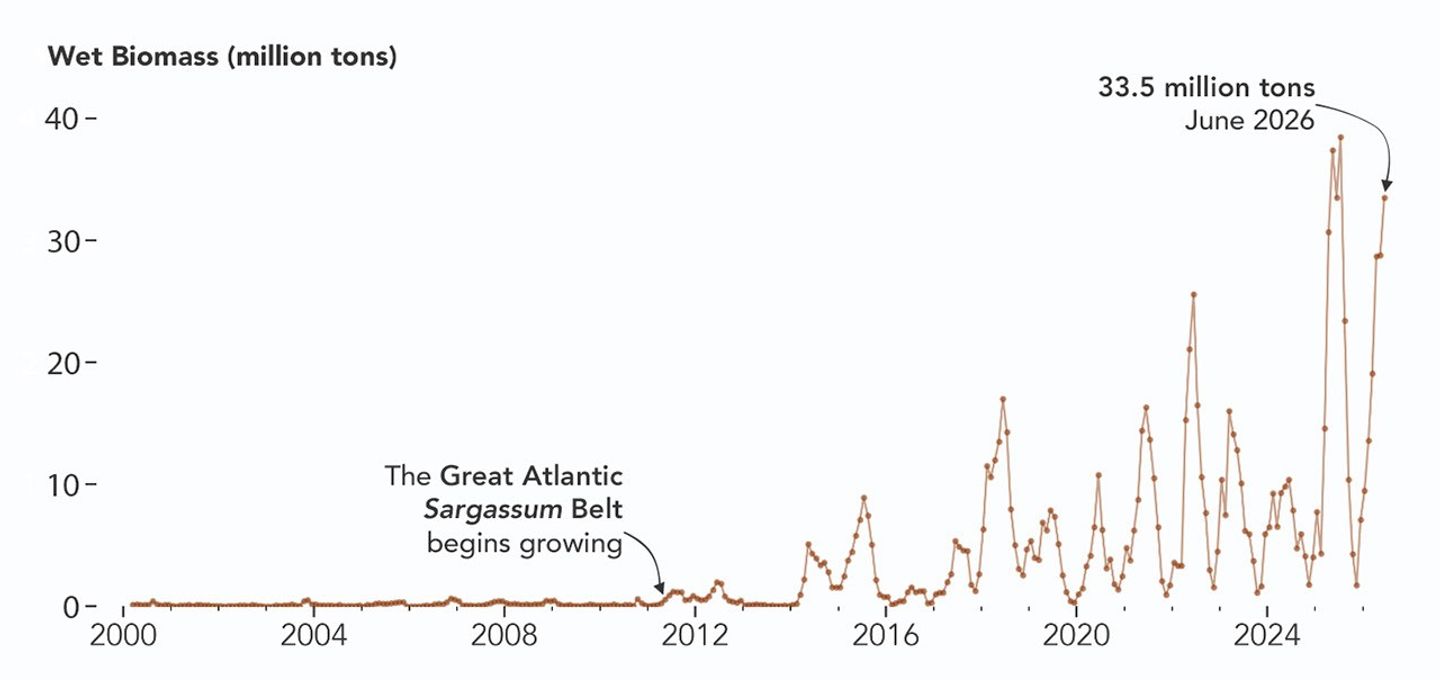
Satellites detect Sargassum by its signals in reflected sunlight. Because of its plant structure and chlorophyll pigments, Sargassum reflects more near-infrared light than water. Scientists flag pixels where the reflectance spikes above the levels produced by plain seawater, and then they use the strength of this spike to estimate Sargassum density, which refers to the fraction of ocean surface covered by the seaweed in each pixel. Density estimates can then be converted into biomass, or the total weight of Sargassum present within a pixel, which is how the longer-term trends in the chart below are tracked.
NASA Earth Observatory/Lauren Dauphin
The chart above uses the continuous MODIS record since March 2000 to show how Sargassum biomass across the Great Atlantic Sargassum Belt has changed through June 2026. Notice the uptick beginning around 2011, when the belt was first developing, and the seasonal dips in winter and peaks in spring and summer. The record high in July 2025 stands out, followed by the quick rise in early 2026—especially in the first four months of the year—that culminated in the year’s peak in June. More recent observations, not yet reflected in the chart, indicate Sargassum biomass declined through the following month of July.
“Since the initial appearance of the Great Atlantic Sargassum Belt in 2011, the total Sargassum amount in the Atlantic Ocean has increased substantially, more than doubling every five years,” Hu said. He added that the exact mechanism is still being investigated, but it’s possibly related to ocean warming, multiple nutrient sources, and the fact that large Sargassum mats attract other organisms—such as nitrogen-fixing bacteria—that can supply additional nutrients to sustain further growth.
Alongside data from MODIS and VIIRS, OCI data from PACE now feeds into the Sargassum Watch System’s near-real-time daily and weekly composite maps. A recent study of the central-west Atlantic led by Qi, spanning May through August 2024, found that OCI offers several advantages over its predecessors, observing more of the ocean and detecting Sargassum with greater sensitivity.
Hu noted that the added pixels from OCI can improve near-real-time monitoring and analyses of short-term fluctuations. And its higher sensitivity, he said, will also lead to improved maps during winter months, “thus helping understand Sargassum changes over time.”
Additionally, the study’s authors found that OCI’s hyperspectral capability makes it the only sensor able to spectrally discriminate Sargassum pixels across the Atlantic Ocean “without ambiguity,” adding confidence to the interpretation of detected image features—especially in parts of the Atlantic where another type of floating algae, Trichodesmium, has been reported.
“I think I can speak for all project members, past and present, in sharing how rewarding it is to see the promise of PACE’s advancements come to life,” said Jeremy Werdell, PACE project scientist at NASA’s Goddard Space Flight Center. “OCI has started a true renaissance in aquatic ecosystem monitoring from space.”
NASA Earth Observatory maps and chart by Lauren Dauphin, using PACE and MODIS data courtesy of Lin Qi (NOAA), and Brian Barnes and Chuanmin Hu (University of South Florida, Optical Oceanography Laboratory). Story by Kathryn Hansen.
NASA Science Soars During August Total Solar Eclipse
Each time the Moon covers the Sun during a total solar eclipse — darkening daytime skies and briefly revealing the Sun’s ethereal outer atmosphere, the corona — it presents new opportunities to better understand our star and its influence on Earth.
On Wednesday, Aug. 12, as the next total solar eclipse sweeps over Greenland, Iceland, and Spain, NASA-funded science teams will be chasing the Moon’s shadow with a high-altitude jet and scientific balloons to investigate the Sun’s dynamics and how the temporary darkening of our skies affects our atmosphere.
“From our unique perspective on Earth during a total solar eclipse, scientists can study the Sun’s corona in a way we can’t from anywhere else in the solar system,” said Kelly Korreck, eclipse program manager at NASA Headquarters in Washington. “The Sun impacts our daily life, satellites, and astronauts in space, and we can take advantage of this moment to advance our understanding of that influence.”
High-flying jet to record solar dynamics
Soaring in the nose cone of NASA’s WB-57 high-altitude research aircraft is a suite of four cameras to take high-resolution images of the corona in several different wavelengths of visible and infrared light. Part of an instrument developed by the NASA Scientifically Calibrated In-Flight Imagery (SCIFLI) team at NASA’s Langley Research Center in Hampton, Virginia, the cameras will capture at least 20 images per second, recording structures, outflows, and rapid changes in the corona during the total solar eclipse.
With these images, scientists hope to learn more about the formation of prominences (solar material that gets suspended above the Sun’s surface), better understand the corona and how it gets heated to nearly a million degrees, and investigate how material in the corona and the solar wind are related, which flows out from the Sun across the solar system.
These images of the corona and solar prominences were taken in different wavelengths of visible and infrared light by imagers aboard a NASA’s WB-57 jet during the April 8, 2024, total solar eclipse. The same cameras will fly on a NASA WB-57 jet again during the Aug. 12 eclipse.
NASA / SwRI / William Ashfield
By chasing the Moon’s shadow, the jet will extend how long the cameras can observe the corona. On the ground, the longest anyone will be able to see the corona is two minutes and 18 seconds. But flying along the eclipse path at 460 miles per hour, the jet’s view of the corona will last nearly three minutes.
NASA’s WB-57 will fly at 50,000 feet, above any clouds that might obscure the view of the corona from the ground. The altitude also allows the cameras to observe some infrared wavelengths that get absorbed by the lower atmosphere before reaching the ground, and the corona only has been observed in those wavelengths a few times before.
One of NASA’s WB-57 high-altitude jets will carry a suite of cameras up to 50,000 feet to capture images of the solar corona during the Aug. 12 total solar eclipse.
NASA
The instrument, called SCIFLI Multispectral Airborne Imager, or SAMI, also flew on a WB-57 during the total solar eclipse on April 8, 2024, providing valuable imagery and information about the corona. However, the study’s principal investigator, Amir Caspi of the Southwest Research Institute in Boulder, Colorado, says each total solar eclipse provides new opportunities to learn more about the corona.
“The Sun is always changing,” Caspi said. “Every eclipse is different. So we could see things we didn’t see before. And we learn from each eclipse how to better observe the next one.”
Caspi’s team also is making some enhancements for the 2026 campaign based on lessons learned in 2024. For example, the team will adjust exposure times to better capture bright features that were overexposed in 2024 imagery. They will also leverage software developed since 2024 to process and analyze the data sooner than before.
The experiment is funded by NASA’s Heliophysics Low Cost Access to Space Program.
As a total solar eclipse crosses Russia, Greenland, Iceland, Spain, and Portugal on Aug. 12, 2026, some of the best views will come from 50,000 feet up, aboard NASA’s WB-57 jet. Credit: NASA’s Goddard Space Flight Center
Balloons to watch atmospheric changes
When a total solar eclipse suddenly turns daytime skies dark, our atmosphere changes in ways we don’t yet fully understand.
The NASA-supported Nationwide Eclipse Ballooning Project, led by Angela Des Jardins at Montana State University, is sending students from several U.S. universities to Iceland and Spain to launch scientific balloons before, during, and after the eclipse to better understand those changes.
A student team from the University of Kentucky prepares to launch a ballon from Bloomington, Indiana, to take atmospheric measurements on April 8, 2024, during the 2024 Nationwide Eclipse Ballooning Project campaign.
Sean Bailey (University of Kentucky)
In Iceland, two teams will launch a total of 80 balloons starting 18 hours before the eclipse until eight hours afterward to study how the eclipse affects Earth’s “boundary layer,” the part of the atmosphere that touches the ground. The thickness of the boundary layer changes depending on factors such as surface temperature and moisture in the air.
Previous balloon flights during solar eclipses in October 2023 and April 2024 showed that the boundary layer collapsed, or decreased in thickness, in locations with clear skies but not where there were cloudy skies. Scientists wonder whether that will be different in Iceland in 2026. Changes in the boundary layer are driven by the day-night cycle. However, in Iceland in August, the days are long and nights are short, so the nighttime influences might not be as strong as in 2023 or 2024.
“Will this eclipse be able to collapse the boundary layer?” said Matthew Bernards, a chemical engineering professor at the University of Idaho, who leads one of the Iceland teams.
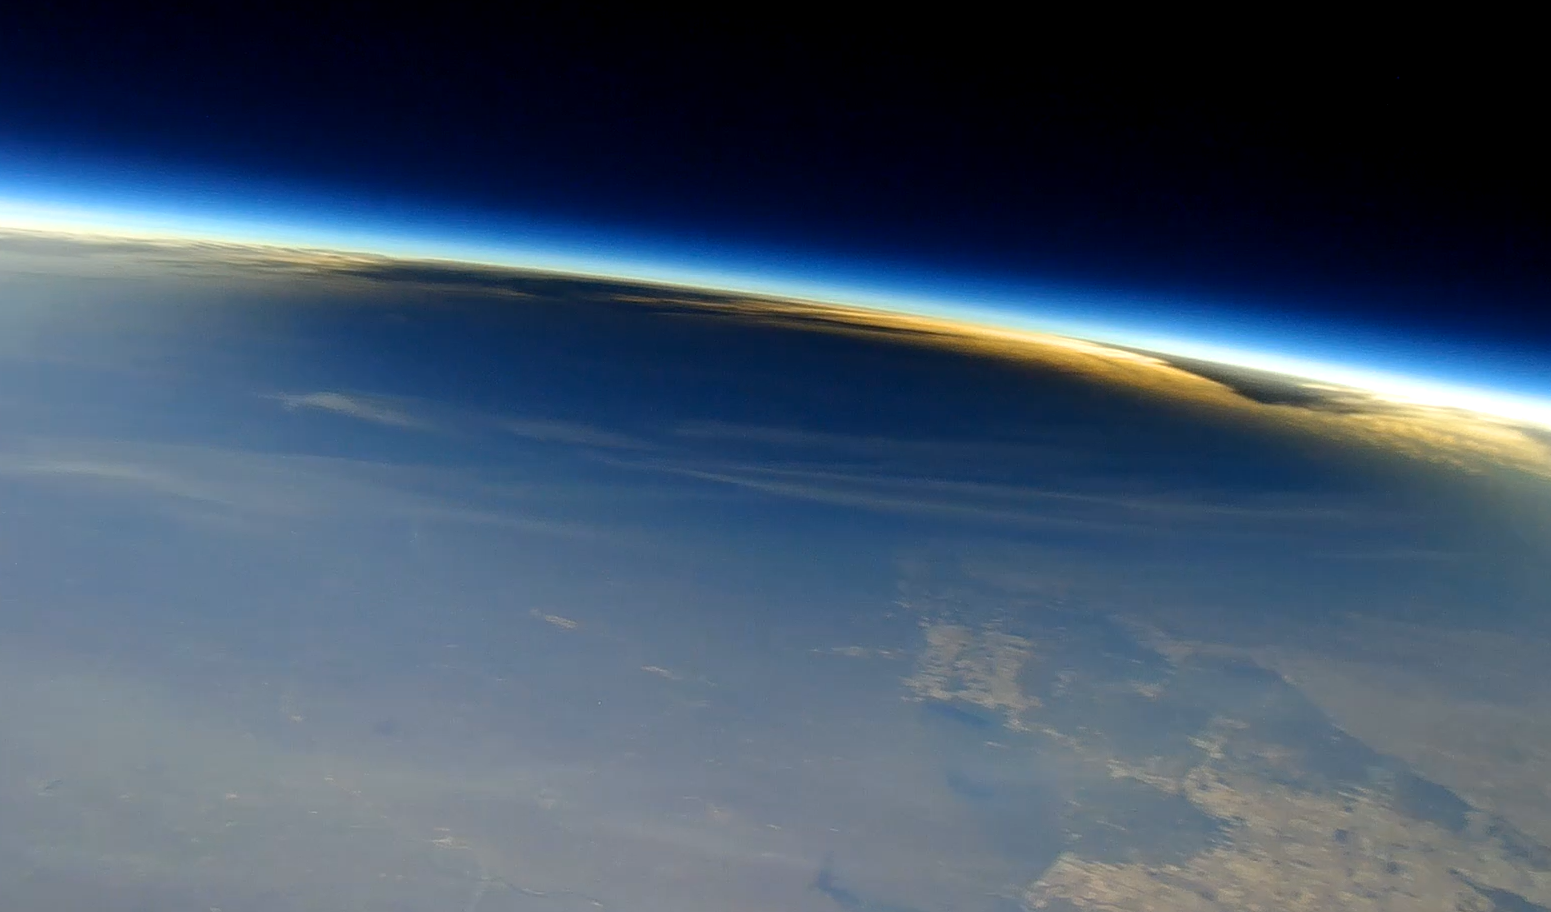
This image shows the Moon’s shadow on Earth during the total solar eclipse on April 8, 2024, as seen from about 90,000 feet from a camera carried by a scientific balloon. Cameras carried by balloons launched from Spain will capture similar images during the Aug. 12 total solar eclipse.
In Spain, three balloon teams will launch a total of six balloons with 360-degree cameras to image the eclipse shadow from above. These balloons also will include instruments designed to measure levels of ozone in the atmosphere, which requires sunlight to form. Similar balloon experiments showed that ozone decreased during totality in April 2024. Scientists wonder whether there will be differences with this eclipse, particularly since it happens at a later time of day and during a different season.
The NASA-funded Nationwide Eclipse Ballooning Project will allow teams of students from across the U.S. to get a unique view of the August total solar eclipse with scientific balloons. Credit: NASA’s Goddard Space Flight Center
Follow along
While the total solar eclipse won’t be visible in the U.S., some parts of the country will be able to see a partial solar eclipse. Learn more about where to see the eclipse and how to view it safely.
by Vanessa Thomas NASA’s Goddard Space Flight Center, Greenbelt, Md.
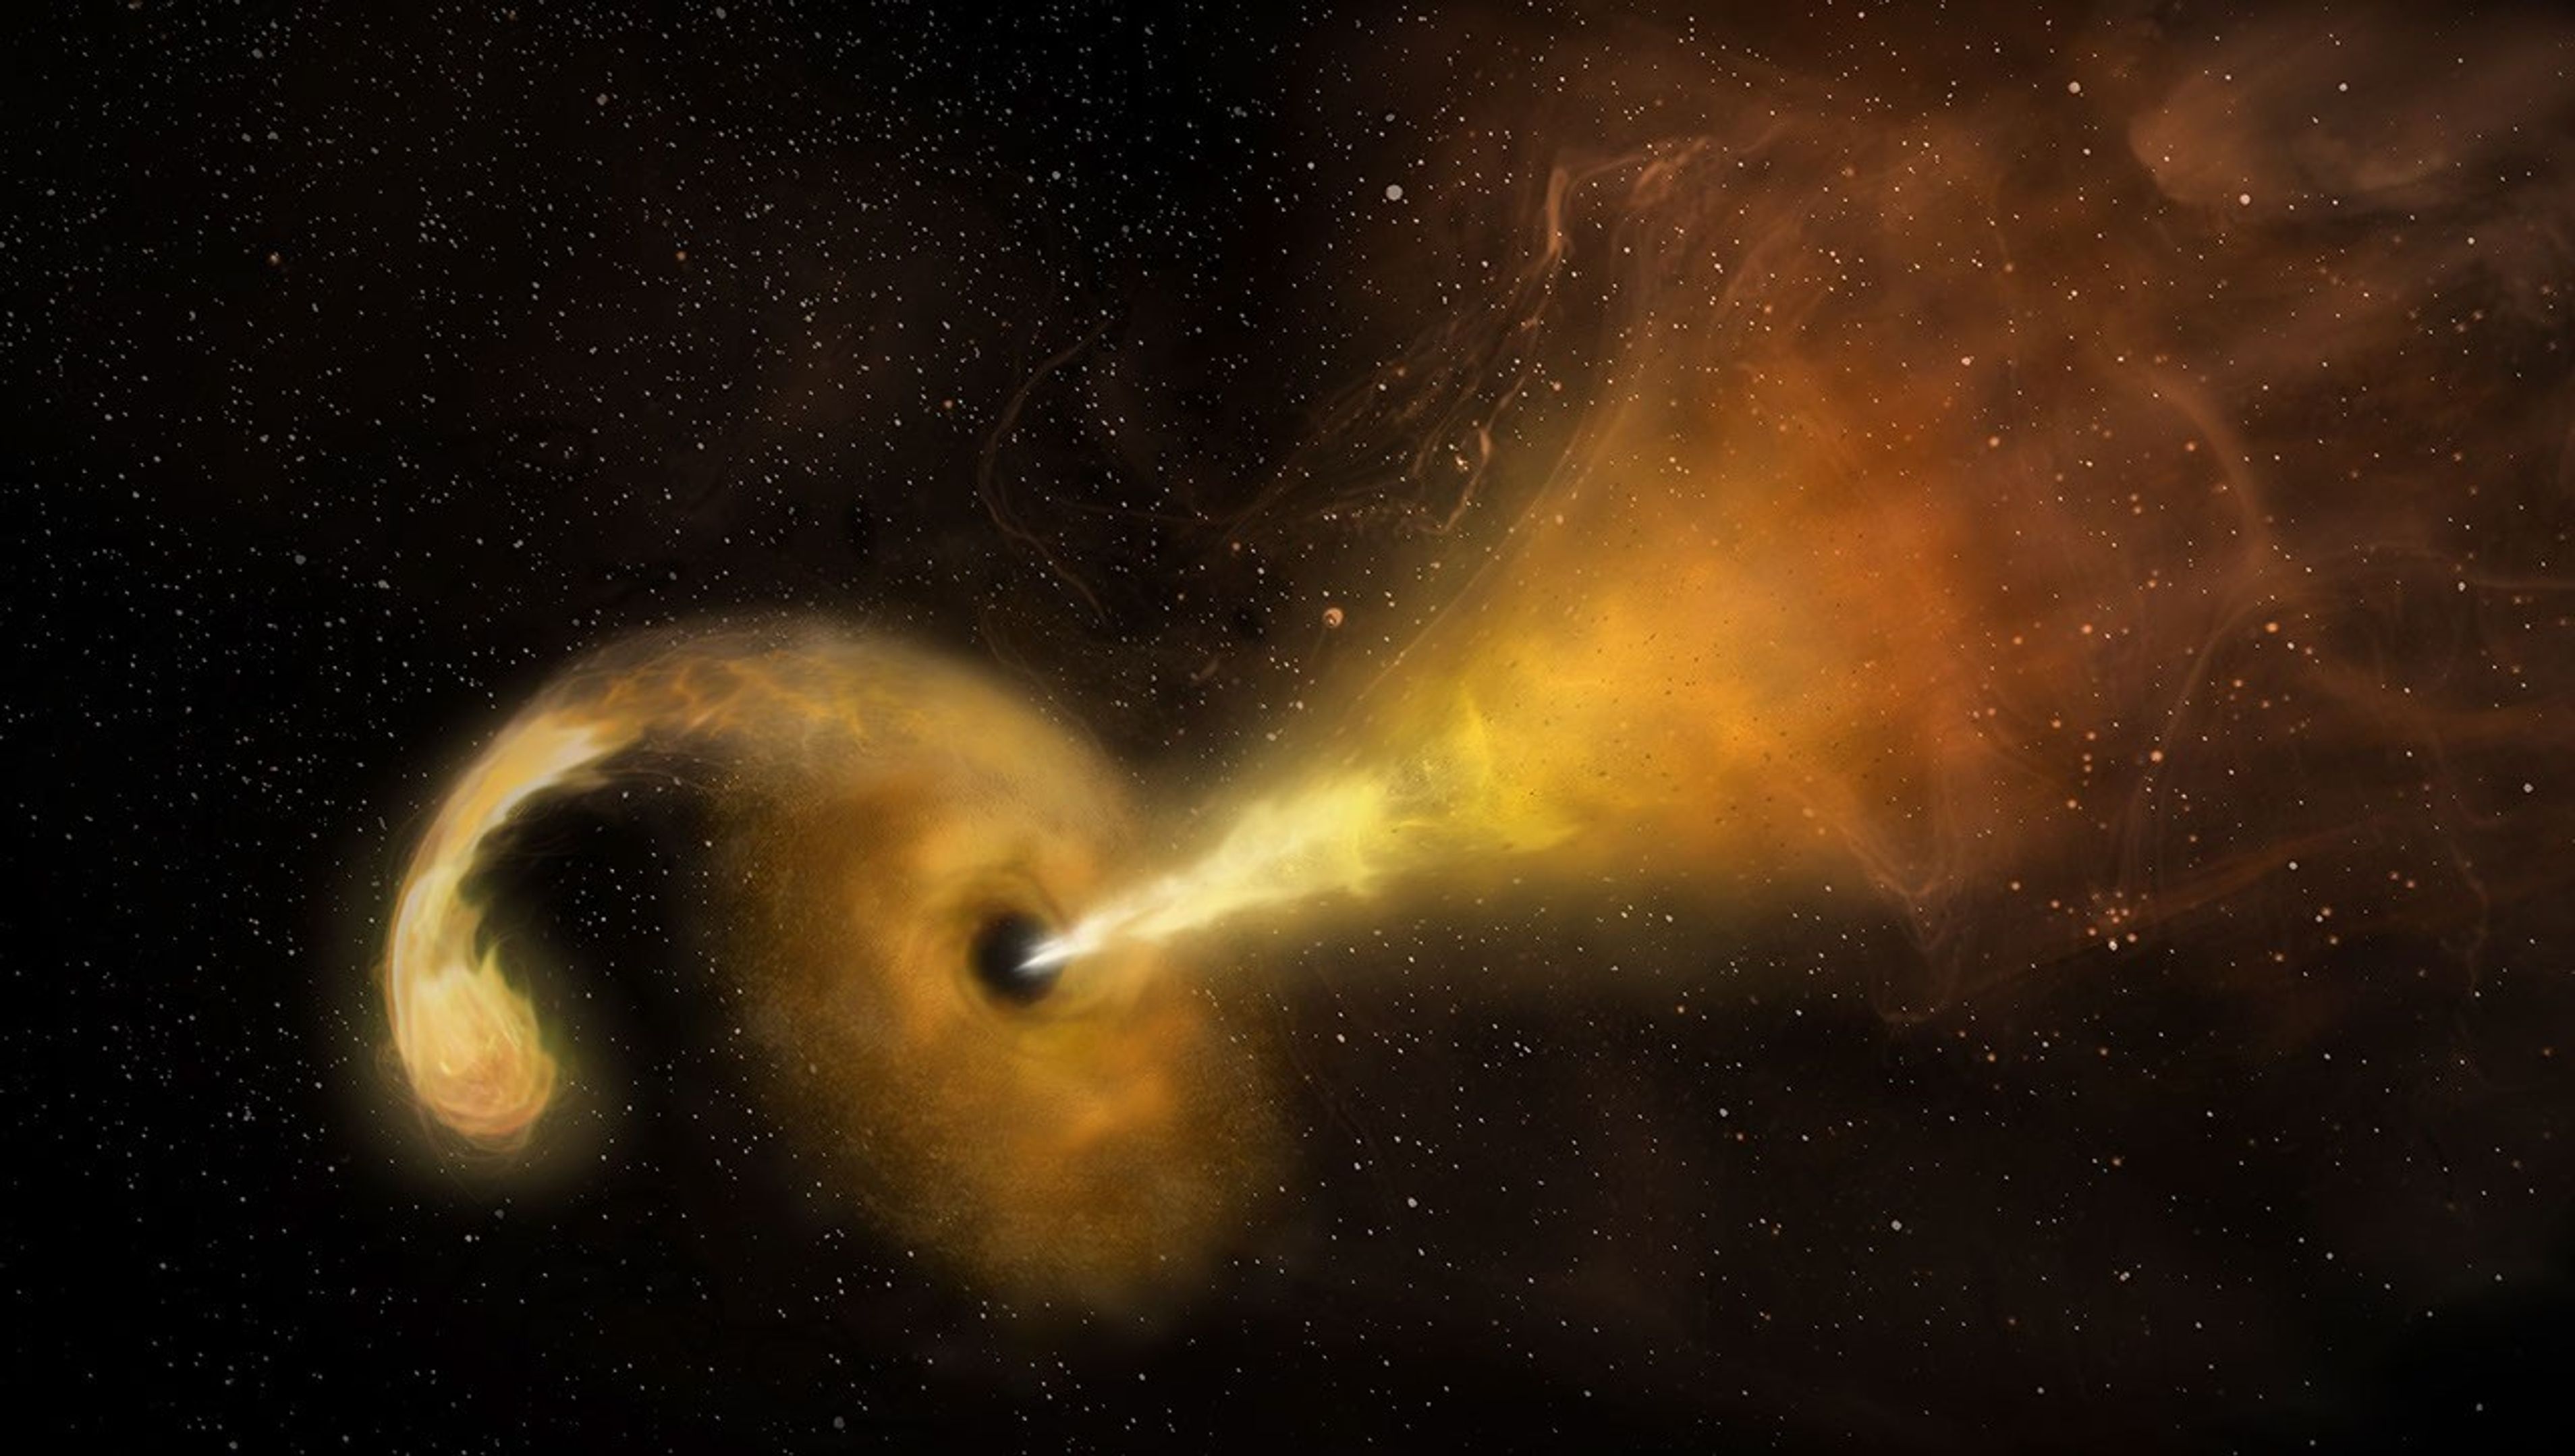
This artist’s concept depicts a tidal disruption event, which occurs when a star passes fatally close to a supermassive black hole. Crumbs of the splintering star heat up as they swirl around the black hole, creating a glow astronomers can see from far across the cosmos, and the black hole launches a relativistic jet into space.
NRAO/AUI/NSF/NASA
NASA’s Neil Gehrels Swift Observatory captured an “orphan” black hole lighting up as it devoured a star on the outskirts of a faraway galaxy. These phenomena are rare to begin with, and none had ever before been seen so far outside of a galaxy’s core.
“We were looking for these star-shredding events as a way to find otherwise invisible supermassive black holes wandering away from the galactic cores where they usually reside,” said Robert Stein, a research fellow at The University of Maryland, College Park and NASA’s Goddard Space Flight Center in Greenbelt, Maryland. “With this discovery, which is one of just a couple that have been confirmed so far, we’ve validated a new technique and can use it to hunt for more.”
A paper describing the results, led by Stein, was published Monday in The Astrophysical Journal Letters.
Researchers saw an ultrabright flare unleashed by a star being torn apart by extreme gravitational forces after drifting too close to a monster black hole — a phenomenon called a tidal disruption event. The black hole behind the blast weighs in at about a million times the Sun’s mass. Its existence was first flagged in November 2025 as an unusual brightening in a galaxy about 750 million light-years away by ZTF (Zwicky Transient Facility), a survey conducted by the Palomar Observatory in Southern California.
“Out of the half million flashes ZTF detects each night, our new artificial intelligence algorithm automatically recognized a flare that looked a lot like a tidal disruption event, despite its unusual location in the outskirts of a galaxy,” Stein said. For a few months, the tidal disruption event outshone its entire host galaxy in ultraviolet wavelengths, temporarily radiating with the light of about 10 billion suns.
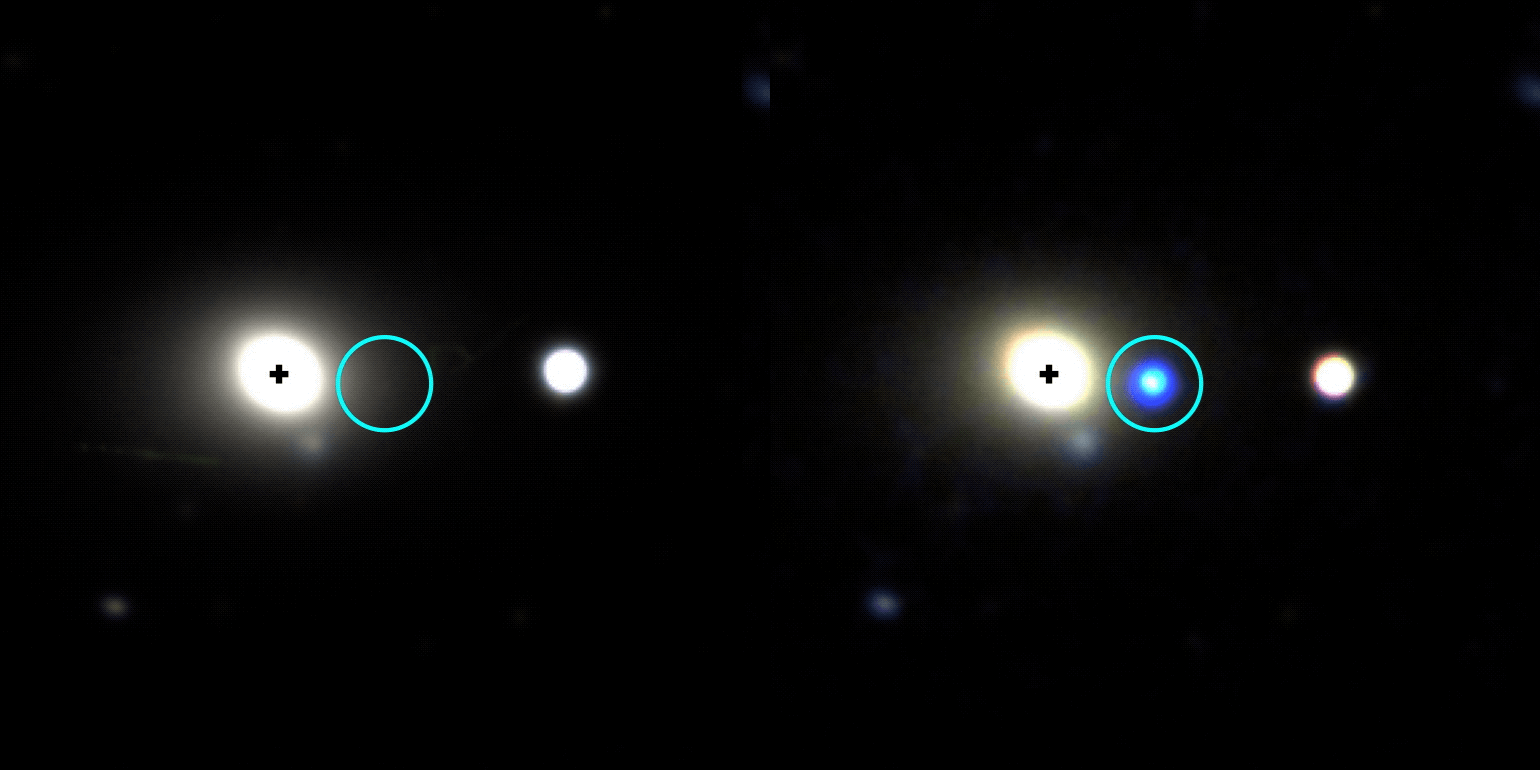
This gif shows the galaxy WISEA J014656.04-152214.7, located about 750 million light-years away in the constellation Cetus, before and after a tidal disruption event was spotted on its outer edge in November 2025. The image at left was taken by the DESI (Dark Energy Spectroscopic Instrument) Legacy Survey and the one at right is from the Lowell Discovery Telescope.
Other telescopes, including the SOAR (Southern Astrophysical Research) telescope in Chile, followed up on the ZTF source to look at the event’s spectrum, which revealed features supporting that it was likely a tidal disruption event. Astronomers then used NASA’s Swift to look at wavelengths they can’t detect with ground-based telescopes to uncover new information. For example, Swift’s UVOT (Ultraviolet/Optical Telescope) took the blip’s temperature and found that it had quite a fever at about 54,000 degrees Fahrenheit (30,000 degrees Celsius).
“The combination of all this data helped us rule out other explanations and confidently say it’s a tidal disruption event, despite its strange location,” said Jonathan Carney, a doctoral student at the University of North Carolina at Chapel Hill, who took the first spectra that supported the flare’s interpretation as a tidal disruption event.
Hidden heavyweights
Nearly every galaxy in the universe is anchored by a supermassive black hole sitting right in the center. About once every 100,000 years, a star will drift too close to this invisible heavyweight and trigger a tidal disruption event.
While they’re rather rare in any given galaxy, scientists scour millions of galaxies for them. Each year, astronomical surveys typically spot about 30 tidal disruption events occurring somewhere in the universe.
Prior to 2024, they’d only been seen in galaxy cores. That’s partly because astronomers mainly looked for them there; after all, it’s where all the known supermassive black holes were, and you can’t get a tidal disruption event without one (the gravitational pull of lighter black holes isn’t strong enough).
Then scientists saw the telltale signs of a star being shredded 2,600 light-years from the center of its host galaxy. That inspired more astronomers to look beyond galaxy cores for similar events, and now a team has identified one more than 30,000 light-years away from a galaxy’s center.
This video visualizes a star approaching a supermassive black hole so closely that it’s stretched to a breaking point by the black hole’s strong gravity. Intense tidal forces crack the star open and hurl its gaseous guts outward. Stellar debris forms a spinning accretion disk as it continues to spiral into the black hole.
NASA, ESA, STScI, Ralf Crawford (STScI)
Oddball origin story
So how did the newfound black hole become so off-kilter?
“It must have originated in a galaxy’s center, but not the one it’s in the outskirts of now,” Stein said. “We think the host galaxy’s supermassive black hole is still at its core, but the one eating the star could have started off in a small galaxy that merged with the big one we see today.”
The researchers have outlined two possibilities. Three or more galaxies may have merged together, and the gravitational tug-of-war between their central supermassive black holes may have flung the lightest black hole out to the galaxy’s edge.
Or a dwarf galaxy could be midway through a merger. As the dwarf’s stars fell into the larger galaxy, one may have passed too close to the dwarf’s supermassive black hole.
“Further discoveries could reveal the origin of this apparent ‘orphan’ black hole,” Stein said. “The key science question we want to answer is: How common are wandering black holes?”
The answer may soon be within reach. “Pointed science observations with Swift’s UVOT and XRT (X-Ray Telescope) instruments are temporarily suspended as the mission awaits an orbit boost, which is planned for this summer,” said co-author S. Bradley Cenko, Swift’s principal investigator at NASA Goddard. The spacecraft, whose primary mission ran from 2004 to 2006, is slowly sinking toward Earth due to atmospheric drag after more than 20 years of observations of the changing universe. Nudging it to a higher orbit could extend its lifetime even longer. “Once it resumes normal operations, Swift could continue searching for more examples of out-of-place black holes.”
In the coming years, scientists will use the new technique to search for disintegrating stars in observations from the newly operational Vera C. Rubin Observatory, jointly funded by the U.S. Department of Energy and National Science Foundation, in Chile and NASA’s upcoming Nancy Grace Roman Space Telescope.
“Rubin’s wide, deep surveys will reveal a much larger sample of tidal disruption events than current observatories are capable of collecting, including ones that are off-center,” Carney said. “And Roman’s space-based surveys will extend the current search zone by seeing ones that are farther away, looking back through 9 billion years of cosmic history.” Adding their observations to Swift’s and those from ground-based observatories will bring astronomers closer than ever before to completing a census of the universe’s behemoth black holes.
NASA’s Hubble Shows Star Formation in Andromeda Galaxy Winding Down
NASA Hubble’s view of part of the Andromeda galaxy.
Credits: Image: NASA, ESA, Benjamin Williams (UWashington), Zhuo Chen (UWashington), L. Clifton Johnson (Northwestern); Image Processing: Joseph DePasquale (STScI)
A new study using data from NASA’s Hubble Space Telescope finds that star formation in the nearby Andromeda galaxy has undergone a 500-million-year decline, with an even steeper drop in the last 40 million years. Andromeda, a spiral galaxy comparable in size to our Milky Way, is close enough to be seen with the unaided eye from areas with dark skies. Located about 2.5 million light-years from Earth, practically our cosmic backyard, Andromeda offers an opportunity for astronomers to examine its stellar populations in detail, leading to better understanding of the past of galaxies like our own.
To reach this conclusion, the researchers combined data from two Hubble surveys: the Panchromatic Hubble Andromeda Treasury and the Panchromatic Hubble Andromeda Southern Treasury. Together, these two surveys mapped two-thirds of the disk of Andromeda in ultra-sharp detail. In total, the team measured about 200 million individual stars across the galaxy, giving them a detailed picture of Andromeda’s past activity.
“We need to measure the individual stars because they are the fossil record of the galaxy’s formation. Hubble is the only telescope that can give you high enough spatial resolution over a large enough area to be able to do that in Andromeda,” said Ben Williams, astronomer at the University of Washington and a co-author on the study.
Massive stars are bluer and short-lived, while less massive stars are redder and longer-lived. As a result, areas that have experienced recent star formation tend to have a larger fraction of blue stars, while areas with less recent star formation typically have a redder population. The team divided the Andromeda images into thousands of squares, spanning 300 light-years on each side of the square, and determined the history of star formation within each parcel to gain a comprehensive view of the galaxy’s past.
NASA’s Hubble Space Telescope has provided a detailed view of millions of stars in the Andromeda galaxy. Regions that have experienced recent star formation (1) appear significantly bluer than regions with less recent star formation (2).
NASA, ESA, Benjamin Williams (UWashington), Zhuo Chen (UWashington), L. Clifton Johnson (Northwestern); Image Processing: Joseph DePasquale (STScI)
Steady decline
Previous research showed the Andromeda galaxy experienced a dramatic burst of star formation about 2 billion years ago, likely due to a past interaction or merger with another galaxy. Since that time, star formation has been steadily declining.
Astronomers measure the rate of star formation in terms of the mass, or amount of gas and dust, converted into stars per year. The researchers calculated that, 500 million years ago, Andromeda formed stars at a rate of about one solar mass per year. However, the formation rate dropped to about half that by 40 million years ago. The current rate has plummeted even farther, to about one-fifth the mass of our Sun per year.
The team also examined whether that decline was consistent across the galaxy or concentrated in certain areas. They found that much of the recent star formation has occurred in a star-forming ring located about 32,000 light-years from the galaxy’s center. As a result, much of the decline they measure is driven by decreasing activity within that ring.
Rather than being the result of reduced material from which new stars can form, the decline is more likely to be a natural winding down from its previous, more active state.
“It’s just like after running a marathon, sometimes you’ve got to take a bit of a breather,” said Tobin Wainer, lead author, University of Washington.
Likely suspect
The team also investigated whether there was any connection between the decrease of activity in Andromeda and its proximity to satellite galaxy M32 (Messier 32). The M32 galaxy is separated from Andromeda by about 16,000 light-years in the plane of the sky; however, its 3D location in space is uncertain. As a result, astronomers are unsure if or when it might have interacted with Andromeda in the past.
“One of the major motivations for this program was to probe potential interactions between M32 and Andromeda’s disk,” said Zhuo Chen, co-author, University of Washington.
Survey data from the Panchromatic Hubble Andromeda Southern Treasury allowed the team to study the history of star formation in Andromeda near M32. They found that this area showed signs of decreased star formation compared with other regions. The timing of this decrease, which this study finds began roughly 60 million years ago, could help constrain when the M32 galaxy interacted with Andromeda’s disk.
“We can’t explicitly say that we are seeing a decrease in star formation because of M32. But it’s right there, and it’s definitely the most likely suspect,” said Wainer.
This movie, created from an analysis of data from NASA’s Hubble Space Telescope, demonstrates how the rate of star formation in the Andromeda galaxy has declined over the past 500 million years. Brighter colors indicate where star formation was highest during a given time.
Visualization: Tobin Wainer (UWashington); Image Processing: Joseph DePasquale (STScI); Video: NASA, ESA, STScI, Gregory Bacon (STScI)
The team plans to continue analyzing the Hubble data and combine it with data from ground-based observatories to gain additional insights into the history of Andromeda.
“There’s a strong scientific value to this archival data. Andromeda is important because it’s a neighbor that is close enough that we can see it in great detail while also getting a global perspective,” said Raja GuhaThakurta, co-author, University of California Santa Cruz.
An even greater global perspective is likely to come from NASA’s Nancy Grace Roman Space Telescope after it launches as early as Sunday, Aug. 30. Roman’s gigantic field of view can cover at least 100 times as much area as Hubble at near-infrared wavelengths in a single observation. A newly approved Roman observing program will image the entirety of Andromeda’s disk and areas of its surrounding halo, allowing astronomers to measure hundreds of millions of stars and enabling groundbreaking new science.
The Hubble Space Telescope has been operating for more than three decades and continues to make ground-breaking discoveries that shape our fundamental understanding of the universe. Hubble is a project of international cooperation between NASA and ESA (European Space Agency). NASA’s Goddard Space Flight Center in Greenbelt, Maryland, manages the telescope and mission operations. Lockheed Martin Space also supports mission operations at Goddard. The Space Telescope Science Institute in Baltimore, which is operated by the Association of Universities for Research in Astronomy, conducts Hubble science operations for NASA.
NASA’s Hubble Space Telescope has provided a detailed view of millions of stars in the Andromeda galaxy.
Star Formation Rate in Andromeda Over Time
This movie, created from an analysis of data from NASA’s Hubble Space Telescope, demonstrates how the rate of star formation in the Andromeda galaxy has declined over the past 500 million years.
On July 3, one of NASA’s two Mars-destined ESCAPADE (Escape and Plasma Acceleration and Dynamics Explorers) spacecraft captured photos of Earth and the Moon in visible and thermal infrared light. At the time, the spacecraft was 363,250 miles (584,600 kilometers) from Earth and 115,600 miles (186,100 kilometers) from the Moon, making the Moon appear relatively large.
Taken with the Sun only partly illuminating Earth and the Moon, the visible light image shows the two bodies as crescents, with only around 8% of each face sunlit. Yet in the thermal infrared image, the shadowed hemisphere of Earth is illuminated by its own heat from both the atmosphere and surface, glowing at minus 10 to minus 44 degrees Fahrenheit (250 to 280 kelvins). Without the insulating blankets of oceans and atmospheres, the Moon’s far side remains at a much cooler minus 280 degrees Fahrenheit (100 kelvins).
visible light
thermal infrared light
Caption: In these images from NASA’s ESCAPADE mission, Earth (left) and Moon (right) can be seen. The image to the left of the slider shows visible light reflected by the Sun while the infrared image to the right shows the bodies’ emitted energy. White rings have been added in the thermal image to show the actual size of Earth and the Moon. Credit: NASA/UCB-SSL/NAU-Radiant/Lucint
NASA/UCB-SSL/NAU-Radiant/Lucint
In these images from NASA’s ESCAPADE mission, Earth (left) and Moon (right) can be seen. The image to the left of the slider shows visible light reflected by the Sun while the infrared image to the right shows the bodies’ emitted energy. White rings have been added in the thermal image to show the actual size of Earth and the Moon.
NASA/UCB-SSL/NAU-Radiant/Lucint
visible light
thermal infrared light
ESCAPADE Photos of Earth and Moon
July 3, 2026
In these images from NASA’s ESCAPADE mission, Earth (left) and Moon (right) can be seen. The image to the left of the slider shows visible light reflected by the Sun while the infrared image to the right shows the bodies’ emitted energy. White rings have been added in the thermal image to show the actual size of Earth and the Moon. Credit: NASA/UCB-SSL/NAU-Radiant/Lucint
The ESCAPADE mission used its Visible and Infrared Observation System cameras, provided by Northern Arizona University in Flagstaff, to capture the images, which are more than just road trip photo album snaps.
“We are thrilled that ESCAPADE was able to accommodate these excellent space-qualified cameras which will search for visible Martian aurora and investigate thermal properties of the Martian surface and atmosphere,” said Rob Lillis, the mission’s principal investigator at the University of California, Berkeley. “Since Earth and the Moon are well-known targets, imaging them provides an important calibration check for ESCAPADE’s cameras.”
The ESCAPADE spacecraft, which were built by Rocket Lab, are currently in a “loiter” orbit around Lagrange point 2, a location in space about a million miles from Earth. In November 2026, the spacecraft will fly by Earth to use the planet’s gravity to slingshot their way to Mars. When the spacecraft arrive in September 2027, they will study how a million-mile-per-hour stream of material flowing from the Sun, known as solar wind, interacts with the Martian environment and how that drives atmospheric loss at the Red Planet.
The ESCAPADE mission is funded by NASA’s Heliophysics Division and is part of the NASA Small Innovative Missions for Planetary Exploration program. The UC Berkeley’s Space Sciences Laboratory leads the mission with key partners Rocket Lab; NASA’s Goddard Space Flight Center in Greenbelt, Maryland; Embry-Riddle Aeronautical University; Advanced Space; and Blue Origin.
By Mara Johnson-Groh NASA’s Goddard Space Flight Center, Greenbelt, Md.
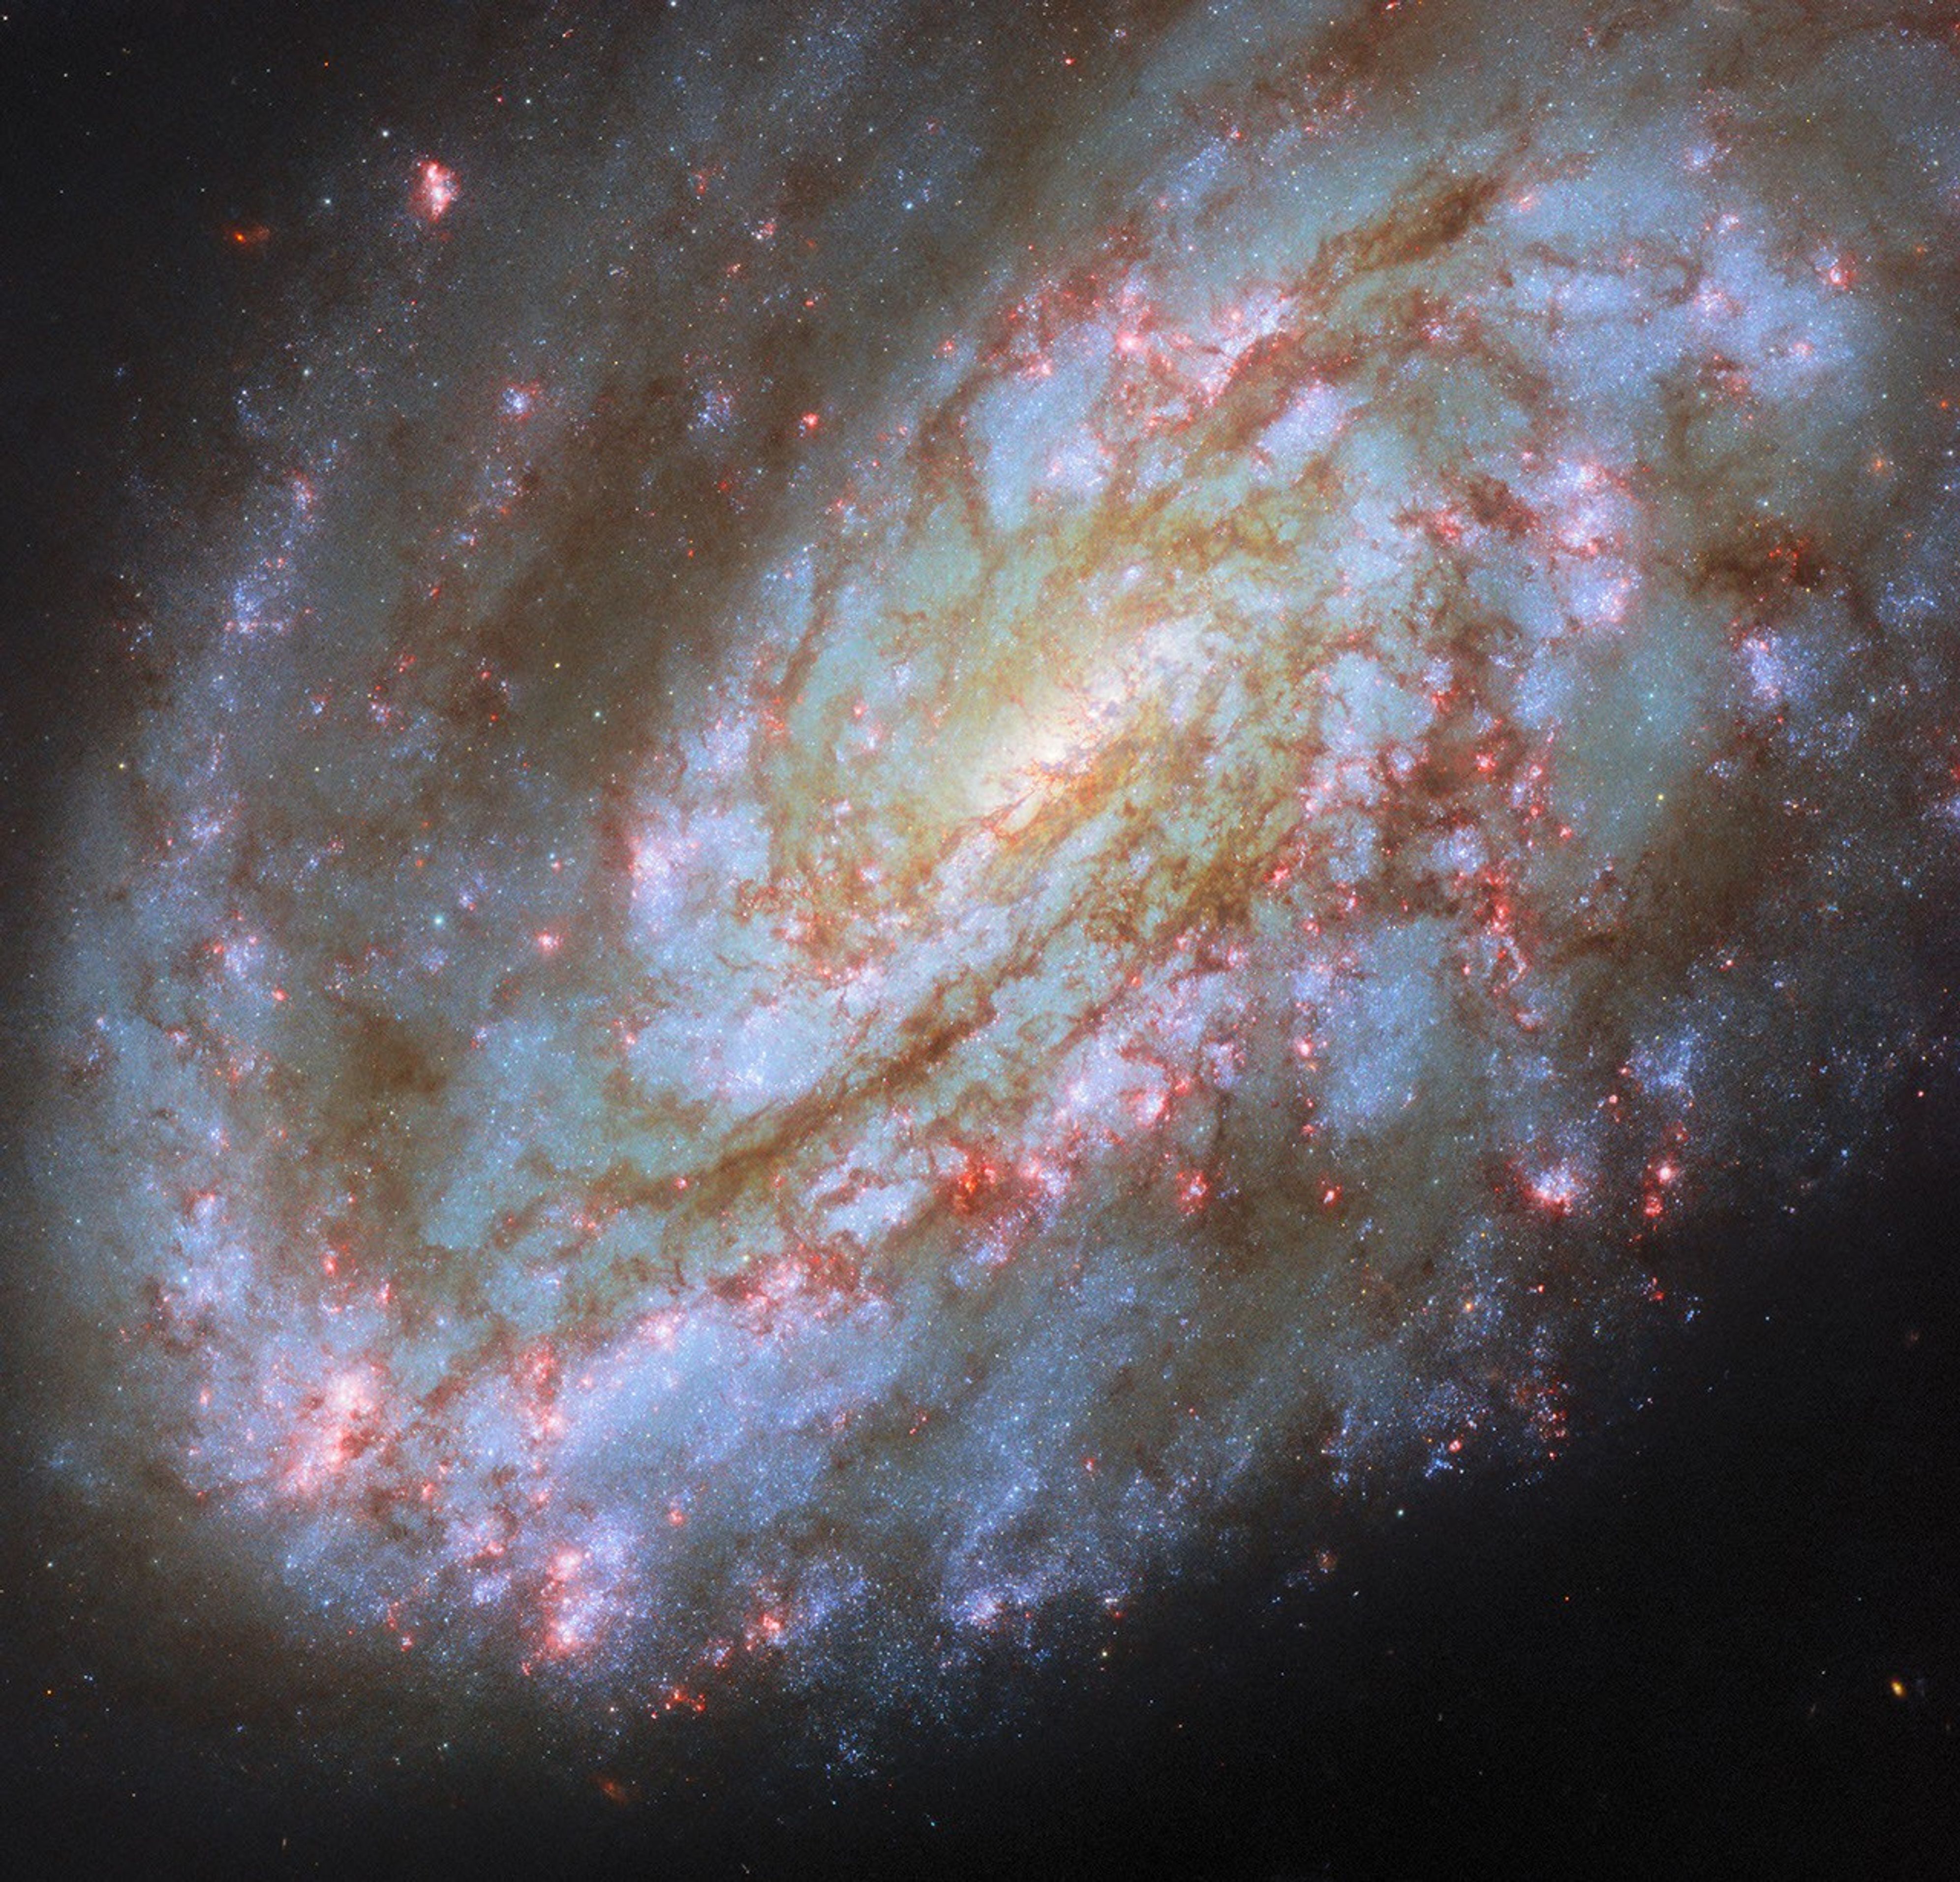
This NASA/ESA Hubble Space Telescope image features the spiral galaxy NGC 4654, located 72 million light-years away in the constellation Virgo (the Maiden).
NASA, ESA/Hubble, D. Thilker, J. Lee, and the PHANGS-HST Team
The subject of this NASA/ESA Hubble Space Telescope image is a spiral galaxy struggling against titanic forces that appear on galactic scales in space. This is NGC 4654, an intermediate spiral galaxy in the constellation Virgo (the Maiden). It is classified as an “intermediate” because its overall shape lies between spiral galaxies that have a bar across their centers and those that don’t. NGC 4654 has a weak bar structure at its center and is located 72 million light-years from Earth in the Virgo Cluster, a particularly massive and populous galaxy cluster.
NGC 4654 is particularly asymmetric, with a rounded and clearly-defined edge on one side and a long tail of gas stretching out from the opposite side — outside the field of view captured in this image. This gaseous tail is the result of ram pressure stripping, a force that galaxies can experience as they plow through space. NGC 4654 moves with such high velocity that it sweeps up and rams through the hot, rarefied gas filling the space between the Virgo Cluster’s galaxies. This intracluster medium in turn exerts a “ram pressure” on the galaxy, compressing the galaxy’s leading edge and dragging its gas behind the galaxy, creating the elongated tail.
It’s not just the galaxy’s gas that is unevenly distributed: its stars are too, and this is more unusual for a spiral galaxy. While the spiral arm on its leading edge is rich with stars and gas, the opposite arm noticeably lacks stars, influencing the galaxy’s lopsided spiral shape. Astronomers think that ram pressure alone is unlikely to cause this effect. Rather, NGC 4654 was also subjected to the gravitational force of fellow Virgo Cluster galaxy NGC 4639. While the two galaxies are far apart now, it’s thought that a fly-by interaction between them around 500 million years ago ripped away NGC 4654’s gas along one side, limiting star formation there and creating the asymmetry in its shape.
Many galaxies that undergo ram pressure stripping suffer reduced star formation rates as the cold gas that collapses to form their stars is pulled away and lost. NGC 4654, however, is still forming nearly two Suns’ worth of stars every year, a rate comparable to other galaxies of similar size. The active star formation is visible in the latest Hubble data included in this image. The data picks up on a wavelength of red light emitted by the clouds of energized gas where newborn stars lurk. The bright pink bubbles that appear across NGC 4654 — from its forward spiral arm, to around its weak bar, and out to the edge of its disk — are areas where these newborn stars shine.
The data used in this image came from two observing programs (#15654, #17502) that aim to link the gas in galaxies with star formation. By observing many prominent galaxies in the vicinity of our own, researchers hope to better understand how gas moves in galaxies, where and when it collapses to form stars and star clusters, and what effect those new stars have on the gas around them.
This illustration depicts charged particles from a solar storm stripping away charged particles of Mars’ atmosphere, one of the processes of Martian atmosphere loss studied by NASA’s MAVEN mission.
NASA/GSFC
NASA MAVEN (Mars Atmosphere and Volatile Evolution) mission scientists have uncovered a key puzzle piece in understanding certain types of auroras on Mars, finding that they form in a similar way to Earth-based auroras.
Results published Thursday in Nature Communications show the same mechanism that circulates and catapults charged particles into Earth’s atmosphere is happening at Mars on much smaller scales because of differences in the two planets’ magnetic fields.
The MAVEN spacecraft, in orbit around Mars, experienced a loss of signal with ground stations on Earth on Dec. 6, 2025. On June 3, NASA declared the mission had concluded after finding the spacecraft to be unrecoverable. However, data from the mission is still being used to inform NASA science and future missions to Mars.
When the Sun’s magnetic field lines get close to Earth’s magnetosphere, the large magnetic bubble protecting the planet, they can reconnect and inject energy and mass throughout Earth’s magnetosphere and magnetotail, ultimately firing electrons back into the atmosphere to generate Earth’s auroras. This process, called the Dungey cycle, drives electrical currents, accelerates charged particles that create auroras, and controls the circulation of plasma in Earth’s magnetosphere and ionosphere.
This new study shows that a miniature version of the Dungey cycle is happening over Mars’ strong crustal magnetic fields, which gives scientists a better look into the physics of Martian auroras.
“We knew that magnetic reconnection was happening at Mars but did not expect it to be like the Dungey cycle,” said Shaosui Xu, lead author of the study and associate research physicist at the Space Sciences Laboratory at the University of California, Berkeley.
Mars does not have a global magnetic field like Earth. Earth’s magnetic field is created by our planet’s churning core, while Mars has numerous miniature magnetospheres that arise from intensely magnetized crust scattered around the planet. These regions were formed around 4 billion years ago when lava cooled in the presence of Mars’ ancient global magnetic field, which has since disappeared due to intense solar wind stripping the planet’s atmosphere.
The MAVEN mission has observed highly localized auroras over these crustal fields, similar to Earth’s auroras at the poles, but it wasn’t until now that scientists could fully understand the physics of how they form. The study used several instruments aboard the MAVEN spacecraft to build up a picture of the Dungey-like behavior: the Magnetometer and Solar Wind Electron Analyzer instruments, which were used to determine the magnetic configuration and derive electrical currents, and the STATIC (Suprathermal and Thermal Ion Composition) instrument, which was used to measure plasma flows in the ionosphere.
“We really pushed the limit of STATIC to get the data we needed,” said Xu. “It was the final piece to the puzzle in understanding these localized auroras.”
The realization that a Dungey-like cycle was happening within these crustal magnetic fields answered the question of how the electrons were being energized to create the auroras. It also shows that a Dungey-like mechanism can happen on both large and small scales, giving more insight into where in the solar system this process could be taking place.
“This is a remarkable result that changes how we think of Martian auroras and is another important step toward understanding why Mars and Earth have evolved so differently despite being governed by the same underlying physics.” said Shannon Curry, MAVEN’s principal investigator and a research scientist at the Laboratory for Atmospheric and Space Physics at the University of Colorado Boulder. “I am incredibly proud of our team’s work on this discovery and excited to uncover new insights into the Red Planet and its evolution.”
By finding out more about this process, scientists also are gaining a better understanding of how the solar environment interacts with the Red Planet as a whole, which is essential for future robotic and crewed missions.
“I remember in graduate school discussing with my advisor how the cycling of crustal magnetic fields could work at Mars,” said Xu. “It’s incredible to be part of the team that found the answer to that question.”
The MAVEN mission is part of NASA’s Mars Exploration Program portfolio. The mission’s principal investigator is based at the Laboratory for Atmospheric and Space Physics at the University of Colorado Boulder, which also is responsible for managing science operations and public outreach and communications. NASA’s Goddard Space Flight Center in Greenbelt, Maryland, manages the MAVEN mission. Lockheed Martin Space built the spacecraft and is responsible for mission operations. NASA’s Jet Propulsion Laboratory in Southern California provides navigation and Deep Space Network support.
For more information on NASA’s MAVEN mission, visit:
NASA Study of Pristine Meteorite Adds to Story of Ancient Asteroids
C1 clasts in Hillsborough: On the left is a back-scattered electron image with two C1 748 clasts circled. On the right, an X-ray map of the same area as (A), indicating Na enrichment in 749 of the C1 clasts relative to the bulk of Hillsborough. Credit: NASA/SETI
A meteorite recovered immediately upon its fall to Earth on July 16, 2024, is helping NASA scientists uncover new clues about ancient water, the chemical evolution of primitive asteroids, and the ingredients that may have helped make life possible throughout the early solar system.
This rapid recovery began when an amateur astronomer in New Jersey quickly recognized that a newly fallen meteorite had landed on his property. Recognizing its scientific value and wearing protective gloves, he collected the fragments and stored them in aluminum foil and glass containers, which preserved delicate minerals and organic compounds that are often altered by moisture, weather, and contamination.
As the meteorite fell to Earth, cameras across New Jersey captured its fiery passage through the atmosphere. Scientists used these observations to reconstruct the fireball’s trajectory and, after recovering the meteorite, combined this data with laboratory analyses to determine where in the solar system the rock most likely originated. In a study published Wednesday in the journal Science Advances, researchers found evidence that ancient salty water altered minerals within the meteorite’s parent asteroid, preserving unique minerals and a rich inventory of organic compounds.
“When we have both a documented fireball and a quick recovery of its meteorite, we can learn not only what the rock is made of, but where it came from in the asteroid belt,” said Peter Jenniskens, meteor astronomer at both NASA’s Ames Research Center in California’s Silicon Valley and the SETI Institute, and lead author of the study.
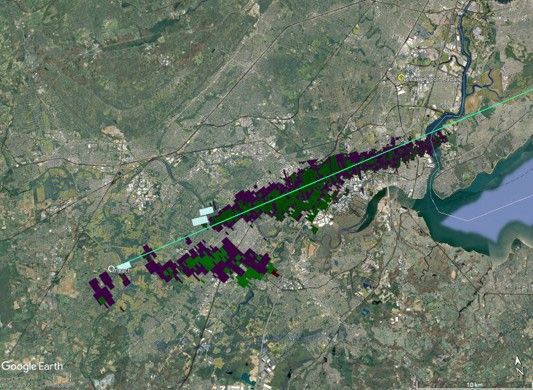
Combined radar detections from the Hillsborough meteorite fall. The green line shows the fireball’s projected path, while colored radar signatures show falling meteorite fragments drifting east-northeast with prevailing winds. Credit: NASA/Marc Fries
Named for the township where it was recovered, the Hillsborough meteorite belongs to a class of carbon-rich meteorites known as CM carbonaceous chondrites. These primitive rocks preserve some of the oldest materials in the solar system, recording the chemical processes that shaped asteroids more than 4.5 billion years ago.
While examining the unusually pristine meteorite, researchers found a mosaic of tiny broken-up rocks and noticed that some contained unusually high concentrations of sodium — an unexpected finding for this type of meteorite. The surprising signal prompted a closer investigation using powerful electron microscopes that allowed scientists to examine the meteorite from the millimeter scale down to individual atoms. By combining observations across multiple scales, researchers reconstructed the history of the minerals and the fluids that once flowed through them.
These analyses revealed microscopic fractures filled with sodium-rich material left behind by ancient brines. Unlike pure water, brines contain dissolved salts that allow them to transport elements and chemically alter the rocks they move through. In the case of the Hillsborough sample, those ancient fluids altered the asteroid’s minerals and left behind chemical evidence that remained preserved for billions of years.
Scientists were also able to detect fragile sodium-carbonate salts that normally react with moisture in Earth’s atmosphere before they can be studied. Jangmi Han, a paper co-author and mineralogist at NASA’s Johnson Space Center in Houston, identified evidence of ancient brines preserved within microscopic fractures. Similar salts were identified in samples returned from the asteroids Bennu and Ryugu by NASA’s OSIRIS-REx mission and JAXA’s (Japan Aerospace Exploration Agency) Hayabusa2 mission. However,Hillsborough marks the first time the salts have been identified in a CM carbonaceous chondrite meteorite, offering a new glimpse into the surfaces of the primitive asteroids that produced these meteorites.
Together, these findings suggest that ancient, salt-rich brines were more widespread among primitive asteroids than previously recognized, and provide scientists with new opportunities to compare how water altered different asteroid bodies across the early solar system.
“The chips of the most salt-rich bits of this meteorite are quite comparable to the samples returned by the Hayabusa2 and OSIRIS-REx missions,” said Mike Zolensky, a meteorite researcher at NASA Johnson and co-author of the study. “They’re not identical. They’re different in some very interesting ways, but they’ve seen very similar processes.”
Following the history of water through the solar system is an essential part of understanding the origin of life.
Mike Zolensky
Meteorite Researcher
Scientists expected Hillsborough to contain a rich suite of organic compounds because it is a CM carbonaceous chondrite. What made the meteorite exceptional was how quickly it was recovered, allowing researchers to study those compounds before prolonged exposure to Earth’s environment could contaminate the sample.
“One of the big surprises for me when we analyzed a small chip of the Hillsborough meteorite was the complexity of amino acids and other organic compounds,” said Danny Glavin, senior scientist in the Astrobiology Analytical Laboratory at NASA’s Goddard Space Flight Center in Greenbelt, Maryland, and co-author of the study.
Its diversity of amino acids and other organic compounds is, comparable to the Murchison meteorite, a nearly 100-kilogram carbonaceous chondrite that fell in Australia in 1969 and became the benchmark for extraterrestrial organic chemistry.
“It’s just more proof that the chemical building blocks of life could have been delivered — and are still being delivered — to Earth today by these carbonaceous asteroid fragments,” said Glavin, who was a co-investigator on OSIRIS-REx, leading an international team that studied the organic composition of the samples delivered to Earth from asteroid Bennu in 2023.
Understanding the Hillsborough meteorite required expertise from multiple scientific disciplines.
Astronomers reconstructed the meteorite’s journey through space, finding evidence that it may have originated from the Erigone asteroid family in the inner asteroid belt, home to the asteroid Donaldjohanson, which was visited in 2025 by NASA’s Lucy spacecraft. Mineralogists identified evidence of ancient brines preserved within microscopic fractures, while organic chemists analyzed the meteorite’s inventory of amino acids and other organic compounds.
“Together, those complementary studies are helping scientists build one of the clearest pictures yet of how primitive asteroids such as the asteroid Erigone evolved chemically over billions of years,” said Jenniskens.
Researchers continue to study the Hillsborough meteorite, revealing new details about how water transformed primitive asteroids and shaped the early solar system.
By tracing the history of water on primitive asteroids, scientists are learning how water and the chemical ingredients for life were distributed throughout the early solar system.
“If you follow the water through the solar system, you’re actually following life,” Zolensky said. “Following the history of water through the solar system is an essential part of understanding the origin of life.”
For more information on NASA’s astromaterials research and exploration, visit:
NASA Transfers ‘Hundred Acre Wood’ to Patuxent Research Refuge
Following a ceremony on July 7, 2026, officials hold up a U.S. 250th pennant at “Area 400,” a 105-acre parcel previously part of NASA’s Goddard Space Flight Center in Greenbelt, Md., and now part of the U.S. Fish and Wildlife Service’s Patuxent Research Refuge.
NASA ceremonially transferred ownership of about 105 acres of wooded land at its Goddard Space Flight Center’s Greenbelt, Maryland, campus Tuesday to the adjoining Patuxent Research Refuge, managed by the U.S. Fish and Wildlife Service.
The property, formerly known as NASA Goddard’s Area 400, is now part of the largest block of unfragmented forest between Washington and Baltimore. The nearly 13,000-acre woodland is the nation’s only refuge specifically established to support wildlife research. The refuge also supports recreational uses, such as walking, biking, horseback riding, fishing, and hunting.
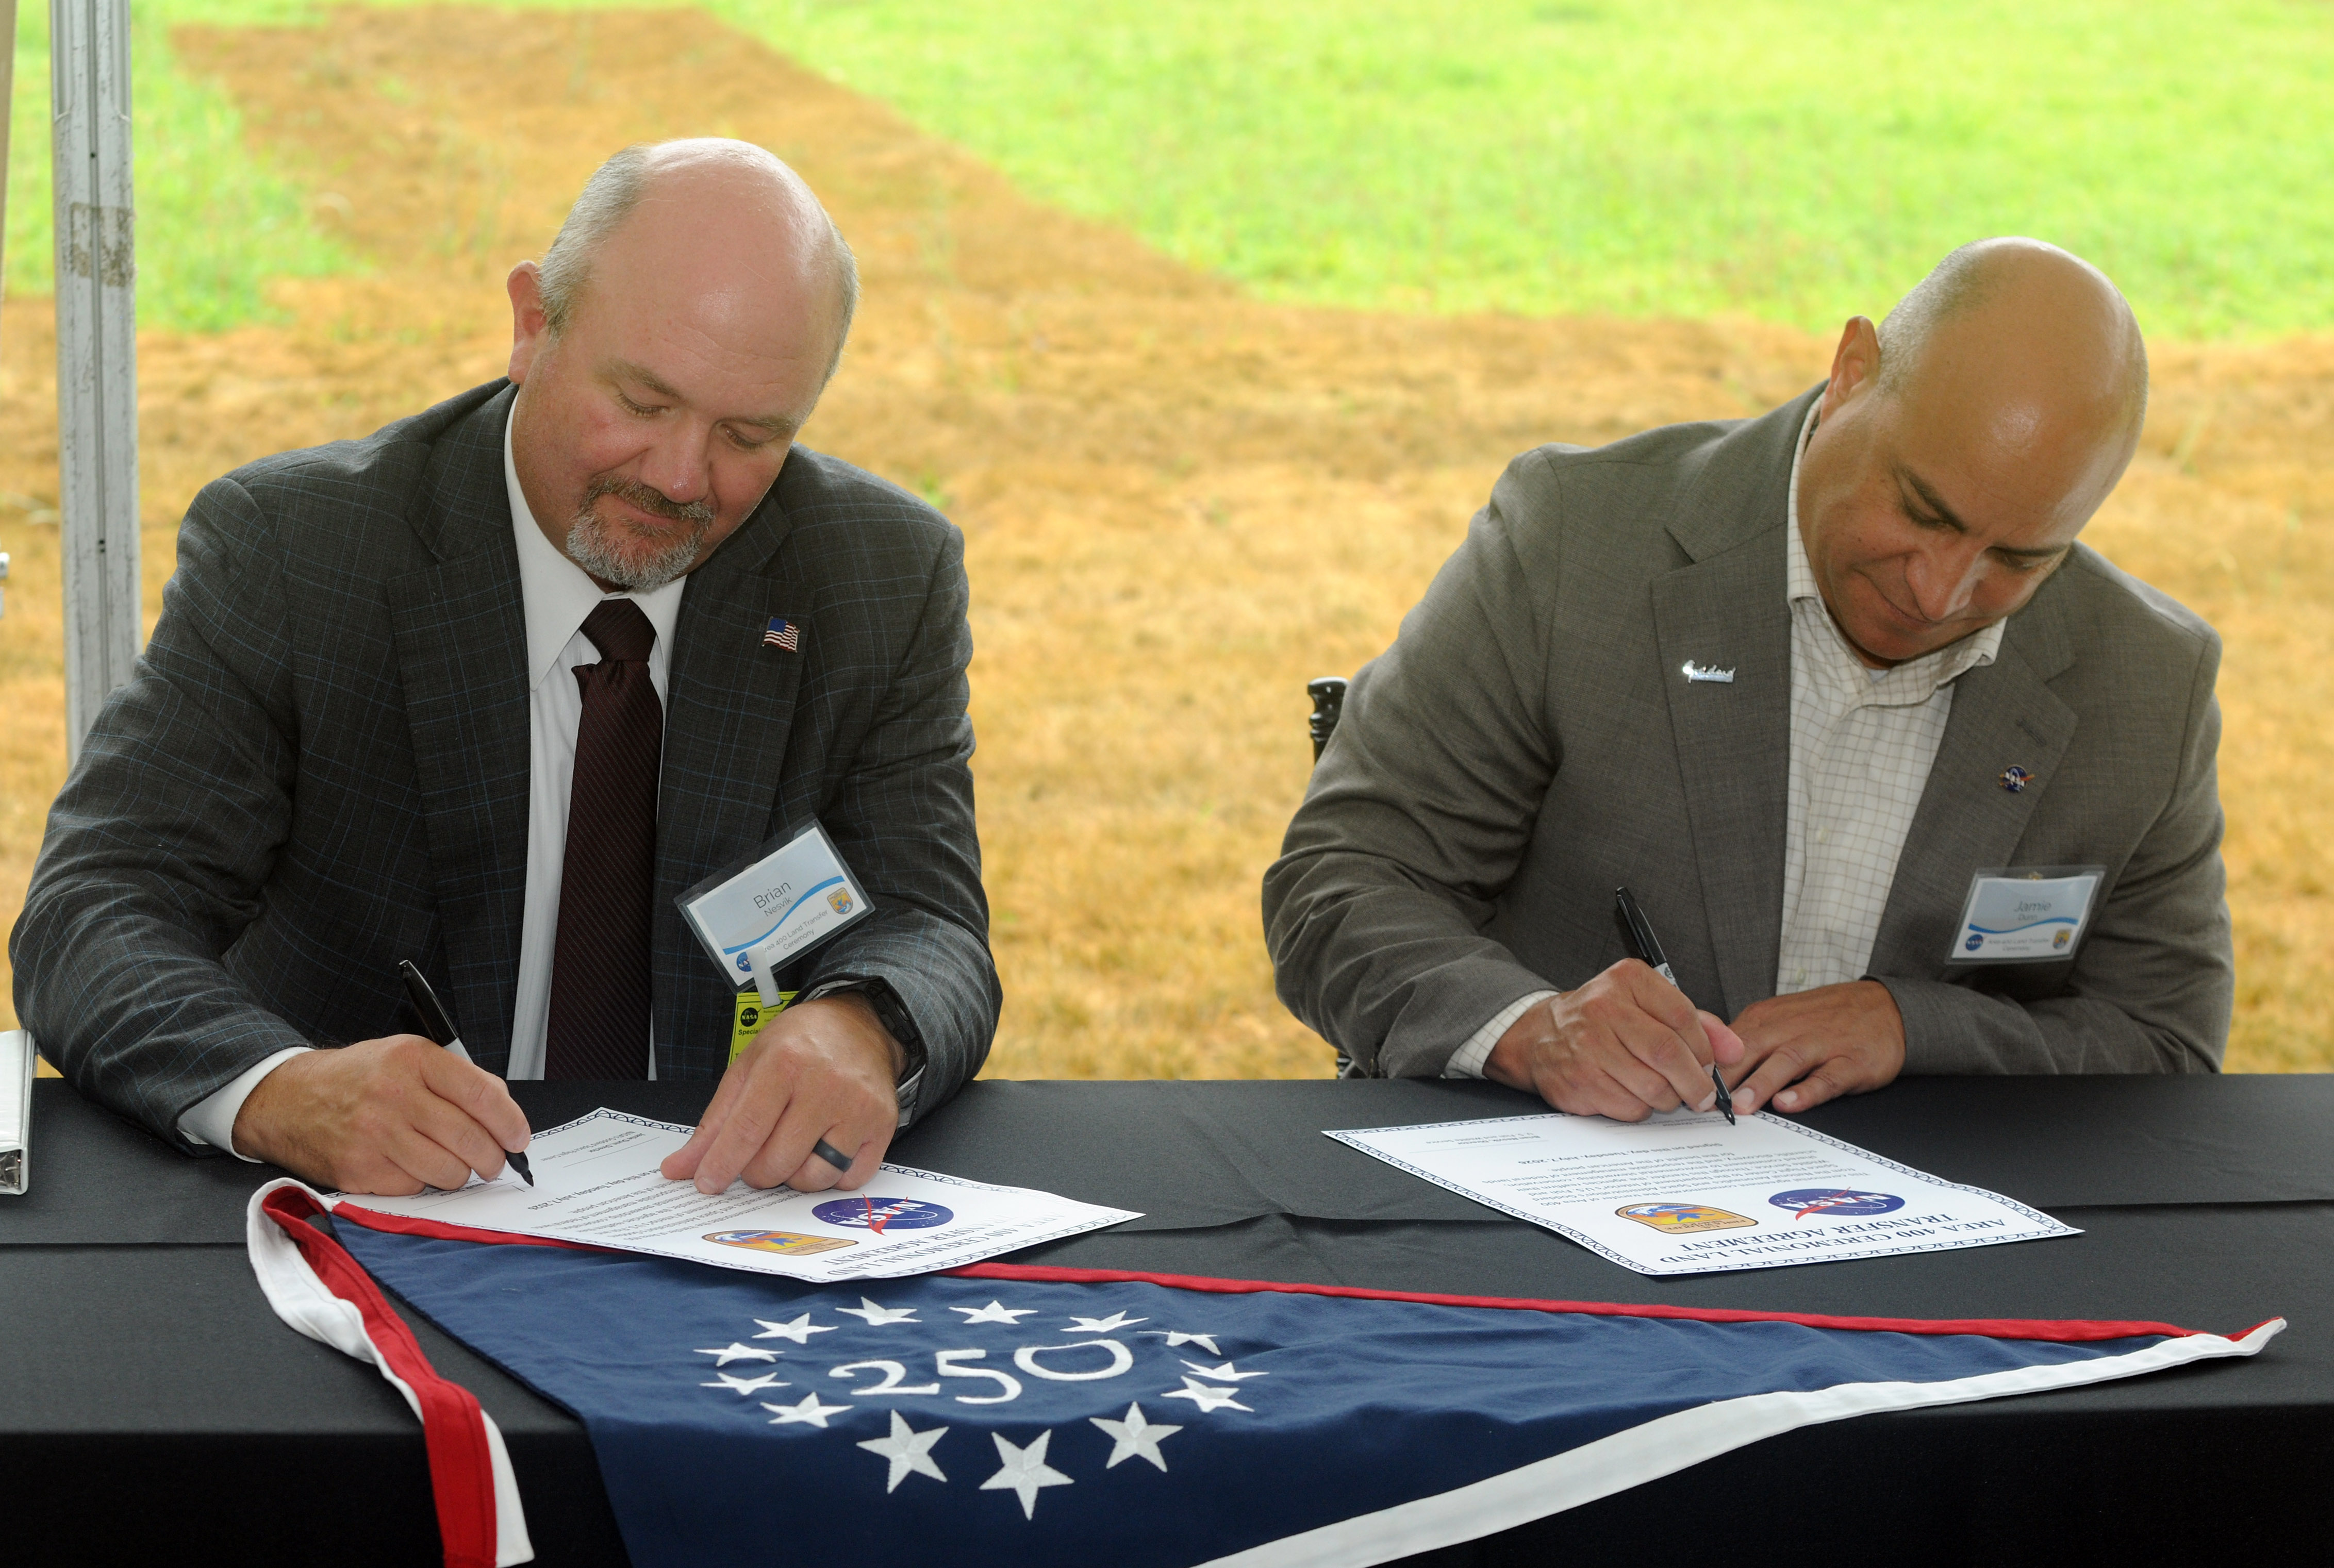
At a ceremony on July 7, 2026, U.S. Fish and Wildlife Service Director Brian Nesvik (left) and Jamie Dunn, center director, NASA’s Goddard Space Flight Center, Greenbelt, Md., sign certificates that ceremonially transfer a 105-acre parcel of property known as “Area 400” from NASA Goddard to the Service.
NASA
“For over six decades, NASA Goddard has helped shape humanity’s understanding of Earth,” said Jamie Dunn, center director, NASA Goddard. “We’re glad to present this land to our colleagues in the Fish and Wildlife Service, whose conservation and research helps do the real legwork in preserving our Blue Marble for future generations.”
NASA Goddard had used Area 400 for propellant research beginning in the 1960s. That work has largely since shifted to NASA facilities in other states or to commercial providers, and the property had long been a candidate for divestment. NASA and the Service began discussing a potential transfer in 2021.
Following remarks from attending dignitaries and the signing ceremony, assembled guests participated in a monarch butterfly release and milkweed seed dispersal.
NASA
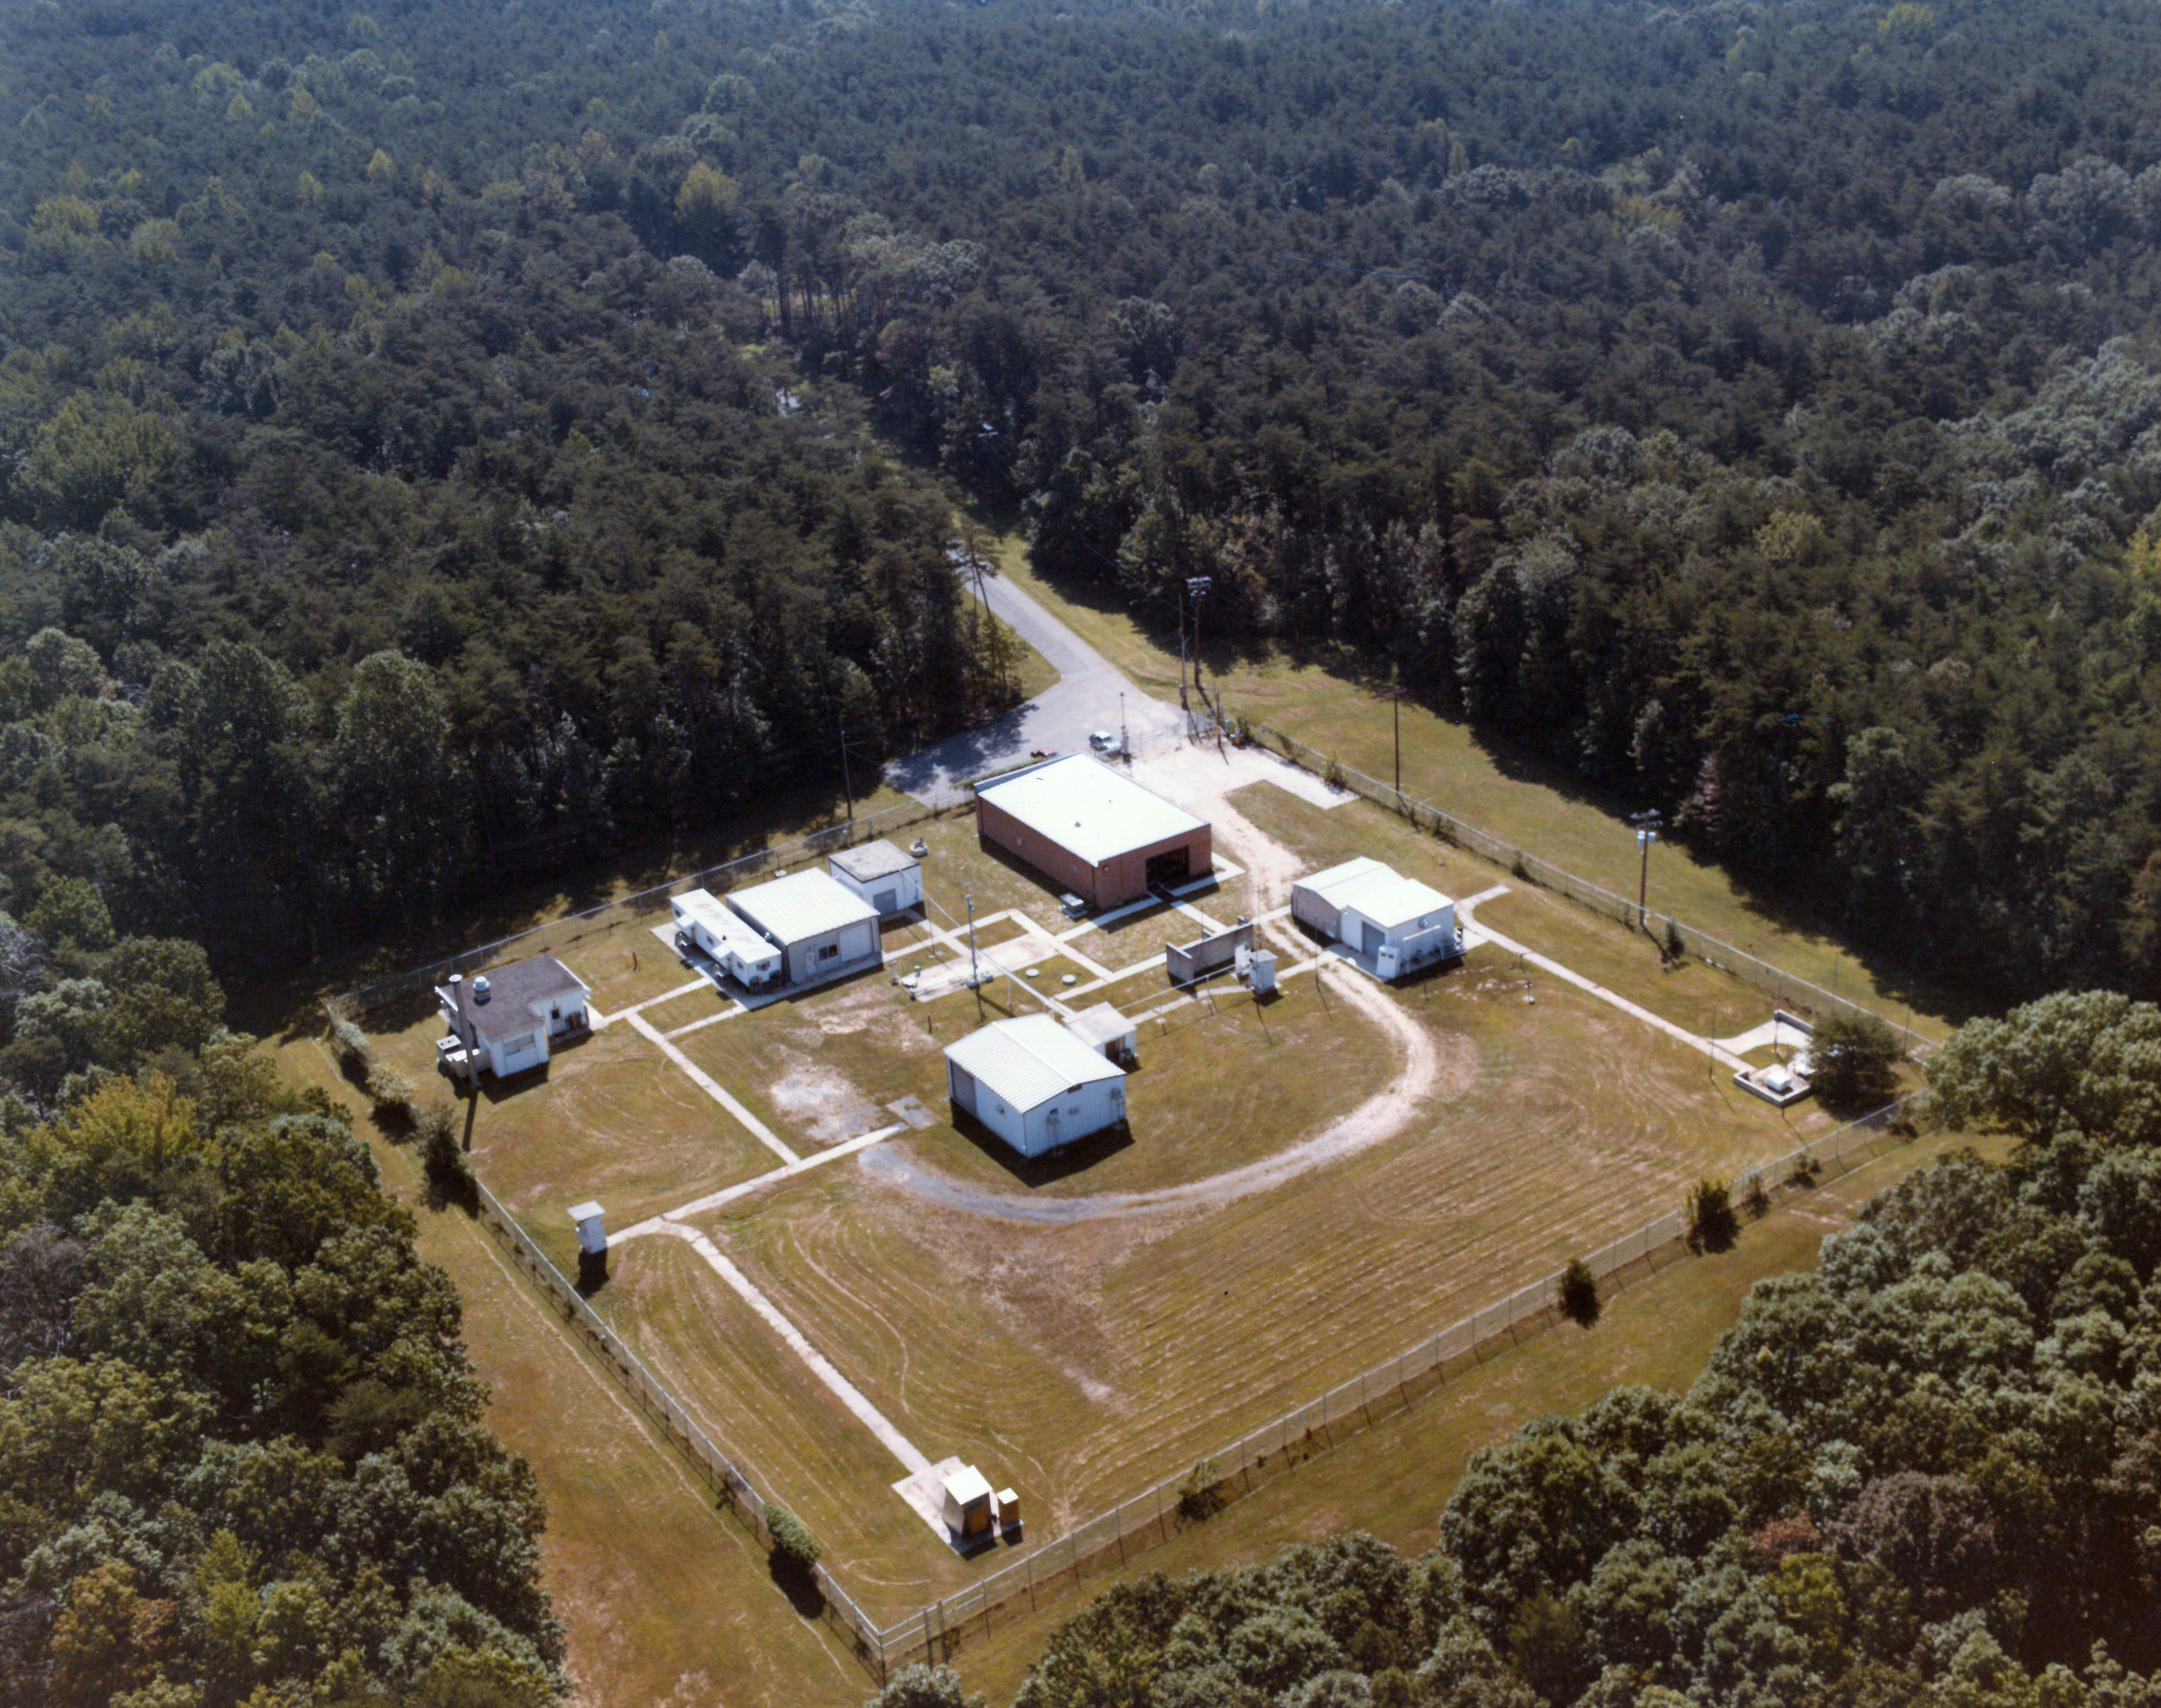
Prior to the transfer, Area 400 was still almost entirely wooded aside from a two-and-a-half-acre clearing with 11 small structures. The interagency transfer was effective on Feb. 23, and NASA recently completed its final closeout activities at the property, deconstructing the buildings, roadway, and utility service.
This aerial photograph shows Area 400’s appearance in 1984. The surrounding forest has remained largely unchanged since NASA Goddard occupied the property in the 1960s.
NASA
“Through working with partners on the best use of land, as exemplified with this land transfer, we can continue to conserve America’s natural beauty and expand outdoor recreation opportunities for future generations,” said U.S. Fish and Wildlife Service Director Brian Nesvik.
Media contacts:
Rob Garner News Chief, Office of Communications NASA’s Goddard Space Flight Center
Keith Shannon Regional Communications Lead – U.S. Fish and Wildlife Service Northeast Region U.S. Department of the Interior
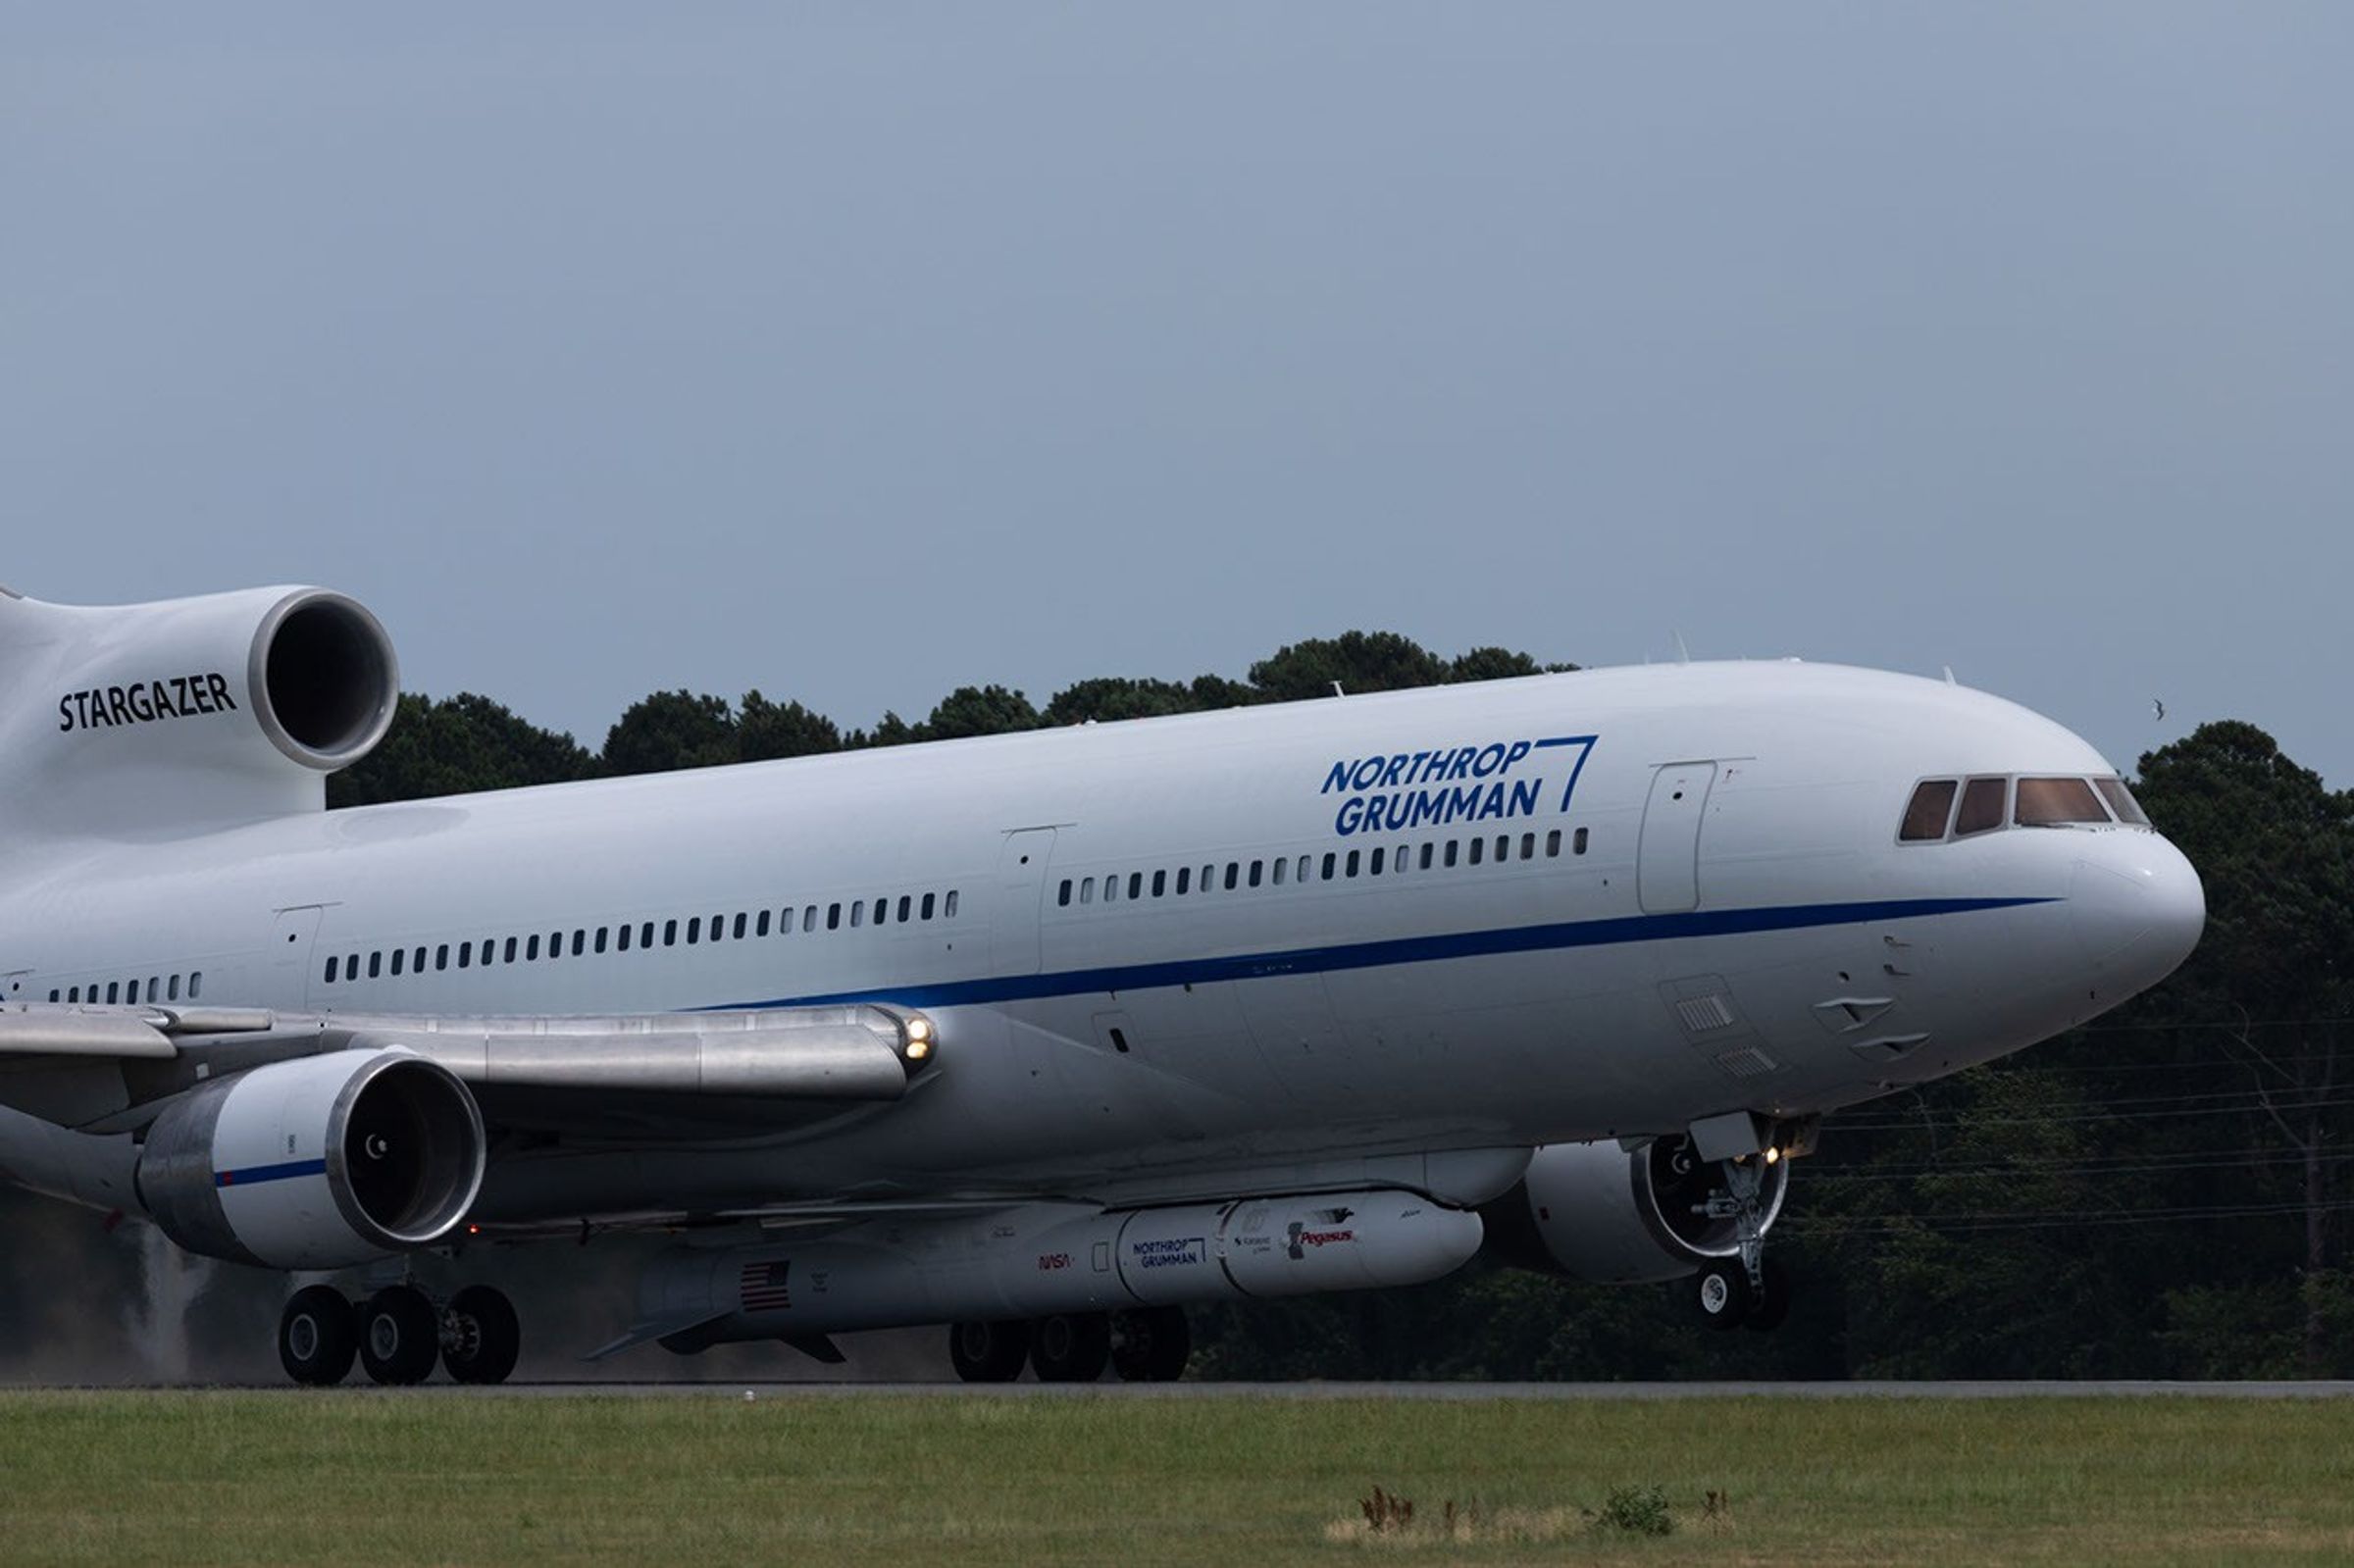
Northrop Grumman’s Stargazer took off Thursday, June 18, 2026, from NASA’s Wallops Flight Facility in Virginia. The modified L-1011 aircraft carried the company’s Pegasus XL rocket hosting LINK, a robotic servicing spacecraft from Katalyst Space. LINK will launch from the air-deployed Pegasus XL later this month on a mission to boost the orbit of NASA’s Neil Gehrels Swift Observatory.
NASA/Jeanette Kazmierczak
An airplane carrying a rocket loaded with a robotic spacecraft designed to raise NASA’s Neil Gehrels Swift Observatory departed the agency’s Wallops Flight Facility in Virginia on Thursday, June 18.
Stargazer, a modified L-1011 operated by Northrop Grumman, took off for Kwajalein Atoll, part of the Republic of the Marshall Islands in the South Pacific Ocean. Attached to the belly of the aircraft was one of the company’s Pegasus XL rockets with LINK inside.
NASA contracted Katalyst Space to design and build LINK to rendezvous and dock with Swift and lift it back to a higher altitude.
Spacecraft in low Earth orbit experience drag caused by our planet’s atmosphere, which gradually reduces their altitude if they do not have propulsion systems to counteract the effect.
Recent solar activity magnified this effect on Swift, which began to sink faster than anticipated.
Katalyst selected Northrop Grumman’s Pegasus XL launch vehicle as the best means of reaching Swift on a short timeline based on orbital and programmatic needs.
Stargazer will carry Pegasus and LINK to Kwajalein Atoll, part of the Republic of the Marshall Islands in the South Pacific Ocean with stopovers in California and Hawai’i.
NASA/Jamie Adkins
Later this month, Stargazer will carry the rocket to an altitude of around 40,000 feet before releasing it.
After several seconds in free-fall, Pegasus XL will fire the first of its three-stage rocket motors, delivering LINK into orbit in about 10 minutes.
Even small asteroids lead complex lives. During its flyby of the asteroid Donaldjohanson last year, NASA’s Lucy spacecraft revealed the asteroid to be a wobbly, peanut-shaped body that has undergone a lot of activity in its relatively short history. Formed as fragments coalesced after a violent collision 155 million years ago, the asteroid was transformed by the small but inexorable force of the Sun’s radiation, all while retaining signs of the brief presence of liquid water in its distant past.
Zooming through the main asteroid belt toward one of the Jupiter Trojan asteroid groups, the Lucy spacecraft collected the first close-up images and other data at Donaldjohanson on April 20, 2025, as it passed 650 miles away from the asteroid. The data revealed that, instead of spinning simply around one axis like most other asteroids and planets, Donaldjohanson has a more complicated two-axis rotation. Scientists also saw Donaldjohanson’s peanut shape and the craters and ridges on its surface.
A timelapse video made from images taken by NASA’s Lucy spacecraft as it approached the asteroid Donaldjohanson on April 20, 2025. The L’LORRI (Lucy Long Range Reconnaissance Imager) instrument, the spacecraft’s high-resolution black-and-white imager, collected these images over two hours as the spacecraft rapidly closed in on the asteroid from an initial separation of more than 58,000 miles (93,000 km), until the spacecraft passed a mere 650 miles (1000 km) from the 5-mile- (8 km-) wide asteroid.
NASA/Goddard/SwRI/JHU-APL
Lucy’s encounter with the asteroid was planned as a dress rehearsal for the spacecraft and mission team before its primary asteroid encounters, which begin with Lucy’s flyby of the Trojan asteroid Eurybates on Aug. 12, 2027. The instruments performed as expected, and, as a bonus, scientists got a rare opportunity to study a previously unexplored asteroid up close and to compare it to two asteroids with similar compositions but different histories: Bennu, the target of NASA’s OSIRIS-REx sample-return mission, and Ryugu, the site of JAXA’s (Japan Aerospace Exploration Agency) Hayabusa2 sample-return mission.
With Earth-based telescopes, observers saw fluctuations in the light Donaldjohanson reflects, regular patterns of peaks and valleys, typical of an elongated object rotating once every 10.5 Earth days. But Lucy’s data revealed another pattern: Donaldjohanson appears to be rotating like a wobbly top. Paper authors reported that the asteroid rotates end-over-end once every 10.5 Earth days, and wobbles back and forth around its long axis once every 26.5 days.
The asteroid Donaldjohanson is shown slowly rotating in a tumbling, non-principal axis motion, with its angular momentum vector and rotation axes indicated. The surface is colored by gravity slope, which measures the angle between the local surface and the direction of gravity. Higher values (warmer colors) indicate steeper terrain relative to the local gravitational pull. Regions with limited stereo image coverage have been masked out where the shape model is less well constrained.
Kel Elkins/NASA’s Science Visualization Studio/DLR
Peanut shape
While the Earth-based observations hinted at Donaldjohanson’s elongated shape, the Lucy flyby revealed a “bilobate” structure: two lobes connected by a neck, like a peanut. These lobes are likely two fragments from an asteroid collision that gently came together afterward by their mutual gravity.
Donaldjohanson likely rotated at least 10 times faster when it formed, having slowed to its current rate in the last 20 to 60 million years, the team estimates. As it slowed, the balance between the centrifugal force pushing things apart and gravity pulling things together changed and loose rocky material slid down slopes creating the worn-down appearance of many craters, as the flyby images showed.
The paper’s authors say that the asteroid’s slowing rotation is likely caused by a subtle consequence of solar heating known as the YORP effect. Each part of the asteroid’s Sun-warmed surface radiates heat away as infrared light, and that radiation imparts a tiny recoil force to the surface. Because the asteroid’s shape isn’t symmetric, this results in a net torque, or twist, that can change the asteroid’s rotation. Thus, YORP can slow asteroid spins down or speed them up, as in the case of Bennu (once every four hours) and Ryugu (once about every seven hours), which both likely used to rotate much slower than they do today.
Fleeting water
As it passed by Donaldjohanson at 30,000 mph, Lucy recorded the signatures of iron-rich clay minerals on the surface. These clays must have formed in the distant past with the help of liquid water. However, the exposure must have been brief, Lucy scientists concluded, because iron in clays tends to be replaced with other elements, such as magnesium, as water lingers.
Indeed, scientists saw magnesium-rich clays at Bennu and Ryugu, which suggested prolonged water exposure, perhaps lasting millions of years, when they were still part of larger asteroids.
This difference in water exposure history, and other characteristics, may mean that the parent bodies of these asteroids formed at different times or in different regions of the solar system before relocating to the main belt.
Compare, contrast
Donaldjohanson is thought to be made from rocky remnants of a larger, carbon- and water-rich asteroid that collided with another object in the main asteroid belt. Bennu and Ryugu are thought to have formed in the same way and in the same region.
But Donaldjohanson is different. At 155 million years old, it is much younger than Bennu and Ryugu, which formed 1 to 2 billion years ago. Donaldjohanson also has remained in the asteroid belt since birth, while its wandering cousins migrated into orbits around the Sun that bring them close to Earth’s orbit about once a year (which made them perfect close targets for sample return missions).
During its April 20, 2025, encounter with the main-belt asteroid Donaldjohanson, NASA’s Lucy spacecraft discovered evidence for iron-rich clays on the surface using its infrared spectrometer. These clays, which are similar to those found in carbon-rich meteorites such as QUE 97990, indicate that water was briefly present in the asteroid during the distant past.
NASA/Goddard/SwRI/Dan Gallagher
“It’s helpful for scientists to compare Donaldjohanson with asteroids like Bennu and Ryugu, which are seemingly similar asteroids, because every subtle difference is another clue to our origin story,” said Simone Marchi, Lucy deputy principal investigator and lead author of the study at the Boulder, Colorado, office of the Southwest Research Institute.
“Once we start learning more about the Trojans, a completely different population of space rocks with very different histories, our understanding of solar system formation is destined to be challenged,” said Marchi.
Named after a fossilized skeleton of a human ancestor discovered in Ethiopia in 1974, NASA’s Lucy will be the first mission to explore Jupiter’s Trojan asteroids, a population of well-preserved space rocks that formed early in our solar system’s history and could help scientists understand how the planets formed and moved around before settling in their current configuration.
Lucy’s principal investigator is based out of the Boulder, Colorado, branch of Southwest Research Institute, headquartered in San Antonio. NASA’s Goddard Space Flight Center in Greenbelt, Maryland, provides overall mission management, systems engineering, and safety and mission assurance. Lockheed Martin Space in Littleton, Colorado, built the spacecraft. Lucy is the 13th mission in NASA’s Discovery Program. NASA’s Marshall Space Flight Center in Huntsville, Alabama, manages the Discovery Program for the agency’s Science Mission Directorate in Washington.
For more information on NASA’s Lucy mission, visit:
Zooming through the main asteroid belt toward one of the Jupiter Trojan asteroid groups, the Lucy spacecraft collected the first close-up images and other data at Donaldjohanson on April 20, 2025, as it passed 650 miles away from the asteroid. The data revealed that, instead of spinning simply around one axis like most other asteroids and planets, Donaldjohanson has a more complicated two-axis rotation. Scientists also saw Donaldjohanson’s peanut shape and the craters and ridges on its surface.
This NASA Hubble Space Telescope image features a swarm of galaxies in the galaxy cluster called CL0016+1609 or MACS J0018.5+1626.
NASA, ESA, H. Ebeling (University of Hawaii), D. Coe (STScI, ESA, JWST); Image Processing: G. Kober (NASA/Catholic University of America)
This NASA Hubble Space Telescope image features a galaxy cluster, called CL0016+1609 or MACS J0018.5+1626, that is very bright at X-ray wavelengths and is one of the most extensively studied clusters at X-ray and radio wavelengths. The X-ray observations of this cluster revealed that it is two clusters merging along our line of sight.
Researchers requested time to observe CL0016+1609 with Hubble’s Advanced Camera for Surveys because that data would help them accurately measure the cluster’s dark-matter distribution, which helps them study the merger and the role of CL0016+1609 in the large-scale structure of the universe. Hubble can’t directly see dark matter, but its infrared and visible light observations can detect dark matter’s gravitational lensing effects on the normal matter Hubble observes.
The data in this image also includes observations with Hubble’s Wide Field Camera 3 taken as part of an observing program that obtained the first Hubble infrared images of 46 massive galaxy clusters and looked for distant galaxies gravitationally lensed by these clusters. Called RELICS (Reionization Lensing Cluster Survey), this survey found some 300 high-redshift candidate galaxies lensed by these clusters.
You can see the faint vertical arc of one of these distant galaxies in the image above. Look for it just to the left of the large elliptical galaxies in the center of the image. Another brighter, though shorter arc is visible just above and to the right of the large elliptical galaxies in the center of the image.
NASA’s Fermi Mission Uncovers Possible Sibling Supernova Remnants
A new study of two supernova remnants, the debris left behind after stars explode, suggests the explosions came from stellar siblings that once orbited each other. The first star’s detonation sent its binary companion hurtling through space, and then, after traveling for thousands of years, the surviving star blew up too.
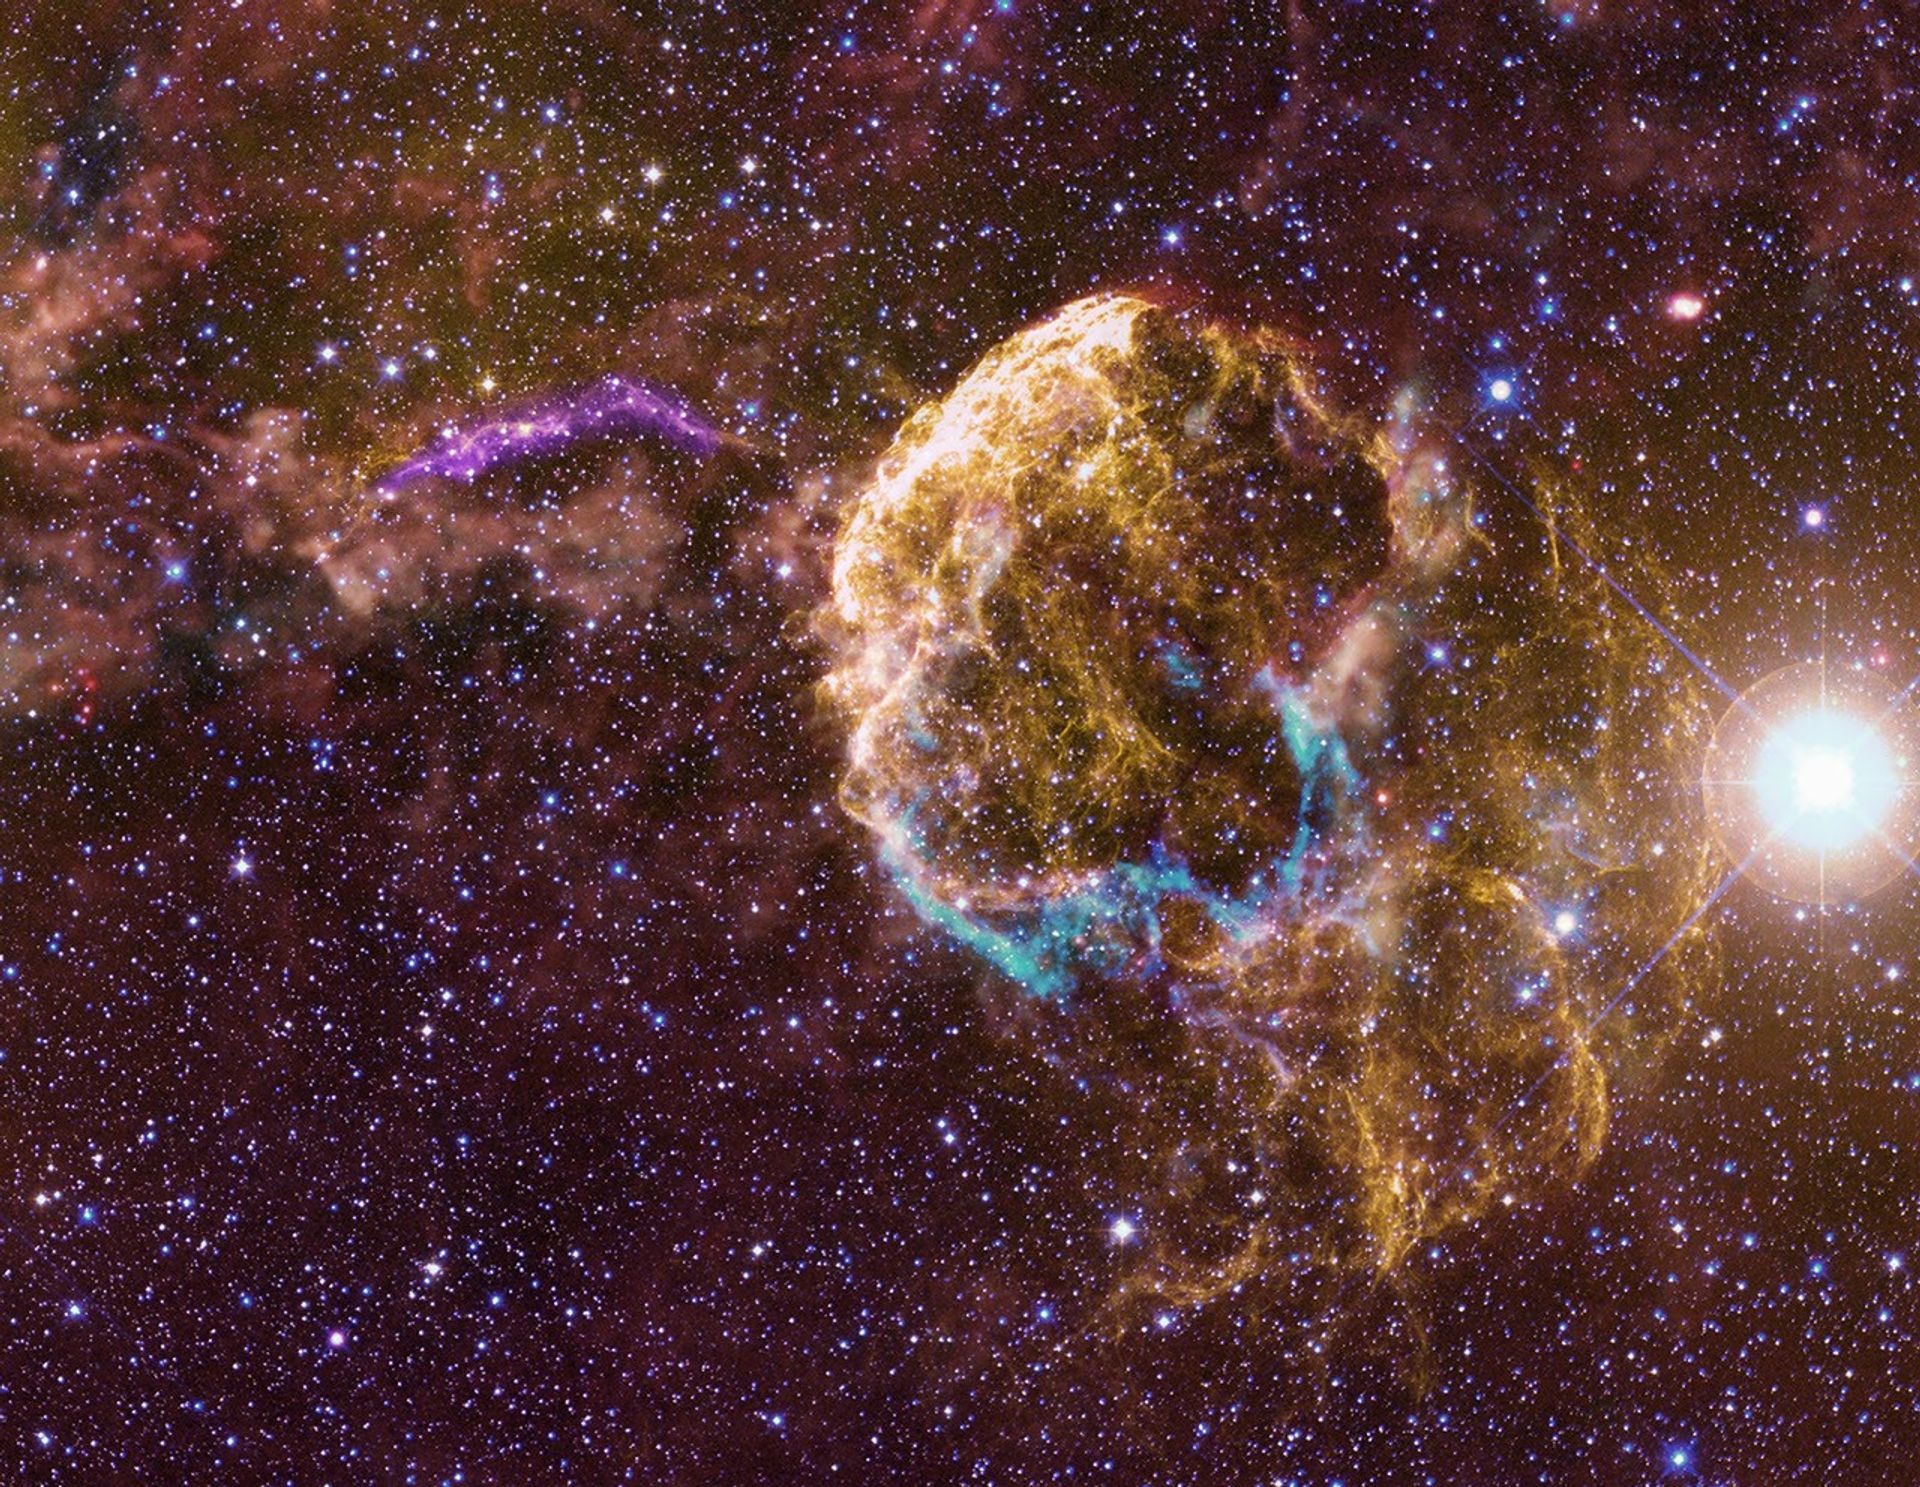
This multiwavelength scene shows the Jellyfish Nebula supernova remnant (right), the interstellar cloud it’s interacting with, and a distinctive curving filament to its upper left. The filament, which is shown here both in optical and ultraviolet (UV) light, is the visible part of an overlapping supernova remnant, G189.6+3.3, that is more prominent in radio and X-rays. Visible light is shown in yellow, UV from NASA’s Neil Gehrels Swift Observatory is shown in violet, and infrared light from NASA’s retired WISE (Wide-field Infrared Survey Explorer) mission appears in cyan, red, and orange. Both remnants are located about 6,000 light-years away in the constellation Gemini. The brilliant star at far right is Propus, also known as Eta Geminorum.
NASA Goddard Space Flight Center and M. Michailidis et al. 2026; optical: DSS; infrared: NASA/WISE/JPL-Caltech/UCLA; ultraviolet: NASA/Swift
“Using 16 years of data from NASA’s Fermi Gamma-ray Space Telescope, our analysis uncovered gamma rays associated with a supernova remnant that was hidden in the glare of its neighbor, the Jellyfish Nebula, one of the brightest gamma-ray-emitting supernova remnants known,” said Miltiadis Michailidis, a postdoctoral fellow in the physics department at Stanford University in California. “There are so many striking connections between the two remnants that we conclude they’re likely related, giving us the first known example of a binary system where both stars have undergone supernova explosions.”
Michailidis presented the findings Wednesday at the 248th meeting of the American Astronomical Society in Pasadena, California. A paper describing the results will appear in a future edition of Nature Communications.
The study focused on a faint supernova remnant called G189.6+3.3, which is mainly visible in X-rays. It is upstaged by its brighter and better-known neighbor, the Jellyfish Nebula (IC 443). The two star wrecks, both located in the constellation Gemini, appear to partially overlap as seen in X-rays. Recent X-ray evidence suggests that hot plasma likely associated with G189.6+3.3 may extend across the entire region, a hint that the overlap may be nearly total.
A massive star explodes when its energy-producing core runs out of fuel and collapses under its own weight, triggering an explosion that blows the star apart. The explosion’s shock wave encloses a hot cloud of debris that rapidly expands into space. So far, astronomers have cataloged about 300 supernova remnants in our galaxy.
The Fermi mission is part of NASA’s fleet of observatories monitoring the changing cosmos to help humanity better understand how the universe works. More than a decade ago, observations from Fermi’s LAT (Large Area Telescope) showed that the shock waves of supernova remnants accelerated particles to within a fraction of the speed of light, a process first proposed by physicist Enrico Fermi — the mission’s namesake — in 1949.
These high-speed particles, called cosmic rays, interact with interstellar gas to produce gamma rays, the highest-energy form of light. Protons make up 99% of cosmic ray particles. To prove that accelerated protons are responsible for the glow, astronomers search for a specific gamma-ray feature. When cosmic-ray protons smash into interstellar gas, they produce a short-lived particle called a neutral pion, which almost immediately decays into a pair of gamma rays. This emission occurs within a specific band of energies associated with the neutral pion’s mass and lies within the range detected by Fermi’s LAT instrument.
In 2013, Fermi observations proved that the Jellyfish Nebula, which is interacting with part of a glowing cloud of hydrogen gas known as Sharpless 249, produced gamma rays through this mechanism. Its neighbor, G189.6+3.3, was discovered in 1994 as part of an X-ray survey by the German-led ROSAT (Roentgen Satellite) mission.
A bright filament of gas lies between the overlapping remnants. New observations of this feature reveal that the shock wave from G189.6+3.3 slammed into dense interstellar gas there and dramatically slowed, key evidence that both remnants are interacting with the same cloud system.
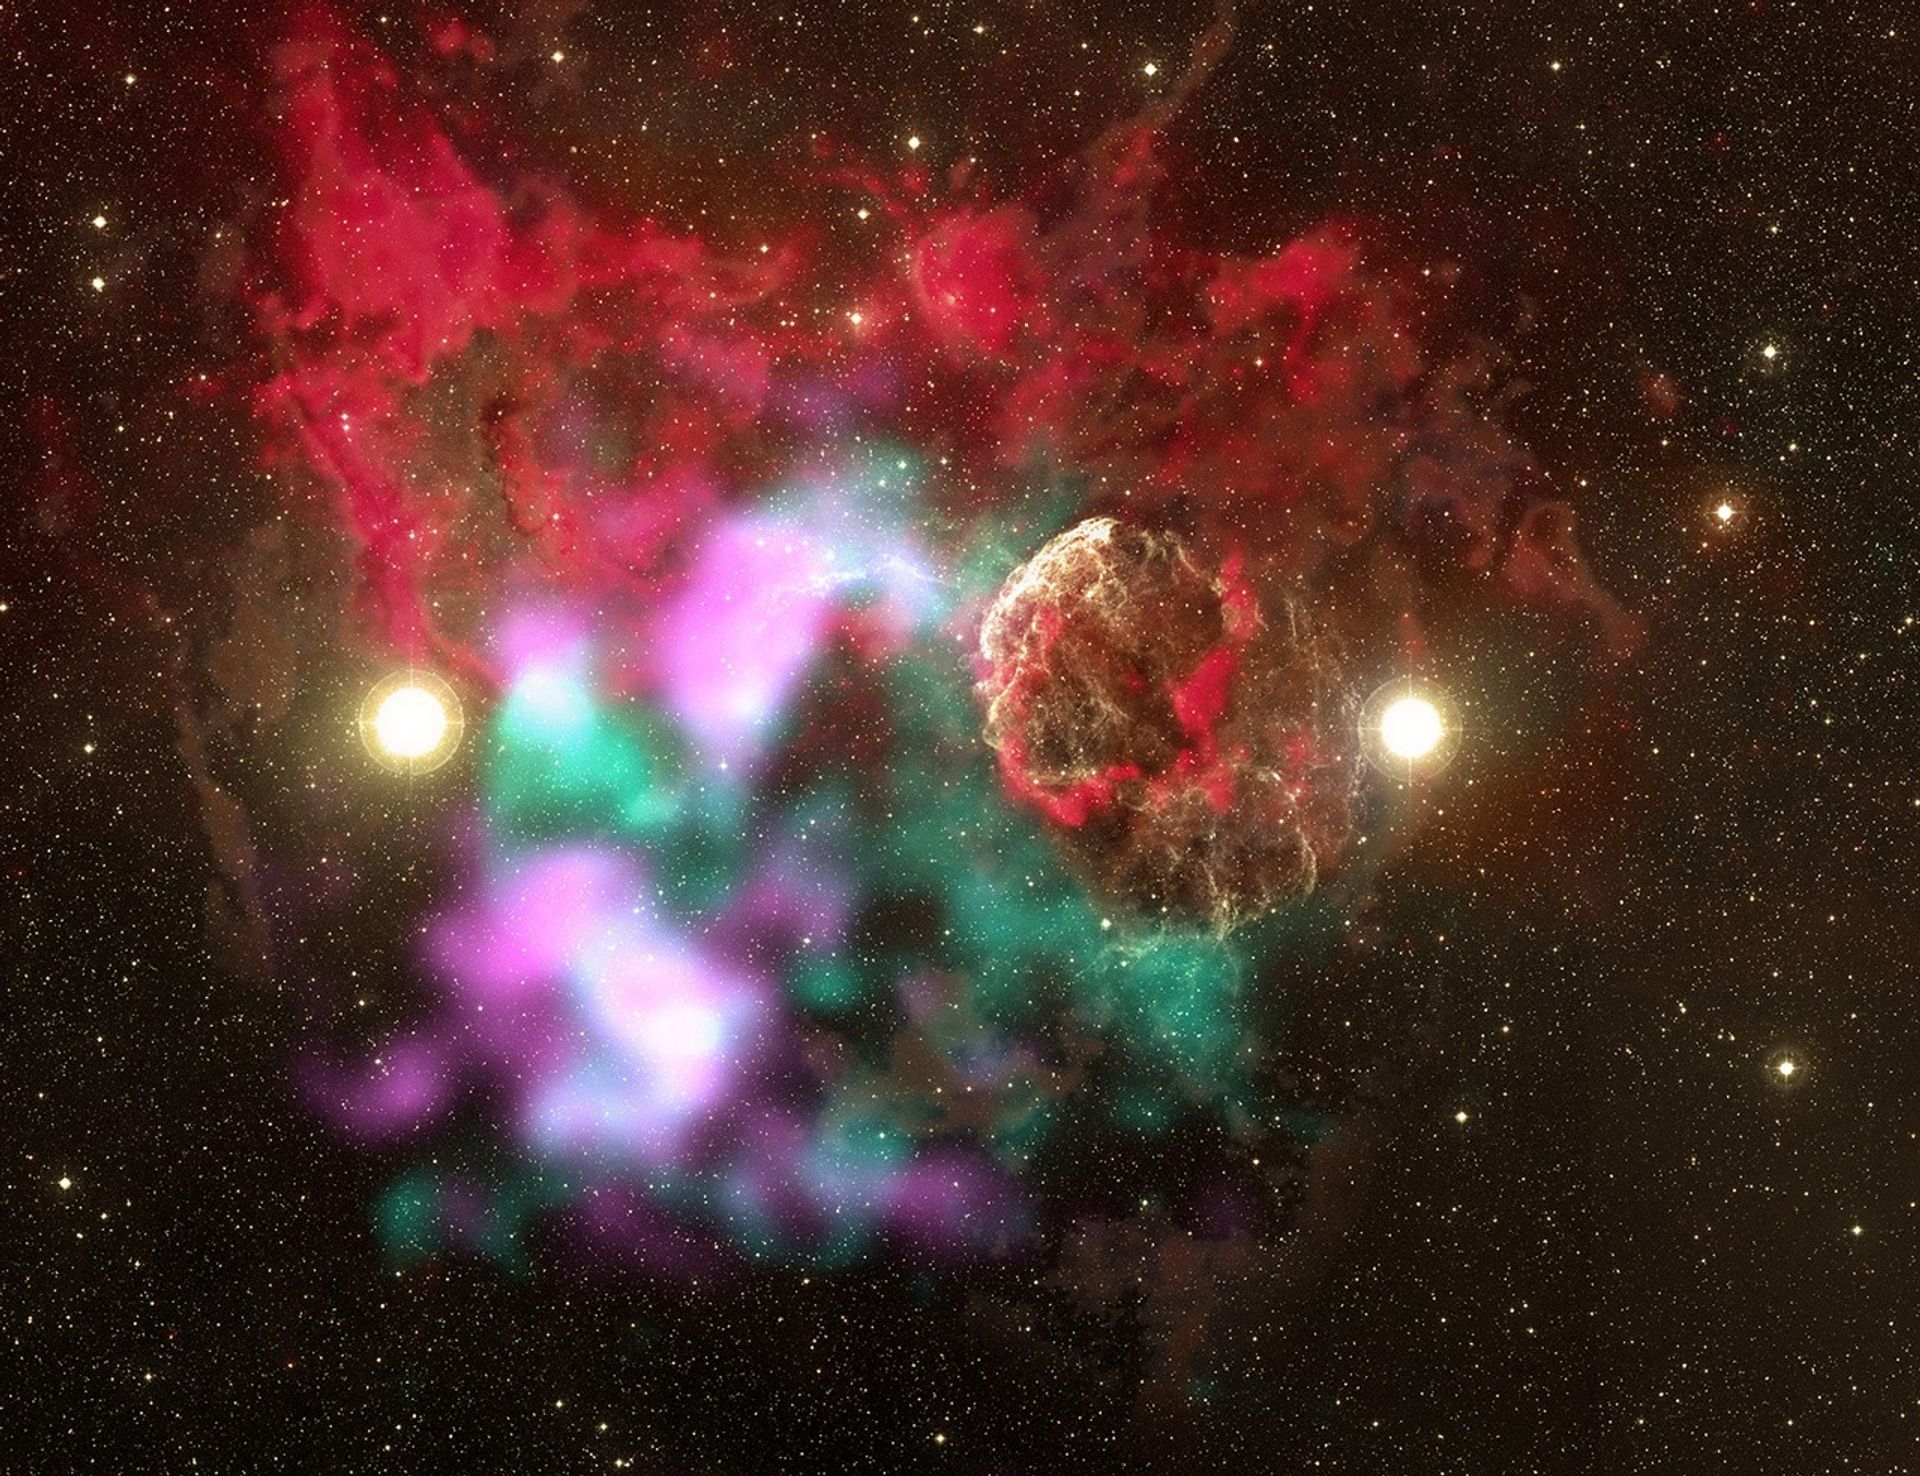
The well-known supernova remnant IC 443 (right) has an older, fainter neighbor (shown here in blue-green and magenta) called G189.6+3.3. A filament of gas between them, glowing in visible and ultraviolet light (violet arc at center), traces the neighbor’s shock wave and shows that both remnants are interacting with the same molecular cloud, shown in red, orange, brown for infrared and radio data and yellow for visible light. Blue-green shows X-rays from the fainter remnant, while magenta shows gamma rays with energies greater than 10 billion electron volts; for comparison, visible light has energies between about 2 and 3 electron volts. In this view, high-energy light from the much brighter IC 443 has been removed for clarity. Gamma-ray emission near the filament stems from protons accelerated in the supernova’s shock wave as it expands into the cloud.
NASA Goddard Space Flight Center and M. Michailidis et al. 2026; radio, MWISP and ESA/Planck; infrared: NASA/WISE/JPL-Caltech/UCLA; optical: DSS; ultraviolet: NASA/Swift; X-ray: SRG/eROSITA; gamma ray: NASA/DOE/Fermi LAT Collaboration
Astronomers think the Jellyfish Nebula is also a candidate PeVatron, a cosmic particle accelerator capable of boosting protons to energies so high they could nearly escape our galaxy. Such particles can produce gamma rays with trillions of times more energy than visible light. Finding a second particle accelerator near the Jellyfish Nebula could offer scientists new clues for how supernova remnants develop into PeVatrons.
“The overlapping remnants, a connecting gas filament, and the availability of data from Fermi and other facilities motivated us to delve into this complex but little-studied region,” said co-author Marianne Lemoine-Goumard, an astrophysicist at the French National Centre for Scientific Research (CNRS) based at the University of Bordeaux. “With Fermi’s LAT instrument, we found gamma-ray emission associated with accelerated protons in the northern part of the fainter remnant. If both remnants are interacting with the same structure, then they must share a common distance from us.”
The team concludes the remnants lie about 6,000 light-years away, their explosion centers are separated by roughly 40 light-years projected onto the plane of the sky, and the original stars may have been 20 or more times the Sun’s mass.
Estimates of the remnants’ ages vary widely, but the team concludes that the age of the Jellyfish Nebula is 8,000 to 9,000 years, while G189.6+3.3 is between 20,000 to 110,000 years old. This means the delay between the explosions could have extended for up to 100,000 years.
In addition, the team conducted computer simulations of a million massive binary systems. They show that systems where the stars orbit close enough to exchange matter and interact during their lives can readily produce dual supernova explosions with similar separations and time delays as those found for the remnants. The team also estimated that the chance of randomly encountering this combination of observed spatial alignment and compatible distances to be less than 1%, strongly supporting a physical association.
“The evidence we’ve compiled — including observations across the spectrum, the chemical and physical properties of the remnants, simulations, and more — paints a compelling picture of a dual supernova event,” said Michailidis.
This study identifies a unique possible example of a binary system where both stars exploded as supernovae and left behind separate, detectable supernova remnants. Astronomers think that most massive stars form in binary or multiple-star systems. The Jellyfish Nebula/G189.6+3.3 complex offers astronomers a rare opportunity to study how massive binary stars evolve, exchange matter, explode, and experience velocity changes — called kicks — induced by the supernova blast. It also provides a powerful new laboratory for understanding how coupled supernova remnants behave, including how they accelerate particles, generate gamma rays, and shape their surrounding environments.
“Fermi’s gamma-ray observations of supernova remnants continue to reveal the dynamic lives of stars,” said Elizabeth Hays, the Fermi project scientist at NASA’s Goddard Space Flight Center in Greenbelt, Maryland. “We can now connect the glowing remains of two massive stars to a powerful pair that evolved together over thousands of years.”

 Login