Smoke from wildfires across Canada travels across both Canada and the U.S. in this satellite image captured by NOAA-21 on July 14, 2026. (Image credit: NASA Earth Observatory/Lauren Dauphin)
The wildfires tearing across Canada are so extreme that the smoke billowing upward can be seen from space.
What is it?
Over 850 wildfires are currently devastating Canada, as reported by theCanadian Interagency Forest Fire Center. The fires are spreading across Manitoba, Saskatchewan and Ontario; most remain completely uncontrolled.
In addition to the immense destruction caused by the fires themselves, the smoke from these fires is causing serious concerns about dangerously poor air quality all across Canada and even in the northeastern United States. As far as New York, the air quality on Thursday (July 16) was labeled "very unhealthy" after the state activated emergency air quality protocols.
The smoke is so expansive it's clearly visible in this image captured on July 14 from Earth orbit.
Why is it noteworthy?
Studying wildfires and wildfire smoke from orbit can give us a bigger picture view of these catastrophic event. This data is important for disaster relief in the short term — but also in the long-term. With climate change continuing to progress due to human activities like burning coal for cheap power, we can expect natural disasters to worsen. Among the many effects of climate change, this includes longer and more intense wildfire seasons, especially in regions that are already susceptible to fire such as these regions across Canada.
The new image was captured by the NOAA-21 satellite with the instrument VIIRS (Visible Infrared Imagine Radiometer Suite). You can see massive plumes of smoke over southeastern Canada treading into the northeastern U.S. Thick smoke covers swaths of Canada's landscape and wisps of smoke trail all the way down through New York and across the U.S.
Most of this smoke, at least the smoke we can see in this satellite image, is coming from wildfires in northwestern Ontario. As the wildfires continue to burn, satellites like NOAA-21 will be keeping watch.
Antarctica’s first ice sheet may have begun with a geological head start hidden deep beneath the continent. Millions of years before thick ice spread across the Northern Hemisphere, forces inside Earth lifted East Antarctica into a vast region of mountains and plateaus. The higher terrain became cold enough to preserve snow even when the planet [...]
A new study shows how changes in ocean circulation could reshape global rainfall patterns. A storm reaching California can begin with changes thousands of miles away in the Atlantic Ocean. Climate modeling suggests that as one of the planet’s major ocean circulation systems weakens, more moisture could be directed toward the West Coast while snowfall [...]
Glaciers flow across the Himalaya, as seen from the International Space Station. (Image credit: NASA/Jessica Meir)
Towering glaciers flow down the Himalayas' northern slopes like icy giants cascading onto China's Tibetan Plateau.
What is it?
Back in May, from aboard the International Space Station 259 miles (417 kilometers) above Earth, NASA astronaut Jessica Meir peered out the station's windows with her camera and captured a breathtaking sight.
In that fleeting moment from space, she captured the northern slopes of the Himalaya mountains stretching into China. And atop the mountains, slow-moving rivers of glacial ice carve their way downhill.
This view shows the enormity of this mountain range, which separates Nepal from China's Tibetan Plateau. The Himalayas have the highest mountains in the world, including Mount Everest, with over 110 mountain peaks surpassing 24,000 feet (7,300 meters) of elevation above sea level. Ranging across five countries (Nepal, India, China, Bhutan and Pakistan) the mountain range is about 1,500 miles (2,400 kilometers) wide.
Why is it incredible?
With the range being so incredibly expansive, this view from space offers a unique vantage point from which we can see a large swath of the mountains in motion. Even in a helicopter, you would get a fairly localized view of individual mountains in the Himalayas. This view provides a striking scene that you cannot see from the surface of our planet.
This view is also a reminder of how important space is in our evolving understanding of climate change. As our planet continues to change and sea levels rise with warming temperatures, we can see glacial movement from space. This is an important resource to researchers fighting to better understand climate change so we can better fight it. With access to information about glaciers and how they melt, move and flow across the world, we can be better prepared to protect our planet and its inhabitants.
Extreme coastal flooding events are occurring far more frequently in our warming world than ever before, threatening countless communities that will only become more vulnerable as climate change intensifies.
A recent study found that once-in-a-century flooding events now strike on our planet about once a decade. The study, published June 10 in the journal Nature Climate Change, also found that human-driven climate change has quadrupled the frequency of coastal sea level extremes since 1900.
The findings were released alongside another study by a separate team, published in the journal Science Advances, that found human-caused sea level rise was clearly measurable at 97% of sites sampled around the world, and was responsible for around 58% of the observed daily extreme water level exceedances between 2000 and 2018. In other words, human activities are the primary drivers behind sea level extremes — which include storm surges, high tides and rising sea level anomalies.
As the ocean's potential to devastate coastal communities surges, Live Science spoke with Sönke Dangendorf, lead author of the Nature Climate Change study, to learn more about what's to come. Here's what he had to say.
Patrick Pester: How do you separate human-driven sea level rise from natural forces?
Sönke Dangendorf: The absolute basis for doing these kinds of investigations is to work with observations, but observations are unfortunately sparse. We have a few more than 100 tide gauges [distributed worldwide] that offer long, century-scale records of sea level change since the early 20th century. We see that sea levels are changing at those locations, but we cannot tell a whole lot about what is happening elsewhere. So, what we can do is use the same climate models that we use to produce future projections of sea level change.
If you compare observations with the models, then the models need to be able to reproduce what the observations have shown. That was the first step we did, and indeed we proved in this study that the climate models are capable of reproducing observed climate. The nice thing with climate models then is that if you are able to reproduce what has been observed, you can start doing experiments. For instance, you can keep greenhouse gases constant in the modeling and then assess the influence of natural climate variability on the changes that we have observed. That's what we did in the study.
We found that we have seen already a 12-fold increase on average globally in what used to be a once-in-100-year event in 1900. And when we do these forcing experiments, we have also seen that anthropogenic forcing [human-driven change], in particular since the 1970s, has become the dominant force.
PP: What does this mean for coastal communities around the world?
SD: A couple of centimeters of sea level rise doesn't sound like a whole lot in theory, but if you live along the coast, it hits you much harder than you might think. Just an example: I used to live along the U.S. East Coast in Norfolk, Virginia. The community was built along the water, and they used to be fine in the 1950s and 1960s; they wouldn't see flooding at all, or maybe just once every five or six years. But due to sea level rise, what happens now is that high tide leads to flooding. You see flooded streets, and that affects your commute, so people increasingly cannot make it to work.
It affects your daily life suddenly. And then it makes it very hard for you and your coastal community because you have increasing insurance costs — the accumulated costs of these events can easily be as much as a major hurricane making landfall. So, this is a daily experience that many people already have, and it's a direct impact of sea level rise.
With respect to what we assessed in these more extreme events, people may absorb a once-in-a-100-year event once in their lifetime. They may experience something like a Storm Sandy, and they may be able to recover from that, but if you think about recovering from that basically every eight years — the frequency of these events nowadays compared to 1900 — that's of course way more difficult and not feasible for many people.
PP: What can we do?
SD: We can adapt. The silver lining here is that we have shown humans are the dominant forcing factor behind these changes. That's the silver lining because it means if we react, we can do something about it.
The reaction to changes in climate is often delayed, so we have sea level rise that we are already committed to. For instance, if you look into projections, they all agree with respect to what happens until around 2060, independently of how much greenhouse gases are emitted. There's no way around that. We could stop emitting greenhouse gases today, and we would still experience it. So, we need to adapt to that sea level rise, but if we mitigate climate change, if we stop emitting greenhouse gases, then we can avoid dangerous sea level rise, and that's very important.
Flooding is becoming more severe and disruptive as our planet warms. (Image credit: Roberto Westbrook via Getty Images)
PP: What will the world look like in 2060 with the committed sea level rise?
SD: According to the last IPCC [Intergovernmental Panel on Climate Change] report, what used to be a once-in-a-100-year event in the present day will occur annually at 19% to 31% of tide gauge locations by 2050. So, at about a quarter of the locations, you will experience these once-in-a-100-year events annually, and that is something that is just mind-blowing.
The changes are happening much quicker in low-latitude locations. The reason is that in the tropics you typically have a less variable climate. You don't have these massive swings all the time. For instance, in the North Sea, we have a storm season, and we have huge tide ranges. We are already adapted to pretty massive changes of multiple meters, so a couple of centimeters of sea level rise do not play out that hard, but in the tropics, where it's more calm, it makes a huge difference.
As an analogy, think about two hurdle runners. You have one hurdle runner that's compared to the tropics; he jumps very consistently but always below the hurdle, so he never makes it over. Then you have another hurdle runner that's the North Sea type of guy. His jumps are very variable. Sometimes he's very high and makes it over that hurdle, but very often he also jumps very low. Now think about lowering that hurdle, which is comparable to increasing sea levels. Suddenly, that hurdle runner who is very consistent makes it over all of the time, while the guy from the North Sea may jump over the hurdle a couple more times, but he also still has the very extreme lows. So, the constant jumper is way more sensitive to these changes.
Editor's note: This interview has been edited and condensed for clarity.
What's in the photo? Thespace shuttle Atlantis, preparing to dock with the International Space Station (ISS)
Who took the photo? An unnamed astronaut on board the ISS
When was it taken? July 10, 2011
This stunning astronaut photo shows the last time one of NASA's iconic space shuttles photobombed astronauts' view of Earth as the spacecraft docked with the ISS.
NASA's Space Shuttle Program included five plane-like spacecraft — Columbia, Challenger, Discovery, Atlantis and Endeavour — which collectively completed 135 missions between 1981 and 2011, racking up more than 32,000 hours in space. During that time, they helped to construct the ISS and, later, ferry astronauts to and from the station. The space shuttles also helped to deploy and maintain several other important spacecraft, including the Hubble Space Telescope.
This photo shows Atlantis approaching the ISS for the last time as it passed over the distinctive turquoise waters of the Bahamas. The space shuttle's bay doors are open, exposing its cargo area. This was standard procedure for all space shuttles once they reached low Earth orbit because it prevented the spacecraft's radiators from overheating.
The open doors also enabled the shuttle's docking mechanism, located within its cargo bay, to attach to the ISS, thus creating a pressurized seal so that astronauts could move between the two spacecraft.
Atlantis' final flight began on July 8, 2011, when it launched from the Kennedy Space Center in Florida vertically strapped to a massive fuel tank and a pair of rocket boosters. It returned to Earth on July 21, gliding down to land onto a runway at the launch site. (The spacecraft is now on display at the Kennedy Space Center Visitor Complex.)
In addition to helping construct the ISS, NASA's space shuttles visited Russia's Mir space station, serviced Hubble, and deployed both the Magellan probe to Venus and the Galileo probe to Jupiter. In total, the space shuttle orbited Earth 4,848 times, traveling nearly 126 million miles (203 million kilometers) — more than 525 times the distance between Earth and the moon.
Astronaut photos of the space shuttles were popular because they offered "punctuated snapshots of distinct places on Earth" that were "framed by a human eye," NASA representatives wrote in 2011. "These images speak to people."
Atlantis touched down at the Kennedy Space Center on July 21, 2011, brining the 30-year Space Shuttle program to an end. (Image credit: NASA/Bill Ingalls)
While the Space Shuttle Program achieved a lot during its 30-year history, it famously suffered two tragedies: the 1986 Challenger and 2003 Columbia disasters, which killed all crewmembers on board.
NASA eventually canceled the program in 2011, citing the high cost of maintaining the aging spacecraft and a reduced need for the vehicles after the completion of the ISS the same year. To this day, the space shuttles remain the only winged spacecraft to carry humans into space.
A Bengaluru startup called Vimag Labs just secured its fifth Indian patent for an electric motor that runs without any rare-earth magnets, using software and power electronics to generate its magnetic field instead.
It’s a small, $5-million company taking a swing at a problem that has stumped Tesla, GM, and every major automaker for years: how to build a competitive EV motor that doesn’t depend on China.
The mystery of life's origin on Earth remains unsolved. With modern biochemistry tools scientists are no closer to synthesizing life from non-living chemicals despite advanced knowledge and technology, let alone understanding how it could have arisen abiogenetically. The rejection of the Creator has led to foolishness in the wise.
The two major earthquakes that struck Venezuela just 39 seconds apart on June 24 had slightly different epicenters in north-central Venezuela. The first (M7.2) struck near San Felipe, and the second (M7.5) near Yumare, leaving thousands dead and thousands more injured, according to government officials. But beyond the devastation, the sequence opened a rare scientific opportunity: Researchers think the unusual "earthquake doublet" could offer new insight into how large fault systems interact and how some of the most destructive earthquakes grow.
Large earthquakes are typically followed by smaller aftershocks. But particularly intense events can also alter stress on nearby faults or along the same fault, triggering another major earthquake.
The Venezuelan sequence also reinforces an emerging consensus among seismologists: that treating faults as isolated structures may underestimate the destructive power of quakes in regions where multiple tectonic faults meet, as they do both in Venezuela and around California's San Andreas Fault system. That's a problem, because many of the seismic hazard models in California do not account for those multi-fault interactions.
A natural laboratory for understanding major earthquakes
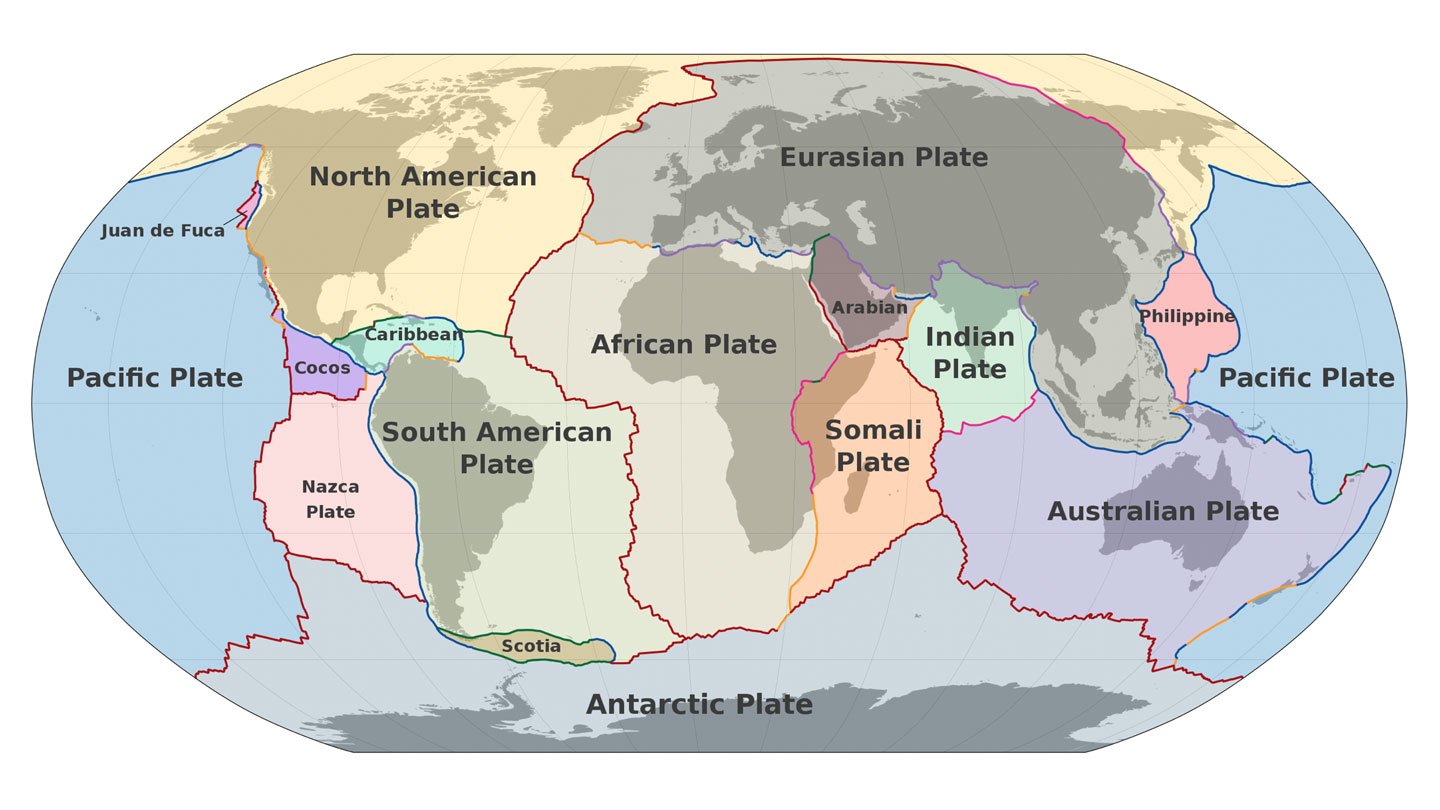
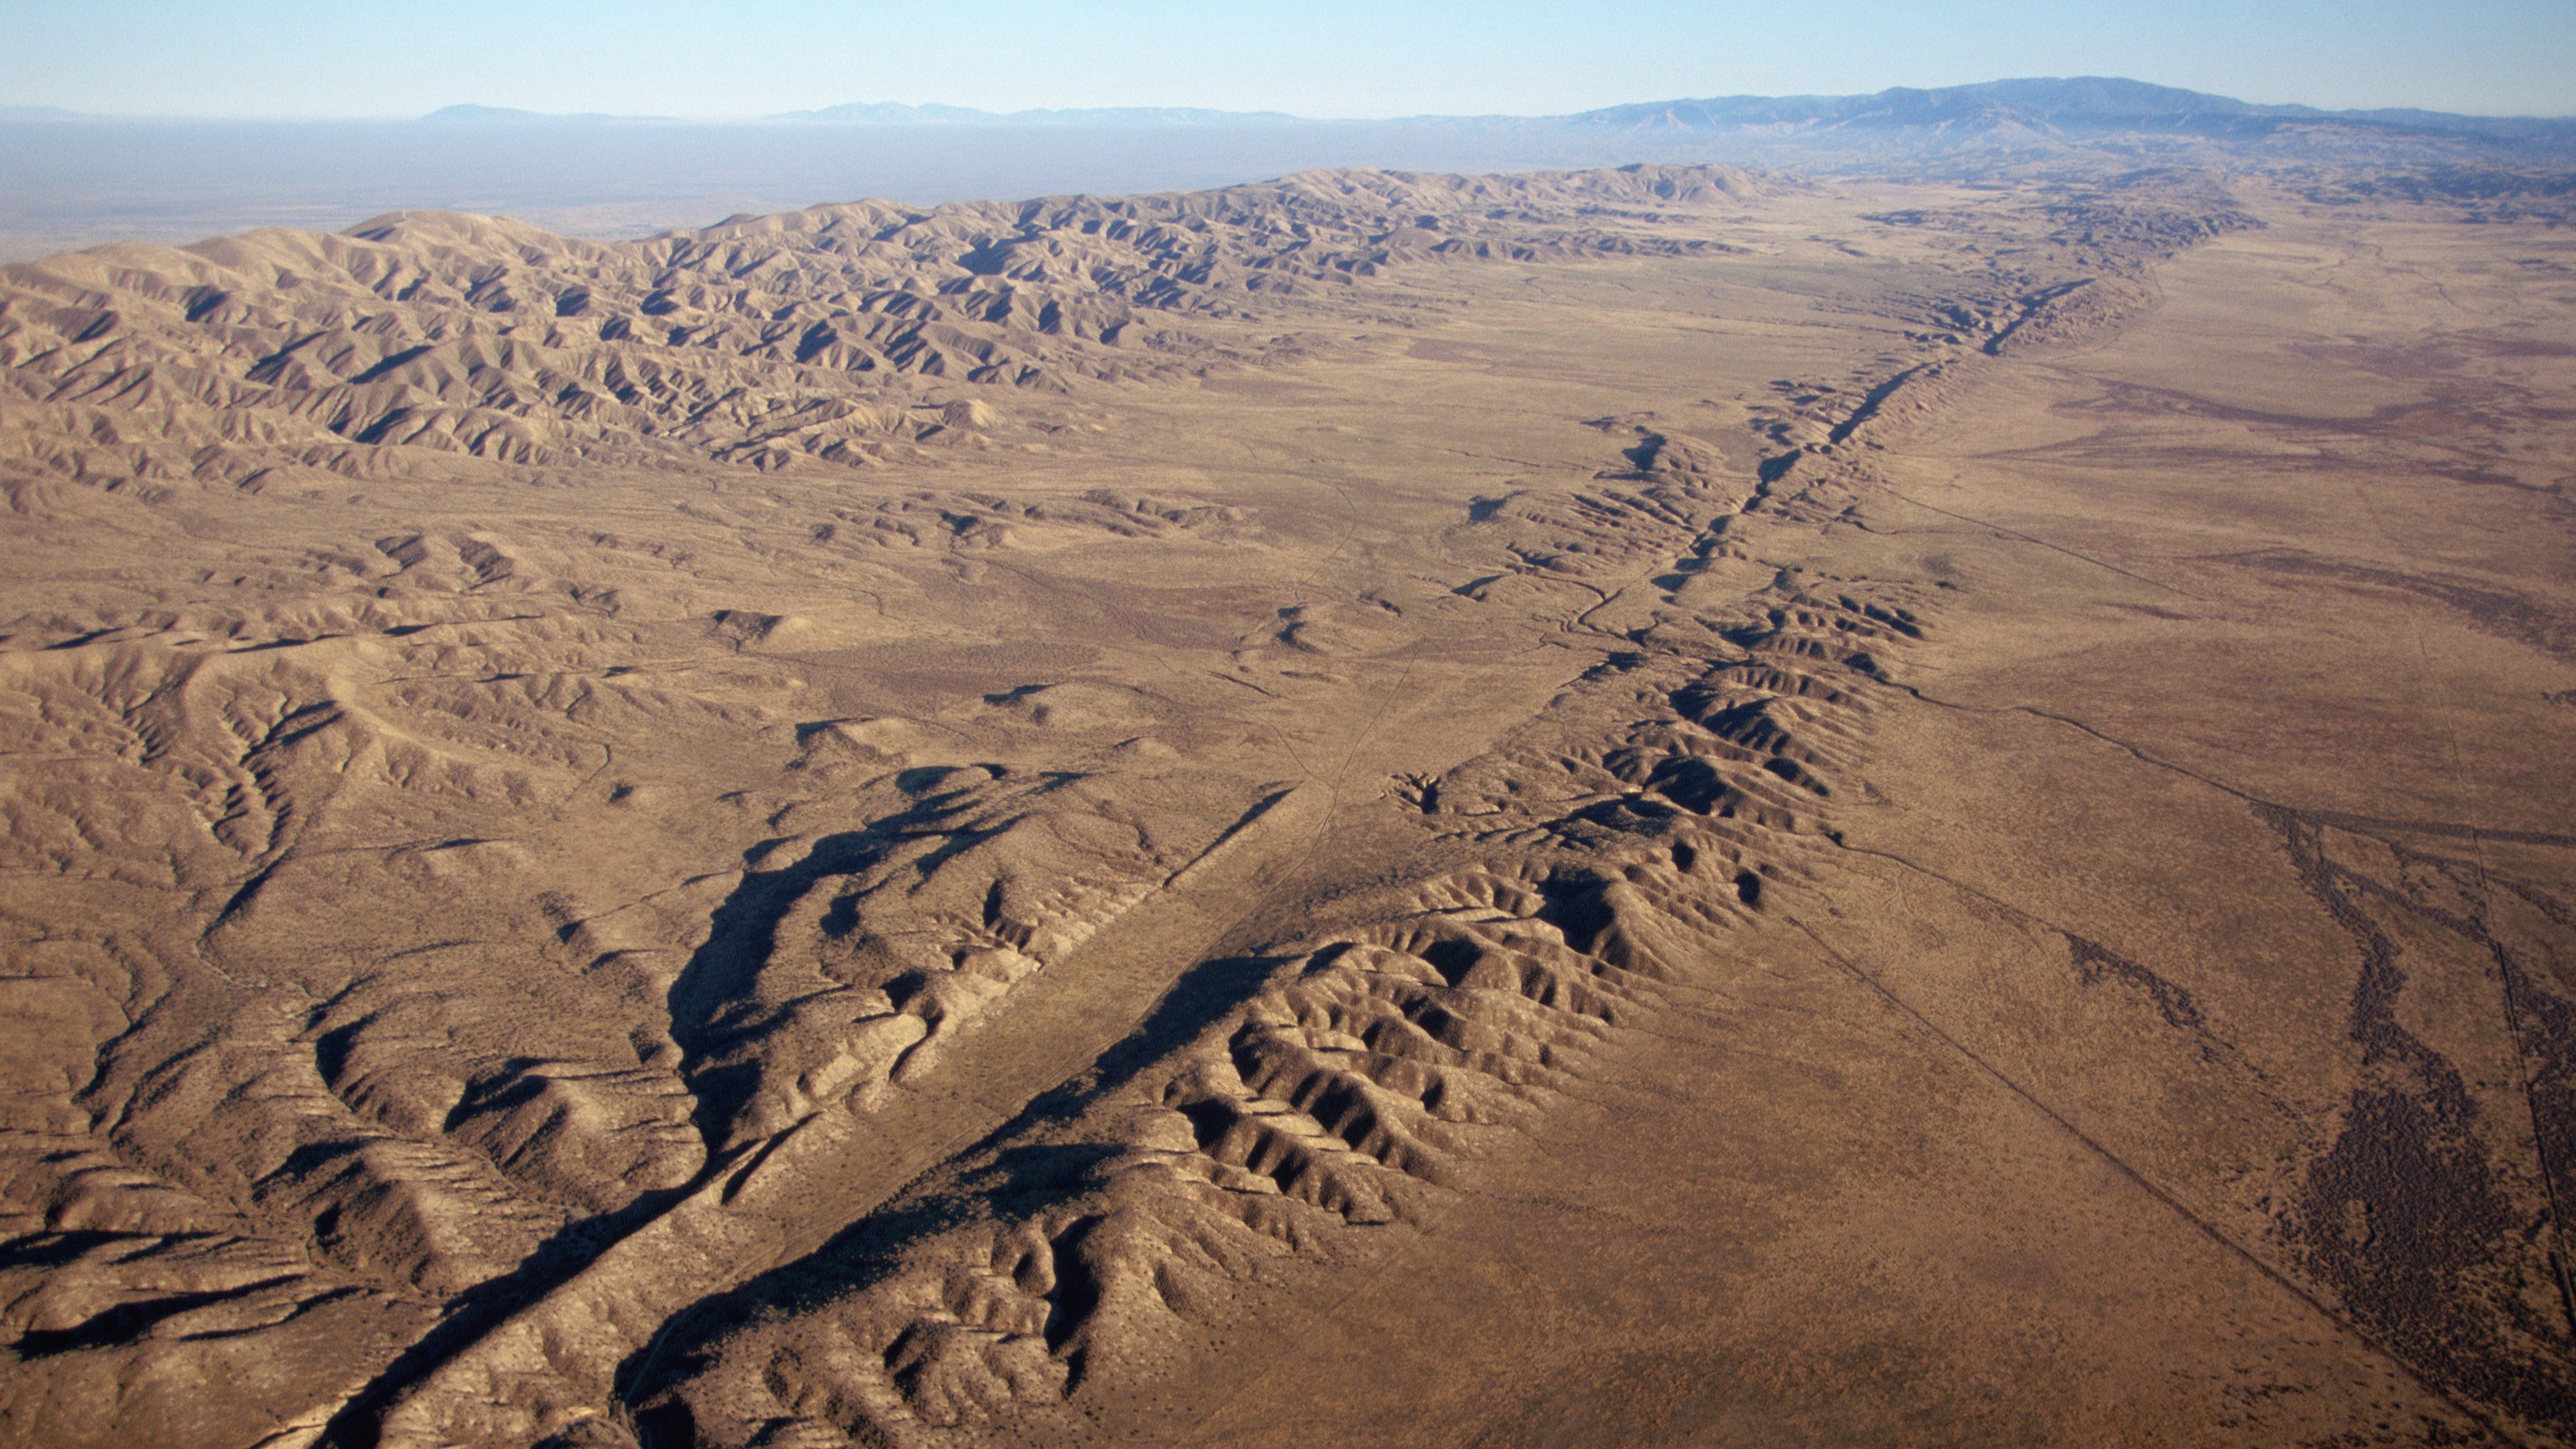
The fault system involved in the Venezuelan earthquake — which includes the Boconó, Morón, San Sebastián and El Pilar faults — shares several key characteristics with the San Andreas Fault. Both are right-lateral strike-slip fault systems — in which the crustal blocks slide horizontally past each other — located along the boundary between two tectonic plates: the South American and Caribbean plates in Venezuela, and the Pacific and North American plates in California.
Despite these similarities, researchers caution that the two systems differ in important ways.
"The main difference is that the Venezuelan plate boundary has a much more complex fault architecture," Julián García Mayordomo, a senior scientist in the Geological Hazards and Climate Change Department at the Geological and Mining Institute of Spain, told Live Science.
The difference stems largely from the Maracaibo block, whose interaction with surrounding faults creates a much more intricate plate boundary than California's.
"The other difference is the speed at which the plates move," García Mayordomo pointed out.
In Venezuela, the tectonic plates move past each other at about 0.8 inches (20 millimeters) per year, compared with roughly 1.2 inches (30 millimeters) along the San Andreas Fault. Faster plate motion allows tectonic stress to accumulate more quickly, which influences how often large earthquakes occur over long timescales, but not when the next one will strike.
An aerial view of the San Andreas Fault in California. (Image credit: Kevin Schafer/Getty Images)
Along the San Andreas Fault, magnitude 7 or larger earthquakes occur, on average every 100 to 200 years, although the frequency of recurrence varies along the fault. The last major rupture in Southern California was the magnitude 7.9 Fort Tejon earthquake in 1857. In Venezuela, estimated slip rates suggest recurrence intervals of one to two centuries. The region experienced two devastating earthquakes in 1812, part of a multiple-rupture sequence that included events of magnitude 7.5, 7.2 and 6.5, and a 2018 study concluded that the Boconó Fault had already accumulated enough strain to generate another major earthquake.
However, these are statistical averages. The recurrence of large earthquakes is highly irregular and depends on a multitude of factors, many of which we still don't fully understand. So a major event could occur in 100 years — or even tomorrow.
Looking beyond individual faults
This uncertainty is precisely one of the reasons the Venezuelan seismic doublet is generating so much interest among seismologists.
"It is the kind of natural event that can sharpen and test the rupture-interaction concepts that paleoseismic models like ours can only infer indirectly," said Liliane Burkhard, a geologist and geophysicist at the University of Bern and first author of a recent study suggesting that the junction between the San Andreas and San Jacinto faults in Southern California is experiencing some of its highest tectonic stress levels in the past 1,000 years, told Live Science.
"Our Cajon Pass work relied on centuries of paleoseismic reconstructions to infer how stress evolves and whether ruptures can cross between fault systems," Burkhard told Live Science. But that doesn't give geologists real-time data, captured by seismic instruments, showing how different faults interact during quakes, she added.
The Venezuela doublet offers exactly that opportunity. The main lesson for California, Burkhard said, is that interactions between neighboring faults can play an important role in the evolution of large earthquakes.
"Whether it is Cajon Pass where the San Andreas and San Jacinto systems meet or the Boconó-San Sebastián in Venezuela, these are precisely the locations where single-fault hazard models break down because the real behavior depends on how stress is shared and transferred between adjacent structures," she said.
Many times the winner isn't the boxer who lands the hardest punch but the one who keeps punching for longer.
Julián García Mayordomo, senior scientist at the Geological and Mining Institute
Still, the two systems are quite different. The Venezuelan sequence represents a different type of cascading rupture than the one described in Burkhard's research. At Cajon Pass, the "earthquake gate" concept explores whether a single rupture can jump from one fault system to another during the same earthquake, over tens of seconds of rupture propagation along a continuous fault trace. The Venezuelan doublet, by contrast, "looks like two distinct ruptures on what may be two separate fault structures, triggered in close succession," Burkhard said.
For Burkhard, the Venezuelan earthquake reinforces the need for seismic hazard models to move beyond treating faults as isolated structures and instead represent them as interconnected networks. The challenge is particularly relevant in California, where roughly 300 active faults may interact in ways that traditional hazard models do not capture.
New Zealand has already incorporated this lesson. After the 2016 Kaikōura earthquake ruptured at least 12 faults in a single event, New Zealand revised its National Seismic Hazard Model to include complex multifault ruptures.
García Mayordomo argues that both Venezuela and the United States should incorporate these complex rupture scenarios into seismic hazard assessments and building codes. Earthquakes involving multiple faults can produce longer-lasting shaking that increases structural fatigue and, ultimately, the risk of collapse.
"It's like a boxing match," García Mayordomo said. "Many times the winner isn't the boxer who lands the hardest punch but the one who keeps punching for longer."
Even so, researchers cautioned against drawing sweeping conclusions from a single earthquake.
"Each earthquake gives us one possible scenario," Judith Hubbard, an earthquake scientist and structural geologist at Cornell University told Live Science. "The range of earthquake behaviors is wide."
Tropical forests draw down and store large quantities of CO₂ from the atmosphere. The Amazon rainforest in South America, for example, stores approximately 123 billion tonnes of carbon — more than is stored in any other terrestrial ecosystem in the world. But these forests are facing a critical challenge.
Research from 2023, which was carried out by me and more than 100 colleagues, found that tropical forests in South America are vulnerable to climate extremes. We determined that during an El Niño event, the warm phase of a natural fluctuation in the Earth's climate system, South American tropical forests may fail to act as a carbon sink.
This finding becomes even more alarming when we consider the increasing frequency and intensity of El Niño events. There have been twice as many "very strong" El Niños in the last 60 years as there were in the 60 years before that. And the US National Oceanic and Atmospheric Administration has recently confirmed that such an El Niño is currently underway.
Tropical forests absorb CO₂ through the process of photosynthesis and convert it into biomass. However, the balance between photosynthesis and respiration is delicate and depends on two factors: temperature and water availability.
In hotter and drier conditions, plants close the pores of their leaves to avoid water loss. But closing them effectively cuts off a plant's fuel supply because it is through these pores they absorb CO₂. This starves plants of the carbon needed for photosynthesis and to grow.
During El Niño years, which are characterized by high temperature anomalies, prolonged climate stress leads to reduced forest growth and increased tree mortality. The effects of this are felt for decades as carbon is released back into the atmosphere when the dead trees decompose.
Our findings revealed that during the 2015-2016 El Niño, when temperatures on land were at least a degree higher on average than usual conditions, some of South America's tropical forests effectively stopped absorbing carbon. This raises concerns about the possible impact of the current El Niño on the Amazon and global climate.
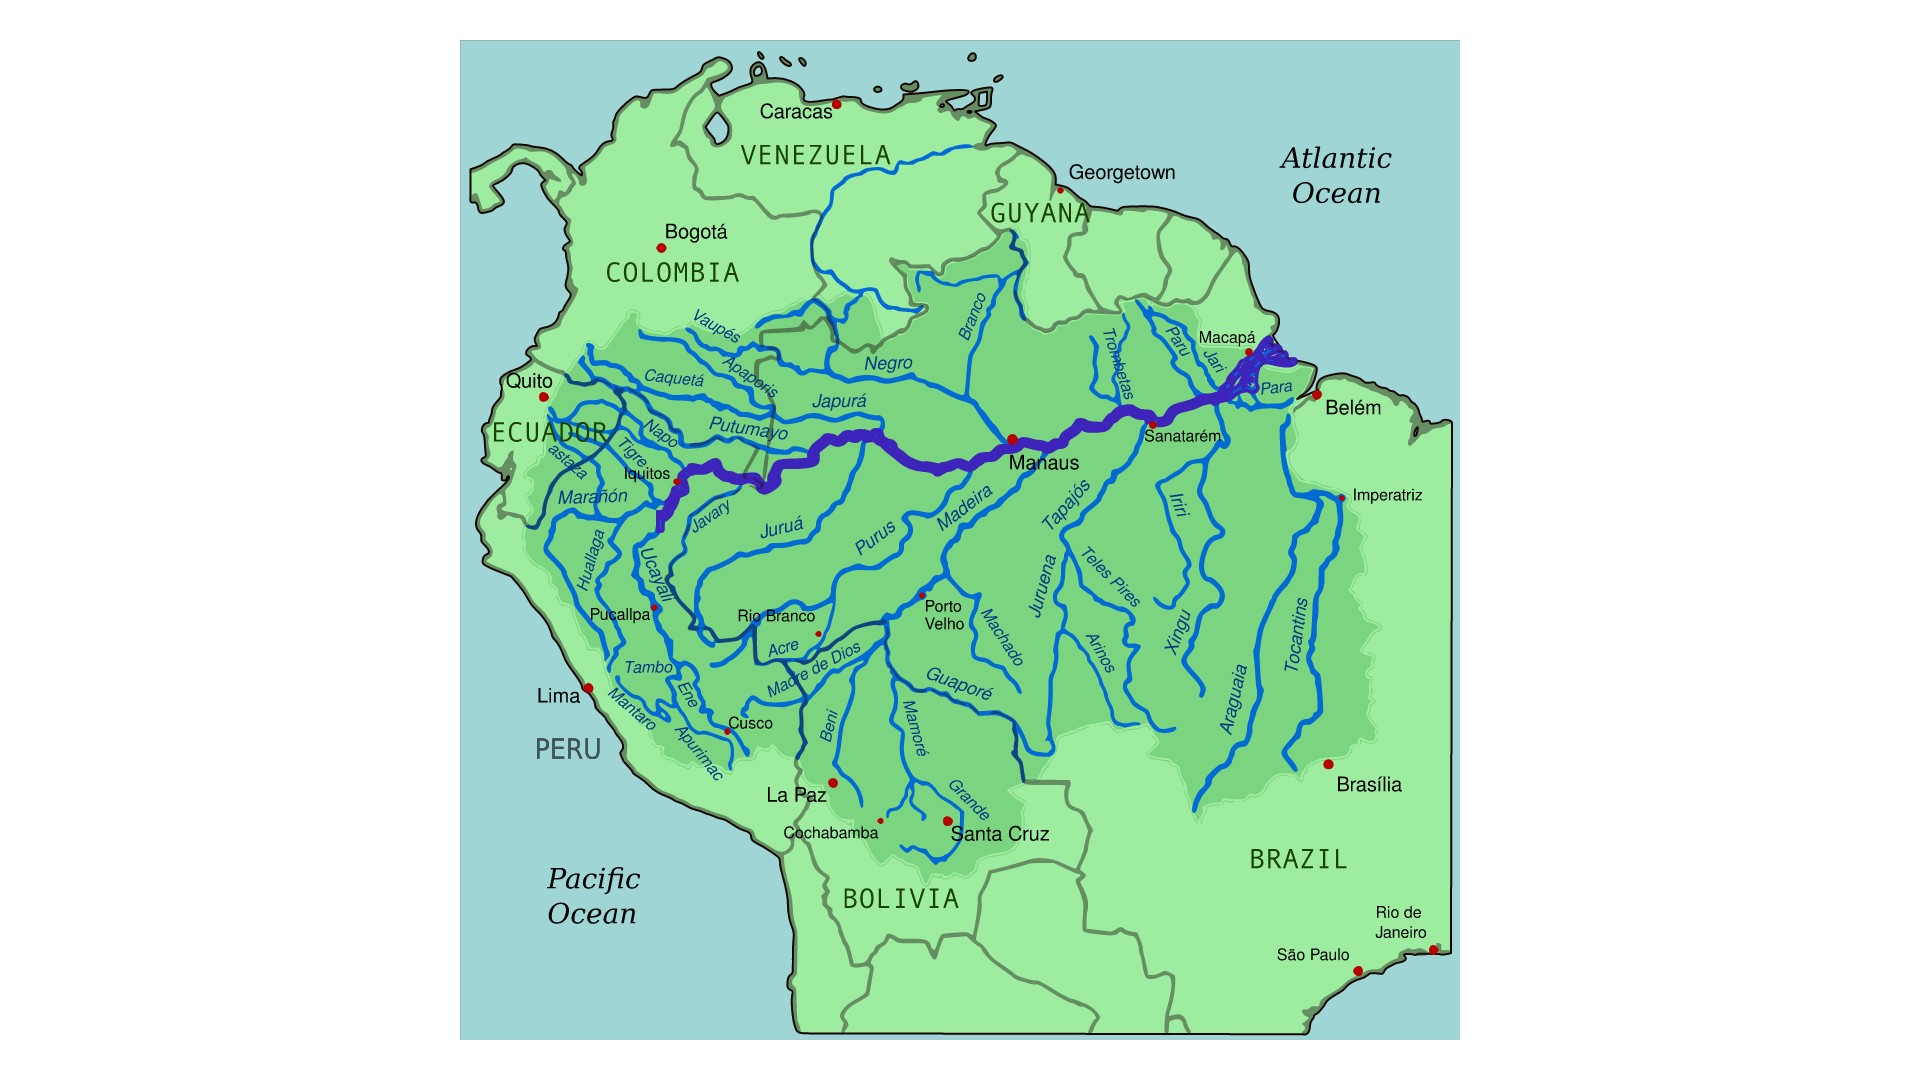
A map of the Amazon River drainage basin in the middle of the Amazon rainforest. (Image credit: By Kmusser from Wikimedia Commons with elements from this file, CC-BY-SA-3.0)
In our research, we measured over half a million trees across six South American countries over a period of more than 30 years, using tape measures to track their growth. These trees belonged to over 4,000 different species. We used this data to calculate precise estimates of the amount of carbon stored as a forest's aboveground biomass.
We found that the vulnerability of these forests to El Niño conditions was closely linked to their baseline climate. While we tend to assume that rainforests are all hot, wet and biodiverse ecosystems, seasonal drought is a reality for many tropical forests. Conditions in regions at the edge of the Amazon rainforest, for example, tend to be particularly hot and dry.
Our findings revealed that drier forests at the edge of the Amazon, where trees regularly endure periods of limited water availability, were especially susceptible to extreme El Niño conditions. On average, a 0.5°C increase in temperature caused these forests to lose 0.5% of their aboveground carbon.
Larger trees suffered the most. While tree mortality rates increased from 1.8% to 3% per year during the El Niño in South American tropical forests as a whole, mortality rates effectively doubled for medium (classified as over 20cm in diameter) and large trees.
The fact that larger trees with less dense wood died at much higher rates compared to small trees and those with high wood density points strongly to hydraulic failure, when intense atmospheric moisture demand snaps the tension in the tree's internal water column rather than slow carbon starvation.
These results suggest that adaption to seasonal drought may not be sufficient to protect tropical forests from extreme events. Climate extremes are possibly already pushing forests at the edges of the Amazon beyond their capacity to adapt, causing catastrophic carbon losses.
A looming threat
Scientists have warned that 2026 may again be the warmest year on record. Heightening the alarm further is the severity of the current El Niño. Never before has an an El Niño begun when oceans are already so warm and air temperatures so high.
On top of this is the fact that, over the past three decades, the edges of the Amazon have experienced some of the highest temperatures and most rapid warming the tropics have ever seen. The structural integrity of a forest is compromised when a major climate anomaly occurs before it has recovered from recent, multi-year stress.
These compounding factors mean that we risk witnessing tree and carbon losses on scales not yet seen.
Tropical forests are invaluable assets in the fight against climate change. But South American tropical forests, a once-reliable carbon sink, are vulnerable to intensifying heat and drought. There is a risk these essential ecological allies stop acting as a carbon sink as extreme climate conditions become the norm.
Preserving tropical forests is thus essential. Their ability to continue acting as carbon sinks hinges on efforts to protect them and a collective commitment to limit global temperature rise. The Amazon's future depends on this, and so does ours.
For decades, cities have been designed around "gray infrastructure." Roads move people. Bridges connect communities. Water systems protect public health. These systems are governed by engineering standards because society recognizes that safety cannot depend on good intentions alone.
Urban nature deserves the same recognition.
In June, a heat wave gripped Europe, breaking temperature records across the continent. In France, officials reported over 2,000 excess deaths. In the U.K., hospitals declared critical incidents and machinery and IT systems failed. In the U.S., a heat dome over the Midwest and East Coast disrupted Fourth of July celebrations, with at least 25 heat-related deaths over Independence Day weekend.
Cities are being tested by a warming climate. Yet one of our most effective forms of climate infrastructure is being lost — not because it does not work but because we still do not treat it as infrastructure.
My view is simple: Urban nature — including street trees, parks, wetlands and other urban green spaces — should be categorized and managed as essential infrastructure, with minimum standards for its protection, quality and long-term maintenance. Just as we regulate roads, bridges and drinking water, we need standards that ensure all urban residents benefit from healthy and thriving urban nature. Without such standards, cities will become hotter, less resilient and increasingly unequal as climate change accelerates.
A cafe in the city of Nice during the heat wave that saw temperatures in France reach a record-breaking average of 98.4 degrees Fahrenheit (36.9 degrees Celsius). (Image credit: Valery Hache/Getty Images)
Scientific research shows that urban trees and green spacescool cities during heat waves, reduce flooding by absorbing stormwater, improve air quality, store carbon, support biodiversity, and improve both physical and mental health. During extreme heat, neighborhoods with mature tree canopies can be several degrees cooler than nearby streets dominated by concrete and asphalt. Those few degrees can mean the difference between manageable discomfort and dangerous heat exposure, particularly for older adults, children and people with existing health conditions.
But while the science is strong, our governance is not.
Cities enthusiastically announce ambitious tree-planting campaigns, biodiversity strategies and new greening targets. These initiatives are valuable, but they often focus on what is easy to count rather than what truly matters. Planting a tree is not the same as growing a healthy urban forest. Creating a park does not guarantee biodiversity. A green roof delivers little value if it fails during drought.
The real measure of success is whether urban nature continues providing benefits decades after trees are planted and established.
This is where cities are still falling short.
That is not simply an environmental issue. It is a public health issue, a climate adaptation issue, and an issue of social equity.
Unlike buildings or transport systems, urban nature rarely operates under consistent minimum standards. Many cities have no requirements for minimum tree canopy cover, adequate rooting space, soil quality, biodiversity targets, long-term maintenance or even whether newly planted trees survive. As a result, access to nature depends heavily on where people live. Wealthier neighborhoods often enjoy mature tree canopy and high-quality parks, while disadvantaged communities experience hotter streets, fewer green spaces and greater exposure to climate risks.
That is not simply an environmental issue. It is a public health issue, a climate adaptation issue, and an issue of social equity.
The solution is not simply to plant more trees. It is to establish urban nature standards that recognize nature as essential infrastructure.
These standards would not prescribe the same solution for every city. Instead, they would establish minimum expectations based on scientific evidence. They could include targets for accessible green space, minimum tree canopy cover, sufficient soil volume for healthy tree growth, biodiversity outcomes, long-term maintenance funding and routine monitoring to ensure that urban nature continues delivering benefits to communities.
The Bosco Verticale in Milan house around 800 trees and 20,000 plants. City officials have been expanding the green infrastructure with multiple high impact projects to address climate change. (Image credit: Emanuele Cremaschi/Getty Images)
Importantly, these standards should focus on outcomes rather than simple planting targets. Counting how many trees are planted tells us little about whether cities are becoming more resilient. Measuring survival, canopy development, ecosystem health and equitable access provides a much better picture of whether investments in urban nature are actually returning dividends.
Some critics argue that cities cannot afford stronger standards for urban nature. Municipal budgets are already stretched by housing, transport and aging infrastructure. But this argument overlooks a fundamental reality: We already spend enormous sums responding to the consequences of extreme heat, flooding, poor air quality and declining public health. Healthy urban ecosystems help reduce these costs while delivering multiple benefits simultaneously.
As climate change accelerates, the distinction between gray and green infrastructure becomes increasingly blurred. Trees cool buildings and reduce energy demand. Wetlands decrease flood damage. Parks improve public health and strengthen communities. These are not optional amenities. They are functioning components of urban infrastructure that deserve the same level of planning, investment and accountability as any engineered system.
Building codes transformed the safety of our cities because they established minimum standards that every development had to meet. Climate resilience now demands a similar transformation for urban nature.
The next generation of resilient cities will not be defined simply by how many trees they plant but by the standards they adopt to protect, restore and sustain the living infrastructure urban life depends on.
The real question is not whether cities can afford to invest in urban nature; it is whether they can afford not to.
Opinion on Live Science gives you insight on the most important issues in science that affect you and the world around you today, written by experts and leading scientists in their field.
The only three measurables in galactic astronomy are the position, luminosity and spectrum of the source light received in our telescopes. There is no distance information without unprovable assumptions, hence no direct measurement of size or age of the universe. Thus we may conclude it is young in agreement with the Bible.
With the arrival of America’s 250th birthday this Independence Day weekend, NASA is marking the occasion with a patriotic-themed perspective on the cosmos.
While a patient is fully anesthetized and unresponsive, neurons in the hippocampus continue to process language, distinguish different types of words, and generate neural activity consistent with predicting upcoming words.
As America celebrates its 250th birthday, we look at technological revolutions that have shaped the country—and the AI revolution now poised to redefine its future.
Researchers have discovered a potentially habitable exoplanet just 25 light-years from Earth—but is its precarious location on the cosmic shore too dangerous for extraterrestrial life?
Sometimes, pieces of Earth’s outer layer pull apart like taffy. Right now, part of Africa is being stretched to nearly the breaking point.
The giant jigsaw pieces of Earth’s outer layer are called tectonic plates. Scientists knew that the plates beneath eastern Africa are being tugged apart. The crust there is already thin and weak in places. But new data show that one region — the Turkana Rift Zone — is undergoing “necking.” It’s a key part in the process of a continent breaking up and has never been seen before.
The new observations hint that this part of East Africa may be closer to splitting — and doing so more rapidly — than previously thought. Researchers shared their discovery April 23 in Nature Communications.
Our planet’s tectonic plates are constantly in motion. This research focuses on the pulling apart of the African and Somali plates.M. Bitton (CC BY-SA 3.0)
The Turkana Rift Zone straddles the countries of Kenya and Ethiopia on Africa’s eastern edge. The region is best known for its wealth of fossils of our human ancestors. But rocks beneath this rift zone hold their own secrets.
Christian Rowan studies Earth science at Columbia University in New York City. He and his teammates looked at past data on the Turkana Rift Zone. They included sound-based measurements that had been taken to search for oil and gas. Sending sound waves into the planet and watching how they bounce around can create images of what’s below, Rowan explains. “It’s almost like an ultrasound of the upper crust.”
The point of no return
The team focused on a layer of metamorphic rocks beneath the planet’s surface. Those old, hard rocks form the crust under Earth’s continents. Rowan’s group traced those crustal rocks down to Earth’s mantle. They found one region where the crust was just under 13 kilometers (8 miles) thick.
That was a big surprise, Rowan says. The crust is usually about 30 kilometers thick. (That’s almost 19 miles.)
Earth’s crust had clearly been stretched a lot in the Turkana Rift Zone. That matched what scientists would expect in the necking stage of continental breakup.
“It’s kind of the point of no return,” says Sascha Brune. He works at the GFZ Helmholtz Centre for Geosciences in Potsdam, Germany, and did not take part in the research. He does, however, study how Earth’s interior and surface evolve over time.
Scientists have seen the aftermath of necking between tectonic plates elsewhere on Earth. But this process has never been observed in action. That’s what makes the Turkana Rift Zone so special, Brune says. “This is the place to go.”
See what’s causing East Africa to slowly split off from the rest of the continent, how that has affected the area’s climate and fossil record — and when a completely new island continent may emerge.
Past and future stretching
Rowan’s group wondered how long the Turkana Rift Zone has been in this breakup stage. To find out, they looked at a layer of volcanic rock that had once been at Earth’s surface. Over time, it has since been pulled down as the crust here has stretched apart and sunk in the middle. It shows the rift has been necking for roughly 4 million years.
The Turkana Rift Zone’s trove of fossils may exist due to that stretching and dipping. Sediments, some containing fossils, naturally build up in low-lying regions.
If the Turkana Rift Zone continues necking, it could enter the final phase of continental breakup. It’s a stage known as oceanization.
At that point, Earth’s crust tears, and the mantle beneath punches through. Magma from the mantle then oozes across Earth’s surface. Eventually, it cools and forms new oceanic crust.
Oceanic crust is denser than continental crust. So it tends to sink and collect water. (Hence why this dense crust is found beneath Earth’s oceans.) Water will now flow into the lower-lying parts. Over millions of years, an ocean could develop that would formally split off part of eastern Africa, creating a distinct landmass, Rowan says. “Eventually, eastern Africa will break apart.”
The molten iron core deep within our planet could be much more dynamic and complicated than previously known, as revealed in new studies that point to a current of liquid metal under the Pacific Ocean that reversed directions unexpectedly more than a decade ago.
The new findings provide additional insights into a sort of hidden “engine” driving the planet’s protective magnetic field, as detailed in new reporting featured in the Journal of Studies of Earth’s Deep Interior.
According to the research, long-held assumptions about large-scale flows occurring in Earth’s outer core are now being challenged, pushing back on previous notions that they evolve only gradually over time. Now, researchers say a broad region of molten iron beneath the equatorial Pacific abruptly shifted from a weak westward flow to a strong eastward current sometime around 2010.
Earth’s Magnetic Field
Since our planet’s magnetic field is produced by the movement of superheated, electrically conductive liquid iron that is close to 2,200 kilometers (1,370 miles) below the surface, sometimes even the most nuanced changes within these deep currents can fundamentally alter the magnetic field that shields the planet from harmful charged particles emitted by the Sun.
Discovering this unexpected reversal required scientists to combine close to three decades of ground-based magnetic observations with satellite data collected from 1997 until 2025. The European Space Agency’s (ESA) Swarm Mission provided measurements, which, combined with previous observations made possible through German CHAMP and Danish Ørsted satellites, helped researchers behind the new work to construct a precise model of the changing flow patterns occurring at the boundary between Earth’s core and mantle.
“The large-scale flow reversal beneath the Pacific raises new questions about the behavior of Earth’s deep interior,” said lead author Frederik Dahl Madsen of the University of Edinburgh’s School of Geosciences.
“Scientists now want to understand whether the reversal represents a short-lived fluctuation, part of a repeating oscillation, or a new stable equilibrium for core circulation,” Madsen said.
A Weakening Current
Among their findings, the team also said they uncovered evidence that the strong eastward current appears to have weakened since 2020, raising the possibility that the reversal could represent part of a longer natural cycle.
According to Madsen, the shift coincided with changes inferred within Earth’s solid inner core, which suggests previously unrecognized links between the planet’s deepest layers.
“The rise of the strong eastward flow in the Pacific is contemporary with a change in behaviour in the inner core, as inferred from geodesy and seismology, and we hypothesize that these changes in the deep interior are associated with the changes in flow beneath the Pacific,” Madsen said.
While such processes occur thousands of kilometers beneath our planet’s surface and pose no direct dangers, they nonetheless have a vital part in sustaining Earth’s magnetic field.
Although invisible, the magnetic shielding capability it provides protects our atmosphere from solar radiation, while supporting the technologies many of us rely on daily for navigation, space weather monitoring and forecasting, and a range of other things.
ESA scientists say that in the long term, satellite missions like its Swarm mission provide a detailed picture of what’s happening in Earth’s hidden interior. That data is also revealing how the planet’s molten core may be considerably more variable and complex than once thought.
Going forward, Madsen says he and his colleagues will continue to look at how the molten flow deep within the earth is changing over time.
“Continued monitoring will be essential to determine how the flow evolves over the coming years,” Madsen said of the team’s ongoing work.
The team’s recent study, “Principal component analysis of the 2010 reversal of core-surface flow beneath the Pacific Ocean,” was published in the Journal of Studies of Earth’s Deep Interior.
Micah Hanks is the Editor-in-Chief and Co-Founder of The Debrief. A longtime reporter on science, defense, and technology with a focus on space and astronomy, he can be reached atmicah@thedebrief.org. Follow him on X @MicahHanks, and at micahhanks.com.
A new model suggests that asteroid impacts on Earth may have occasionally launched microscopic material into space that could have reached Venus’s atmosphere over billions of years. Some of this material may even have temporarily remained suspended in the planet’s cloud layers under certain conditions.
The idea is based on the theory of panspermia, which suggests that life, or the building blocks of life, can move between planets on debris created by asteroid impacts. Scientists have often discussed the possibility of microbes traveling between Earth and Mars, and even the possibility of Earthly organisms reaching locations as far away as Jupiter’s moons.
Now, interest in the possibility of microscopic life in Venus’s dense, sulfur-rich clouds has made Venus a focus for similar studies of interplanetary transfer.
A team from Arizona State University, the Johns Hopkins University Applied Physics Laboratory, and Sandia National Laboratories recently explored this idea in a study presented at the 2026 Lunar and Planetary Science Conference. They used the Venus Life Equation, a framework made in 2021 by planetary scientist Noam Izenberg and his team. This equation considers three main factors: origination, robustness, and continuity. These factors help estimate the likelihood that life exists on Venus today. If panspermia occurred, it would mean that any life on Venus, if it exists at all, would not necessarily have originated there.
A Rock Becomes a Delivery Vehicle
Before considering the possibility of life originating on Venus, the researchers first addressed a fundamental question: could any material from Earth realistically survive the journey to Venus?
When an asteroid hits Earth hard enough to send material into space, that material faces intense shock, high heat, radiation, and the vacuum of space. Studies of meteorites found on Earth show that organic compounds can survive both ejection and travel between planets. However, an important question remains: what happens when this debris enters Venus’s atmosphere at high speed?
To study this process, the researchers used the pancake model. This model helps researchers analyze how meteors break apart when they enter an atmosphere. In this model, a meteor entering Venus’s atmosphere experiences intense heating and breaks into fragments. These fragments spread out into a flattened cloud of debris called ‘cells.’ Some of these cells are small enough to stay suspended in Venus’s clouds, instead of falling to the surface, where survival would be much less likely.
The Math of Interplanetary Hitchhikers
Their calculations indicate that, depending on the assumptions used, between 2 and 4 billion cell-sized fragments may have reached the clouds of Venus. Even accounting for a 99% loss during transit, billions of cell-sized fragments could be delivered. The model further estimates that approximately 100 cells could arrive in Venus’s clouds each year, amounting to roughly 20 billion over the past billion years, which corresponds to the estimated age of Venus’s current surface.
Like the Drake Equation, this model involves significant uncertainty because researchers cannot directly measure many of its parameters. The researchers note these limitations. Their model assumes that each meteor produces a single debris cloud, whereas real atmospheric breakups are more complex. The team’s size estimates are also based on Earth data rather than Venus-specific observations. Still, the results suggest that even single meter-sized meteors could deliver large numbers of cell-sized fragments, and the total transfer over Venus’s history suggests that interplanetary transfer to Venus may be more common over geological time than previously assumed.
Life on Venus?
Venus is considered a relatively low-risk target for spacecraft contamination under planetary protection guidelines. The results of this study imply that natural processes may have been transferring material from Earth to Venus for a billion years, independent of human activity.
So far, no mission has found life in Venus’s clouds. However, future astrobiology missions are expected to directly search for it. If life is discovered, these models show that scientists will then need to determine whether it originated on Venus or arrived from Earth.
Austin Burgess is a writer and researcher with a background in sales, marketing, and data analytics. He holds an MBA, a Bachelor of Science in Business Administration, and a data analytics certification. His work focuses on breaking scientific developments, with an emphasis on emerging biology, cognitive neuroscience, and archaeological discoveries.
Do large galactic structures like bipolar jets emitted from active galactic nuclei disprove the YEC biblical chronology? The Anisotropic Synchrony Convention (ASC) model, as a framework for reconciling biblical timelines with observed cosmic features, asserts that these structures can exist within a creation time frame of under 10,000 years.
Dark matter interactions may be a hidden “dark force,” unexpectedly constraining our Universe’s expansion and structural development, according to researchers.
In a recent paper published in the Journal of Cosmology and Astroparticle Physics, researchers identified unexpected effects arising from dark matter particles interacting with one another and clustering via a hidden dark force.
Typically, scientists can only study the invisible—and still purely theoretical—dark matter through its gravitational effects on ordinary matter. However, the new research explores how dark matter may also influence itself.
Exploring the Dark Force
As scientific instruments become more precise, researchers continue to uncover mysteries once hidden at the fuzzy edges of our understanding of the cosmos. One such puzzle involves discrepancies in measurements of the Universe’s density over time. Within the widely accepted ΛCDM model of cosmology, observations of cosmic expansion and the growth of large-scale structures have not always aligned with theoretical expectations.
To address these tensions, researchers have proposed a theoretical dark force—a previously unrecognized attractive force that acts only between dark matter particles. Such a force could influence both the expansion of the Universe and the formation of cosmic structures, potentially helping reconcile current models with recent observations.
“What we really know about dark matter has so far been learned only through its gravitational effects,” said co-author Zachary Weiner, a researcher at the Perimeter Institute for Theoretical Physics. “That leaves open the possibility that dark matter might have additional interactions that are hidden from ordinary matter.”
Investigating the Dark Force
The researchers examined models in which dark matter particles interact through a long-range force beyond gravity. By combining cosmological observations with theoretical calculations, they searched for evidence of how such a force might affect both the growth of cosmic structures and the expansion history of the Universe.
At first glance, the prediction seemed straightforward: if an additional attractive force pulls dark matter particles together, it should enhance their ability to cluster, potentially explaining why some observations suggest a denser cosmic landscape than expected.
“The first thing you would expect is that giving dark matter an additional attractive force should make structures grow faster,” Weiner explained. “But another effect comes into play at the same time.”
A Surprising Discovery
The researchers’ results revealed a more complicated picture. While a dark force does cause dark matter to cluster more efficiently, it also alters the expansion of the Universe in a way that causes dark matter particles to become effectively lighter over time.
As a result, the additional clustering is not strong enough to significantly increase matter’s gravitational imprint on the cosmic microwave background. Instead, the net effect is to suppress the overall growth of cosmic structure.
According to the researchers, this previously unrecognized interaction could play an important role in new cosmological models developed to explain observations from the Dark Energy Spectroscopic Instrument (DESI) in Tucson, Arizona. If confirmed, the effects of a dark force may need to be incorporated into future efforts to understand the evolution of the Universe.
As astronomers peer farther into space and deeper into cosmic history with ever-greater precision, studies like this may help explain subtle discrepancies that have long remained hidden.
“The Universe is often more subtle than our intuition,” Weiner concluded. “That’s exactly why we have to keep testing these ideas.”
Ryan Whalen covers science and technology for The Debrief. He holds an MA in History and a Master of Library and Information Science with a certificate in Data Science. He can be contacted at ryan@thedebrief.org, and follow him on Twitter @mdntwvlf.

 Login