❌

Normal view

Asteroid 2024 YR4 Won’t Hit the Moon, New JWST Observations Show

20 May 2026 at 17:00

asteroid 2024 yr4

Discovered in December 2024, the roughly 60-meter-wide asteroid 2024 YR4 was initially thought to have a slim chance of striking Earth in 2032. Further observations ruled out an Earth impact but left open the possibility of a Moon impact. New JWST observations show that 2024 YR4 will speed past both Earth and the Moon without a collision.

Another Update on 2024 YR4

In April 2025, we featured a Research Note that described March 2025 JWST observations of 2024 YR4 and characterized the asteroid’s size and albedo. At the close of that article, the authors suggested that further JWST observations in early 2026 could help to refine our understanding of the asteroid’s trajectory and determine whether it would strike the Moon.

On 18 and 26 February 2026, JWST carried out those critical observations. In this dataset, the asteroid is bright enough to be detected confidently, and the background is peppered with a sufficient number of reference stars — two factors necessary to determine the precise track of the asteroid as it zipped through space.

Trajectory Refinement
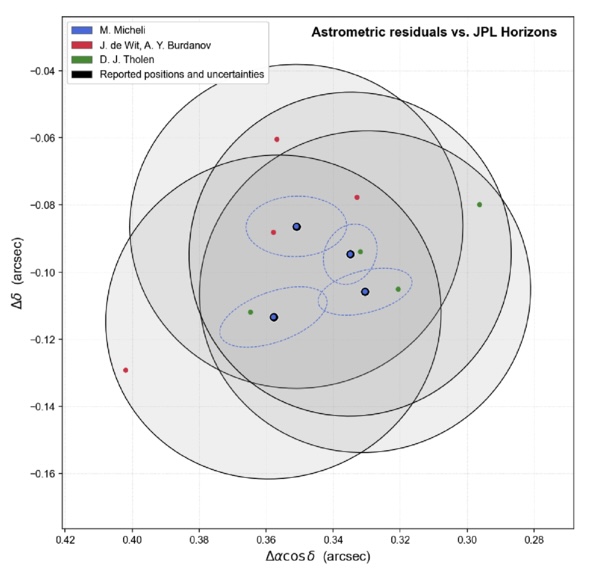
Difference between estimated and observed position for 2024 YR4

Difference between the position of 2024 YR4 determined in this work using three different reduction methods (red, blue, and green circles) and the position drawn from the existing orbit from the JPL Horizons database. The different analysis methods yielded consistent results. [Adapted from De Wit et al. 2026]

Julien de Wit (Massachusetts Institute of Technology) and collaborators analyzed the new JWST data and determined the asteroid’s position. The team used multiple methods to reduce the data and showed that their results were consistent regardless of the reduction method, ultimately yielding a measurement with an uncertainty of just 50 milliarcseconds. This is a huge improvement over the previous trajectory estimate, which had an uncertainty of 700 milliarcseconds.

Combining the latest JWST observations with existing data stretching back to the asteroid’s discovery, de Wit and coauthors determined a new, highly precise orbit for the object — one that definitively shows that the asteroid will safely pass by the Moon at a distance of 22,900 ± 800 km in 2032. In addition to ruling out the upcoming lunar impact, the team also ruled out any collisions with Earth in the next 100 years. Phew!
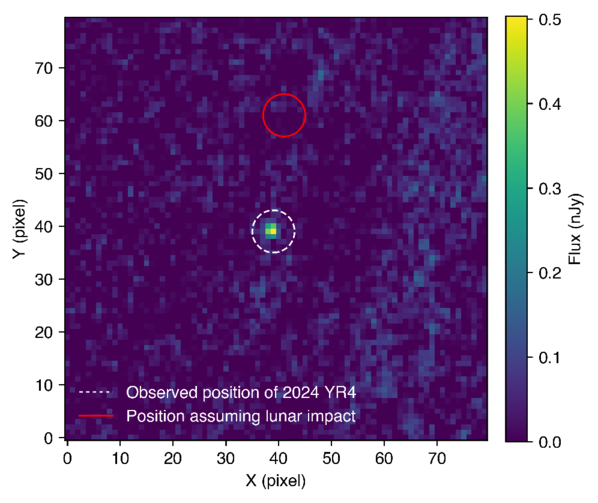
2024 YR4 observed and estimated position

Position of 2024 YR4 as seen by JWST in February 2026 (white dashed circle) compared to the asteroid’s location estimated from existing data (red circle). [De Wit et al. 2026]

High-Impact Science

This work highlights JWST’s potential as a tool for planetary defense. The February 2026 observations detailed here represent the faintest-ever detection of a near-Earth object, and JWST can detect objects far fainter than ground-based telescopes can. This ability allows JWST to observe potentially hazardous asteroids over a larger swath of their orbits, which translates to earlier trajectory estimation — JWST pinned down 2024 YR4’s orbit two years before the asteroid would have become bright enough for ground-based telescopes to do so.

JWST’s role may be even more important for smaller objects that rapidly become undetectable after discovery. De Wit’s team demonstrated this for a 10-meter-diameter 2024 YR4 clone on the same trajectory; for an object of this size, JWST would be able to rule out an Earth impact before the asteroid became undetectable, but ground-based telescopes could not. With surveys from facilities like Vera C. Rubin Observatory and Near-Earth Object Surveyor set to discover hundreds of thousands of new near-Earth objects, JWST’s role as a hazard assessor will likely be in high demand.

Citation

“JWST Observations of Asteroid 2024 YR4 Rule Out a 2032 Lunar Impact and Demonstrate a New Regime for Planetary Defense Follow-Up,” Julien de Wit et al 2026 ApJL 1003 L21. doi:10.3847/2041-8213/ae6a95

The post Asteroid 2024 YR4 Won’t Hit the Moon, New JWST Observations Show appeared first on AAS Nova.
Simulations of Turbulent Mixing Close One Gap but Open Another

6 May 2026 at 17:00

illustration of a white dwarf surrounded by rocky debris

Nature sometimes behaves in ways that are difficult to recreate in simulations. New research tackles the computational challenge of turbulent mixing and rules out a commonly assumed source of data–model disagreement.

Mixing Up Stellar Interiors

What do Earth’s oceans, red giant stars, and white dwarfs have in common? These are all sites of thermohaline mixing, a form of turbulent mixing that takes place when there is a vertical gradient in both temperature and chemical composition. For example, in Earth’s oceans, water near the surface is warmer and saltier than water in the depths below, setting up an unstable situation prone to mixing.

thermohaline mixing simulation results

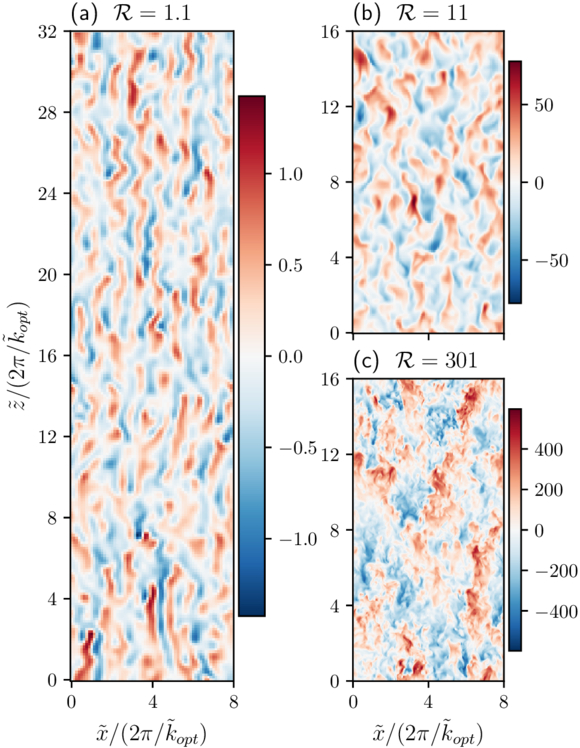
Examples of simulated thermohaline convection. These snapshots show the vertical velocity across a slice through the simulation volume. Click to enlarge. [Fraser 2026]

Thermohaline mixing has been explored in simulations to explain the evolution of red giants’ surface abundances, as well as how quickly rocky debris that accretes onto a white dwarf is absorbed into the star. However, effectively modeling this process in the interiors of stars has proven difficult.

One of the most important parameters for modeling mixing is the Prandtl number, Pr, which is the ratio of viscosity to thermal diffusivity (in other words, a way of describing whether momentum or heat diffuses more quickly within a fluid). For stellar interiors, Pr is around 10−6, but computational limitations have prevented modelers from setting this value lower than around 10−2. When tensions between models and reality arise, this gap between simulated and realistic Pr values is often assumed to be the source of the mismatch.

Bridging the Prandtl Number Gap

In a recent research article, Adrian Fraser (University of Colorado Boulder) aimed to test this assumption. Fraser carried out 3D simulations of thermohaline mixing, using a semi-implicit modeling technique that lowered the computational cost and allowed the simulations to probe Pr values of 10−1, 10−2, 10−3, 10−6, and 0.

comparison of simulations from this work and the benchmark model of thermohaline convection

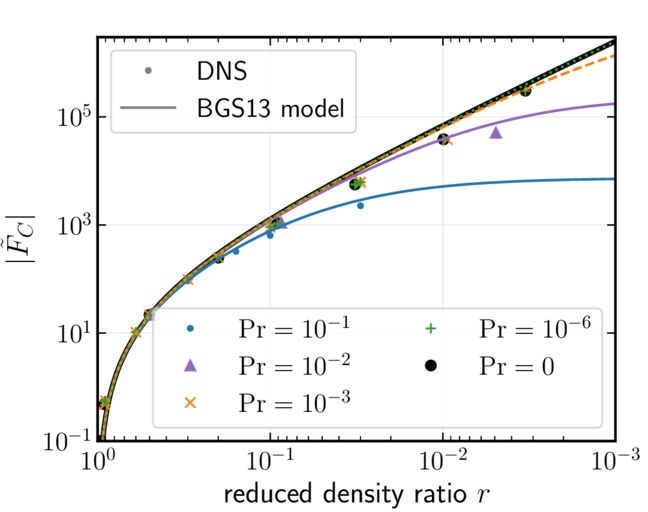
Turbulent compositional flux as a function of reduced density ratio for the simulations from this work (DNS) and the benchmark model of thermohaline convection (BGS13). Click to enlarge. [Adapted from Fraser 2026]

By comparing these results against a benchmark model of thermohaline mixing, this exploration showed that adopting a realistic value of Pr doesn’t dramatically change the dynamics of the system — meaning that data–model incompatibilities can’t be swept under a Prandtl number–shaped rug and must instead be resolved by including additional physics.

Recreating Reality

Where does this leave modelers attempting to recreate the reality of stellar interiors? First, a silver lining of this investigation: Fraser found that setting Pr = 0 delivered nearly identical results to Pr = 10−6. This suggests that valid results can be attained in a much less computationally intensive way, since setting Pr = 0 lowers the complexity of the simulation. While simulations with Pr = 0 may not be appropriate for all scenarios, including systems with strong magnetic fields, it may provide a way forward in certain situations.

For modeling of red giants and white dwarfs, Fraser suggested that incorporating magnetic fields, stellar rotation, or additional sources of mixing may resolve the current discrepancies. In fact, some modeling work has shown that magnetic fields could entirely close the gap between observations and models for red giant surface abundances — suggesting that bringing models and observations into agreement may be within reach.

Citation

“Bridging the Prandtl Number Gap: 3D Simulations of Thermohaline Convection in Astrophysical Regimes,” Adrian E. Fraser 2026 ApJL 1001 L22. doi:10.3847/2041-8213/ae5796

The post Simulations of Turbulent Mixing Close One Gap but Open Another appeared first on AAS Nova.
Monthly Roundup: Science of the Sun

27 April 2026 at 17:00

three images of the Sun

The Sun’s activity history, the sources of tiny jets, and how magnetic fields might impact space weather forecasts: today’s Monthly Roundup introduces a trio of recent research articles from the Astrophysical Journal that tackle hot topics in solar physics.

From 1755 to 2020: Reconstructing Centuries of Solar Activity

Since the 1970s, regular monitoring of the Sun’s magnetic field has allowed researchers to decipher the Sun’s behavior as it cycles through periods of low and high activity. But what resources exist for studying the Sun’s past behavior? To investigate the long-term behavior of the Sun, researchers reach for historical records of sunspots, which stretch back to the 1700s.

maps of simulated photospheric magnetic fields

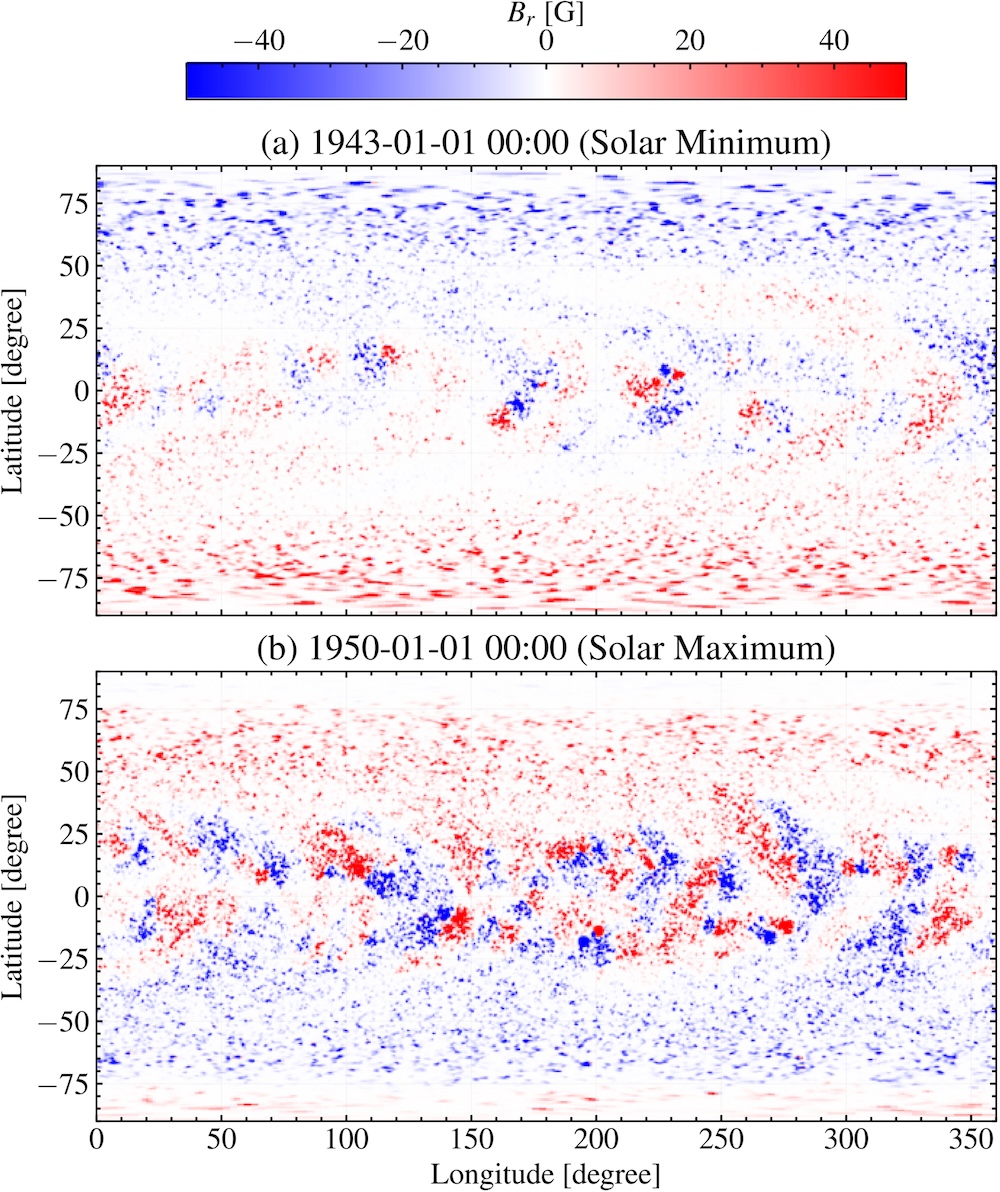
Example maps of the simulated photospheric radial magnetic field during a period of low (top) and high (bottom) solar activity. Click to enlarge. [Jha et al. 2026]

Bibhuti Kumar Jha (Southwest Research Institute) and collaborators explored whether historical records and modern statistics could be used to reconstruct the behavior of the solar magnetic field centuries into the past. Jha’s team used recorded sunspot numbers from 1755 to 2020 as an input for their newly developed Synthetic Active Region Generator, which generates synthetic solar active regions based on known statistics of these regions. This catalog of active regions becomes the input for the Advective Flux Transport model, which simulates the active regions as they emerge and evolve, allowing for an estimation of the magnetic field across the Sun’s disk.

Jha and coauthors found that this method successfully reproduced the expected large-scale behavior of the Sun’s magnetic field across multiple solar cycles, such as the reversal of the polarity of the solar magnetic field near the peak of the activity cycle. While this work highlights the impressive results obtained from combining historical sunspot records with modern sunspot statistics, the team pointed out that this method cannot accurately reproduce all quantities because of the nonlinear nature of the underlying physics. Future work will refine the model further, and in the meantime, the team’s simulated historical magnetic field maps will be made publicly available.

Where Do the Tiniest Coronal Jets Come From?

The Sun’s atmosphere is filled with an ever-shifting maze of magnetic field lines, which reconfigure and release pent-up magnetic energy in a process called magnetic reconnection. Magnetic reconnection can launch particles and heat plasma, and it’s thought to be responsible for driving jets on a variety of scales in the Sun’s tenuous outer atmosphere, or corona. Annu Bura (Indian Institute of Astrophysics; Pondicherry University) and coauthors investigated the physical origins of the smallest of these reconnection driven jets, picoflare jets, using data from the Extreme Ultraviolet Imager on board Solar Orbiter. Solar Orbiter has ventured within 0.3 au of the Sun, and its Extreme Ultraviolet Imager has returned exceptionally precise high-energy images of our home star.

Examples of coronal jetlets

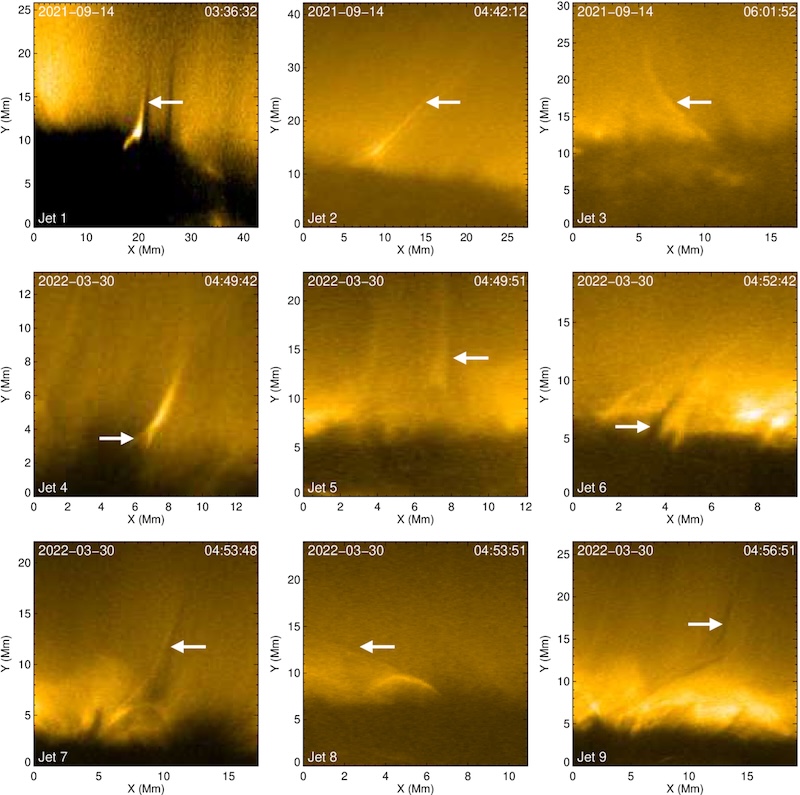
Examples of jets identified in this study. You can see an animation of this figure. [Bura et al. 2026]

Bura and collaborators identified picoflare jets by the presence of a hot, bright spire coupled with a cool, dark streak, forming a structure shaped like the letter “Y” upside down. They found that the bright and dark features were on average 650 and 490 kilometers wide, respectively, with a typical jet length of 16,900 kilometers. They also found that the bright features moved more quickly than the dark features, and the jets tended to last about 6 minutes. Overall, these measurements place the jets in between the scales expected for picoflare jets and slightly larger features called jetlets, though the energies are consistent with expectations for picoflare jets.

Using radiation magnetohydrodynamics simulations, the team explored the origins of their sample of jets. The simulations suggested that the bright features arose from hot, tenuous coronal plasma, while the accompanying dark features were due to cooler, denser plasma venturing upward from deeper in the Sun’s atmosphere, in the chromosphere. Overall, the simulations and observations support a picture in which picoflare-scale jets are driven by magnetic reconnection after magnetic flux emerges through the Sun’s surface. This echoes the formation route of larger coronal jets, suggesting that this process may apply to a wide range of physical scales.

Investigating the Influence of the Solar Polar Magnetic Field

The vast majority of our observations of the Sun have come from within a few degrees of the ecliptic plane, either from telescopes situated on Earth’s surface or from spacecraft that stuck close to the plane of our solar system. With rare but notable exceptions — the Ulysses spacecraft, which measured the Sun’s magnetic field and plasma environment from a near-polar orbit, and Solar Orbiter, which took the first-ever image of the Sun’s poles in November 2025 — the Sun’s poles have remained hidden from our instruments.

Our limited knowledge of the Sun’s polar magnetic field has consequences for our ability to model space weather events like coronal mass ejections. A team led by Xiao Zhang (Chinese Academy of Sciences; University of Chinese Academy of Sciences) has used numerical simulations to investigate how solar polar magnetic field conditions influence the propagation of a coronal mass ejection (CME) through the solar system.

Simulation results showing the propagation and expansion of a coronal mass ejection

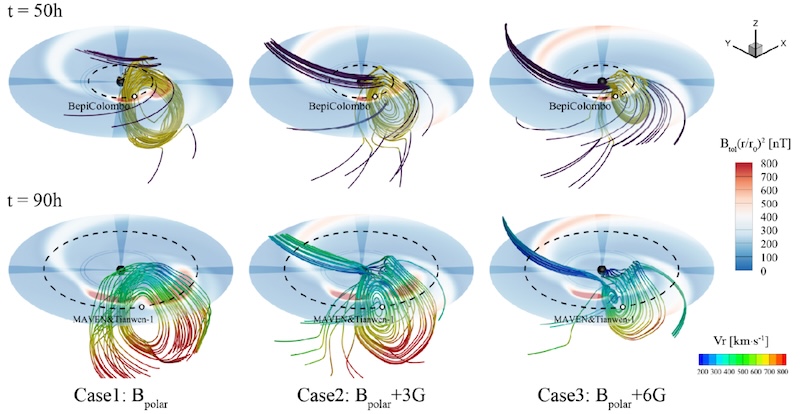
Simulation results showing how the propagation and expansion of a CME are affected by the polar magnetic field strength. Click to enlarge. [Zhang et al. 2026]

The team simulated a CME from 4 December 2021, which was observed by the BepiColombo spacecraft at Mercury and Tianwen-1 and MAVEN at Mars. The simulations showed that as the polar magnetic field strength increases, the CME’s movement through the solar system becomes slower. CMEs typically expand as they billow outward from the solar corona and sweep past the planets; increasing the polar magnetic field strength slowed the CME’s expansion as well. A stronger polar magnetic field also alters the background solar wind, making it slower and denser. Overall, these results demonstrate that the strength of the Sun’s poorly constrained polar magnetic field can have a significant impact on the movement and evolution of a CME. In future work, Zhang’s team plans to expand their investigation to a larger sample of CMEs.

Citation

“Historical Reconstruction of Solar Surface Magnetism from Cycles 1–24 Using the Synthetic Active Region Generator and the Advective Flux Transport Model,” Bibhuti Kumar Jha et al 2026 ApJ 997 279. doi:10.3847/1538-4357/ae279a

“On the Origin of Coronal Picoflare Jets,” Annu Bura et al 2026 ApJ 1000 94. doi:10.3847/1538-4357/ae48e6

“Influence of Solar Polar Magnetic Fields on the Propagation of Coronal Mass Ejections,” Xiao Zhang et al 2026 ApJ 1000 200. doi:10.3847/1538-4357/ae4c54

The post Monthly Roundup: Science of the Sun appeared first on AAS Nova.
Detecting New Icy Molecules Around a Newly Forming Star with JWST

31 March 2026 at 17:00

Large Magellanic Cloud

Editor’s Note: Astrobites is a graduate-student-run organization that digests astrophysical literature for undergraduate students. As part of the partnership between the AAS and astrobites, we occasionally repost astrobites content here at AAS Nova. We hope you enjoy this post from astrobites; the original can be viewed at astrobites.org.

Title: Protostars at Subsolar Metallicity: First Detection of Large Solid-State Complex Organic Molecules in the Large Magellanic Cloud
Authors: Marta Sewiło et al.
First Author’s Institution: NASA Goddard Space Flight Center
Status: Published in ApJL

Stars and planets form when clouds of molecules collapse in on themselves due to the overwhelming force of gravity (which, relatable). This process is quite mysterious, as these clouds will only live for a couple million years before collapsing, and the newly forming protostars only live for about half a million years before becoming main-sequence stars.

But we are able to find some protostars in the Milky Way and in the Small and Large Magellanic Clouds near us, and observing the molecules around these protostars can help us understand how protostars form.

To look for molecules around protostars, astronomers take spectra of the protostars in the infrared, which is a wavelength region where molecules emit a lot of light. As better instruments are being built, astronomers are more often able to look for what are called complex organic molecules, which are carbon-bearing molecules with at least six atoms.

These complex organic molecules can be detected in different states: most detections have been of gaseous molecules in and around protostars or planet-forming disks, but they can also be found in a solid state on the surfaces of dust grains in the interstellar medium in a galaxy. In this state, they are called complex organic molecule “ices.” These “ices” were rarely found pre-JWST, but since its launch, detections have been more numerous, mainly in the Milky Way. Observing these complex molecules on the surfaces of dust grains tells us more about protostellar dust chemistry, which is an important but still mysterious aspect of star formation.

In this study, researchers look outside of our own galaxy to explore the complex organic molecules in the Large Magellanic Cloud (LMC). The LMC is an interesting place to look for these molecules because it has lower metal content (i.e., elements heavier than hydrogen and helium) than the Milky Way, as well as a harder radiation field. This means photons flying around in the LMC generally have higher energies than photons flying around in the Milky Way, and elements like carbon, oxygen, and nitrogen are less abundant. This is important because these conditions are more similar to what typical galaxies were like in the early universe. Thus the LMC is a better test bed to look at protostars than the Milky Way if we want to understand how stars formed in the early universe.

The authors of this study have found signatures of complex organic molecules in protostars forming in the LMC. They focus on the protostar ST6 in the LMC, shown in the right image in Figure 1. They used JWST’s Mid-Infrared Instrument to take spectra of the region around ST6.

Large Magellanic Cloud and N158

Figure 1: The LMC (left) and a zoomed-in view of region N158 (right) containing protostar ST6, the focus of this study. In the inset panel of the right picture, contours of carbon monoxide emission are shown. [Sewiło et al. 2025]

Spectroscopic Signatures of Molecules on Dust Grains

The researchers used the Python tool called dEcompositioN of Infrared Ice features using Genetic Modelling Algorithms (ENIIGMA) to fit the spectroscopy. This code compares the spectra to laboratory data of these complex organic molecules at the temperatures we see in the LMC. The authors fit for complex organic molecules they might expect to see, and they detect methanol (CH3OH), acetaldehyde (CH3CHO), ethanol (CH3CH2OH), methyl formate (HCOOCH3), and acetic acid (CH3COOH); of these, acetaldehyde, ethanol, and methyl formate have never before been detected outside of the Milky Way. Interestingly, this is the first time acetic acid has been definitively detected in any astrophysical environment. The spectral contribution from each molecule is shown in Figure 2; all the individual contributions added together make up the observed spectrum.

spectrum of the protostar ST6

Figure 2: Model fits to the spectrum of the protostar ST6 using the code ENIIGMA. Molecules and their fitted emission are given in the legend. [Sewiło et al. 2025]

These detections provide evidence that these complex organic molecules can be produced on the surfaces of dust grains. Further, their detection in the LMC provides evidence that these molecules can be produced in “harsh” environments like the LMC, with lower metal content and harder radiation fields.

When the authors compared the abundances of these ices to other protostars in the Milky Way galaxy, they found that the abundances are slightly lower around the LMC protostar. This may happen because the dust temperatures are generally higher in the LMC due to the higher-energy photons, which affect the chemistry happening on the dust. Some species they found, however, do have similar abundances to the Milky Way protostars, indicating that the harder radiation field of the LMC does not affect how these species form. Finding more complex organic molecules in the Magellanic Clouds will help us understand further how these compounds form on dust grains and how the galactic environment may affect their formation.

Original astrobite edited by Shalini Kurinchi-Vendhan.

About the author, Caroline von Raesfeld:

I’m a third-year PhD student at Northwestern University. My research explores how we can better understand high-redshift galaxy spectra using observations and modeling. In my free time, I love to read, write, and learn about history.

The post Detecting New Icy Molecules Around a Newly Forming Star with JWST appeared first on AAS Nova.
Details on Dinkinesh and Its Surprise Satellite from the Lucy Mission

20 March 2026 at 16:00

Dinkinesh and Selam

The Lucy spacecraft, en route to its primary mission targets, zipped past the main-belt asteroid Dinkinesh and revealed its tiny satellite, Selam. New research examines the surfaces and histories of these small rocky worlds.

A Stop Along the Way

In 2021, the Lucy spacecraft embarked on a 12-year mission to study several Jupiter trojan asteroids, which share Jupiter’s orbit. The spacecraft won’t have its first encounter with a Jupiter trojan until 2027, but it hasn’t been idle during its long journey. In November 2023, Lucy performed a dress rehearsal of its trojan-encounter maneuvers during a flyby of a 738-meter-wide main-belt asteroid called (152830) Dinkinesh.

Dinkinesh and Selam

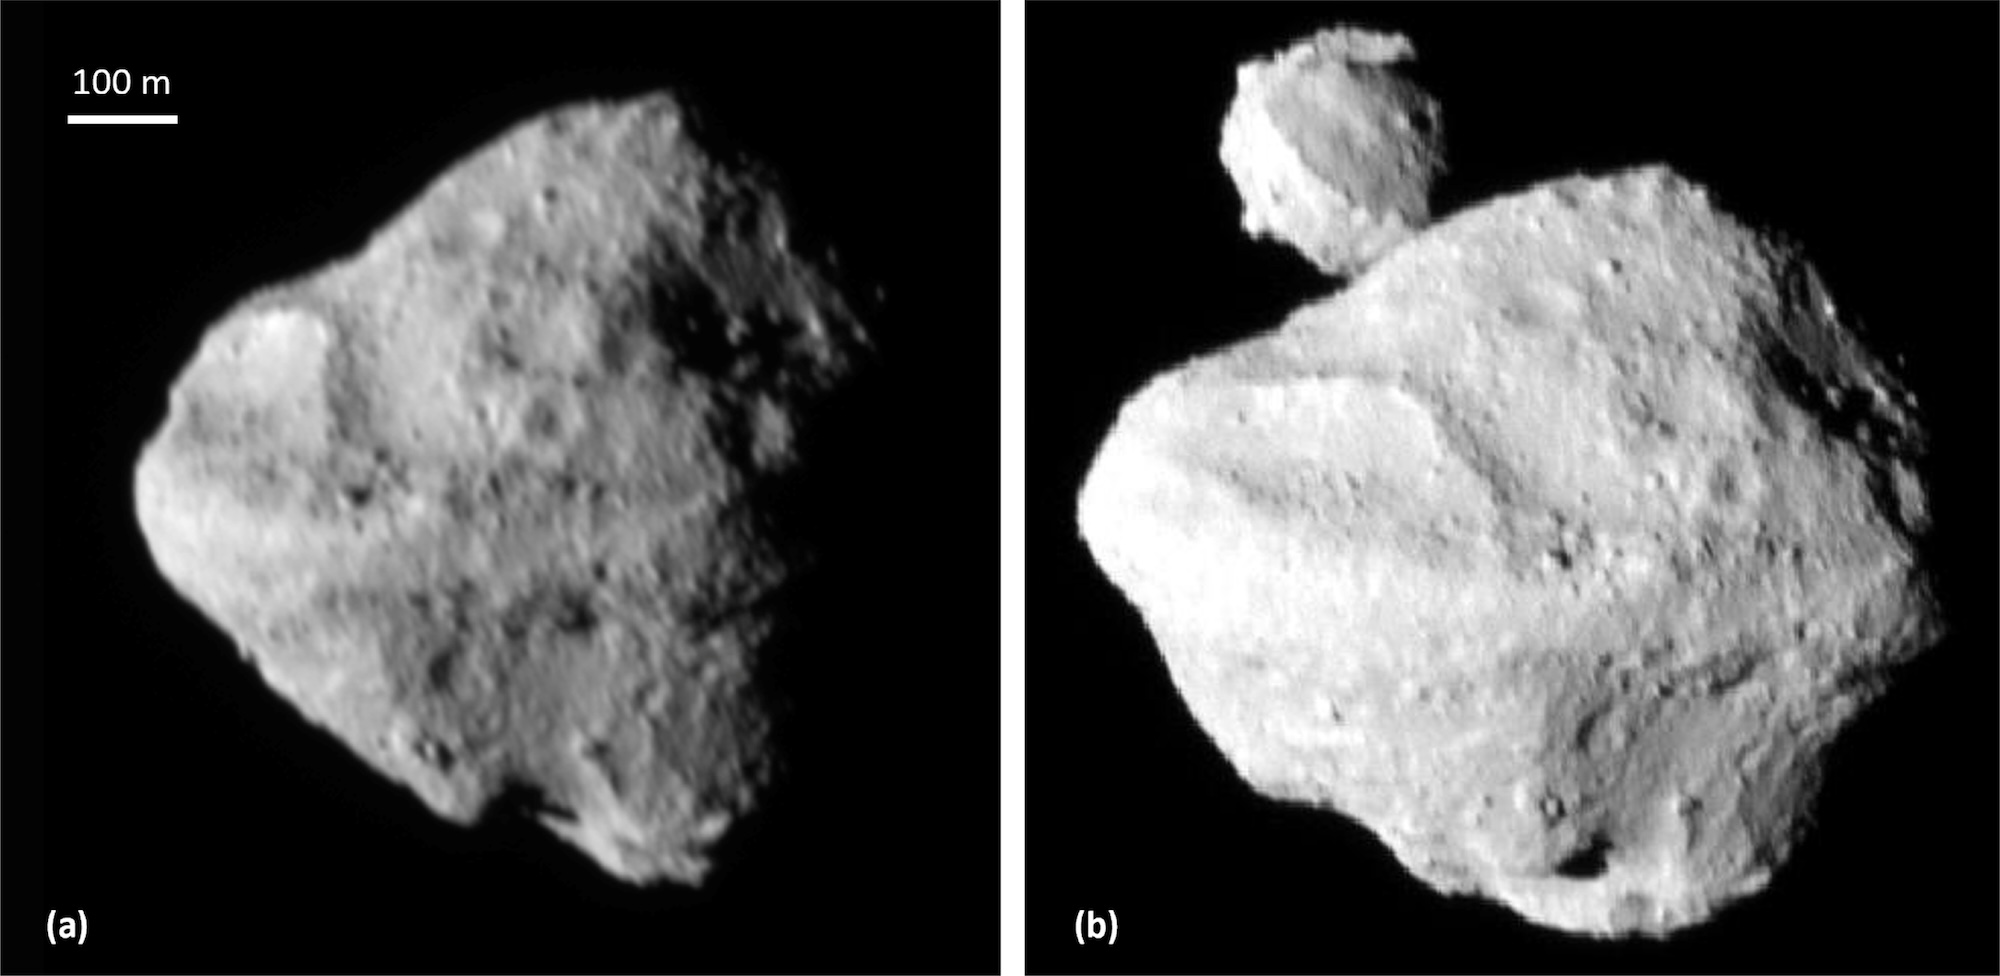
Two images of Dinkinesh from the Lucy mission. The second image features its satellite, Selam. [Bierhaus et al. 2025]

During this flyby, Lucy flew within 430 km (267 mi) of the asteroid and made a surprise discovery: Dinkinesh has a tiny companion, which has been named Selam. (The name Dinkinesh comes from the Amharic name for the Lucy fossil discovered in 1974; Selam is similarly named after a hominid fossil that is sometimes called “Lucy’s baby.”) Remarkably, Selam is the first known asteroid satellite that is a contact binary, made up of two separate bodies that have gently merged into one.

Craters and Boulders

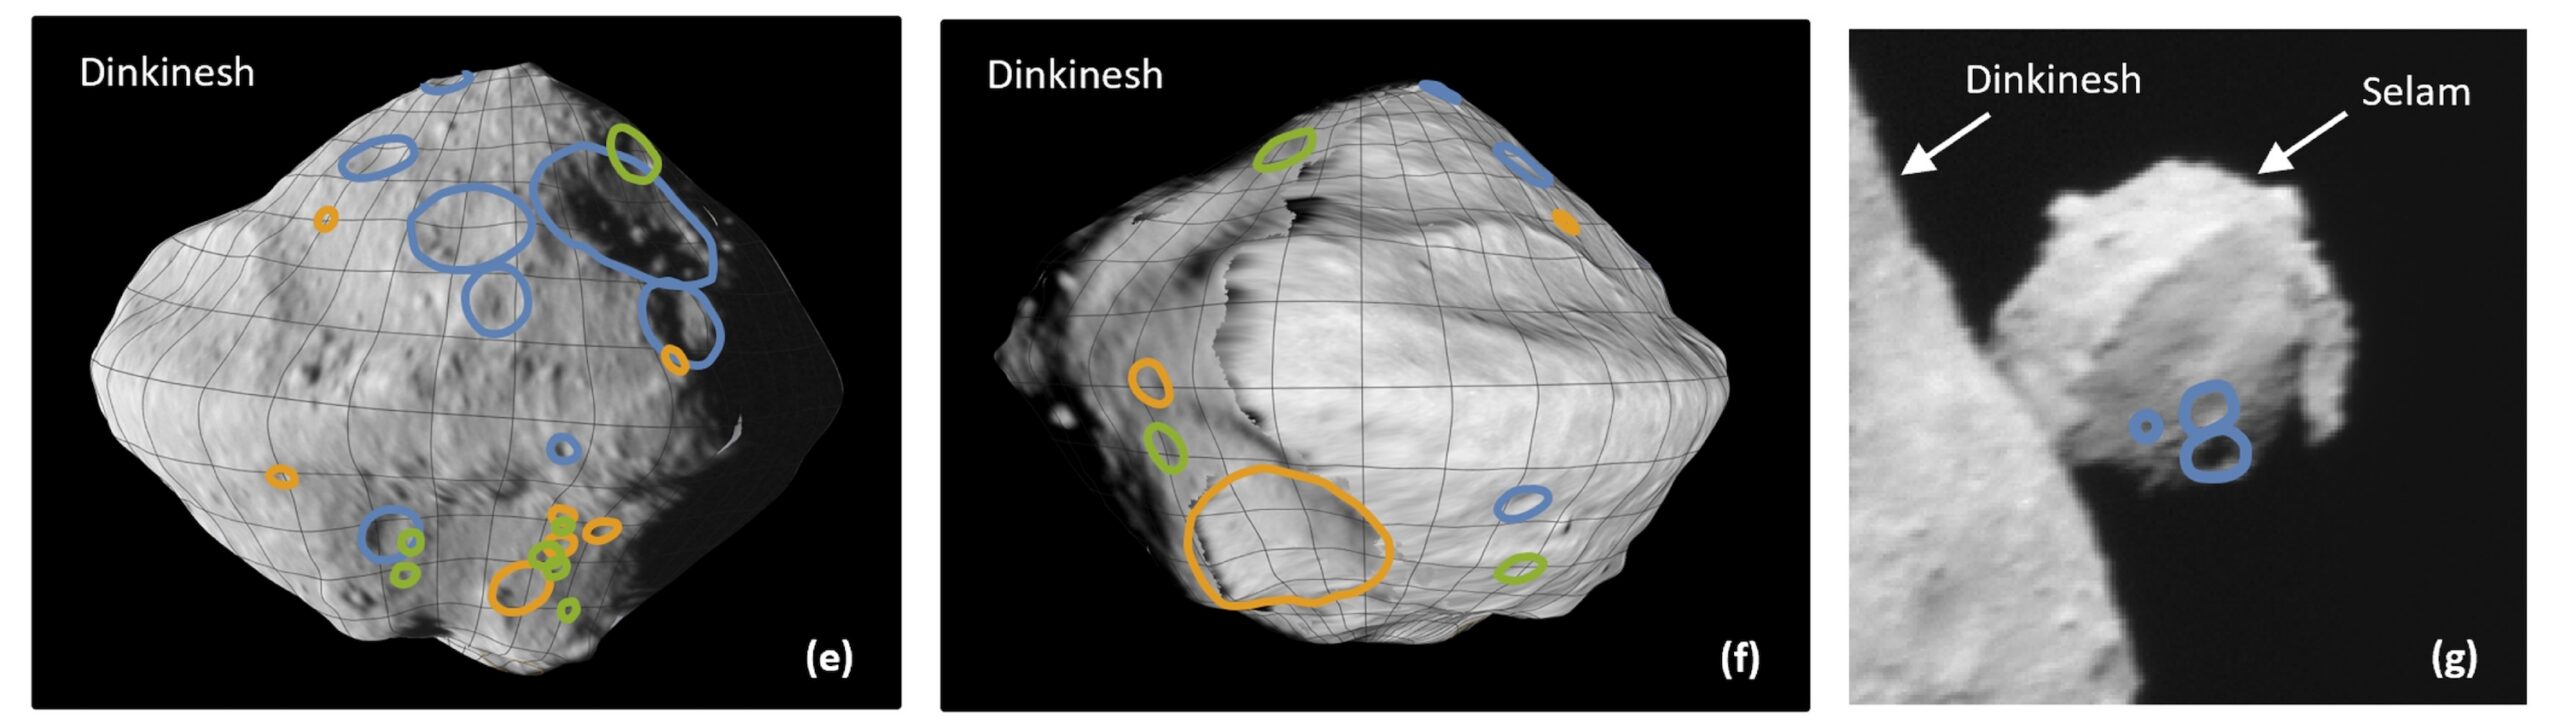
In a recent research article, Edward Bierhaus (Lockheed Martin Space) and collaborators analyzed Lucy flyby images to study the surfaces of Dinkinesh and Selam. The team analyzed global features like troughs and ridges and measured visible craters and boulders.

craters on Dinkinesh and Selam

Locations of craters on Dinkinesh and Selam. The blue lines indicate the most confidently identified craters; orange and green lines mark craters identified less confidently. Click to enlarge. [Bierhaus et al. 2025]

While the small numbers of craters detected — 29 for Dinkinesh and 3 for Selam — makes further analysis difficult, the team determined that Dinkinesh’s crater size–frequency distribution is shallower than expected, though similar to that of small near-Earth asteroids (e.g., Ryugu). The seemingly shallow distribution may be an effect of the phase angle and resolution of the observations, or it could be a sign of impact armoring or other surface processes.

The size–frequency distribution of Dinkinesh’s boulders, on the other hand, is somewhat steeper. This discovery may mean that S-type (stony) asteroids like Dinkinesh have different boulder size distributions than C-type (carbonaceous) asteroids.

Possible Histories

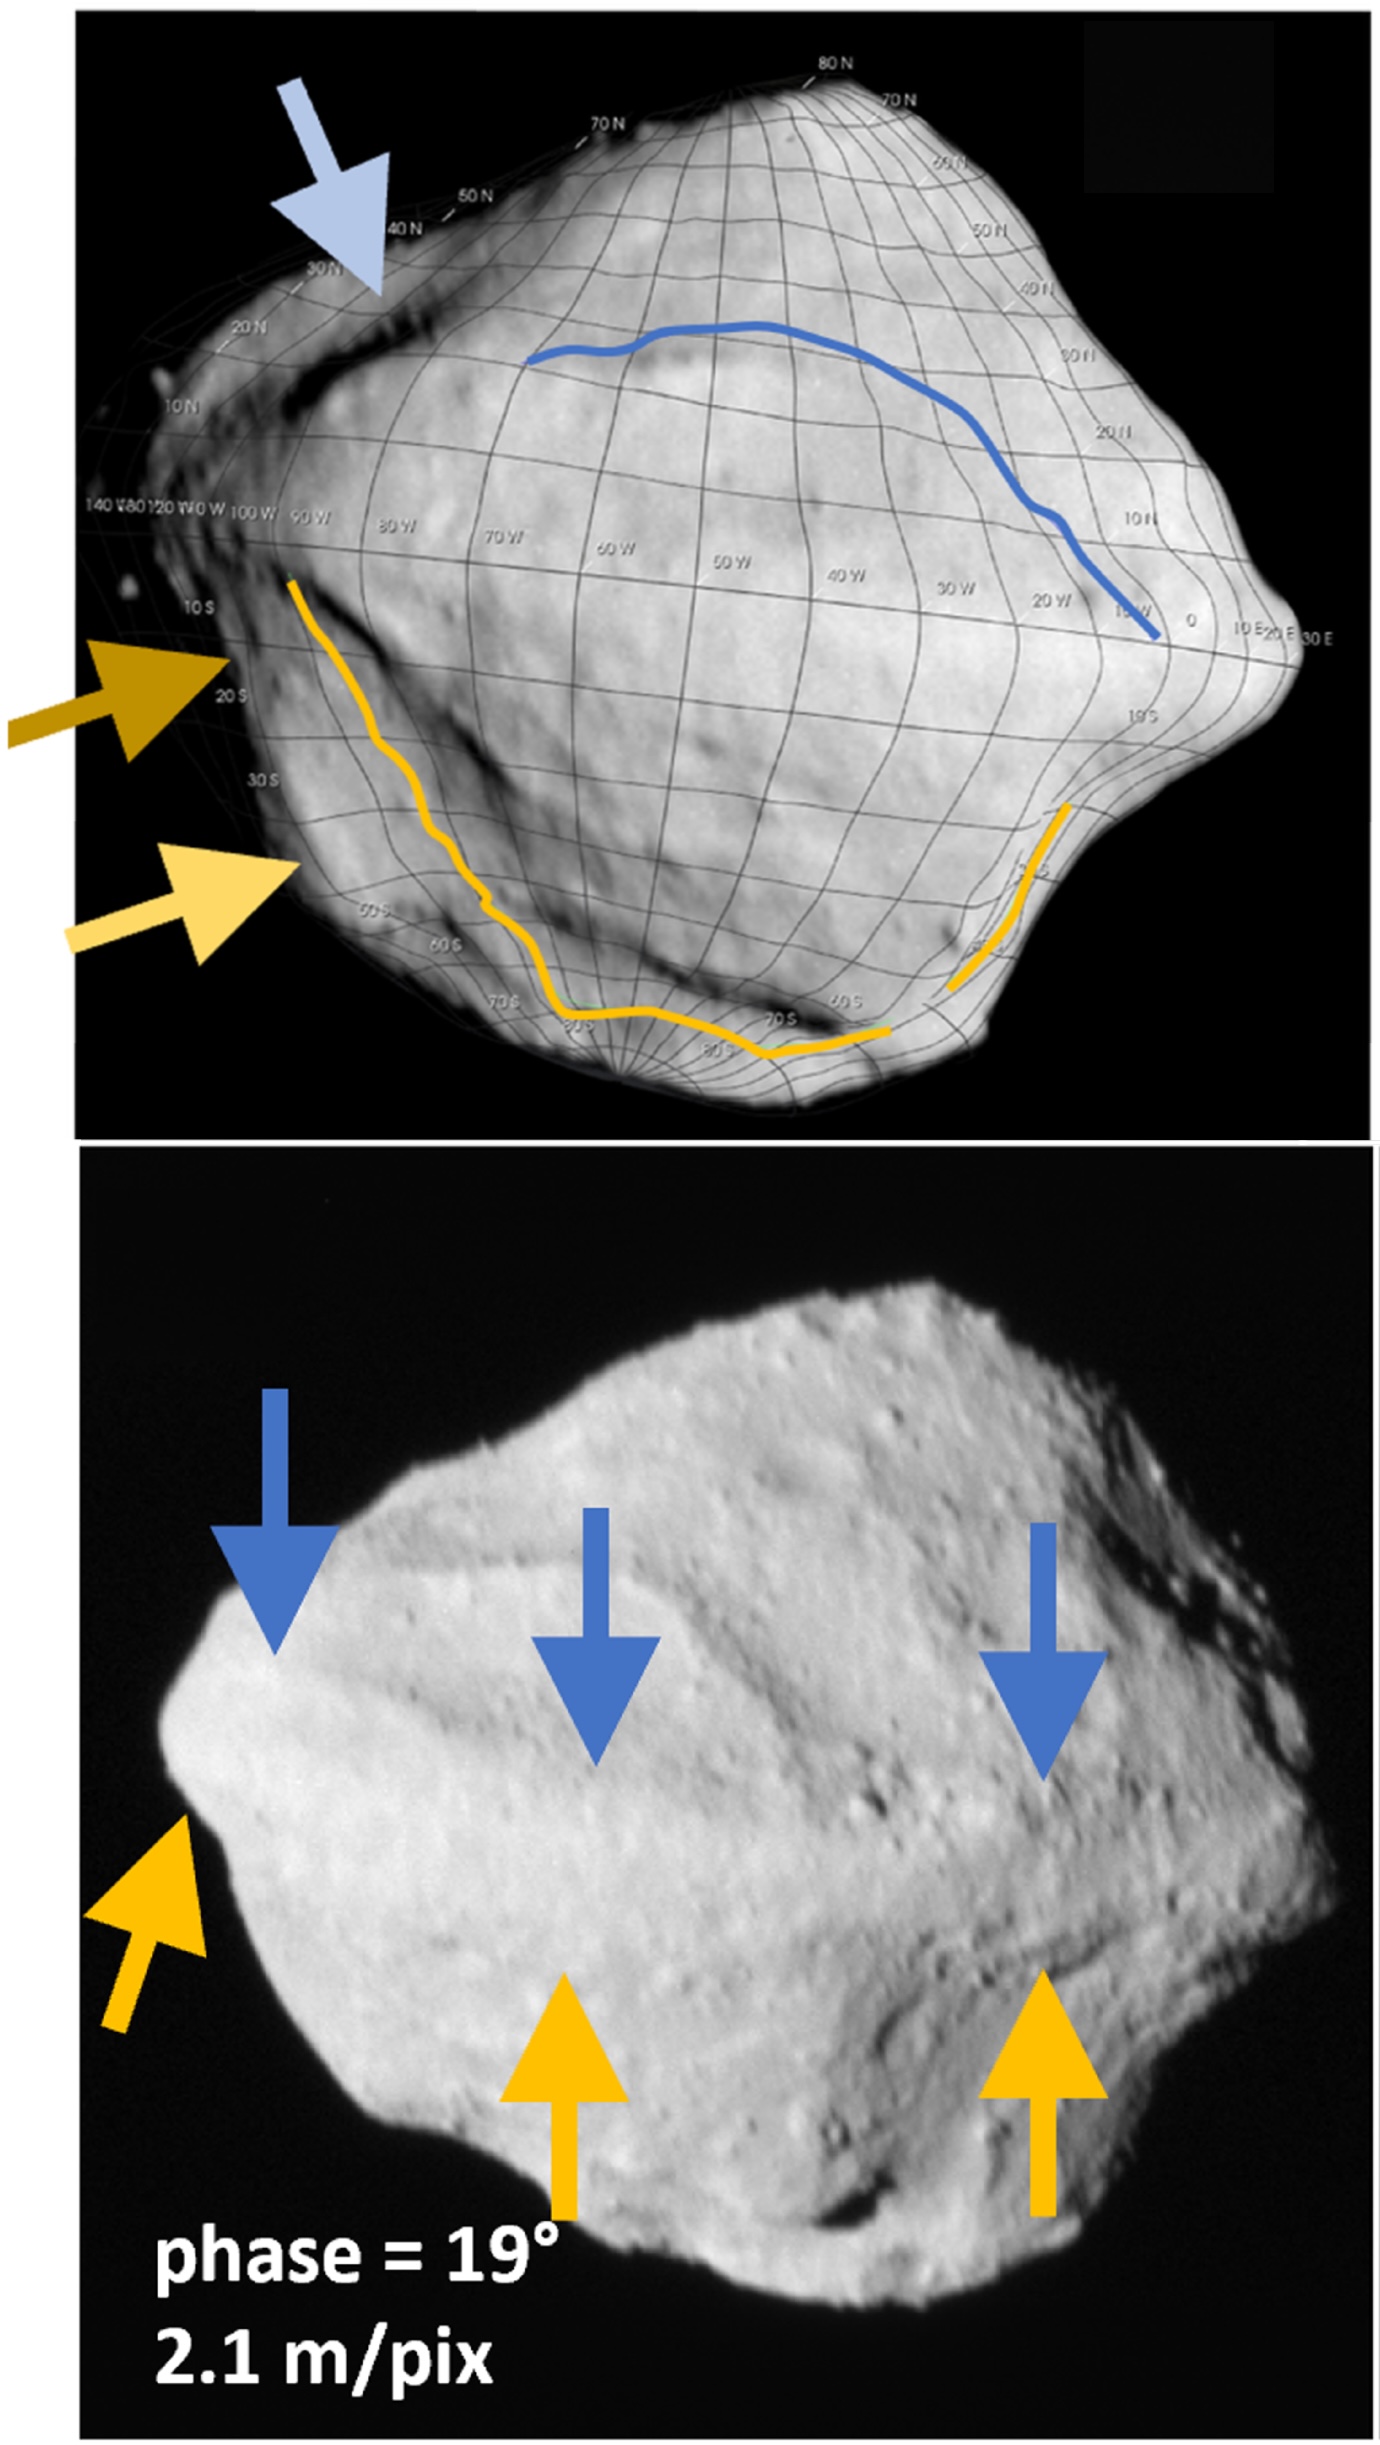
An analysis of the collisional timescales in the main asteroid belt suggests that Dinkinesh is a fragment of a larger asteroid that was split apart at least once, though it’s not yet possible to say which parent body it might have come from. After splitting off from its parent asteroid, Dinkinesh appears to have been subjected to the Yarkovsky–O’Keefe–Radzievskii–Paddack (YORP) effect. This effect arises when sunlight falls on a small asymmetric asteroid, creating a torque that can alter its spin rate. In extreme cases, the YORP effect can crank up an asteroid’s spin rate so much that it sheds some of its surface material or flies apart altogether.

Sumak Fossa and Fab Dorsum on Dinkinesh

Locations of Sumak Fossa (top) and Fab Dorsum (bottom) indicated with arrows. [Adapted from Bierhaus et al. 2025]

Dinkinesh seems to show clear signs of YORP-driven structural failure. Sumak Fossa (a large trough) and Fab Dorsum (a ridge running along the asteroid’s equator) may have formed through this process. If Sumak Fossa was excavated by a YORP-induced mass-shedding event, both Fab Dorsum and Selam could have formed out of the cast-off material.

With Lucy en route to its primary objective, there’s still much for us to learn from this mission about the small bodies of our solar system. In the meantime, be sure to check out the full article linked below, as there are far more details about Dinkinesh and Selam than could be included in this short summary!

Citation

“The Geology of a Small Main-Belt S-Class Binary Asteroid System: Dinkinesh and Its Contact Binary Satellite Selam as Observed by the Lucy Mission,” E. B. Bierhaus et al 2025 Planet. Sci. J. 6 299. doi:10.3847/PSJ/ae1968

The post Details on Dinkinesh and Its Surprise Satellite from the Lucy Mission appeared first on AAS Nova.
Disrupted Dwarf Galaxy: Investigating the History of the Small Magellanic Cloud

16 March 2026 at 16:00

Small Magellanic Cloud

Researchers show that the highly disrupted state of the Small Magellanic Cloud can be attributed to a long history of interactions with its neighbor, the Large Magellanic Cloud.

A Disrupted Dwarf Galaxy?

The Small Magellanic Cloud (SMC) is one of the largest and nearest satellites of the Milky Way. At a distance of just 200,000 light-years, the SMC has long been used as an accessible analog for low-metallicity star-forming galaxies in the early universe.

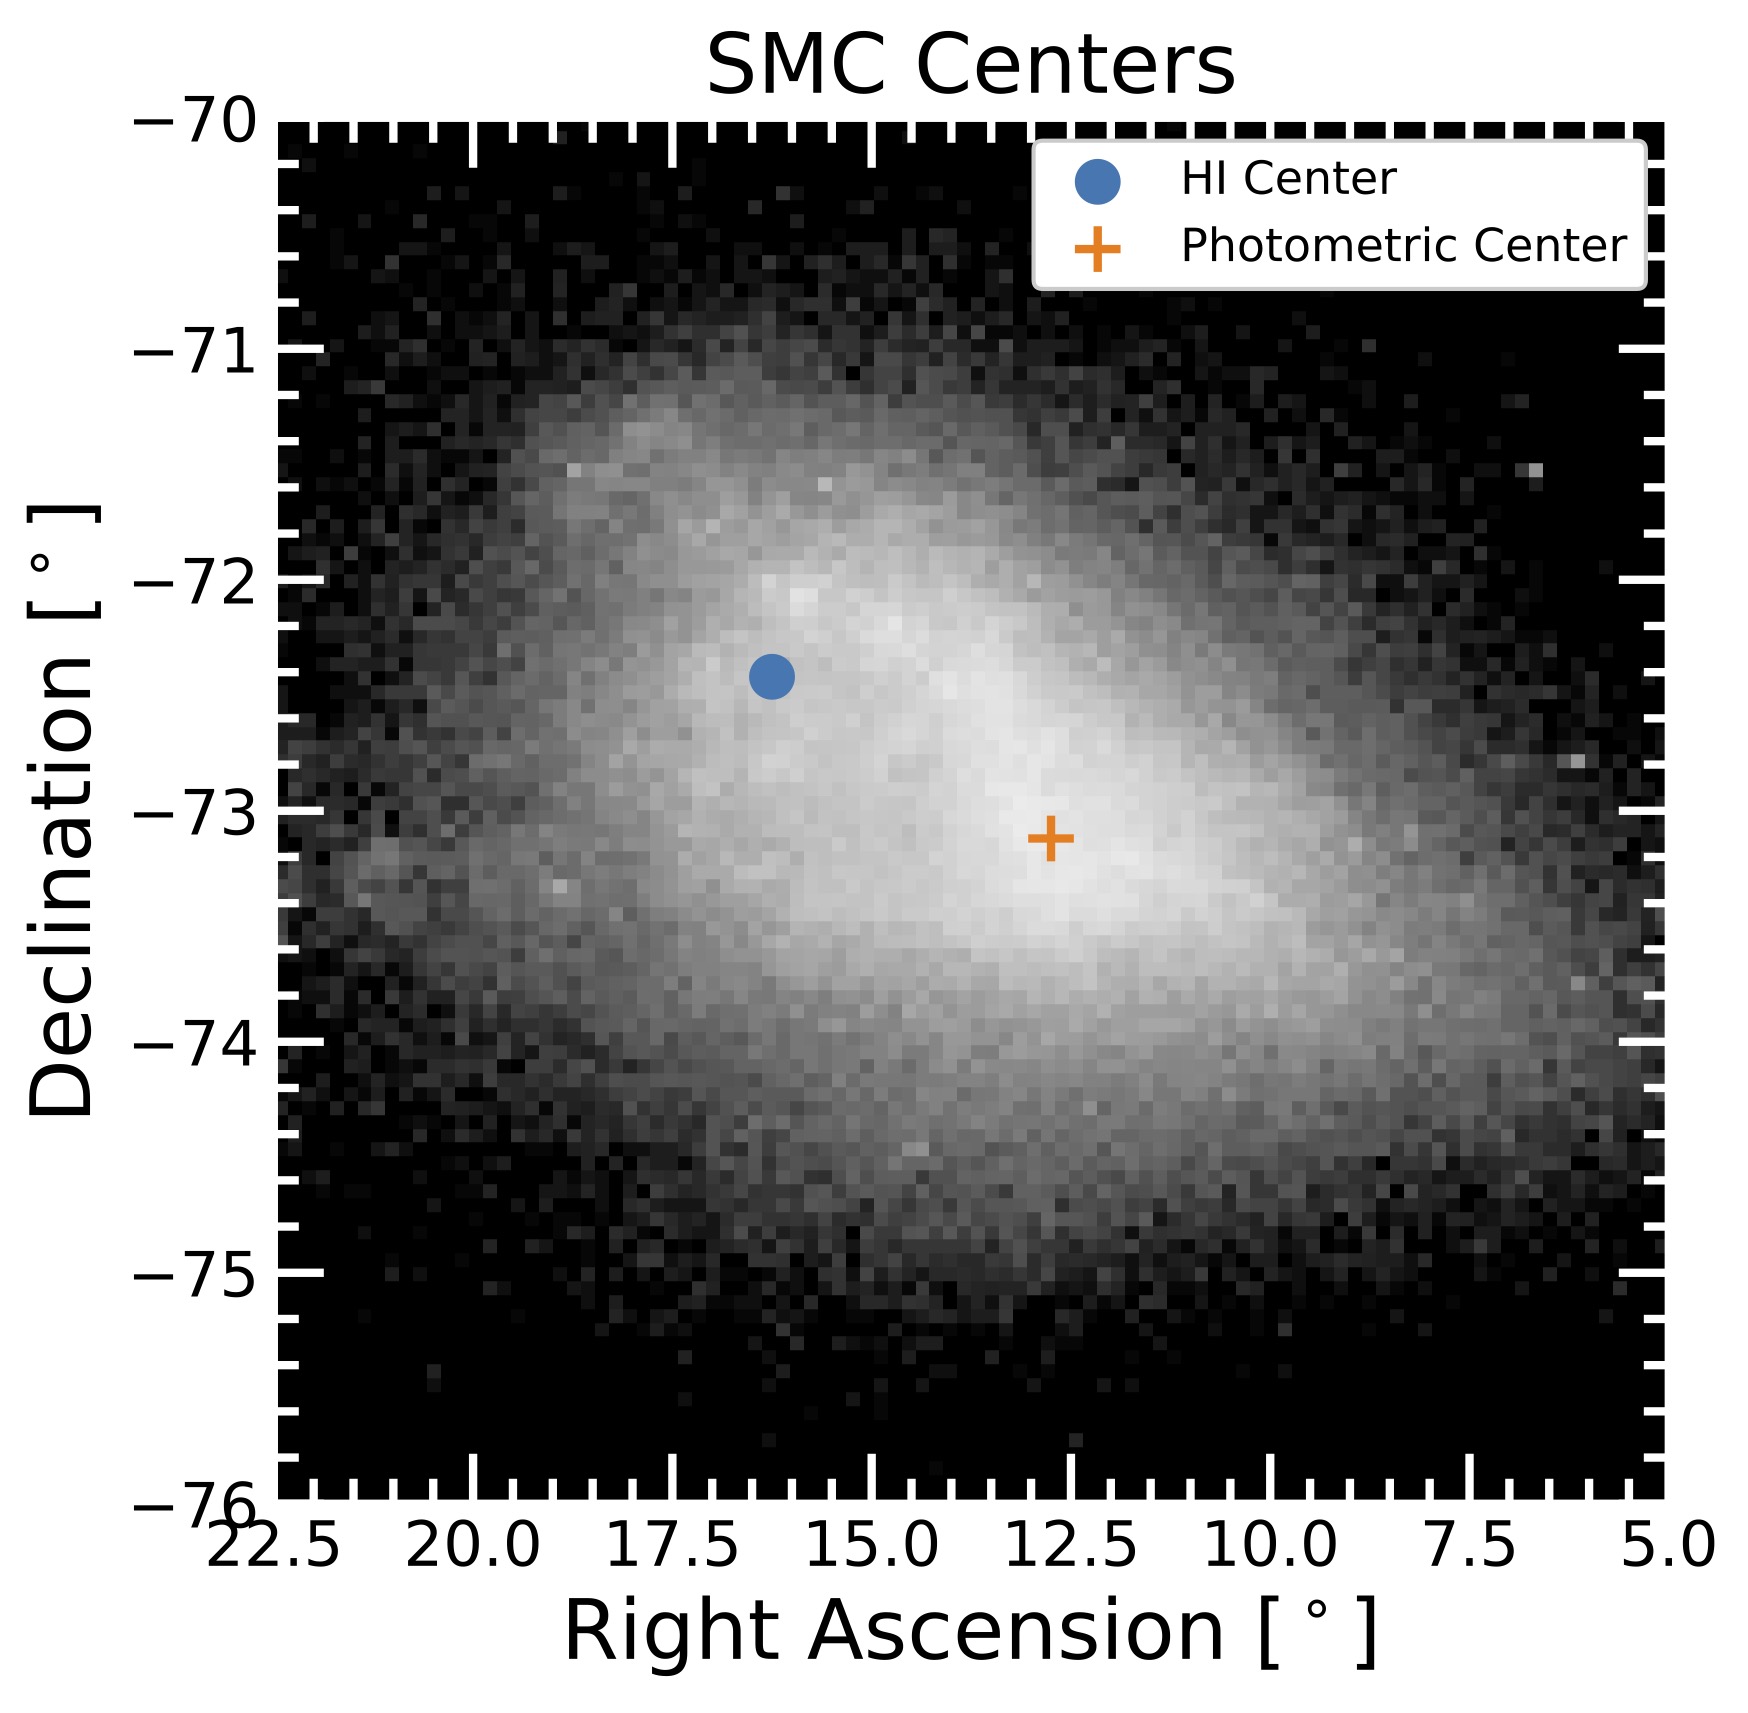
Small Magellanic Cloud photometric and HI kinematic centers

Locations of the SMC’s photometric center and hydrogen gas kinematic center. The two locations are separated by several thousand light-years. [Adapted from Rathore et al. 2026]

However, observations increasingly suggest that the SMC may not be an ideal analog for high-redshift galaxies. The SMC appears to have been disrupted: its gas seems to rotate while its stars do not, it has an unusually large line-of-sight depth compared to its extent on the sky, and its gas distribution has two peaks.

The source of this disequilibrium might be the Milky Way’s largest satellite, the Large Magellanic Cloud (LMC). As the SMC inches along its orbit around the Milky Way, it also engages in a gravitational dance with the LMC. These galaxies may be clumsy dance partners, with data suggesting a potential direct collision between the SMC and LMC within the past 200 million years.

Modeling the Magellanic Clouds

To understand how a potential collision between the Magellanic Clouds might have impacted the present-day properties of the SMC, Himansh Rathore (University of Arizona) and collaborators used hydrodynamical simulations to explore the interconnected histories of the SMC, the LMC, and the Milky Way.

SMC–LMC separation in the authors' models

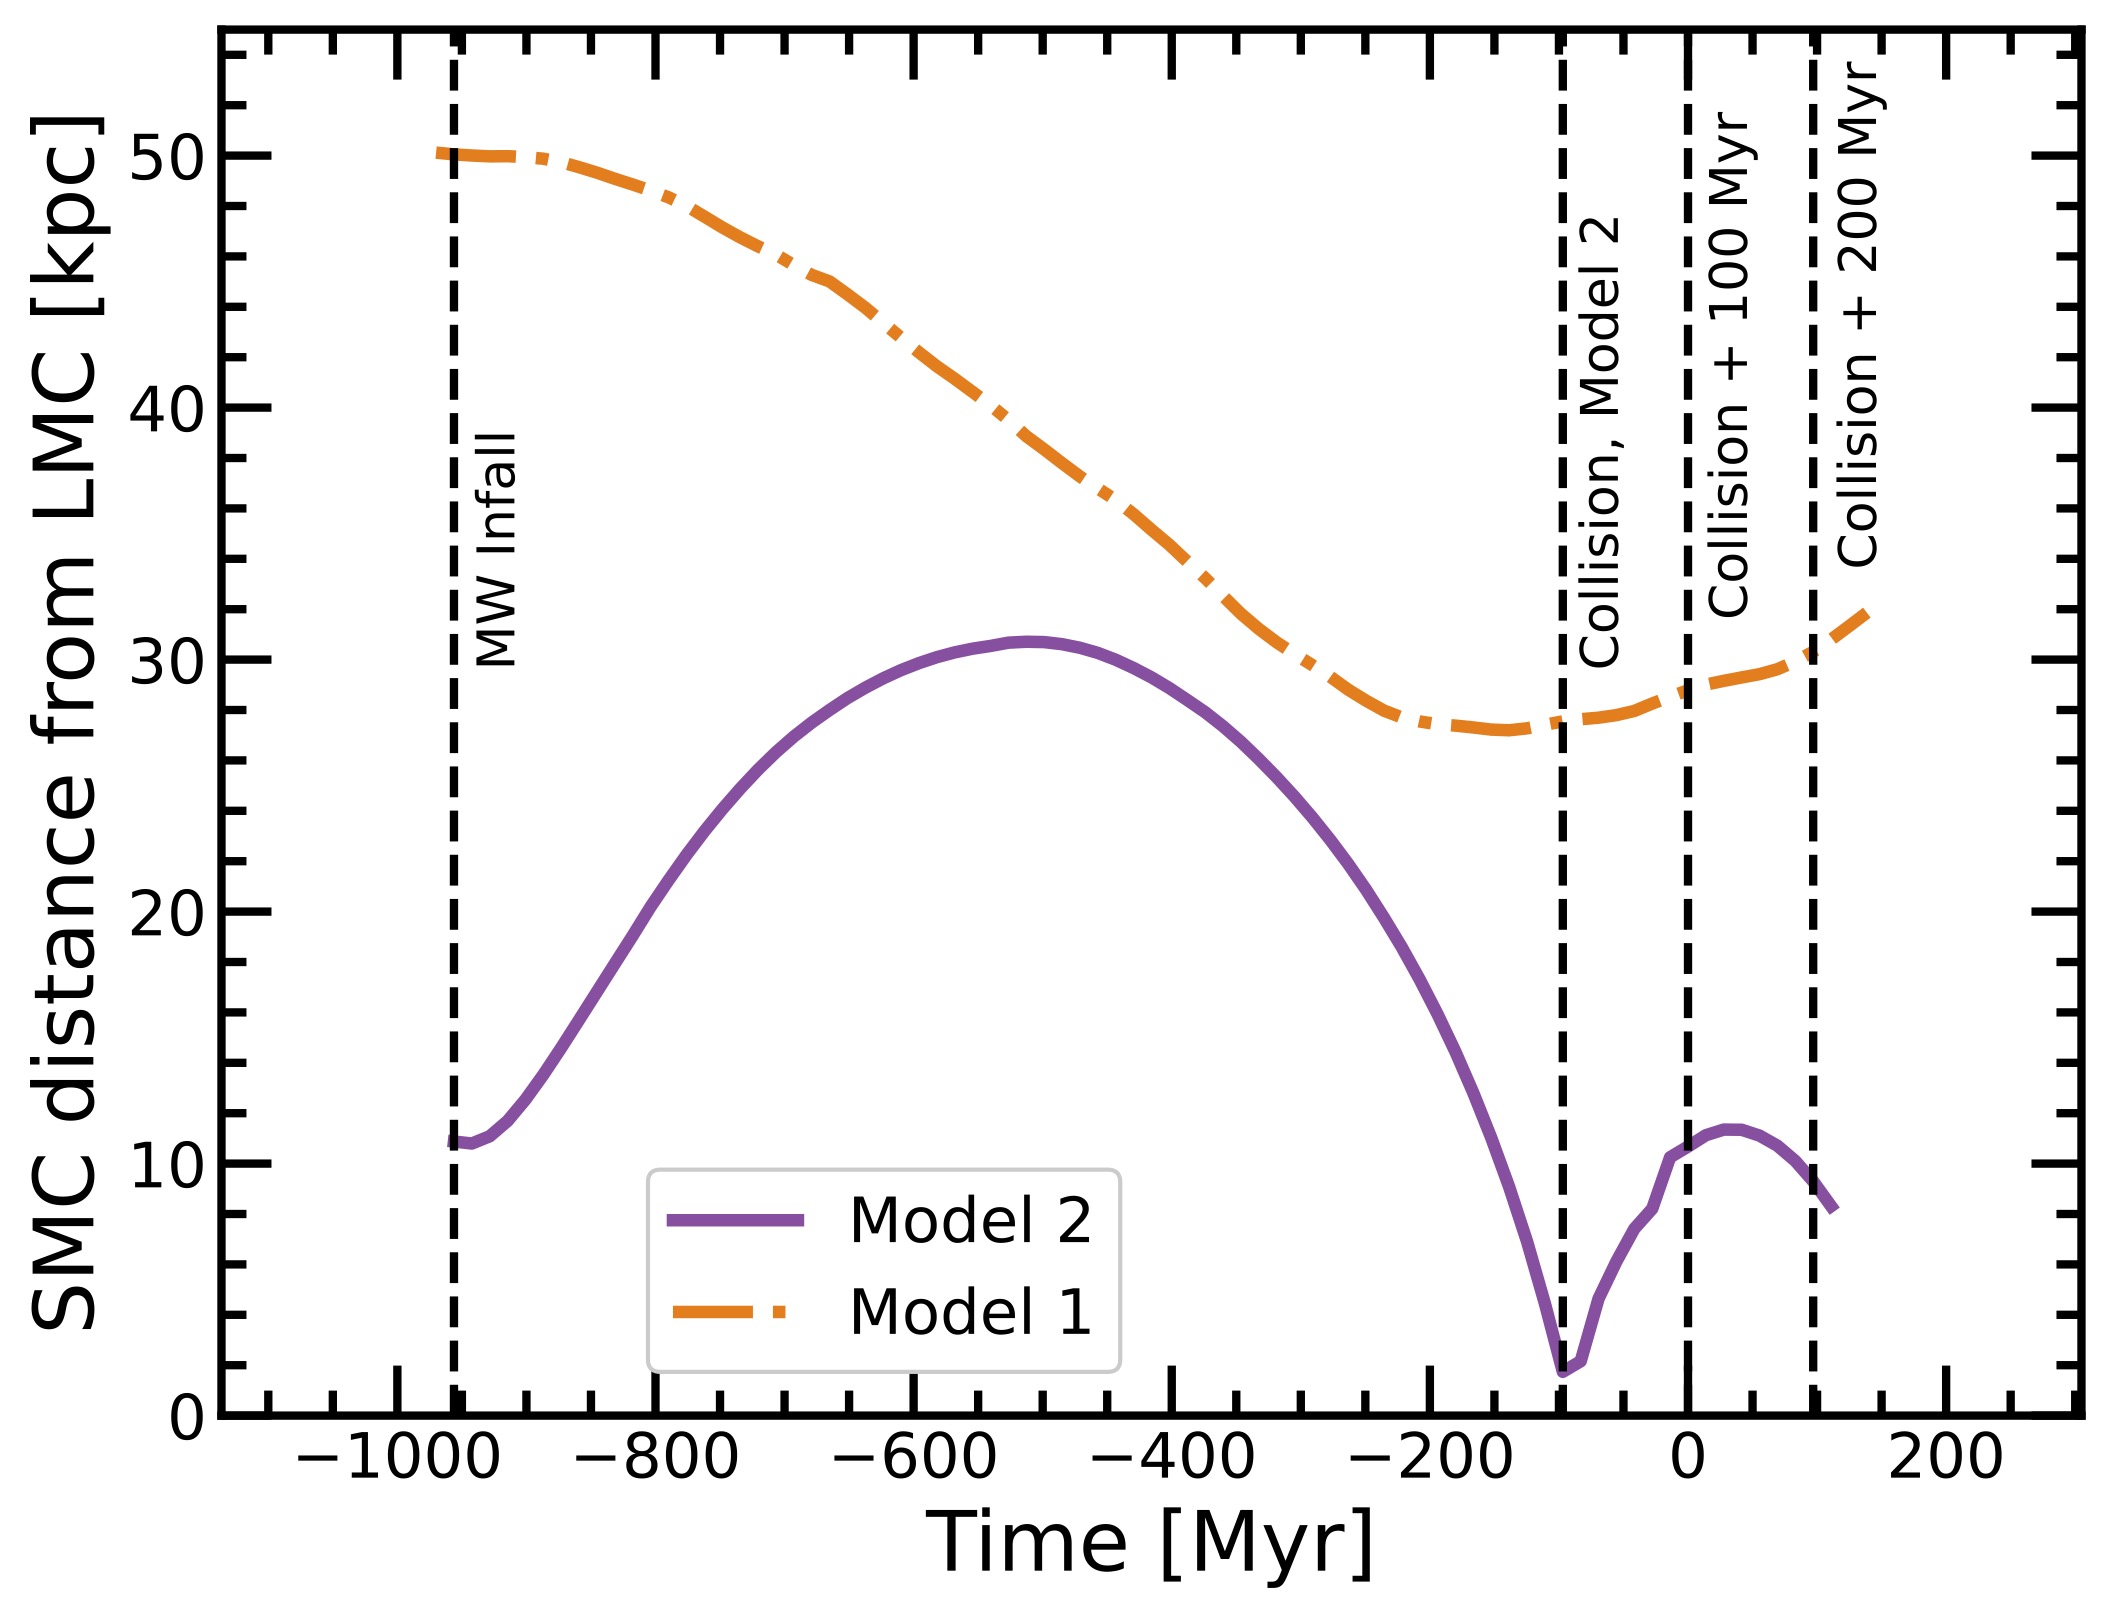
SMC–LMC separation over time in the control model (orange dot-dashed line) and the collision model (purple solid line). Click to enlarge. [Rathore et al. 2026]

At the beginning of the simulations, the SMC is in equilibrium, with its stellar and gaseous components neatly rotating in unison. From there, its fate diverged: in a control simulation, the SMC and LMC maintained a respectful distance, never getting less than about 100,000 light-years from one another. In the collision simulation, the galaxies collided 100 million years ago.

Both of these model scenarios reproduced certain features of the SMC–LMC system, such as the bridge of gas that spans the distance between them. Only the collision scenario, though, can explain the apparent discrepancy between the SMC’s stars and gas.

An Impactful Collision

SMC stellar density and viewing schematic

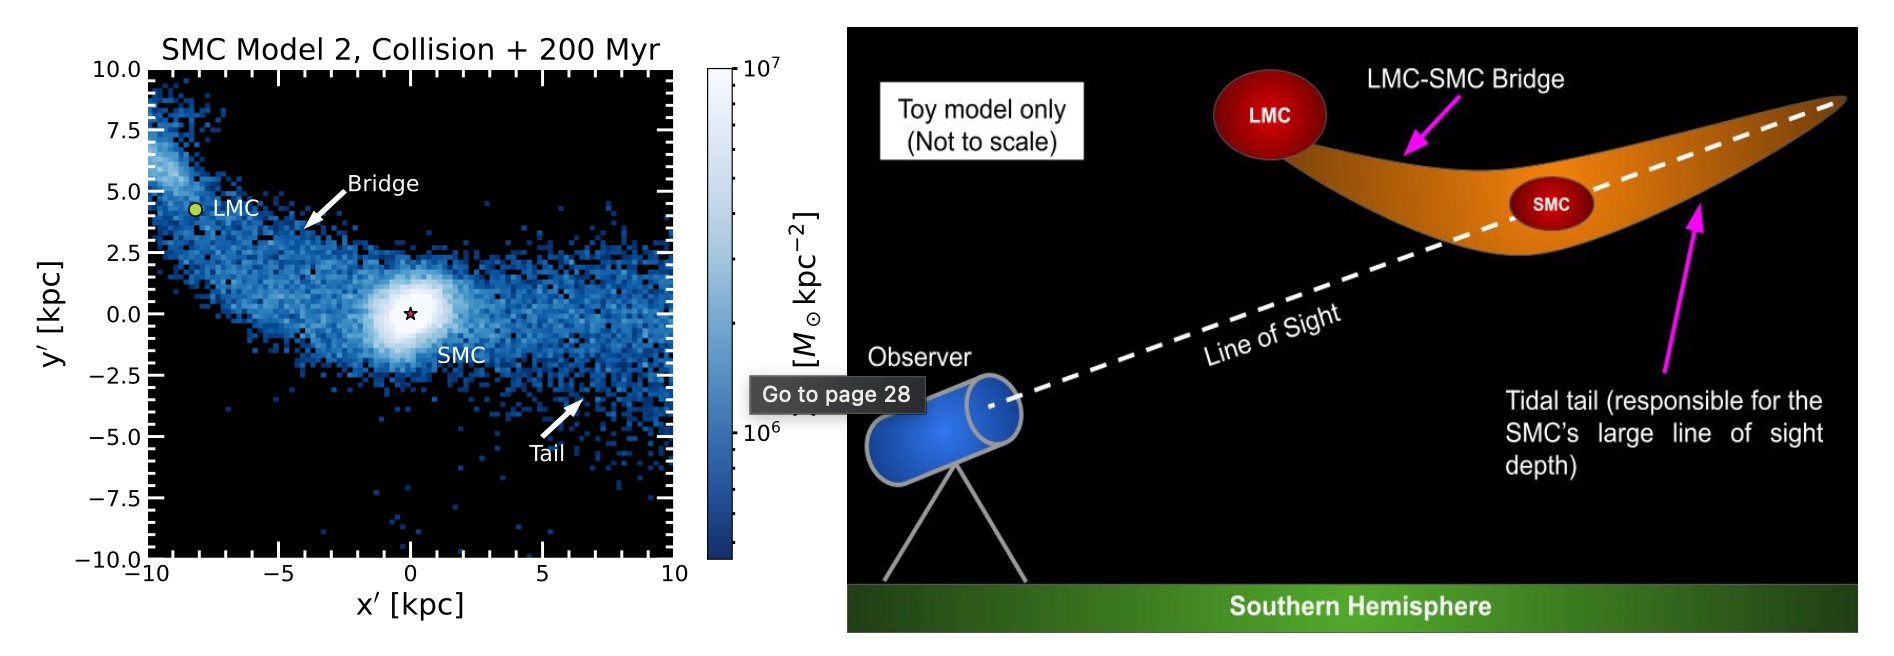
Left: Simulated stellar density 200 million years post-collision. Right: A schematic of our likely perspective on the post-collision SMC–LMC system. Click to enlarge. [Rathore et al. 2026]

Post-collision, the SMC’s stellar population is significantly elongated and features a tidal tail. If this tidal tail is oriented along our line of sight, it would explain why the galaxy’s depth in that direction is unexpectedly large. The presence of a gas tidal tail may also help to explain the two peaks in the galaxy’s gas density.

In terms of the galaxy’s rotation, only the stars nearest the SMC’s center rotate, while the rest move radially outward, swayed by the tidal pull of the LMC. This radial motion is also present in the galaxy’s gas. While previous work has interpreted the observed velocity dispersion of the SMC’s gas as a sign of rotation, Rathore’s team showed that radial expansion, viewed from an inclined angle, can mimic a rotational signature. 

The team also showed that the gas is far more disturbed than the stars, reflecting the pressure exerted by the LMC’s gas when the two galaxies collided. This type of interaction can transform an irregular dwarf galaxy into an ellipsoidal or spheroidal dwarf galaxy — a transition that Rathore’s team argues is underway for the SMC.

Ultimately, these simulations demonstrate that the SMC is a profoundly disrupted galaxy, likely still reeling from a recent collision with its larger neighbor. Viewing the SMC through this lens is critical to understanding its role as an analog to early universe galaxies.

Citation

“A Galactic Transformation — Understanding the SMC’s Structural and Kinematic Disequilibrium,” Himansh Rathore et al 2026 ApJ 1000 50. doi:10.3847/1538-4357/ae4507 

The post Disrupted Dwarf Galaxy: Investigating the History of the Small Magellanic Cloud appeared first on AAS Nova.

Pulling Back the Curtain on DART Ejecta

6 March 2026 at 17:00

In September 2022, the Double Asteroid Redirection Test (DART) mission served as the first attempt at redirecting a near-Earth asteroid — an experiment testing humanity’s ability to fend off any threatening Earth-bound asteroids. A recent study presents the first 3D reconstruction of the impact ejecta, suggesting that the blown-out material is more complex than previous models considered.

DART-ing into Dimorphos 

The DART spacecraft intentionally smashed into Dimorphos, the small and unassuming moon of the larger asteroid Didymos. This space-based crash test aimed to determine if kinetic impactors like DART could successfully change an asteroid’s course through the solar system. Dimorphos’s orbit was indeed shortened by roughly 30 minutes, confirming that ramming an asteroid with a spacecraft could be a viable method of planetary defense. However, determining exactly how much an asteroid’s path will be altered is not necessarily straightforward. When a spacecraft collides with an asteroid, the impactor imparts momentum to the target, and any material excavated from the impact site can also alter the asteroid’s course.

DART’s impact launched a significant spray of rubble, or what researchers call an ejecta curtain. The ejecta curtain is typically modeled as a cone, using a simple geometry to determine its contribution to momentum transfer. However, when looking closely at imaging taken soon after the collision, the real physical structure of the ejecta appears to be more complex. Untangling the true 3D distribution of the ejecta is necessary to understand how momentum was actually distributed among escaping ejecta, better estimate the total mass ejected from Dimorphos, and improve modeling of the Didymos system’s orbit after impact.

DART ejecta

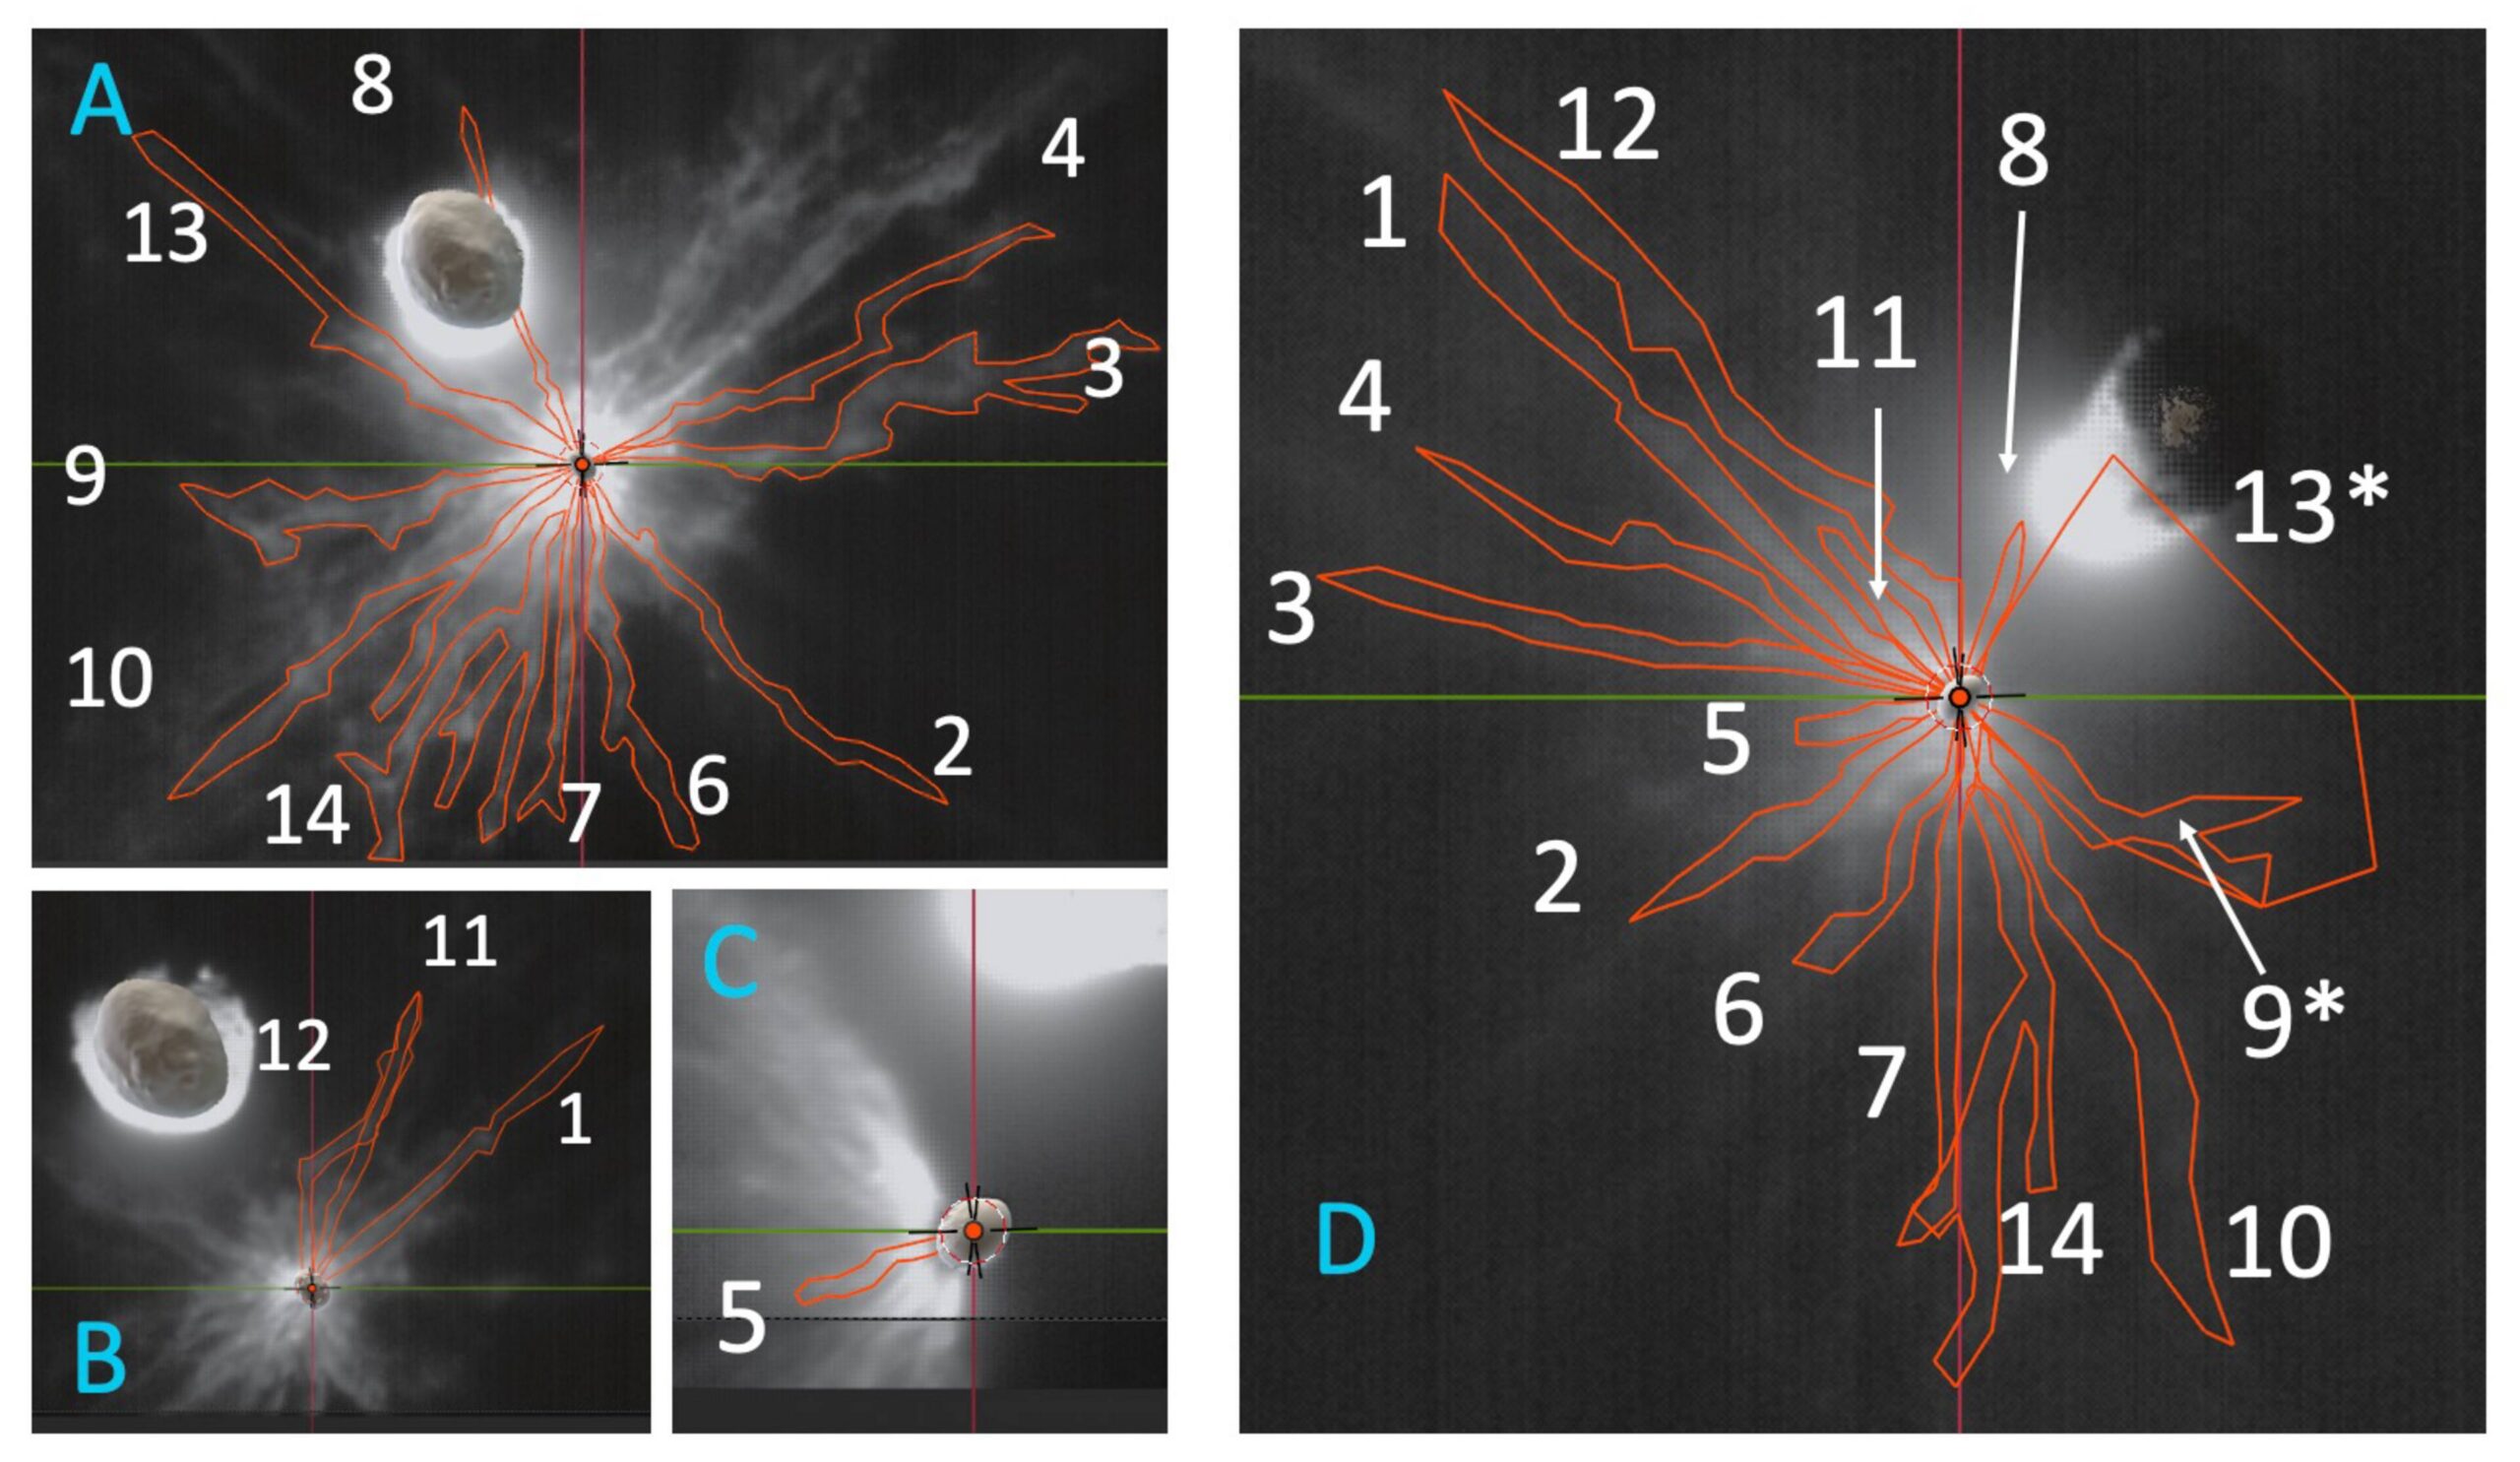
LICIACube images of the DART ejecta curtain with the 14 distinct features identified in this study outlined in red. Click to enlarge. [Deshapriya et al 2026]

Determining Debris Distribution

Seeking to better characterize the ejecta curtain, a team led by J. D. P. Deshapriya from Italy’s National Institute for Astrophysics used data from the Light Italian CubeSat for Imaging of Asteroids (LICIACube) that flew behind the DART spacecraft to capture images of the system shortly after the impact. After careful image handling to bring out diffuse and faint material, the researchers identified 14 distinct ejecta features across the flyby imaging. LICIACube viewed the aftermath both side on and face on, providing valuable 3D information about the distribution and motion of the ejecta. 

DART ejecta animation

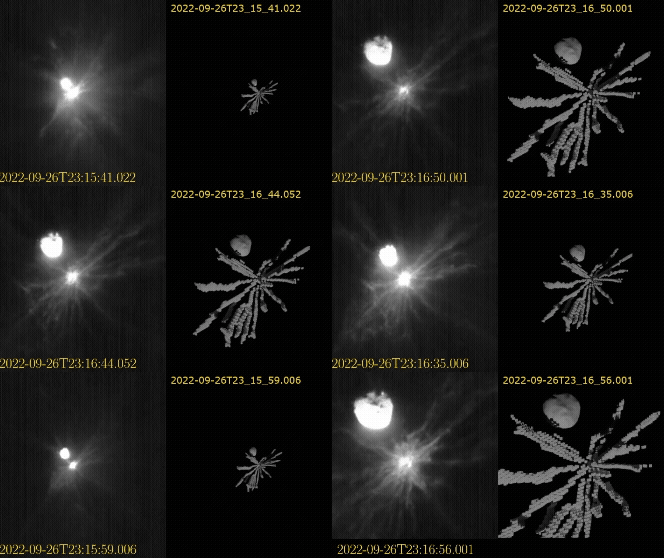
Animation of the DART ejecta as the LICIACube spacecraft approached the impact. The left shows the images taken by the spacecraft, and the right shows the 3D model produced for the ejecta. Click to play animation. [Deshapriya et al 2026]

Using 3D modeling software, the researchers traced each of the 14 distinct features across the images and reconstructed a 3D representation of the ejecta morphology. While earlier models assumed symmetric cone-like geometries, this 3D modeling revealed clear asymmetric and non-uniform structures within the ejecta curtain. These variations point to underlying heterogeneities in the impact site on Dimorphos — surface and subsurface composition naturally link to the resulting ejecta distribution according to previous laboratory experiments. The spatial and directional features uncovered in this study highlight the limitations of models that attempt to characterize ejecta curtains with symmetric and uniform distributions. Refining these model parameters will better match observations and better predict momentum transfer in future missions. 

Planetary Defense

What does this mean for planetary defense? While simplified symmetric cone models provide helpful approximations for kinetic impactor missions, they do not fully capture the true complexity of the impact. This study shows that local variations in an asteroid’s surface and interior properties can directly influence the resulting ejecta distribution and motion. The true momentum imparted to the target asteroid depends heavily on the specific ejecta material, and these details inform how effective planetary defense missions can be in redirecting asteroids. Incorporating realistic, observation-driven ejecta distributions into modeling frameworks is essential to achieve reliable predictions for future planetary defense missions.

Citation

“3D Reconstruction of DART Ejecta at Dimorphos Reveals an Anisotropic, Filamentary Structure,” J. D. P Deshapriya et al 2026 Planet. Sci. J. 7 4. doi:10.3847/PSJ/ae2c64

The post Pulling Back the Curtain on DART Ejecta appeared first on AAS Nova.

We Have Visitors: Interstellar Material from Nearby Debris Disks

6 February 2026 at 17:00

'Oumuamua

Traversing the galaxy from places yet known, a few interstellar objects have taken a quick dip into our solar system. These objects have inspired a frenzy of questions regarding their origins and paths that led them here. A recent study took to nearby planet-forming stellar systems as possible launching posts.

Interstellar Object Origins

As 3I/ATLAS was first spotted entering the solar system in July 2025, all eyes turned to the curious interstellar visitor. Just the third interstellar object astronomers have observed, 3I/ATLAS joins 1I/ʻOumuamua (2017) and 2I/Borisov (2019) in capturing our attention and igniting many questions regarding their origins and journeys to our corner of the Milky Way. While astronomers have characterized these objects’ compositions, sizes, and paths through the solar system, the mechanisms by which these objects leave their origin systems and travel the galaxy before arriving here are not well constrained. 

These three large bodies are just part of the interstellar material visiting the solar system — spacecraft have detected an influx of small interstellar dust particles, and while not yet directly confirmed, interstellar meteoroids burning up in Earth’s atmosphere are possible. This loose material likely originates in dusty, planet-forming disks (debris disks) around stars — rubble kicked out into interstellar space, sending chemicals, organic compounds, and perhaps even the precursors of life to other nearby systems. Understanding the origins and trajectories of such material will allow us to investigate planet formation and how developing systems may impact their environments.

Deliveries from Debris Disks

Debris disks offer ideal testbeds for tracing small bodies and dusty material through the galaxy. Interactions with large planets in debris disks can launch loose material like planetesimals and dust into interstellar space. To explore how debris disks may drive interstellar visitors to our solar system, Cole R. Gregg and Paul A. Wiegert (The University of Western Ontario) simulated how much material the 20 nearest debris disks would contribute to the interstellar object population of our solar system.

sky projection for particle arrival directions

Arrival direction on the sky for particles that reach the solar system from the 20 debris disks studied here. The arrival locations for 1I/ʻOumuamua, 2I/Borisov, and 3I/ATLAS are shown for comparison. Click to enlarge. [Gregg and Wiegert 2025]

The authors modeled the trajectories of ejected material from each debris disk within a simulated Milky Way, running the simulations backward and forward in time to trace the ejecta over 100 million years. These simulations show that material from each of the 20 systems is currently expected to be within our solar system. For interstellar objects (≥100 meters), the simulations predict that about two objects from these debris disks are currently within the inner solar system.

Trickier to spot, smaller meteoroids (≥200 microns) that would appear as meteors in Earth’s atmosphere are also expected. The only way to observationally confirm interstellar origins for meteors is based on how fast they are moving relative to the material in our solar system, or their excess velocities. Based on the simulations, many of these smaller particles have low excess velocities, making them observationally difficult to distinguish from bound solar system objects.

Observational Connections and Expectations

'oumuamua zoom in plot

Zoomed-in view focusing on the direction where 1I/ʻOumuamua entered the solar system. The interstellar object falls near the arrival directions of particles from HD 38858 and HD 166. Click to enlarge. [Gregg and Wiegert 2025]

How do these simulations compare to observations? From their analysis, the authors identified where the interstellar material from each debris disk would first enter the solar system. Comparing these to the entry locations of 1I/ʻOumuamua, 2I/Borisov, and 3I/ATLAS, ʻOumuamua appears near the entry locations for debris from HD 166 and HD 38858. (2I/Borisov and 3I/ATLAS had no such match up in this sample of debris disks.) However, tracing ʻOumuamua’s travel backward, its closest approaches to these systems are about 32 and 18 light-years away, respectively — likely too far to have originated from either system but still a clear proof of concept that we can place interstellar objects near potential systems of origin. 

Where are the expected interstellar meteoroids? Current meteor detectors including the Canadian Meteor Orbit Radar (CMOR) and the Global Meteor Network (GMN) search the sky for incoming material. While the simulations predict hundreds of meteoroid-sized particles from each debris disk currently in the inner solar system, the small collecting area of CMOR and the limiting size of grains detectable by GMN statistically require decades of observations to detect even a single interstellar meteoroid. Thus, the lack of detections thus far is not surprising, but with advanced instrumentation, discoveries of more interstellar particles and objects are imminent.

Citation

“A Catalogue of Interstellar Material Delivery from Nearby Debris Disks,” Cole R. Gregg and Paul A. Wiegert 2025 PSJ 6 309. doi:10.3847/PSJ/ae284f

The post We Have Visitors: Interstellar Material from Nearby Debris Disks appeared first on AAS Nova.
Shot by the DART and We’re to Blame! Now That Space Rock Won’t Be the Same

3 November 2025 at 17:00

illustration of DART and LICIACube spacecraft

Editor’s Note: Astrobites is a graduate-student-run organization that digests astrophysical literature for undergraduate students. As part of the partnership between the AAS and astrobites, we occasionally repost astrobites content here at AAS Nova. We hope you enjoy this post from astrobites; the original can be viewed at astrobites.org.

Title: High-Speed Boulders and the Debris Field in DART Ejecta
Authors: Tony L. Farnham et al.
First Author’s Institution: University of Maryland
Status: Published in PSJ

The DART Mission: A First Step in Planetary Defense

In a groundbreaking experiment, NASA’s Double Asteroid Redirection Test (DART) became the first mission to intentionally crash a spacecraft into an asteroid to test whether such an impact could change the asteroid’s path. The target was Dimorphos, a small companion orbiting a larger asteroid called Didymos, located about 11 million kilometers from Earth.

Luckily, neither Dimorphos nor Didymos was ever on any sort of collision course with anything (and they’re still not). But by impacting an object orbiting another, the effect of the collision could more easily be measured and so Dimorphos was chosen as the target. You see, the goal wasn’t destruction, but deflection. The scientists wanted to see if a spacecraft could alter an asteroid’s orbit by striking it — and if so, by how much. When DART slammed into Dimorphos at over 22,500 kilometers per hour, it successfully shortened the asteroid’s roughly 12-hour orbit by about 33 minutes. This confirmed that hitting an asteroid with a spacecraft — in this case scientifically called a kinetic impactor — could be a viable method to redirect a potentially hazardous object in space.

But the change in momentum didn’t just come from the spacecraft itself. Much of the momentum transfer came from the plume of debris — called ejecta — that blasted out from the impact site. This debris, spreading out in multiple directions, added to the total push on the asteroid. Understanding how this ejecta moved exactly is key to calculating the full effect of the impact and was one of the primary goals for the DART mission.

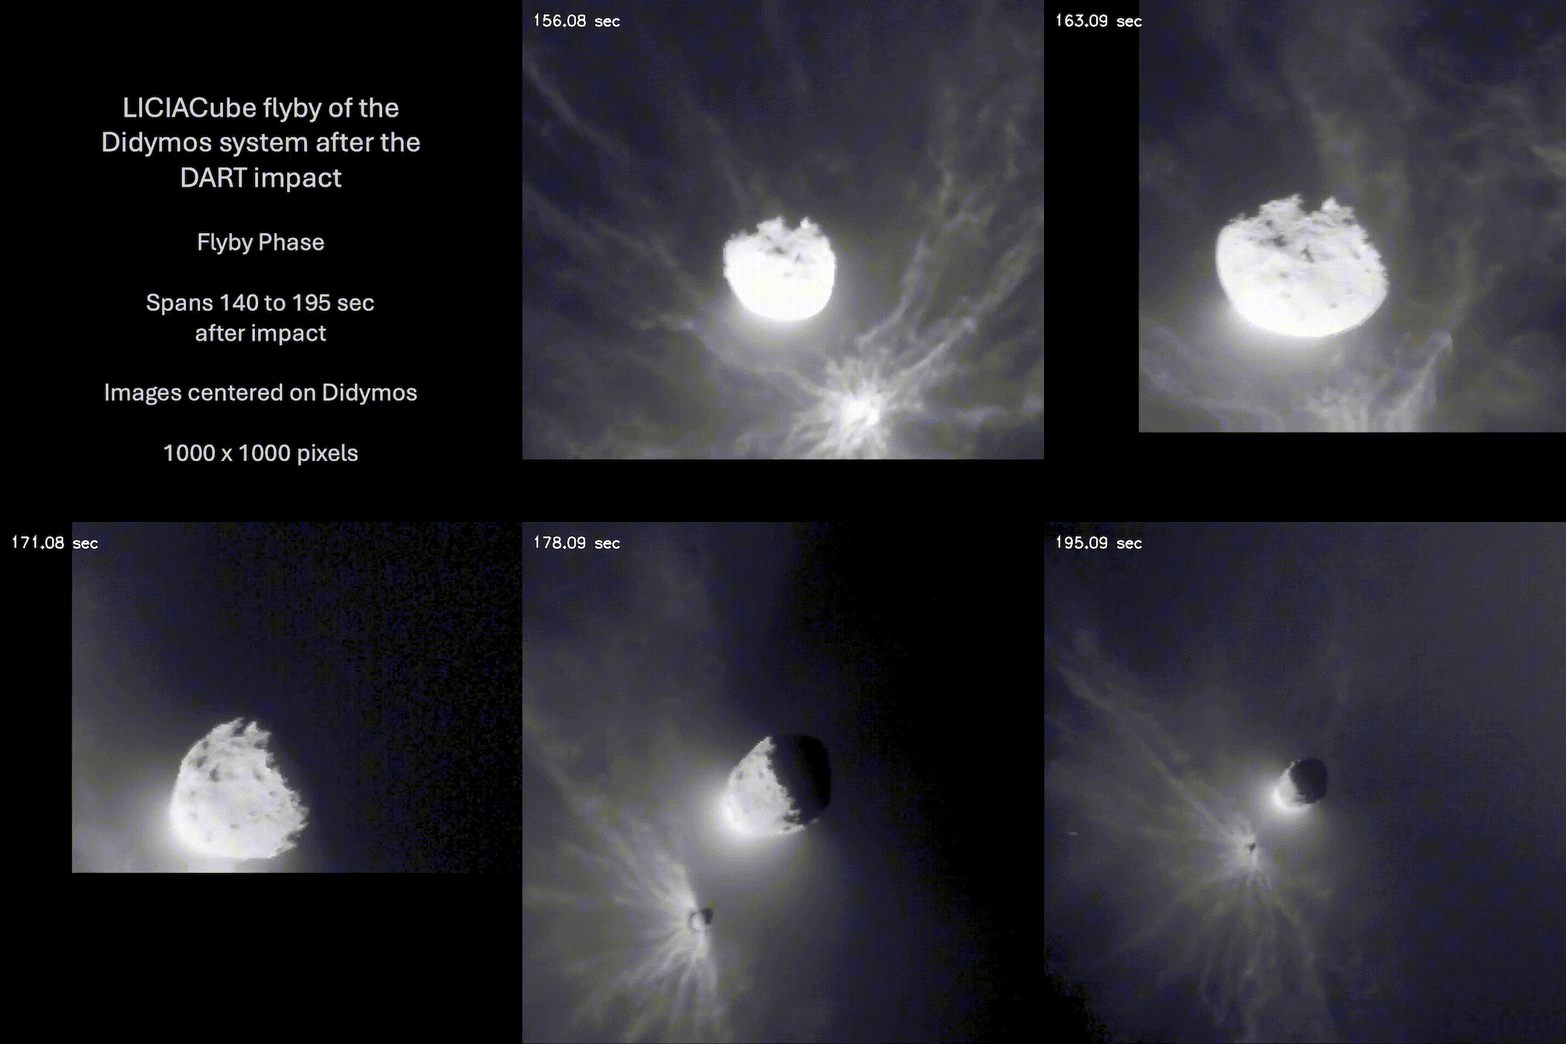
With this exact purpose in mind, a small companion spacecraft called LICIACube (Light Italian Cubesat for Imaging of Asteroids), released by DART two weeks before the crash, flew past moments after the collision. It snapped several images of the debris cloud, as seen in Figure 1, as it raced past. It is with a reanalysis of these images that today’s authors have managed to track a number of boulders in the ejected material.

A GIF sequence of images that show the aftermath of the DART spacecraft impact on Dimorphos

Figure 1: Animated sequence of images taken by LICIACube as it flew past Didymos and Dimorphos a few minutes after impact by the DART spacecraft. The image is centered on Didymos with the smaller Dimorphos visible for most of the flyby. Large plumes of ejected material are visible, radiating out from the impact site where a very deep crater likely formed. Video provided by the author and subsequently converted to GIF and slowed for use in this bite. [Farnham et al. 2025]

Boulders, Boulders Everywhere!

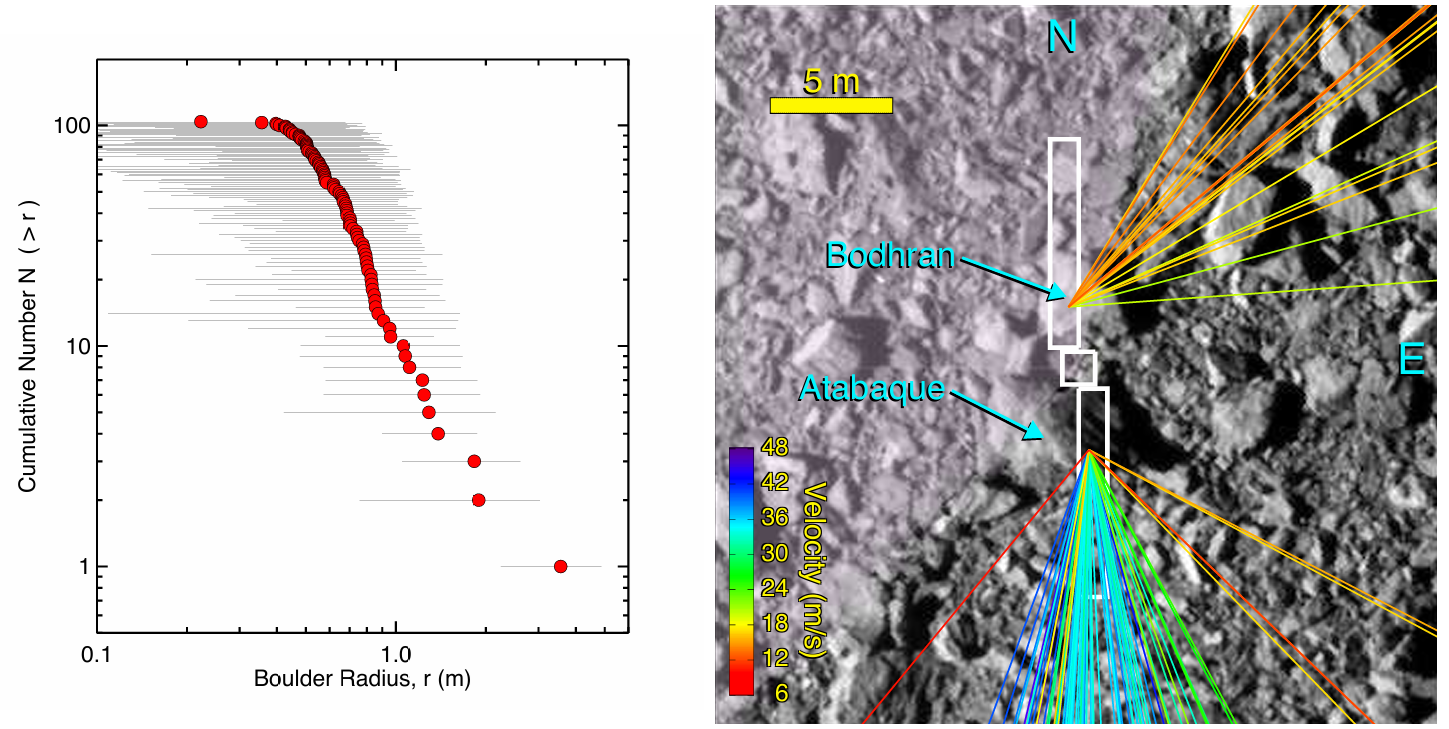
You can say that DART really made an impact — pun intended. It kicked up a lot of material as it struck Dimorphos. In some parts the ejecta plumes are dense enough to block sunlight and even cast shadows on Dimorphos. In the images, like the one seen in Figure 2, the authors were able to make out more than 100 boulders, some as big as 3.6 meters in radius. Tracking the boulders allowed them to calculate velocities and their contribution to the momentum budget. Some of the boulders were ejected at speeds up to nearly 200 kilometers per hour and carried almost as much momentum as the DART craft itself.

Boulders detected in the ejecta from Dimorphos

Figure 2: The image shows part of the ejected material from the DART impact on Dimorphos at 2 minutes and 40 seconds after impact. A number of boulders are highlighted as they are tracked through the sequence of images from the LICIACube. The boulders are not uniformly distributed but mostly clustered in two distinct populations, with the South Cluster containing around 70% of the measured objects. [Farnham et al. 2025]

Using the assumption that the objects are somewhat spherical, the authors calculate that the total volume of all 104 boulders that they managed to identify and track amounts to 403 cubic meters of material, which is equivalent to a sphere 4.6 meters in radius. If you use the bulk density of Dimorphos, this suggests that the mass ejected in these objects is around 0.02% of Dimorphos’s total mass. And this is only for the boulders tracked — the study identified more boulder, but LICIACube was not able to track all of them and could only detect sizes down to 0.2 meter!

The authors also found that the boulders are clustered, suggesting that they were ejected in preferred directions. They conclude that this non-uniform distribution likely changed Dimorphos’s orbital plane. Additionally, the momentum imparted by boulder ejection also likely altered the rotational state of the asteroid, making it tumble around in its orbit.

So what happened? Although there are no constraints on their actual points of origin, the authors suggest that a likely scenario might be that the ejected rocks are the shattered pieces of two large boulders that were seen in some of the last images from the DART spacecraft itself. The two boulders on the surface — named Bodhran and Atabaque after their drum-like shapes — were likely struck by the solar panels as seen in Figure 3.

DART impact site and possible trajectories for the ejected boulders.

Figure 3: The right side of the figure shows the impact site for the DART spacecraft just before it hit the surface. The outline of the craft is superimposed on top with the main bus of the craft and with two extended solar panels. Also shown are the authors’ estimated paths for the 104 boulders tracked. They may be the remains of two surface rocks that were shattered upon impact. To the left is the radius distribution for the boulders that were tracked in the study. [Farnham et al. 2025]

The shallow angles and high ejection speeds are consistent with this scenario. Regardless of how they were ejected, though, it is clear that a significant amount of momentum can be found in the debris and that this process plays an important part in understanding how a kinetic impactor can deflect asteroids.

The European Space Agency’s Hera mission, now en route and arriving in 2026, aims to carry out an in-depth post-impact analysis. It could determine if Dimorphos is tumbling in its slightly modified orbit and help assess the momentum transfer from the impact debris. All this will contribute to a better understanding of just how much the impact changed the asteroid’s orbit and how much more momentum came from the ejected material than was contributed by the DART spacecraft to Dimorphos. These data will be key to refining asteroid deflection strategies in the case that we might need them in the future. After all, the dinosaurs didn’t have any, and look where it got them!

Original astrobite edited by Chloe Klare.

About the author, Kasper Zoellner:

I have a Master of Science in astronomy and I am currently working towards a PhD in physics and educational science. My greatest passion is the search for exoplanets and how stellar variability may influence the possibility of life. I am also interested in science outreach, education and discussing what sci-fi novel to read next!

The post Shot by the DART and We’re to Blame! Now That Space Rock Won’t Be the Same appeared first on AAS Nova.

Shortest-Period Polar Cataclysmic Variable Discovered

22 October 2025 at 17:00

cataclysmic variable system

Astronomers have discovered the most compact cataclysmic variable system containing a strongly magnetized white dwarf. The extreme closeness of the system suggests that the companion may be a metal-poor star — the first time such a star has been paired with a strongly magnetized white dwarf.

Meet the Cataclysmic Variable

Cataclysmic variables are binary star systems that contain a white dwarf and a companion star in uncomfortably close quarters. In these systems, the companion star transfers gas to the white dwarf, resulting in sudden, irregular, and often repeated outbursts as the stolen gas ignites on the scorching surface of the white dwarf.

These bound-together stars typically orbit one another on orbits ranging from about 80 minutes to 10 hours. Though theorists place the minimum orbital period around 76 minutes, a handful of cataclysmic variable systems have cropped up with periods below this limit. The systems that have limboed under the limit are thought to have stellar companions that are more compact than typical main-sequence stars, allowing the white dwarf to nestle in closer.

Exploring Below the Limit

Discovered in 2019 by the Gaia spacecraft, Gaia19bxc is a cataclysmic variable that fluctuates with a period of 64.42 minutes. If this variability is linked to the orbital period of the system, that would place it well below the theoretical minimum period. Adding to the intrigue, early observations also hinted that Gaia19bxc’s white dwarf is strongly magnetic, making the system what’s called a polar. In polar systems, the white dwarf’s magnetic field diverts the accreted matter toward the white dwarf’s poles as it is collected, rather than into a disk around the white dwarf’s equator.

Light curves of Gaia19bxc

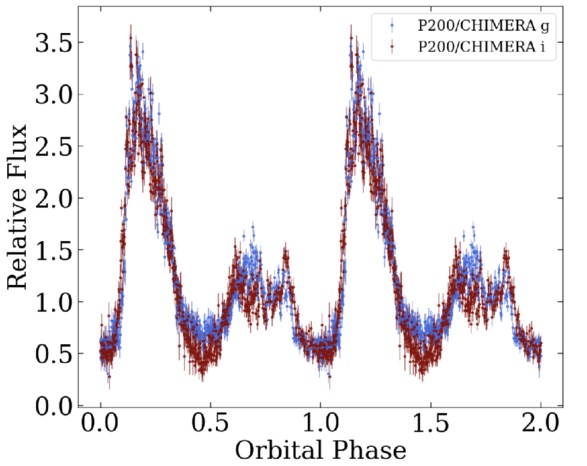
Phase-folded light curves for Gaia19bxc from the Caltech HIgh-speed Multi-colour camERA (CHIMERA) on the Hale Telescope. The double-peaked light curve is evidence for cyclotron beaming, which occurs in strongly magnetized white dwarfs. [Adapted from Galiullin et al. 2025]

Now, Ilkham Galiullin (Kazan Federal University) and collaborators have analyzed photometry and spectra of Gaia19bxc from the Zwicky Transient Facility, the Hale Telescope, and the Keck I telescope to investigate the nature of this unusual system.

The team’s analysis confirmed that the stars of Gaia19bxc orbit one another every 64.42 minutes, cementing the system’s place below the period minimum for typical cataclysmic variables. The system’s double-peaked light curves and evidence for an accretion stream — rather than an accretion disk — confirm the system’s polar nature, implying a magnetic field strength greater than 10 million Gauss. This makes Gaia19bxc the most closely orbiting system to contain a strongly magnetized white dwarf.

A Sign of Discoveries to Come

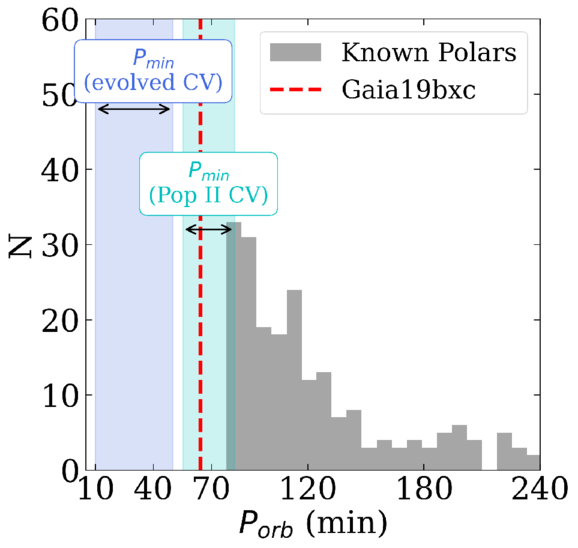
histogram of cataclysmic variable orbital periods

Gaia19bxc’s orbital period compared to known polar cataclysmic variables (gray) as well as the theorized minimum periods for systems containing a metal-poor (Pop II) companion (cyan) and an evolved companion (blue). [Galiullin et al. 2025]

These observations illuminate the nature of the white dwarf — but what about the companion star?

Galiullin and coauthors saw no evidence for metal lines in Gaia19bxc’s spectrum, nor did they see spectral features arising from a hot companion star. These findings suggest that the companion is an old, cool, compact, metal-poor star, which would make Gaia19bxc the first known polar to contain a metal-poor star. It’s also one of only a handful of cataclysmic variables to contain a metal-poor star and be below the theoretical period minimum.

Though Gaia19bxc is currently in a class of its own, it may not be for long; with the start of the Vera C. Rubin Observatory’s Legacy Survey of Space and Time rapidly approaching, many more cataclysmic variable systems as faint as or fainter than Gaia19bxc may soon be discovered.

Citation

“Optical Spectroscopy of the Most Compact Accreting Binary Harboring a Magnetic White Dwarf and a Hydrogen-Rich Donor,” Ilkham Galiullin et al 2025 ApJL 990 L57. doi:10.3847/2041-8213/adff82

The post Shortest-Period Polar Cataclysmic Variable Discovered appeared first on AAS Nova.
Featured Image: The Last Asteroid Pair Discovered by Arecibo

19 May 2025 at 17:00

asteroid 2020 BX12 as seen by Arecibo

There are more than 37,000 asteroids known to come within 1.3 au of the Sun. Of this near-Earth asteroid population, roughly 2,500 are classified as potentially hazardous — being more than about 140 meters across and coming within 0.05 au of Earth’s orbit (about 20 times the distance between Earth and the Moon). In the image above, Luisa Fernanda Zambrano-Marin (University of Granada and University of Central Florida) and collaborators present observations of 2020 BX12, a potentially hazardous binary asteroid. The larger of the two asteroids in the system was discovered in January 2020 by the Asteroid Terrestrial-impact Last Alert System. About a week after the initial discovery, the 1,000-foot-wide Arecibo Telescope aimed its powerful planetary radar at 2020 BX12 and revealed the asteroid’s small companion. 2020 BX12 was the last of nearly 60 binary or triple near-Earth asteroids discovered with Arecibo before the telescope collapsed in December 2020. As Zambrano-Marin‘s team notes, the loss of Arecibo hampers scientists’ ability to find companions to near-Earth asteroids, which can be critical for determining the properties of these asteroids and guiding our planetary defense strategies. To learn more about this discovery, as well as what the team learned from follow-up spectroscopy, be sure to check out the full research article linked below.

Citation

“2020 BX12—The Last Binary Asteroid Discovered at Arecibo,” Luisa Fernanda Zambrano-Marin et al 2025 Planet. Sci. J. 6 91. doi:10.3847/PSJ/adbe39

The post Featured Image: The Last Asteroid Pair Discovered by Arecibo appeared first on AAS Nova.
L'aspirateur Tineco Pure ONE S70 à 309 € : 200 AW, 95 minutes d'autonomie et détection LED des poussières invisibles pour du haut de gamme en promo

6 June 2026 at 15:00
Le Tineco Pure ONE S70 ne ressemble pas aux aspirateurs sans fil classiques. Son système LED 3DSense Pro détecte les particules invisibles à l'œil nu, sa brosse ZeroTangle élimine les enchevêtrements de cheveux, son filtre à 6 étapes retient 99,97 % des particules fines et son moteur délivre 200...

Ce vélo électrique à moins de 560 € fait 120 km par charge et pèse peu : le HillMiles MileCity 1 mérite l'attention

6 June 2026 at 14:00
Le HillMiles MileCity 1 joue la carte de la polyvalence urbaine sans concession sur l'essentiel, avec son cadre bas pour une montée en selle facilitée, son moteur brushless de 250W, sa batterie 36V 13Ah pour une autonomie annoncée de 120 km, son dérailleur 7 vitesses, son freins à disque...

June 6, 1980: The asteroid impact theory

6 June 2026 at 14:00

“Extraterrestrial Cause for the Cretaceous-Tertiary Extinction,” by physicist Luis Alvarez, geologist Walter Alvarez, Frank Asaro, and Helen Michel, was published in Science June 6, 1980. In it, the authors propose that an asteroid crashing to Earth was responsible for the death of the dinosaurs 65 million years ago. (The timeline was later amended to 66Continue reading "June 6, 1980: The asteroid impact theory"

The post June 6, 1980: The asteroid impact theory appeared first on Astronomy Magazine.

Éviter les pièges en ligne avant qu’ils n’apparaissent : Avast anticipe les risques

6 June 2026 at 13:30
Sur Internet, les menaces ne se présentent plus toujours sous la forme d’alertes évidentes. Elles s’invitent discrètement, parfois avant même qu’un site ne semble suspect ou qu’un fichier ne paraisse dangereux. Phishing, arnaques en ligne, liens frauduleux ou logiciels malveillants circulent...

Sécuriser ses connexions sur réseaux inconnus : NordVPN limite les risques invisibles

6 June 2026 at 12:00
L’accès aux réseaux Wi-Fi publics s’est imposé dans de nombreux environnements du quotidien. Cafés, hôtels, gares ou aéroports proposent désormais un accès rapide à Internet, pratique pour consulter ses messages, travailler ou gérer certaines démarches en ligne. Cette facilité d’accès masque...

Consommer beaucoup de data sans surveiller son compteur : Free Mobile Série 140 Go libère les usages

6 June 2026 at 11:00
Free Mobile propose sa Série Free 140 Go à 11,99 €/mois. Un volume de données pensé pour accompagner les usages numériques les plus gourmands, sans surveiller sa consommation. 

❌