Ray Williams, supervisor of test support operations at NASA’s Stennis Space Center near Bay St. Louis, Mississippi, poses for a photograph on July 16, 2026. Williams is among the first engineers and technicians sworn in as new NASA civil servants at Stennis as part of the administrator’s directive to strengthen technical core competencies within the civil service workforce.
NASA/Danny Nowlin
Ray Williams’ progression at NASA’s Stennis Space Center near Bay St. Louis, Mississippi, has uniquely prepared him for his new role.
As part of NASA’s plan to restore core competencies by converting contractors to civil service, the New Orleans native and Grambling State University graduate now works as a supervisor for test operations support at the agency’s E-Complex.
This propulsion testing facility provides mission-critical engineering capabilities to NASA. Through the use of high- and low-pressure propellant systems, engineers are able to focus on development testing of propulsion system components before integration into complete engine systems. Thanks to the versatility of its infrastructure and test team, the complex is uniquely equipped to support projects for the growing commercial aerospace industry and is capable of supporting a wide range of component, engine, and stage test activities.
“Ultimately, my goal is to continue to grow within my own abilities as an engineer and as a supervisor, and to help grow those that I have the opportunity to lead,” said Williams. “I want to align myself with the agency’s goals as a whole to continue to utilize our unique skillset to grow, build, evolve, and innovate.”
Williams began his career at the E-Complex in 1998 as an electrical technician contractor during the facility’s design and build phase. He quickly became familiar with the facility layout, the various systems under development, and the requirements involved in designing, building, and integrating those systems. He later advanced to the role of instrumentation and electrical engineer, gaining extensive institutional knowledge while developing expertise in the principles and importance of data validation.
In total, he brings 28 years of experience to NASA, along with an intimate understanding of the daily challenges his team of technicians faces.
Williams’ primary work location is the E-1 test stand, which is able to handle extremely high pressures and massive flow rates of super cold cryogenics.
Unlike the A and B test complexes at NASA Stennis, where a fully built engine or stage can be installed, fueled, and fired, the E-Complex is highly adaptable.
When commercial partners need to validate large, complex components, they provide specific requirements. The team then customizes the test facility to replicate the exact extreme conditions the hardware is expected to encounter during operation. NASA collects and analyzes data from these precisely controlled test conditions to validate design predictions and determine whether design modifications are needed throughout the development process, from subscale testing through full-scale testing.
Whether validating valve timings, ensuring facility instrumentation is properly calibrated, supporting ultra-high pressure pumping and cryogenic transferring operations, or troubleshooting electrical and mechanical support systems, Williams and his team must execute each task with precision. By retaining Williams’ facility specific expertise in-house as a civil servant, NASA reduces long term operational risk.
Williams describes the opportunity to perform this mission critical work in public service as a dream come true, a dream that began decades ago during an elementary school field trip to NASA Stennis. Today, he finds himself working at NASA just as the agency returns to the Moon to stay through Artemis missions and builds a Moon Base, humanity’s first lunar outpost.
“Having the opportunity to play a role at NASA means a lot,” said Williams. “To this day, I am still a kid at heart looking out at the sky and the galaxy. Being a part of the mission and doing things I know we are capable of doing is an amazing, but also humbling, opportunity.”
This map, based on data from the OCI (Ocean Color Instrument) on NASA’s PACE (Plankton, Aerosol, Cloud, ocean Ecosystem) satellite, shows Sargassum highly concentrated in the tropical Atlantic in June 2026.
NASA Earth Observatory/Lauren Dauphin
Sargassum, a type of brown floating algae, has shifted its range in recent decades, thinning out in the North Atlantic’s Sargasso Sea while proliferating in the tropical Atlantic. That trend, underway since 2011, continued in 2026 as the algae, commonly known as a type of seaweed, reached its annual peak in June across a stretch of ocean known as the Great Atlantic Sargassum Belt.
The belt’s Sargassum abundance in June 2026 made it the second-highest Sargassum year in the satellite record, slightly behind 2025, according to scientists at the University of South Florida (USF) College of Marine Science. Regionally, the Caribbean Sea and the Gulf of America (Gulf of Mexico) both hit record highs, according to USF’s June 2026Sargassum outlook. The western and eastern Caribbean saw 3.6 and 9 million metric tons, respectively, while the Gulf saw 5 million metric tons—nearly double its previous record, also set in 2025.
“The belt is a basin-scale phenomenon that can have devastating local-scale impacts throughout the Caribbean and Gulf, and satellite observations are the only method that captures both scales on a daily basis,” said Brian Barnes, a marine scientist at the Optical Oceanography Laboratory at USF. “The tracking done by our lab helps communities know the current extent of Sargassum and prepare for what’s to come.”
In moderate amounts in the open ocean, Sargassum provides habitat for turtles, invertebrates, fish, and birds, and adds oxygen to the water through photosynthesis. But too much of it near shore can tangle and suffocate marine life, and mats that sink can smother corals and seagrasses. On beaches, decomposing Sargassum releases hydrogen sulfide, a rotten-egg-smelling gas that’s a potential problem for both ecosystems and tourism.
The map above shows Sargassum density in the tropical Atlantic Ocean in June 2026. Red and orange areas are where Sargassum densities were the highest. Note that although the “belt” appears continuous, discrete Sargassum mats are scattered across the ocean surface. The map is based on satellite measurements of how much of the ocean surface was covered by the seaweed, averaged per pixel across all observations made in June by the OCI (Ocean Color Instrument) on NASA’s PACE (Plankton, Aerosol, Cloud, ocean Ecosystem) satellite.
This detailed view of the same PACEOCI map highlights Sargassum concentrations across the Caribbean Sea and Gulf of America, both of which saw record-high amounts of the floating algae in June 2026.
NASA Earth Observatory/Lauren Dauphin
Ocean currents and winds shape the Sargassum belt, which, despite the patchiness, stretches nearly continuously from West Africa to the Gulf and holds a fairly steady “width” from the western tropical Atlantic westward, explained Chuanmin Hu, also an optical oceanographer at USF. The ocean currents have also spared Florida’s west coast from inundation this summer, while delivering large amounts of seaweed to the Florida Keys and the state’s east coast. The bulk of the Sargassum, however, is visible in the Caribbean Sea, shown in detail above, where problems associated with inundation have been more severe, Hu said.
Data for the maps were provided by Lin Qi, an oceanographer at NOAA’s Center for Satellite Applications and Research, who has been working to generate Sargassum maps based on data from PACE, which was launched in February 2024. The work extends that of Qi and colleagues at USF’s Optical Oceanography Laboratory. This team first developed Sargassum detection techniques using MODIS (Moderate Resolution Imaging Spectroradiometer) on NASA’s long-running Terra and Aqua satellites and VIIRS (Visible Infrared Imaging Radiometer Suite) on the NOAA-20 satellite—data that have been a key component of USF’s Sargassum Watch System and of research into the seaweed’s longer-term trends.
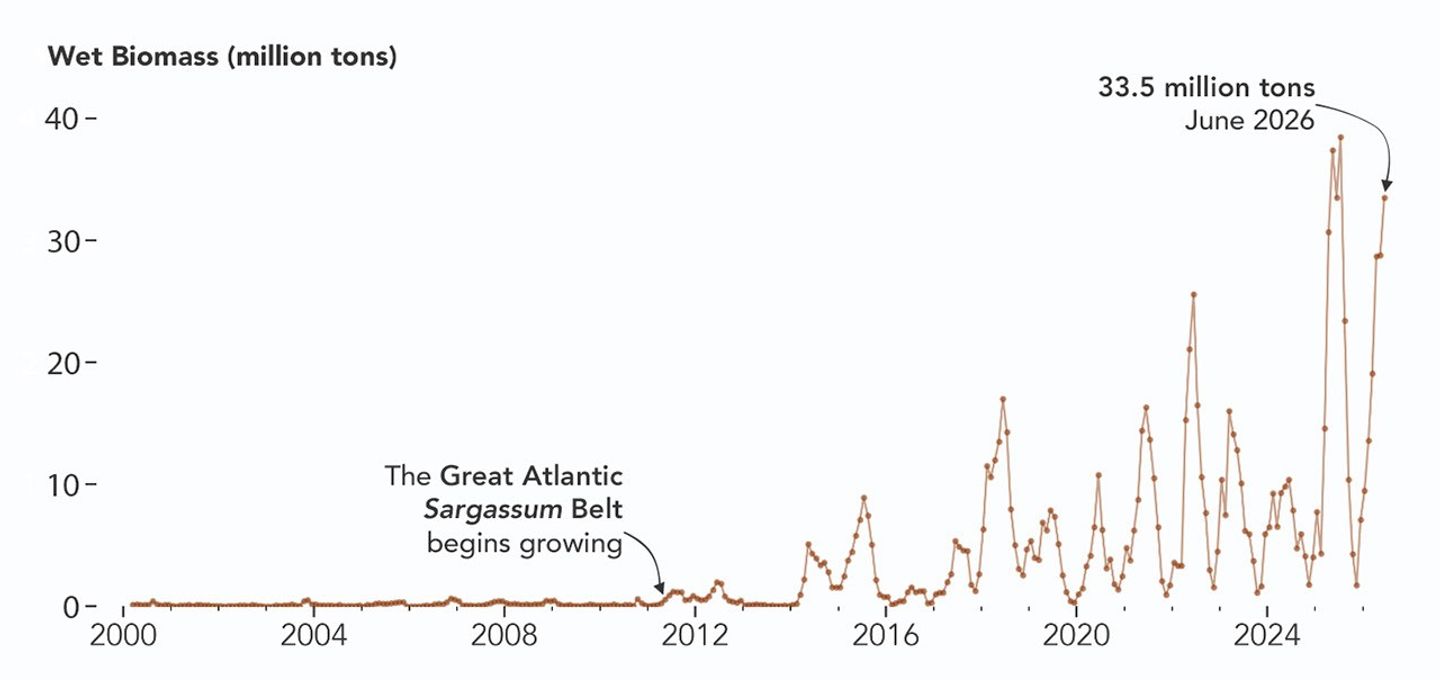
Satellites detect Sargassum by its signals in reflected sunlight. Because of its plant structure and chlorophyll pigments, Sargassum reflects more near-infrared light than water. Scientists flag pixels where the reflectance spikes above the levels produced by plain seawater, and then they use the strength of this spike to estimate Sargassum density, which refers to the fraction of ocean surface covered by the seaweed in each pixel. Density estimates can then be converted into biomass, or the total weight of Sargassum present within a pixel, which is how the longer-term trends in the chart below are tracked.
NASA Earth Observatory/Lauren Dauphin
The chart above uses the continuous MODIS record since March 2000 to show how Sargassum biomass across the Great Atlantic Sargassum Belt has changed through June 2026. Notice the uptick beginning around 2011, when the belt was first developing, and the seasonal dips in winter and peaks in spring and summer. The record high in July 2025 stands out, followed by the quick rise in early 2026—especially in the first four months of the year—that culminated in the year’s peak in June. More recent observations, not yet reflected in the chart, indicate Sargassum biomass declined through the following month of July.
“Since the initial appearance of the Great Atlantic Sargassum Belt in 2011, the total Sargassum amount in the Atlantic Ocean has increased substantially, more than doubling every five years,” Hu said. He added that the exact mechanism is still being investigated, but it’s possibly related to ocean warming, multiple nutrient sources, and the fact that large Sargassum mats attract other organisms—such as nitrogen-fixing bacteria—that can supply additional nutrients to sustain further growth.
Alongside data from MODIS and VIIRS, OCI data from PACE now feeds into the Sargassum Watch System’s near-real-time daily and weekly composite maps. A recent study of the central-west Atlantic led by Qi, spanning May through August 2024, found that OCI offers several advantages over its predecessors, observing more of the ocean and detecting Sargassum with greater sensitivity.
Hu noted that the added pixels from OCI can improve near-real-time monitoring and analyses of short-term fluctuations. And its higher sensitivity, he said, will also lead to improved maps during winter months, “thus helping understand Sargassum changes over time.”
Additionally, the study’s authors found that OCI’s hyperspectral capability makes it the only sensor able to spectrally discriminate Sargassum pixels across the Atlantic Ocean “without ambiguity,” adding confidence to the interpretation of detected image features—especially in parts of the Atlantic where another type of floating algae, Trichodesmium, has been reported.
“I think I can speak for all project members, past and present, in sharing how rewarding it is to see the promise of PACE’s advancements come to life,” said Jeremy Werdell, PACE project scientist at NASA’s Goddard Space Flight Center. “OCI has started a true renaissance in aquatic ecosystem monitoring from space.”
NASA Earth Observatory maps and chart by Lauren Dauphin, using PACE and MODIS data courtesy of Lin Qi (NOAA), and Brian Barnes and Chuanmin Hu (University of South Florida, Optical Oceanography Laboratory). Story by Kathryn Hansen.
Smoke pours from dozens of large fires in Oregon in this image captured by MODIS (Moderate Resolution Imaging Spectroradiometer) on NASA’s Aqua satellite on July 26, 2026.
NASA Earth Observatory/Michala Garrison
Dry thunderstorms that popped up over the Cascade Range on the evening of July 15, 2026, peppered Oregon and Washington with thousands of lightning strikes as they moved east across the states. By the following day, NASA satellites had begun to detect large numbers of wildland fires burning throughout central and eastern Oregon.
Though initially small, these blazes strengthened as they were fanned by gusty winds and raced through landscapes parched by extreme drought and baking in summer heat. When NASA’s Aqua satellite captured the image shown above on the afternoon of July 26, smoke poured northeast from dozens of large fires that had collectively charred hundreds of square miles. The fires produced a blanket of haze, prompting state officials to issue air quality advisories for eastern Oregon.
Many communities faced evacuation orders as more than 10,000 firefighters battled wildfires throughout the state. On the day the image was captured, the largest active fires were the Hay Creek Complex, Brewer, Big Grass, Akawa Butte, and Powder River fires. Several of these blazes were less than 5 percent contained, according to the National Interagency Fire Center. State officials invoked Oregon’s Emergency Conflagration Act to protect communities as they responded to particularly threatening fires such as the Shingle, Bench, Beachcomb, and Second Flat fires.
Government satellite data are part of a global system of observations used to track fire behavior and analyze emerging trends. Among the real-time wildfire monitoring tools that NASA makes available are FIRMS (Fire Information for Resource Management System), the Worldview browser, and the Fire Event Explorer.
As of July 27, 2026, fires in Oregon had burned more than one million acres, according to news outlets. Meanwhile, the National Interagency Fire Center reported that fires had burned more than 4 million acres across the United States. The 10-year average (2016-2025) for this point in the season is 3.4 million acres.
NASA Earth Observatory image by Michala Garrison, using MODIS data from NASA EOSDIS LANCE and GIBS/Worldview.Story by Adam Voiland.
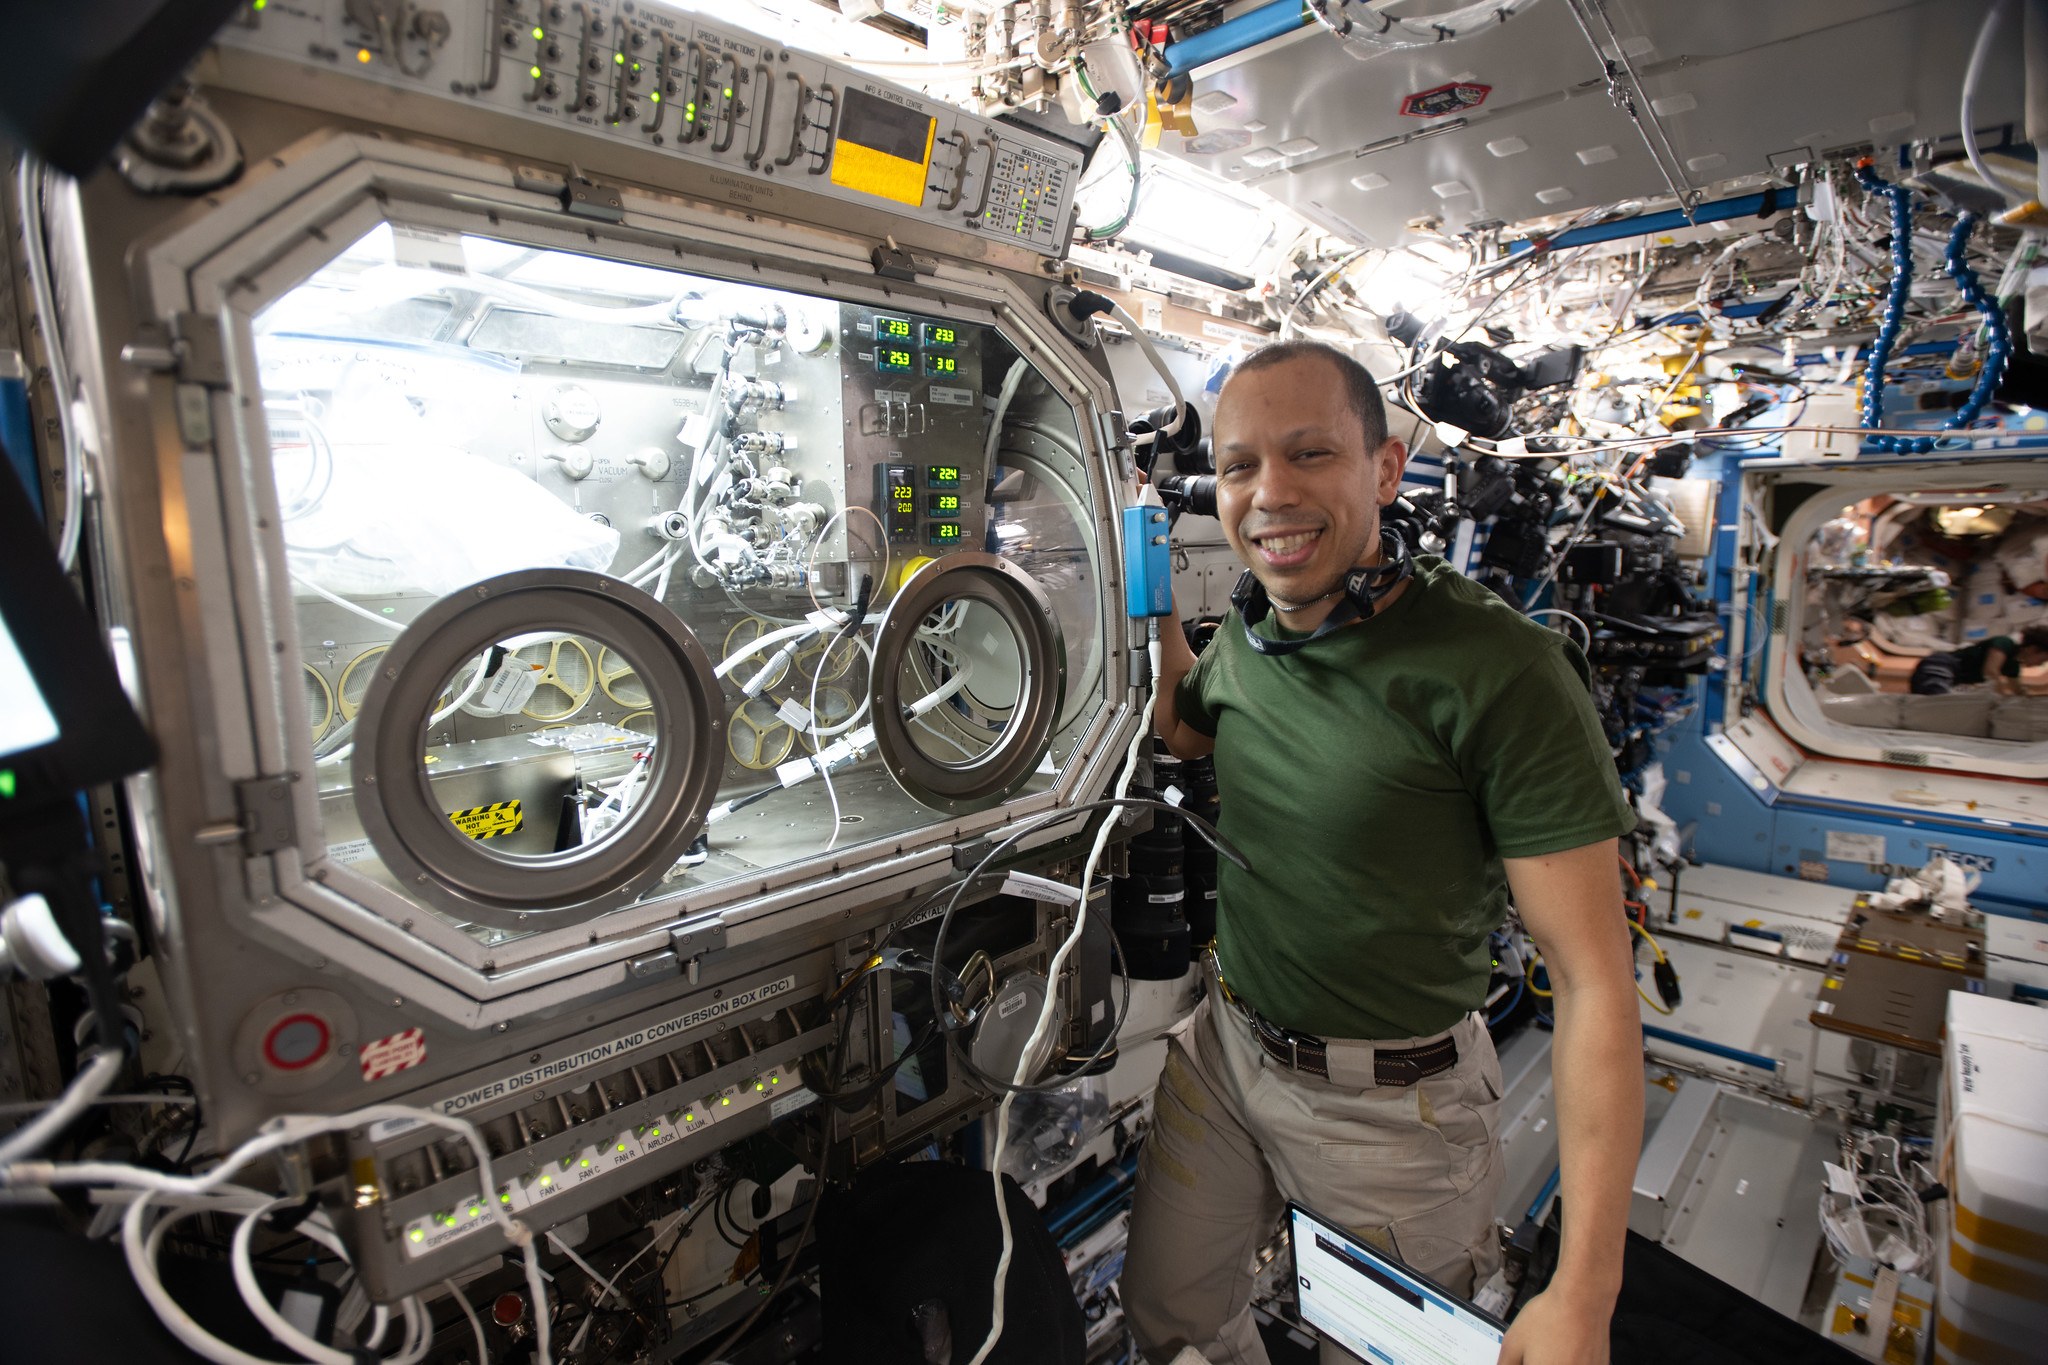
NASA astronaut and Expedition 74 flight engineer Chris Williams shows off the Destiny laboratory module’s Microgravity Science Glovebox aboard the International Space Station. Williams was supporting semiconductor crystal research to help advance the commercial space economy and promote Earth-based industries.
NASA/Chris Williams
NASA astronaut Chris Williams will recap his recent eight-month mission aboard the International Space Station during a news conference at 2:45 p.m. EDT Tuesday, Aug. 4, from the agency’s Johnson Space Center in Houston.
NASA will stream this event live through a variety of platforms. Learn where to watch online:
United States-based media interested in attending in person must contact the NASA Johnson newsroom no later than 5 p.m., Friday, July 31, at jsccommu@mail.nasa.gov.
Media wishing to participate by phone must contact the Johnson newsroom no later than two hours before the start of the event. To ask a question by phone, media must dial into the news conference no later than 15 minutes prior to the start of the call. NASA’s media accreditation policy is available online.
Williams returned to Earth on July 26, after logging 241 days as an Expedition 73/74 flight engineer during his first spaceflight. He returned along with Roscosmos cosmonauts Sergey Kud-Sverchkov and Sergei Mikaev, completing 3,856 orbits of the Earth over the course of their more than 102-million-mile journey. They also saw the arrival of six visiting spacecraft and the departure of eight.
During his mission, Williams supported a wide range of scientific investigations and technology demonstrations. He helped advance research for new cancer treatments and improved in-space manufacturing of materials used in high-performance computers and electronics. Williams also completed two spacewalks to prep for space station power system upgrades and to replace a faulty joint on the Canadarm2 robotic arm. The crew’s work aboard the space station helps improve life on Earth and prepare for future human missions to the Moon and Mars.
To learn more about International Space Station research, operations, and its crews, visit:
NASA Science Soars During August Total Solar Eclipse
Each time the Moon covers the Sun during a total solar eclipse — darkening daytime skies and briefly revealing the Sun’s ethereal outer atmosphere, the corona — it presents new opportunities to better understand our star and its influence on Earth.
On Wednesday, Aug. 12, as the next total solar eclipse sweeps over Greenland, Iceland, and Spain, NASA-funded science teams will be chasing the Moon’s shadow with a high-altitude jet and scientific balloons to investigate the Sun’s dynamics and how the temporary darkening of our skies affects our atmosphere.
“From our unique perspective on Earth during a total solar eclipse, scientists can study the Sun’s corona in a way we can’t from anywhere else in the solar system,” said Kelly Korreck, eclipse program manager at NASA Headquarters in Washington. “The Sun impacts our daily life, satellites, and astronauts in space, and we can take advantage of this moment to advance our understanding of that influence.”
High-flying jet to record solar dynamics
Soaring in the nose cone of NASA’s WB-57 high-altitude research aircraft is a suite of four cameras to take high-resolution images of the corona in several different wavelengths of visible and infrared light. Part of an instrument developed by the NASA Scientifically Calibrated In-Flight Imagery (SCIFLI) team at NASA’s Langley Research Center in Hampton, Virginia, the cameras will capture at least 20 images per second, recording structures, outflows, and rapid changes in the corona during the total solar eclipse.
With these images, scientists hope to learn more about the formation of prominences (solar material that gets suspended above the Sun’s surface), better understand the corona and how it gets heated to nearly a million degrees, and investigate how material in the corona and the solar wind are related, which flows out from the Sun across the solar system.
These images of the corona and solar prominences were taken in different wavelengths of visible and infrared light by imagers aboard a NASA’s WB-57 jet during the April 8, 2024, total solar eclipse. The same cameras will fly on a NASA WB-57 jet again during the Aug. 12 eclipse.
NASA / SwRI / William Ashfield
By chasing the Moon’s shadow, the jet will extend how long the cameras can observe the corona. On the ground, the longest anyone will be able to see the corona is two minutes and 18 seconds. But flying along the eclipse path at 460 miles per hour, the jet’s view of the corona will last nearly three minutes.
NASA’s WB-57 will fly at 50,000 feet, above any clouds that might obscure the view of the corona from the ground. The altitude also allows the cameras to observe some infrared wavelengths that get absorbed by the lower atmosphere before reaching the ground, and the corona only has been observed in those wavelengths a few times before.
One of NASA’s WB-57 high-altitude jets will carry a suite of cameras up to 50,000 feet to capture images of the solar corona during the Aug. 12 total solar eclipse.
NASA
The instrument, called SCIFLI Multispectral Airborne Imager, or SAMI, also flew on a WB-57 during the total solar eclipse on April 8, 2024, providing valuable imagery and information about the corona. However, the study’s principal investigator, Amir Caspi of the Southwest Research Institute in Boulder, Colorado, says each total solar eclipse provides new opportunities to learn more about the corona.
“The Sun is always changing,” Caspi said. “Every eclipse is different. So we could see things we didn’t see before. And we learn from each eclipse how to better observe the next one.”
Caspi’s team also is making some enhancements for the 2026 campaign based on lessons learned in 2024. For example, the team will adjust exposure times to better capture bright features that were overexposed in 2024 imagery. They will also leverage software developed since 2024 to process and analyze the data sooner than before.
The experiment is funded by NASA’s Heliophysics Low Cost Access to Space Program.
As a total solar eclipse crosses Russia, Greenland, Iceland, Spain, and Portugal on Aug. 12, 2026, some of the best views will come from 50,000 feet up, aboard NASA’s WB-57 jet. Credit: NASA’s Goddard Space Flight Center
Balloons to watch atmospheric changes
When a total solar eclipse suddenly turns daytime skies dark, our atmosphere changes in ways we don’t yet fully understand.
The NASA-supported Nationwide Eclipse Ballooning Project, led by Angela Des Jardins at Montana State University, is sending students from several U.S. universities to Iceland and Spain to launch scientific balloons before, during, and after the eclipse to better understand those changes.
A student team from the University of Kentucky prepares to launch a ballon from Bloomington, Indiana, to take atmospheric measurements on April 8, 2024, during the 2024 Nationwide Eclipse Ballooning Project campaign.
Sean Bailey (University of Kentucky)
In Iceland, two teams will launch a total of 80 balloons starting 18 hours before the eclipse until eight hours afterward to study how the eclipse affects Earth’s “boundary layer,” the part of the atmosphere that touches the ground. The thickness of the boundary layer changes depending on factors such as surface temperature and moisture in the air.
Previous balloon flights during solar eclipses in October 2023 and April 2024 showed that the boundary layer collapsed, or decreased in thickness, in locations with clear skies but not where there were cloudy skies. Scientists wonder whether that will be different in Iceland in 2026. Changes in the boundary layer are driven by the day-night cycle. However, in Iceland in August, the days are long and nights are short, so the nighttime influences might not be as strong as in 2023 or 2024.
“Will this eclipse be able to collapse the boundary layer?” said Matthew Bernards, a chemical engineering professor at the University of Idaho, who leads one of the Iceland teams.
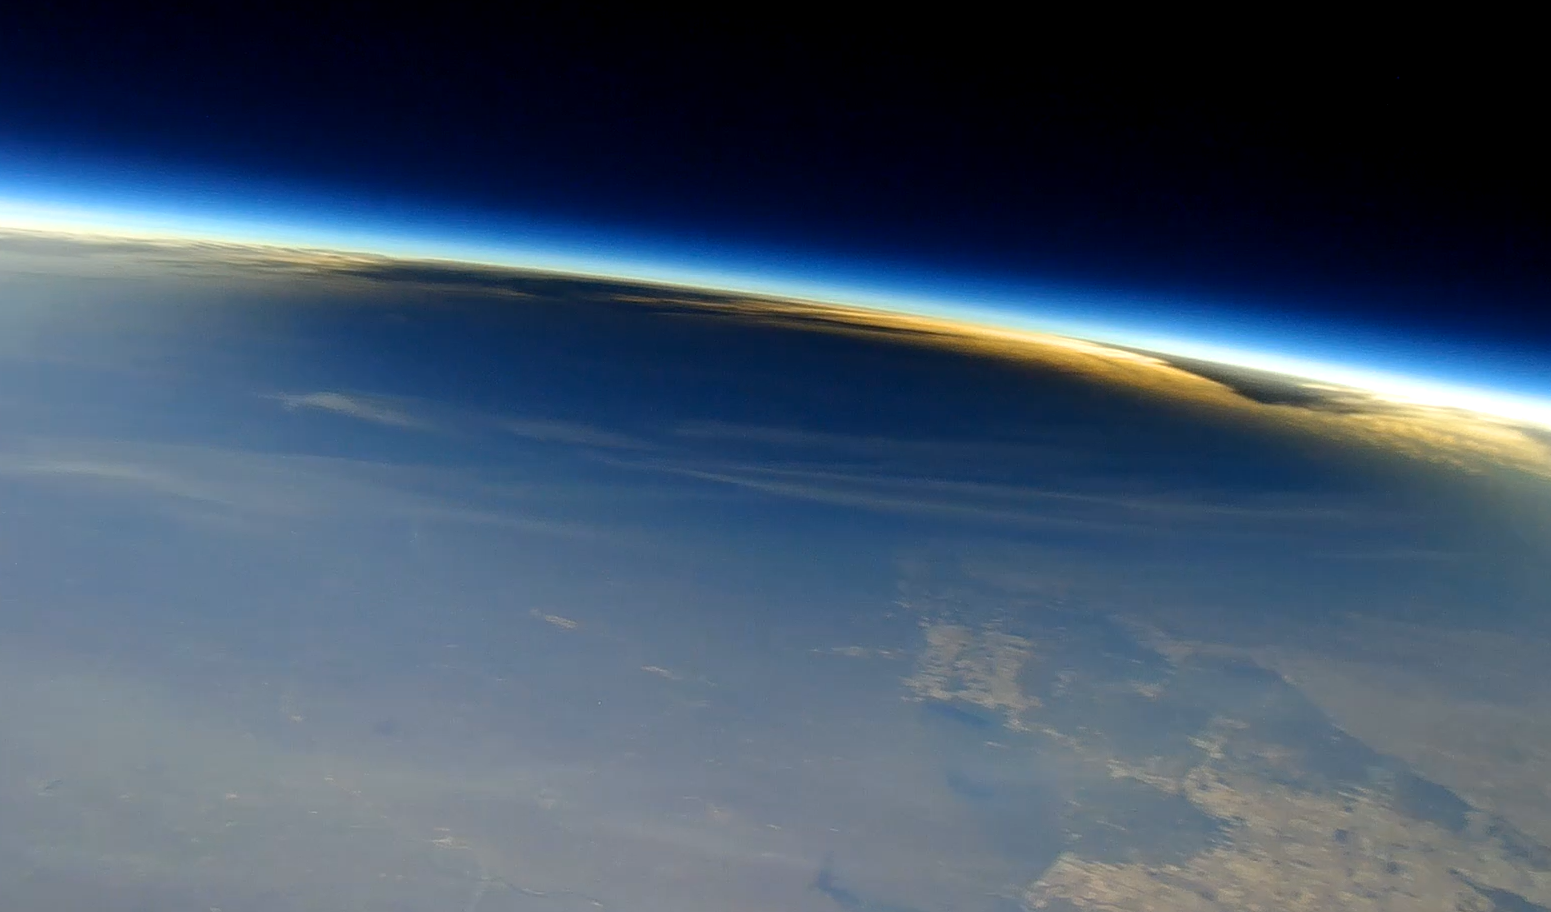
This image shows the Moon’s shadow on Earth during the total solar eclipse on April 8, 2024, as seen from about 90,000 feet from a camera carried by a scientific balloon. Cameras carried by balloons launched from Spain will capture similar images during the Aug. 12 total solar eclipse.
In Spain, three balloon teams will launch a total of six balloons with 360-degree cameras to image the eclipse shadow from above. These balloons also will include instruments designed to measure levels of ozone in the atmosphere, which requires sunlight to form. Similar balloon experiments showed that ozone decreased during totality in April 2024. Scientists wonder whether there will be differences with this eclipse, particularly since it happens at a later time of day and during a different season.
The NASA-funded Nationwide Eclipse Ballooning Project will allow teams of students from across the U.S. to get a unique view of the August total solar eclipse with scientific balloons. Credit: NASA’s Goddard Space Flight Center
Follow along
While the total solar eclipse won’t be visible in the U.S., some parts of the country will be able to see a partial solar eclipse. Learn more about where to see the eclipse and how to view it safely.
by Vanessa Thomas NASA’s Goddard Space Flight Center, Greenbelt, Md.
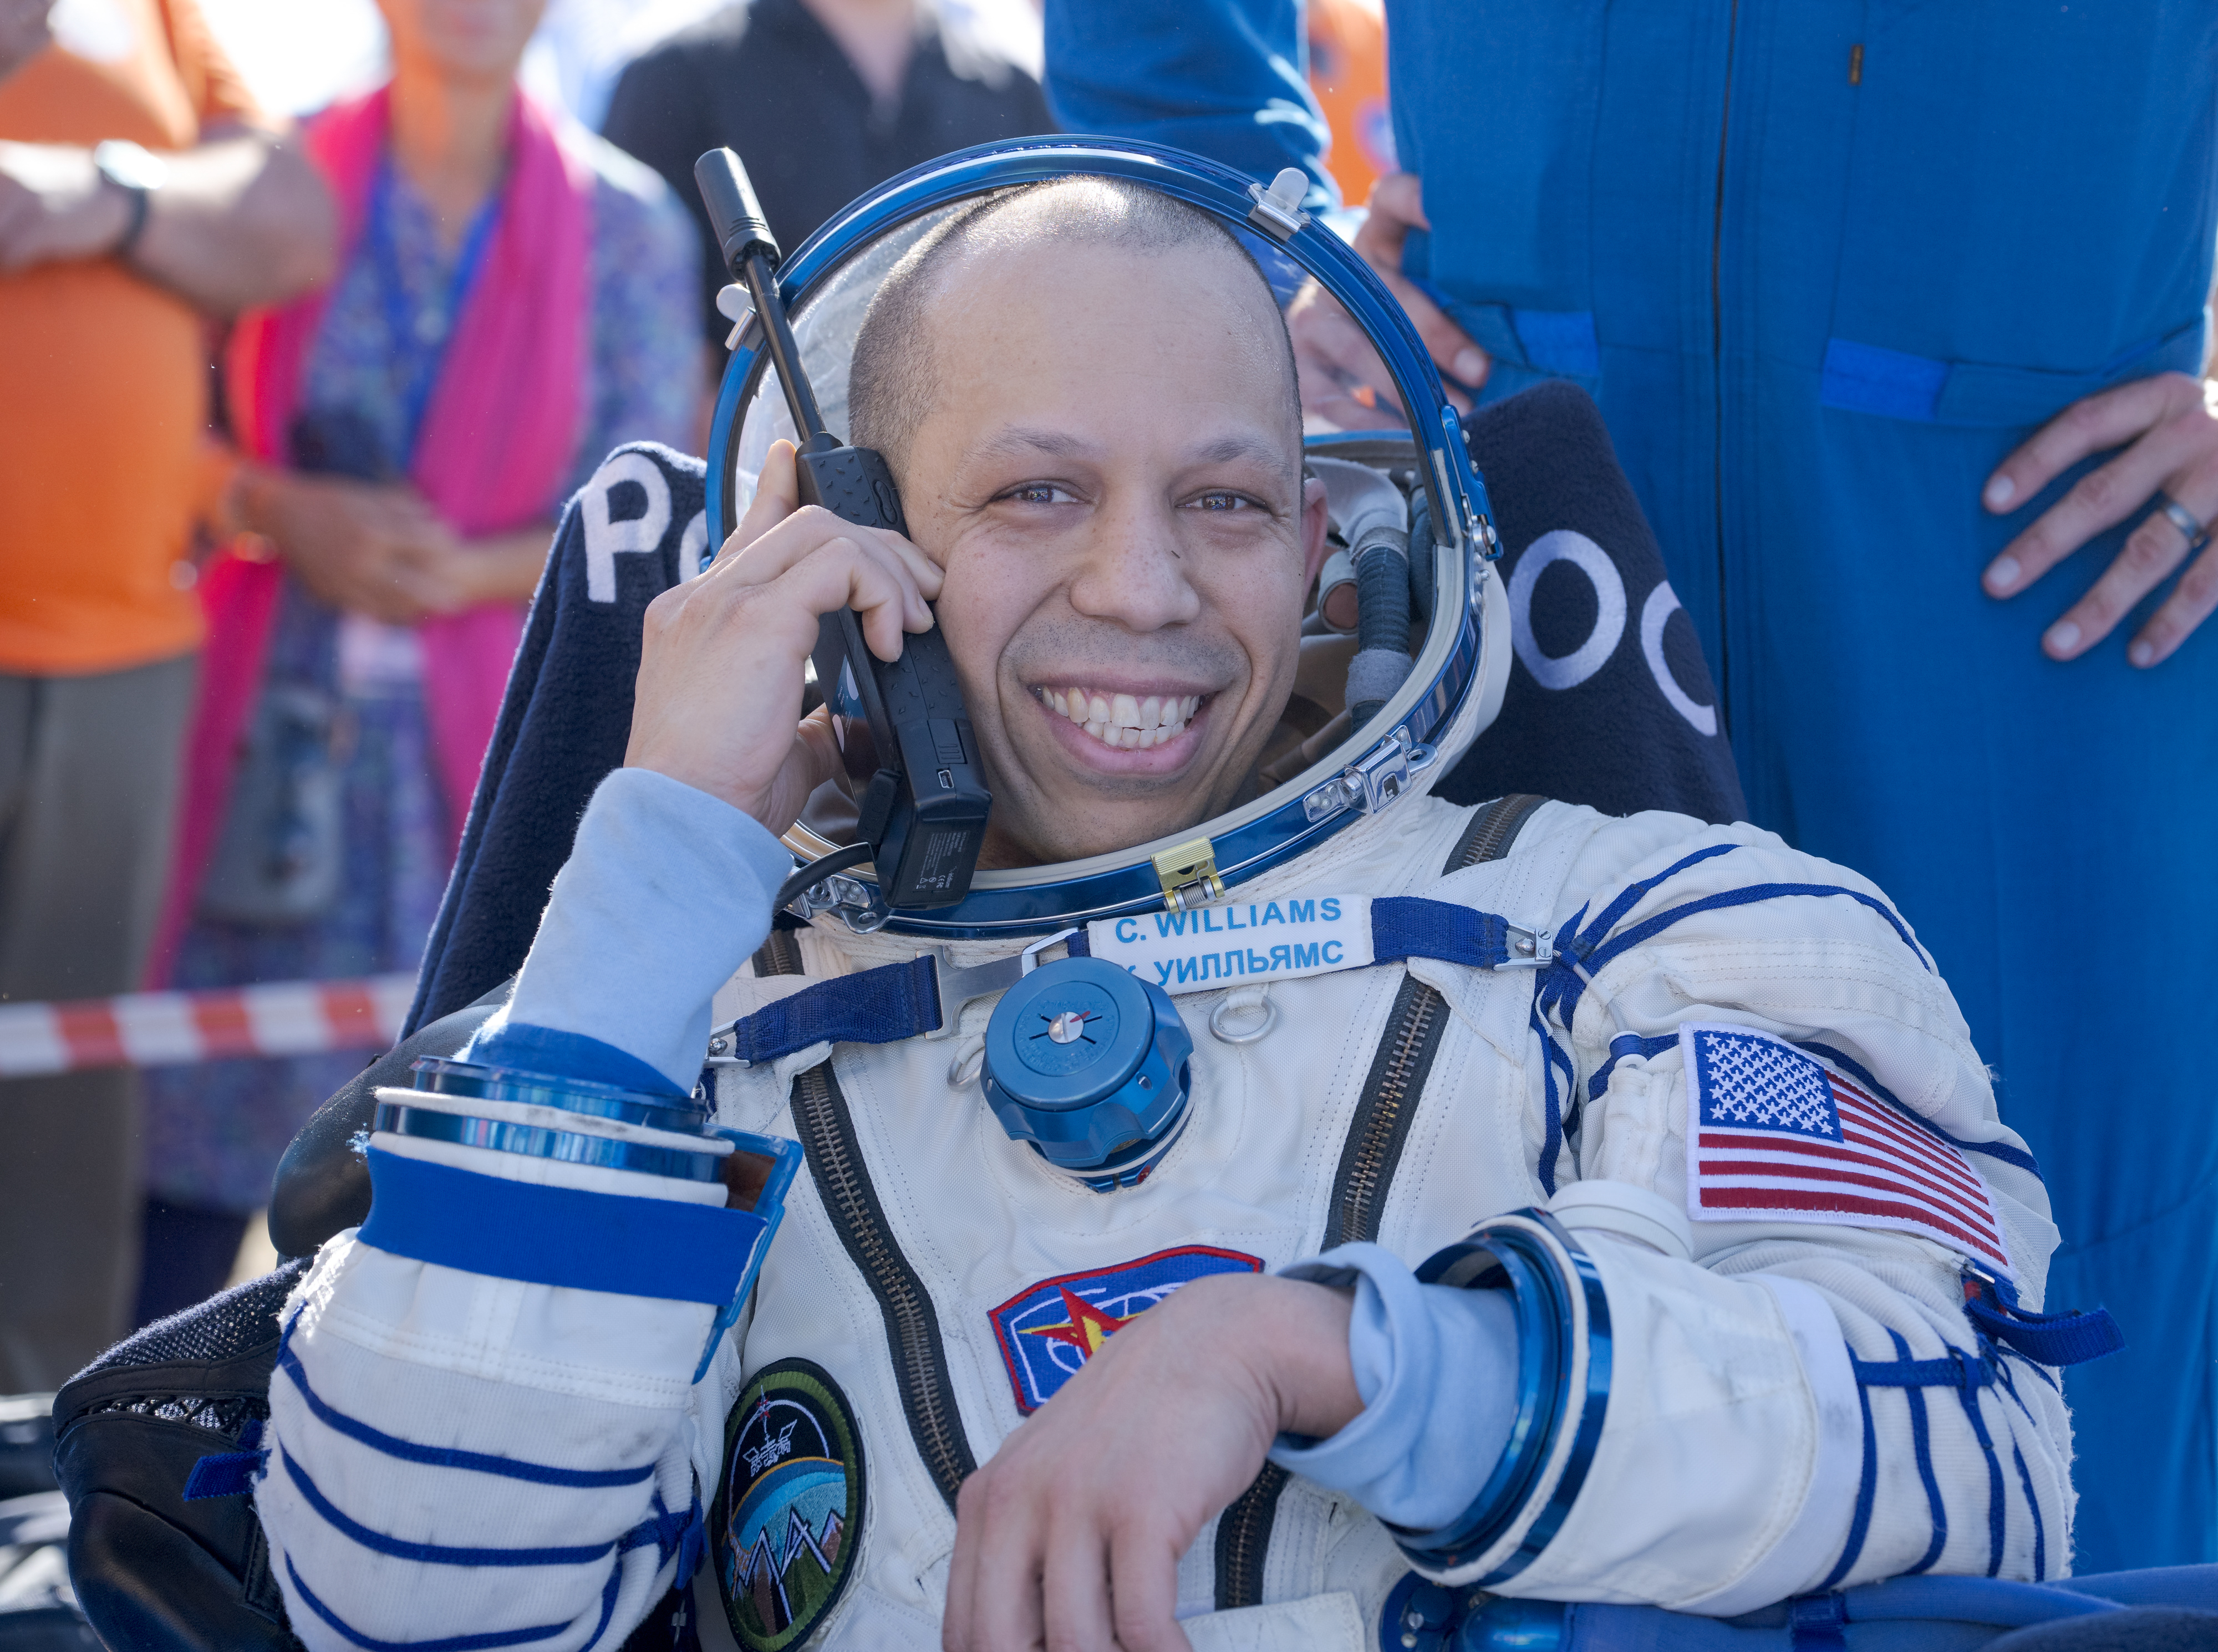
NASA astronaut Chris Williams is all smiles in this July 26, 2026, photo taken shortly after he landed with Expedition 74 Roscosmos cosmonauts Sergey Kud-Sverchkov, and Sergei Mikaev in Kazakhstan. This was Williams’ first mission.
Williams spent eight months aboard the International Space Station, where he supported a wide range of scientific investigations and technology demonstrations. He also completed two spacewalks to prep for space station power system upgrades and to replace a faulty joint on the Canadarm2 robotic arm.
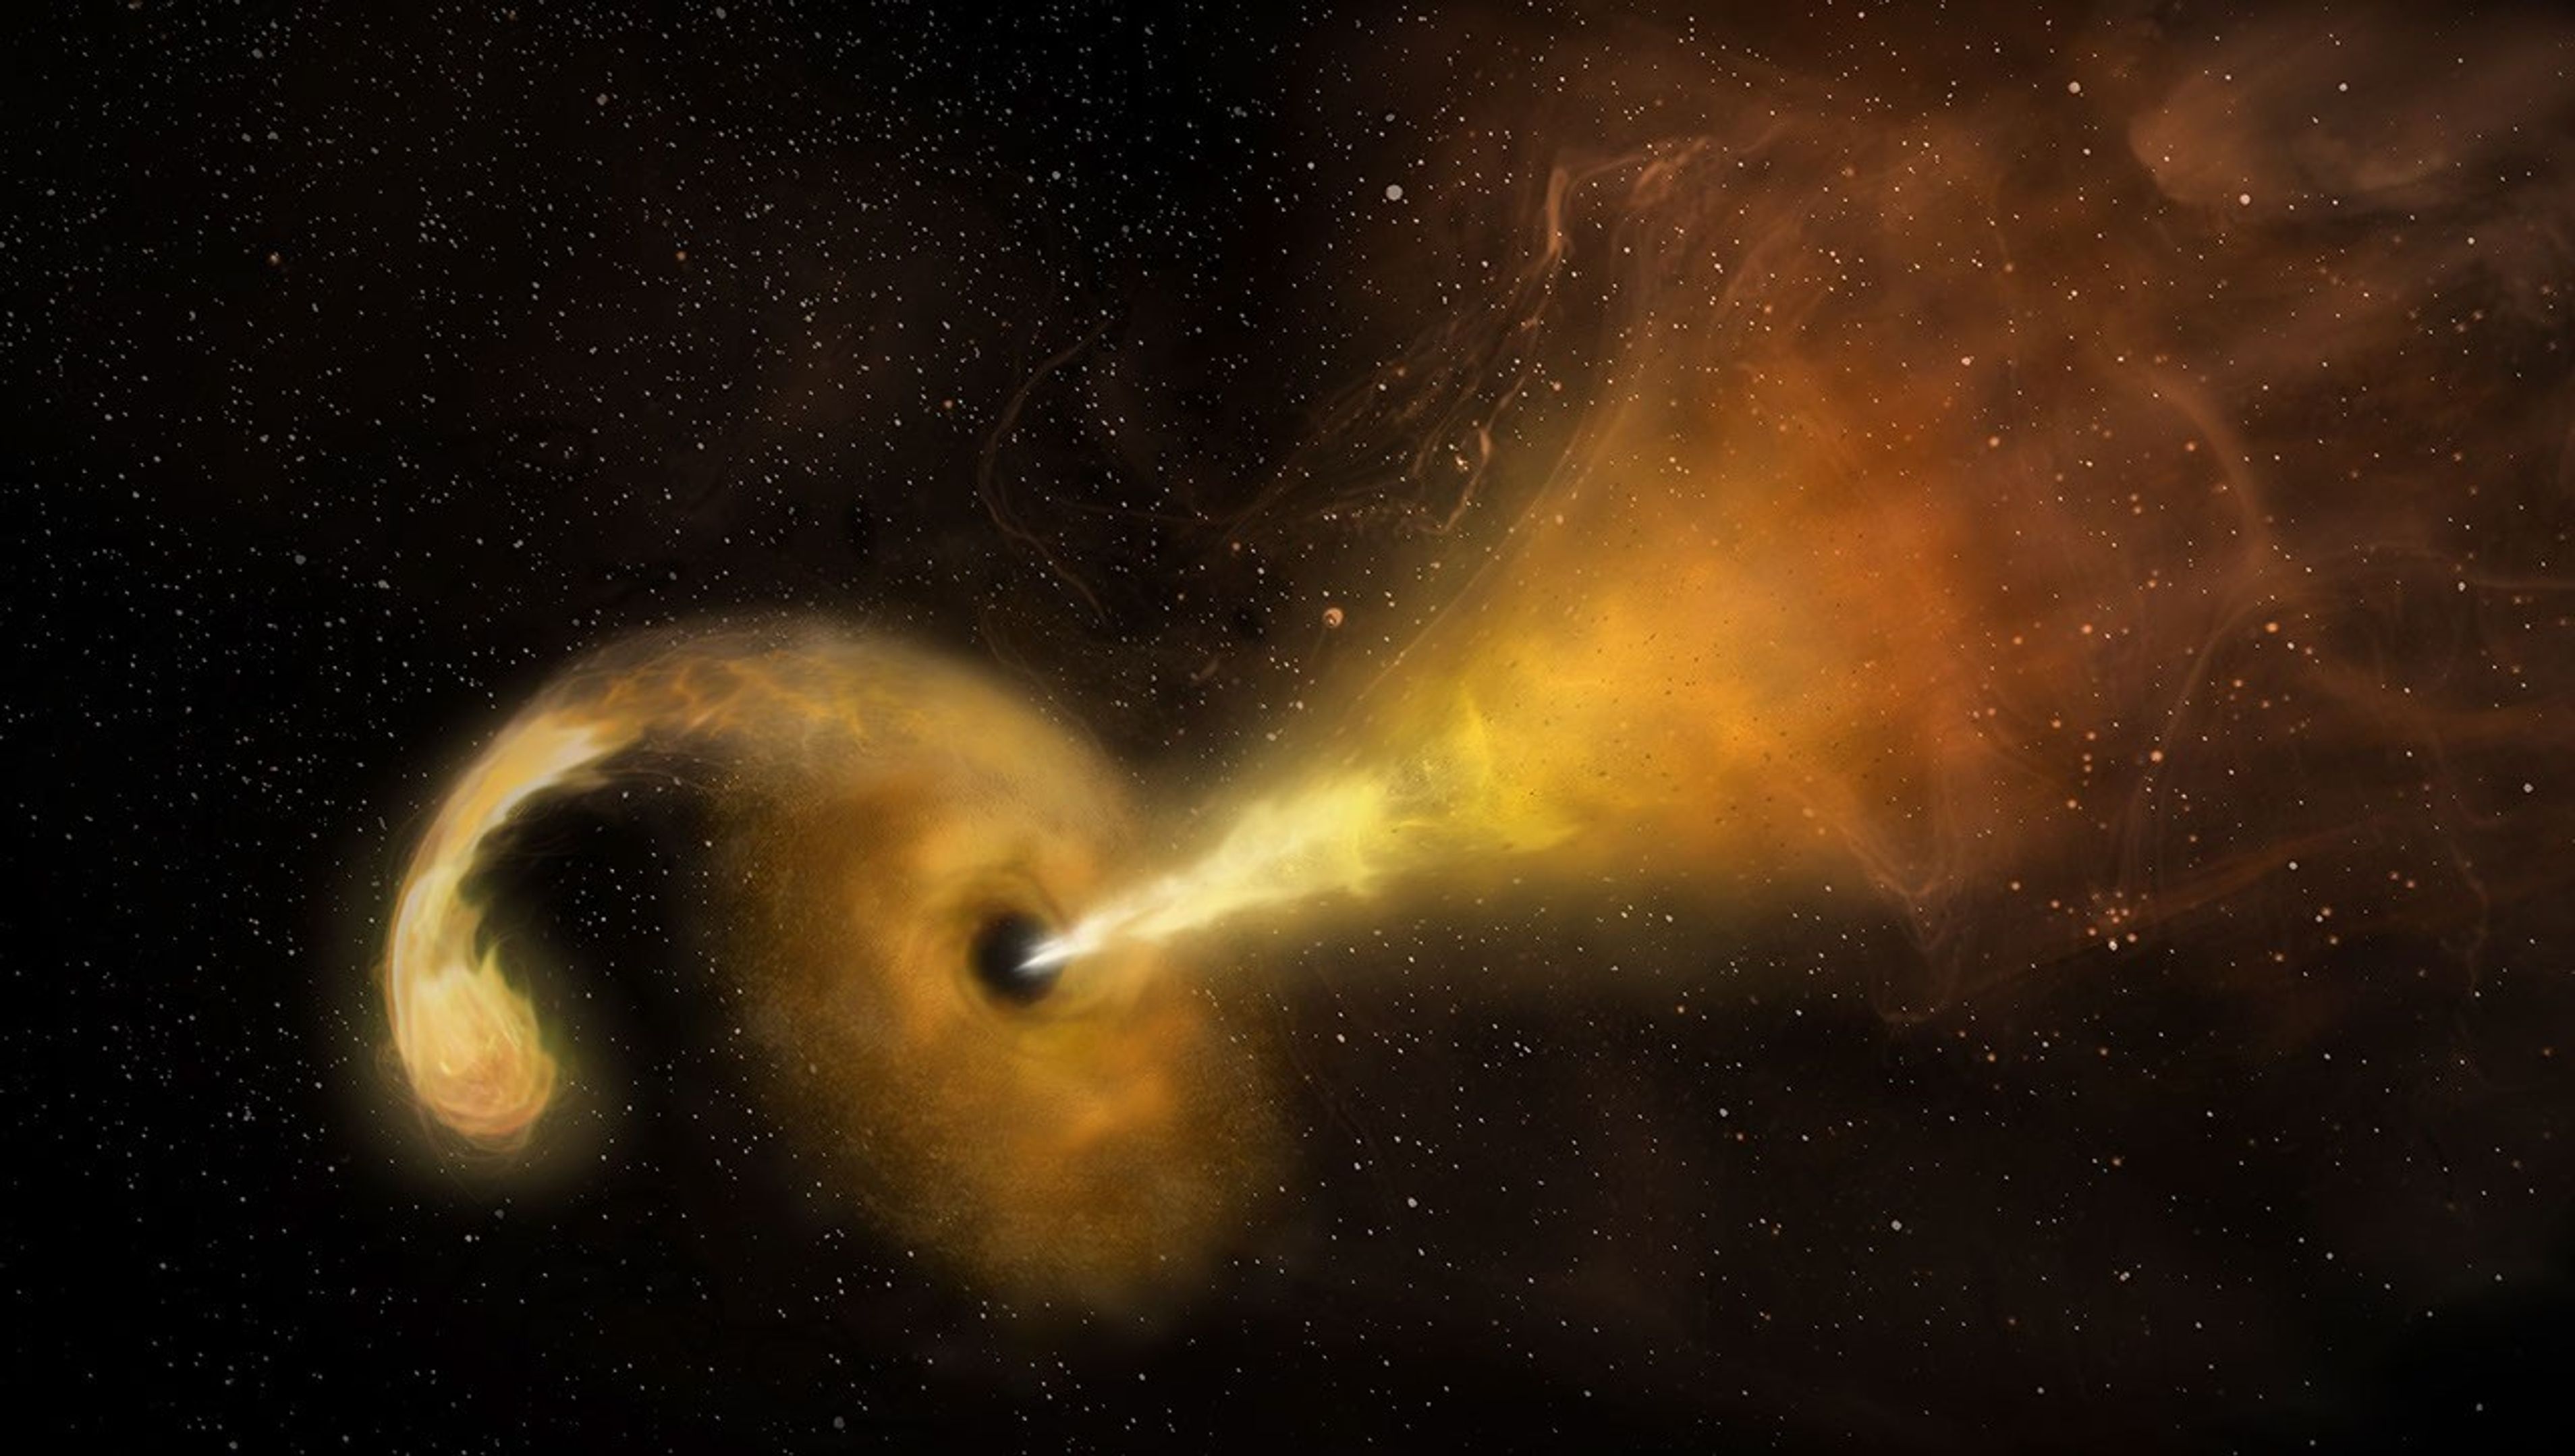
This artist’s concept depicts a tidal disruption event, which occurs when a star passes fatally close to a supermassive black hole. Crumbs of the splintering star heat up as they swirl around the black hole, creating a glow astronomers can see from far across the cosmos, and the black hole launches a relativistic jet into space.
NRAO/AUI/NSF/NASA
NASA’s Neil Gehrels Swift Observatory captured an “orphan” black hole lighting up as it devoured a star on the outskirts of a faraway galaxy. These phenomena are rare to begin with, and none had ever before been seen so far outside of a galaxy’s core.
“We were looking for these star-shredding events as a way to find otherwise invisible supermassive black holes wandering away from the galactic cores where they usually reside,” said Robert Stein, a research fellow at The University of Maryland, College Park and NASA’s Goddard Space Flight Center in Greenbelt, Maryland. “With this discovery, which is one of just a couple that have been confirmed so far, we’ve validated a new technique and can use it to hunt for more.”
A paper describing the results, led by Stein, was published Monday in The Astrophysical Journal Letters.
Researchers saw an ultrabright flare unleashed by a star being torn apart by extreme gravitational forces after drifting too close to a monster black hole — a phenomenon called a tidal disruption event. The black hole behind the blast weighs in at about a million times the Sun’s mass. Its existence was first flagged in November 2025 as an unusual brightening in a galaxy about 750 million light-years away by ZTF (Zwicky Transient Facility), a survey conducted by the Palomar Observatory in Southern California.
“Out of the half million flashes ZTF detects each night, our new artificial intelligence algorithm automatically recognized a flare that looked a lot like a tidal disruption event, despite its unusual location in the outskirts of a galaxy,” Stein said. For a few months, the tidal disruption event outshone its entire host galaxy in ultraviolet wavelengths, temporarily radiating with the light of about 10 billion suns.
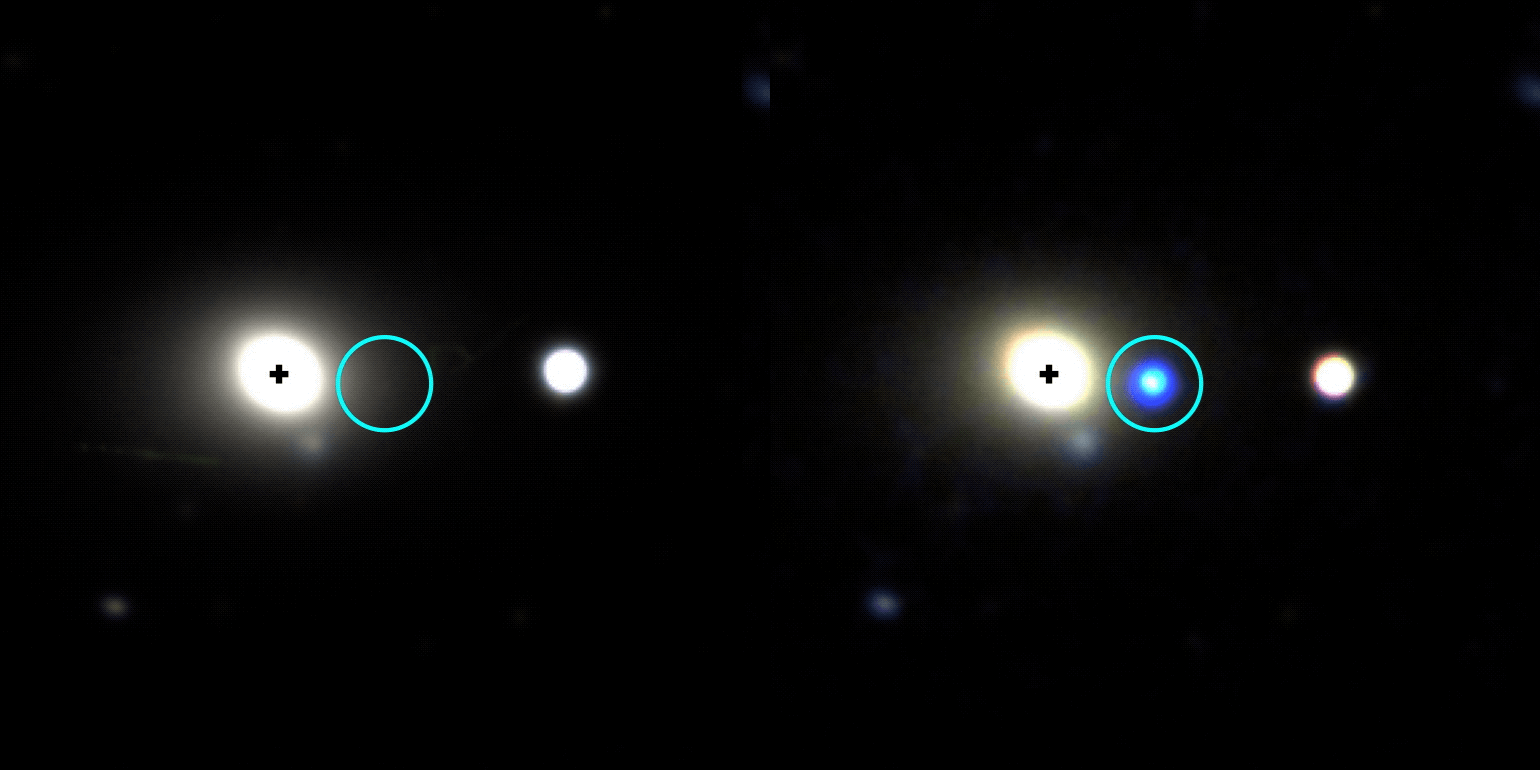
This gif shows the galaxy WISEA J014656.04-152214.7, located about 750 million light-years away in the constellation Cetus, before and after a tidal disruption event was spotted on its outer edge in November 2025. The image at left was taken by the DESI (Dark Energy Spectroscopic Instrument) Legacy Survey and the one at right is from the Lowell Discovery Telescope.
Other telescopes, including the SOAR (Southern Astrophysical Research) telescope in Chile, followed up on the ZTF source to look at the event’s spectrum, which revealed features supporting that it was likely a tidal disruption event. Astronomers then used NASA’s Swift to look at wavelengths they can’t detect with ground-based telescopes to uncover new information. For example, Swift’s UVOT (Ultraviolet/Optical Telescope) took the blip’s temperature and found that it had quite a fever at about 54,000 degrees Fahrenheit (30,000 degrees Celsius).
“The combination of all this data helped us rule out other explanations and confidently say it’s a tidal disruption event, despite its strange location,” said Jonathan Carney, a doctoral student at the University of North Carolina at Chapel Hill, who took the first spectra that supported the flare’s interpretation as a tidal disruption event.
Hidden heavyweights
Nearly every galaxy in the universe is anchored by a supermassive black hole sitting right in the center. About once every 100,000 years, a star will drift too close to this invisible heavyweight and trigger a tidal disruption event.
While they’re rather rare in any given galaxy, scientists scour millions of galaxies for them. Each year, astronomical surveys typically spot about 30 tidal disruption events occurring somewhere in the universe.
Prior to 2024, they’d only been seen in galaxy cores. That’s partly because astronomers mainly looked for them there; after all, it’s where all the known supermassive black holes were, and you can’t get a tidal disruption event without one (the gravitational pull of lighter black holes isn’t strong enough).
Then scientists saw the telltale signs of a star being shredded 2,600 light-years from the center of its host galaxy. That inspired more astronomers to look beyond galaxy cores for similar events, and now a team has identified one more than 30,000 light-years away from a galaxy’s center.
This video visualizes a star approaching a supermassive black hole so closely that it’s stretched to a breaking point by the black hole’s strong gravity. Intense tidal forces crack the star open and hurl its gaseous guts outward. Stellar debris forms a spinning accretion disk as it continues to spiral into the black hole.
NASA, ESA, STScI, Ralf Crawford (STScI)
Oddball origin story
So how did the newfound black hole become so off-kilter?
“It must have originated in a galaxy’s center, but not the one it’s in the outskirts of now,” Stein said. “We think the host galaxy’s supermassive black hole is still at its core, but the one eating the star could have started off in a small galaxy that merged with the big one we see today.”
The researchers have outlined two possibilities. Three or more galaxies may have merged together, and the gravitational tug-of-war between their central supermassive black holes may have flung the lightest black hole out to the galaxy’s edge.
Or a dwarf galaxy could be midway through a merger. As the dwarf’s stars fell into the larger galaxy, one may have passed too close to the dwarf’s supermassive black hole.
“Further discoveries could reveal the origin of this apparent ‘orphan’ black hole,” Stein said. “The key science question we want to answer is: How common are wandering black holes?”
The answer may soon be within reach. “Pointed science observations with Swift’s UVOT and XRT (X-Ray Telescope) instruments are temporarily suspended as the mission awaits an orbit boost, which is planned for this summer,” said co-author S. Bradley Cenko, Swift’s principal investigator at NASA Goddard. The spacecraft, whose primary mission ran from 2004 to 2006, is slowly sinking toward Earth due to atmospheric drag after more than 20 years of observations of the changing universe. Nudging it to a higher orbit could extend its lifetime even longer. “Once it resumes normal operations, Swift could continue searching for more examples of out-of-place black holes.”
In the coming years, scientists will use the new technique to search for disintegrating stars in observations from the newly operational Vera C. Rubin Observatory, jointly funded by the U.S. Department of Energy and National Science Foundation, in Chile and NASA’s upcoming Nancy Grace Roman Space Telescope.
“Rubin’s wide, deep surveys will reveal a much larger sample of tidal disruption events than current observatories are capable of collecting, including ones that are off-center,” Carney said. “And Roman’s space-based surveys will extend the current search zone by seeing ones that are farther away, looking back through 9 billion years of cosmic history.” Adding their observations to Swift’s and those from ground-based observatories will bring astronomers closer than ever before to completing a census of the universe’s behemoth black holes.
NASA astronaut Jessica Meir works inside the International Space Station’s Quest airlock in March, her reflection visible in a spacesuit helmet visor as she installs leg and arm components and swaps parts between suits.
Credit: NASA/Jack Hathaway
Editor’s note: This media advisory was updated July 27, 2026 to reflect an updated start time for the spacewalk on Thursday, Aug. 6.
NASA will provide coverage as astronauts venture outside the International Space Station during three spacewalks in August to continue upgrading solar arrays, replace a communications antenna, and connect power and data cables in support of space station operations.
Experts will preview the upcoming spacewalks during a news conference at 2 p.m. EDT, Thursday, July 30, from NASA’s Johnson Space Center in Houston.
NASA will stream these events through a variety of platforms. Learn where to watch online:
Bill Spetch, deputy manager of Commercial, Low Earth Orbit Program
Chris Dobbins, spacewalk flight director
Chloe Mehring, spacewalk flight director
United States-based media interested in attending in person must contact the Johnson newsroom no later than 3 p.m., Wednesday, July 29, at jsccommu@mail.nasa.gov. Media joining by phone should request dial-in details by the same deadline. To ask a question, media must dial in no later than 15 minutes before the start of the news conference.
Thursday, Aug. 6
NASA astronauts Jessica Meir and Anil Menon will exit the Quest airlock to install hardware that will modify the station’s 3B power channel and prepare it for the future installation of an International Space Station Roll-Out Solar Array (IROSA). The solar array, scheduled for delivery later this year, will be the seventh IROSA and will provide additional power to support critical station operations, including its safe and controlled deorbit.
Watch NASA’s live coverage of U.S. spacewalk 96 beginning at 7 a.m. The spacewalk is expected to start at 8:35 a.m. and last about six and a half hours.
This spacewalk will be the sixth for Meir and the first for Menon. Meir will serve as spacewalk crew member 1 and will wear a suit with red stripes. Menon will serve as crew member 2 and will wear an unmarked suit.
Thursday, Aug. 13
During U.S. spacewalk 97, two astronauts will replace a Space-to-Ground antenna on the orbital complex. The antenna is a critical communication system NASA uses to transmit data and high‑speed communication between the Mission Control Center in Houston and the space station.
Tuesday, Aug. 25
The U.S. spacewalk 98 crew members will connect power channel cables and data relay systems as part of ongoing maintenance, including preparations for the space station’s future deorbit. The astronauts also will replace a navigational aid used for spacecraft docking on the Harmony module’s forward port.
NASA will share additional details about U.S. spacewalks 97 and 98, including timing, assigned crew members, and coverage information, closer to each operation.
The spacewalks will be the 281st, 282nd, and 283rd conducted in support of space station assembly, maintenance, and upgrades.
To learn more about International Space Station research, operations, and its crews, visit:
NASA’s Hubble Shows Star Formation in Andromeda Galaxy Winding Down
NASA Hubble’s view of part of the Andromeda galaxy.
Credits: Image: NASA, ESA, Benjamin Williams (UWashington), Zhuo Chen (UWashington), L. Clifton Johnson (Northwestern); Image Processing: Joseph DePasquale (STScI)
A new study using data from NASA’s Hubble Space Telescope finds that star formation in the nearby Andromeda galaxy has undergone a 500-million-year decline, with an even steeper drop in the last 40 million years. Andromeda, a spiral galaxy comparable in size to our Milky Way, is close enough to be seen with the unaided eye from areas with dark skies. Located about 2.5 million light-years from Earth, practically our cosmic backyard, Andromeda offers an opportunity for astronomers to examine its stellar populations in detail, leading to better understanding of the past of galaxies like our own.
To reach this conclusion, the researchers combined data from two Hubble surveys: the Panchromatic Hubble Andromeda Treasury and the Panchromatic Hubble Andromeda Southern Treasury. Together, these two surveys mapped two-thirds of the disk of Andromeda in ultra-sharp detail. In total, the team measured about 200 million individual stars across the galaxy, giving them a detailed picture of Andromeda’s past activity.
“We need to measure the individual stars because they are the fossil record of the galaxy’s formation. Hubble is the only telescope that can give you high enough spatial resolution over a large enough area to be able to do that in Andromeda,” said Ben Williams, astronomer at the University of Washington and a co-author on the study.
Massive stars are bluer and short-lived, while less massive stars are redder and longer-lived. As a result, areas that have experienced recent star formation tend to have a larger fraction of blue stars, while areas with less recent star formation typically have a redder population. The team divided the Andromeda images into thousands of squares, spanning 300 light-years on each side of the square, and determined the history of star formation within each parcel to gain a comprehensive view of the galaxy’s past.
NASA’s Hubble Space Telescope has provided a detailed view of millions of stars in the Andromeda galaxy. Regions that have experienced recent star formation (1) appear significantly bluer than regions with less recent star formation (2).
NASA, ESA, Benjamin Williams (UWashington), Zhuo Chen (UWashington), L. Clifton Johnson (Northwestern); Image Processing: Joseph DePasquale (STScI)
Steady decline
Previous research showed the Andromeda galaxy experienced a dramatic burst of star formation about 2 billion years ago, likely due to a past interaction or merger with another galaxy. Since that time, star formation has been steadily declining.
Astronomers measure the rate of star formation in terms of the mass, or amount of gas and dust, converted into stars per year. The researchers calculated that, 500 million years ago, Andromeda formed stars at a rate of about one solar mass per year. However, the formation rate dropped to about half that by 40 million years ago. The current rate has plummeted even farther, to about one-fifth the mass of our Sun per year.
The team also examined whether that decline was consistent across the galaxy or concentrated in certain areas. They found that much of the recent star formation has occurred in a star-forming ring located about 32,000 light-years from the galaxy’s center. As a result, much of the decline they measure is driven by decreasing activity within that ring.
Rather than being the result of reduced material from which new stars can form, the decline is more likely to be a natural winding down from its previous, more active state.
“It’s just like after running a marathon, sometimes you’ve got to take a bit of a breather,” said Tobin Wainer, lead author, University of Washington.
Likely suspect
The team also investigated whether there was any connection between the decrease of activity in Andromeda and its proximity to satellite galaxy M32 (Messier 32). The M32 galaxy is separated from Andromeda by about 16,000 light-years in the plane of the sky; however, its 3D location in space is uncertain. As a result, astronomers are unsure if or when it might have interacted with Andromeda in the past.
“One of the major motivations for this program was to probe potential interactions between M32 and Andromeda’s disk,” said Zhuo Chen, co-author, University of Washington.
Survey data from the Panchromatic Hubble Andromeda Southern Treasury allowed the team to study the history of star formation in Andromeda near M32. They found that this area showed signs of decreased star formation compared with other regions. The timing of this decrease, which this study finds began roughly 60 million years ago, could help constrain when the M32 galaxy interacted with Andromeda’s disk.
“We can’t explicitly say that we are seeing a decrease in star formation because of M32. But it’s right there, and it’s definitely the most likely suspect,” said Wainer.
This movie, created from an analysis of data from NASA’s Hubble Space Telescope, demonstrates how the rate of star formation in the Andromeda galaxy has declined over the past 500 million years. Brighter colors indicate where star formation was highest during a given time.
Visualization: Tobin Wainer (UWashington); Image Processing: Joseph DePasquale (STScI); Video: NASA, ESA, STScI, Gregory Bacon (STScI)
The team plans to continue analyzing the Hubble data and combine it with data from ground-based observatories to gain additional insights into the history of Andromeda.
“There’s a strong scientific value to this archival data. Andromeda is important because it’s a neighbor that is close enough that we can see it in great detail while also getting a global perspective,” said Raja GuhaThakurta, co-author, University of California Santa Cruz.
An even greater global perspective is likely to come from NASA’s Nancy Grace Roman Space Telescope after it launches as early as Sunday, Aug. 30. Roman’s gigantic field of view can cover at least 100 times as much area as Hubble at near-infrared wavelengths in a single observation. A newly approved Roman observing program will image the entirety of Andromeda’s disk and areas of its surrounding halo, allowing astronomers to measure hundreds of millions of stars and enabling groundbreaking new science.
The Hubble Space Telescope has been operating for more than three decades and continues to make ground-breaking discoveries that shape our fundamental understanding of the universe. Hubble is a project of international cooperation between NASA and ESA (European Space Agency). NASA’s Goddard Space Flight Center in Greenbelt, Maryland, manages the telescope and mission operations. Lockheed Martin Space also supports mission operations at Goddard. The Space Telescope Science Institute in Baltimore, which is operated by the Association of Universities for Research in Astronomy, conducts Hubble science operations for NASA.
NASA’s Hubble Space Telescope has provided a detailed view of millions of stars in the Andromeda galaxy.
Star Formation Rate in Andromeda Over Time
This movie, created from an analysis of data from NASA’s Hubble Space Telescope, demonstrates how the rate of star formation in the Andromeda galaxy has declined over the past 500 million years.
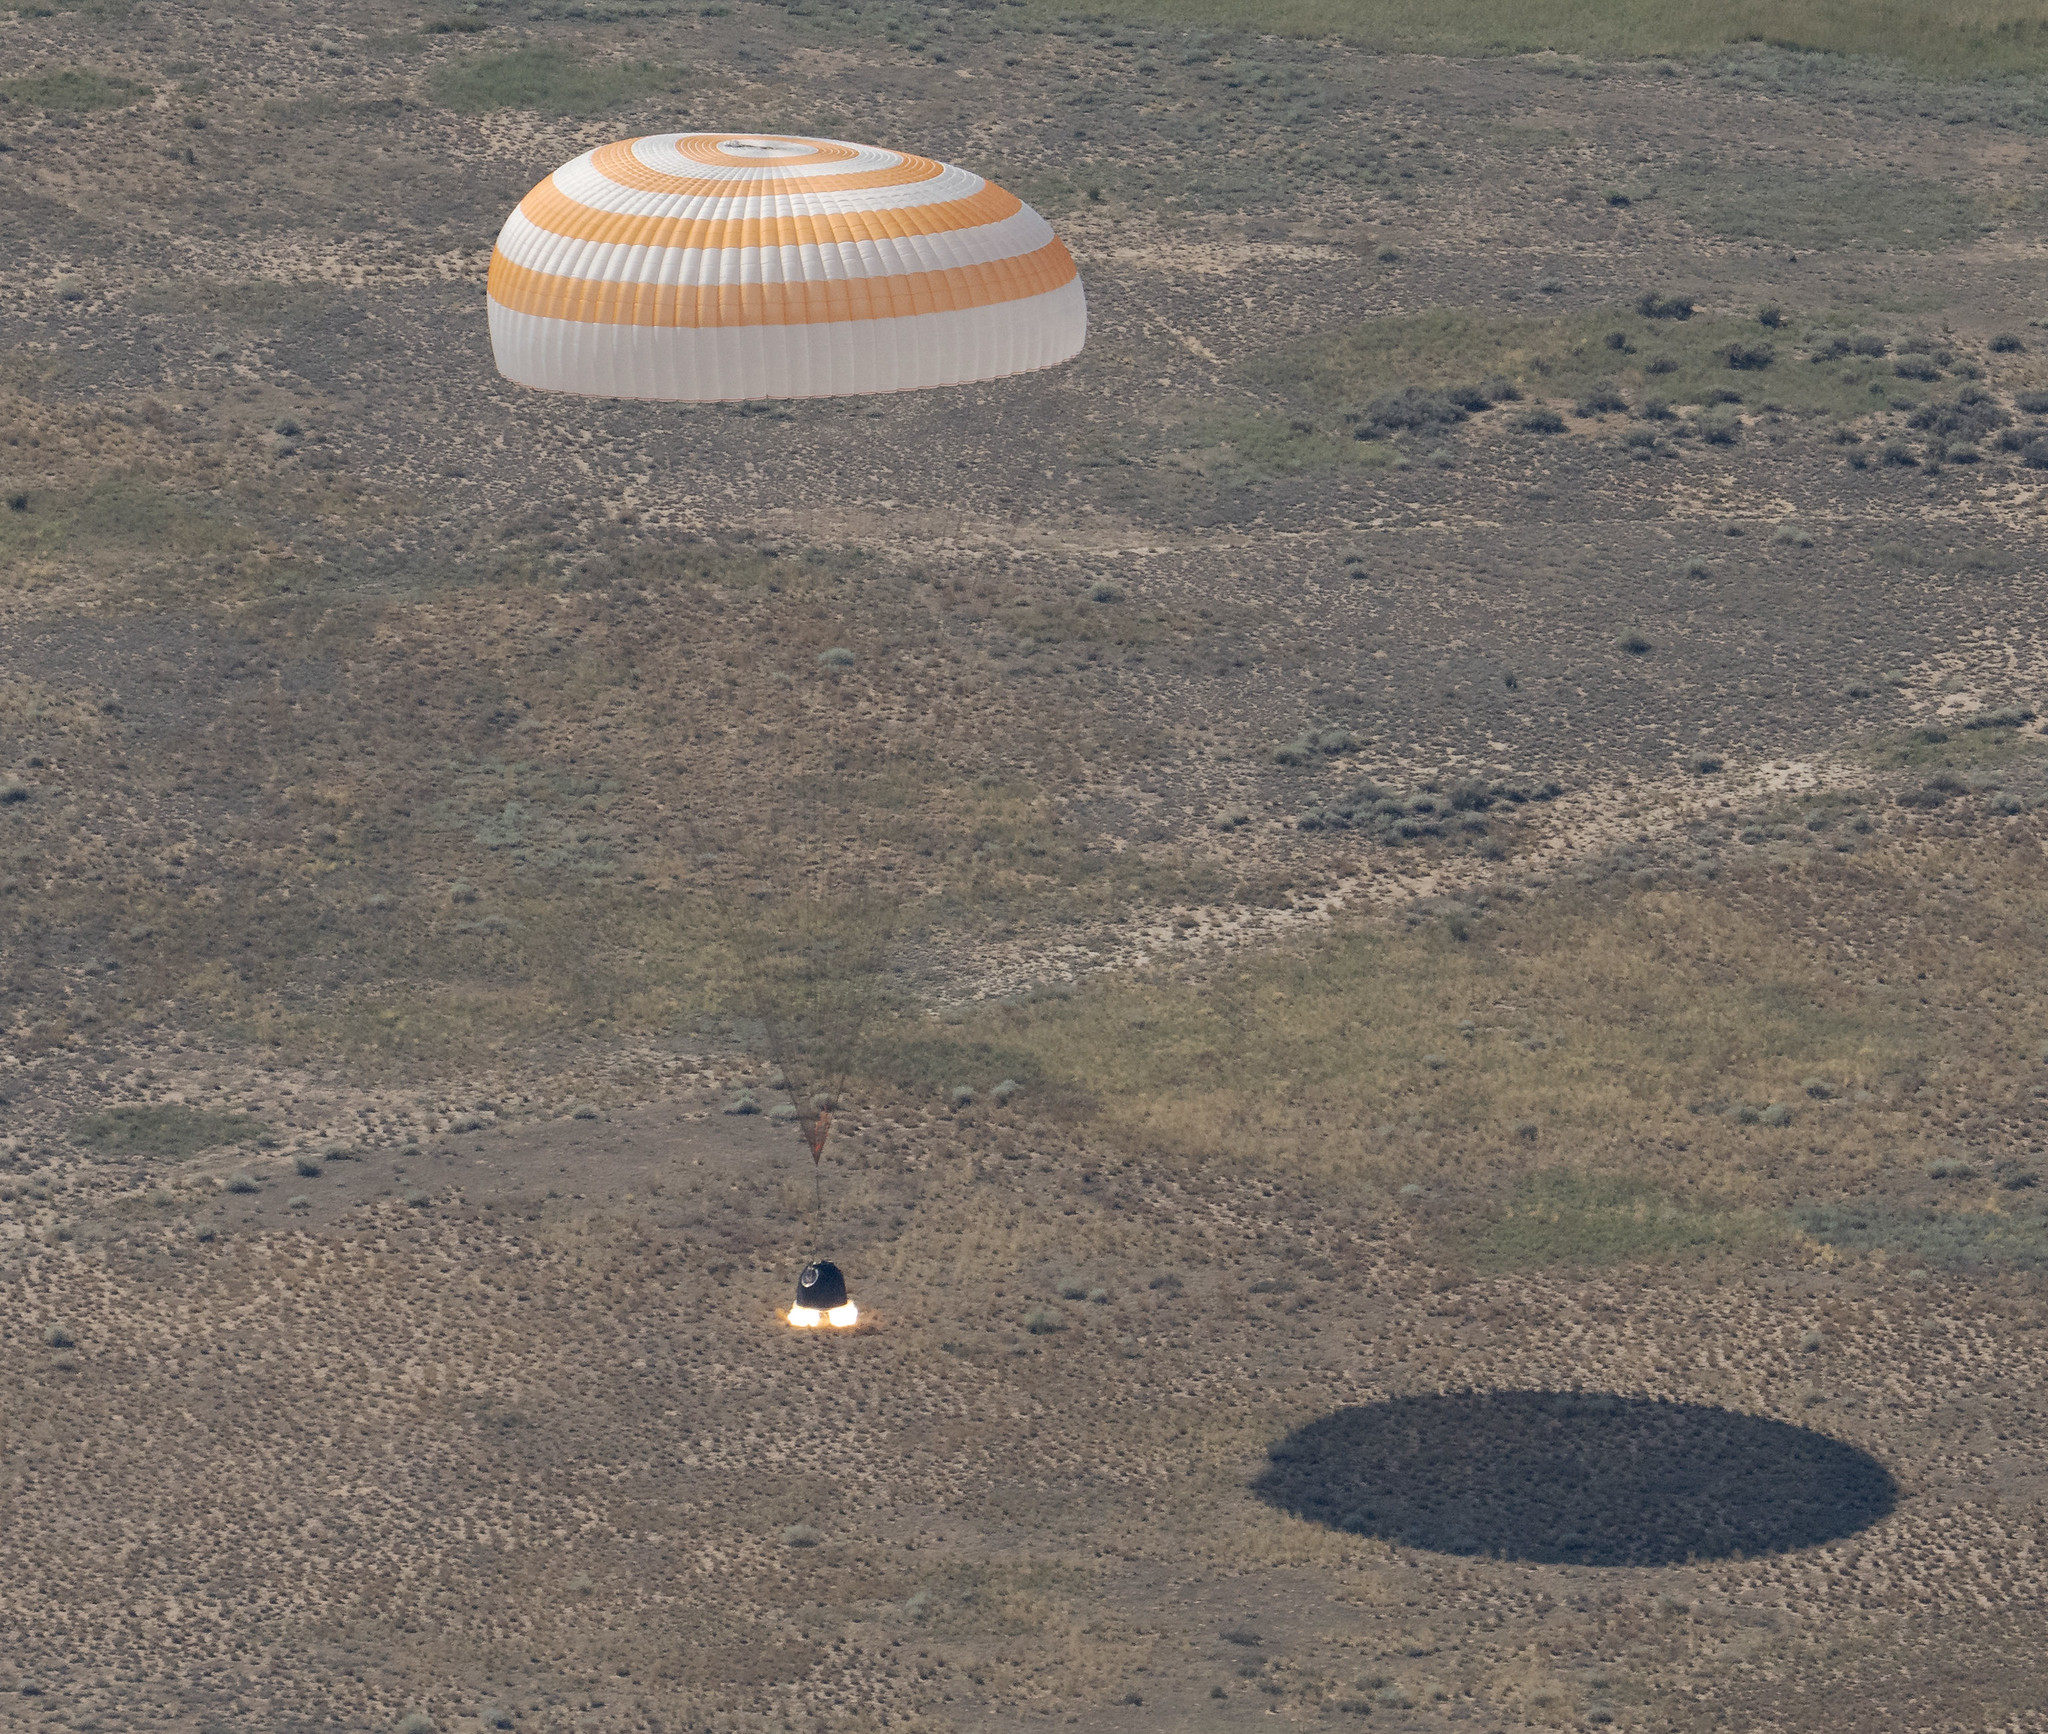
The Soyuz MS-28 spacecraft is seen as it lands in a remote area near the town of Zhezkazgan, Kazakhstan with Expedition 74 NASA astronaut Chris Williams, and Roscosmos cosmonauts Sergey Kud-Sverchkov, and Sergei Mikaev aboard, Sunday, July 26, 2026.
NASA/Bill Ingalls
Concluding an eight-month science mission aboard the International Space Station, NASA astronaut Chris Williams returned to Earth on Sunday alongside Roscosmos cosmonauts Sergey Kud-Sverchkov and Sergei Mikaev.
The crew made its safe, parachute-assisted landing at 5:27 a.m. CDT (3:27 p.m., Kazakhstan time), southeast of Dzhezkazgan, after departing the space station at 2:03 a.m., aboard the Soyuz MS-28 spacecraft.
The crew was in space for 241 days, orbiting the Earth 3,856 times and traveling more than 102 million miles. They launched to the International Space Station on Nov. 27, 2025. The mission was the first for Williams and Mikaev and the second for Kud-Sverchkov.
While aboard the orbiting laboratory, Williams supported a wide range of scientific investigations and technology demonstrations. He helped advance research for new cancer treatments and improved in-space manufacturing of materials used in high-performance computers and electronics. Williams also completed two spacewalks to prep for space station power system upgrades and to replace a faulty joint on the Canadarm2 robotic arm. The crew’s work aboard the space station helps improve life on Earth and prepare for future human missions to the Moon and Mars.
Following post-landing medical checks, the crew members will fly by helicopter to Karaganda, Kazakhstan, where recovery teams are based. Williams then will board a NASA aircraft bound for the agency’s Johnson Space Center in Houston.
For more than 25 years, people have lived and worked continuously aboard the International Space Station, advancing scientific knowledge and making research breakthroughs not possible on Earth. The space station helps NASA understand and overcome the challenges of human spaceflight, expand commercial opportunities in low Earth orbit, and build on the foundation for long-duration missions to the Moon, as part of the Artemis program, and to Mars.
To learn more about International Space Station research, operations, and its crews, visit:
On July 3, one of NASA’s two Mars-destined ESCAPADE (Escape and Plasma Acceleration and Dynamics Explorers) spacecraft captured photos of Earth and the Moon in visible and thermal infrared light. At the time, the spacecraft was 363,250 miles (584,600 kilometers) from Earth and 115,600 miles (186,100 kilometers) from the Moon, making the Moon appear relatively large.
Taken with the Sun only partly illuminating Earth and the Moon, the visible light image shows the two bodies as crescents, with only around 8% of each face sunlit. Yet in the thermal infrared image, the shadowed hemisphere of Earth is illuminated by its own heat from both the atmosphere and surface, glowing at minus 10 to minus 44 degrees Fahrenheit (250 to 280 kelvins). Without the insulating blankets of oceans and atmospheres, the Moon’s far side remains at a much cooler minus 280 degrees Fahrenheit (100 kelvins).
visible light
thermal infrared light
Caption: In these images from NASA’s ESCAPADE mission, Earth (left) and Moon (right) can be seen. The image to the left of the slider shows visible light reflected by the Sun while the infrared image to the right shows the bodies’ emitted energy. White rings have been added in the thermal image to show the actual size of Earth and the Moon. Credit: NASA/UCB-SSL/NAU-Radiant/Lucint
NASA/UCB-SSL/NAU-Radiant/Lucint
In these images from NASA’s ESCAPADE mission, Earth (left) and Moon (right) can be seen. The image to the left of the slider shows visible light reflected by the Sun while the infrared image to the right shows the bodies’ emitted energy. White rings have been added in the thermal image to show the actual size of Earth and the Moon.
NASA/UCB-SSL/NAU-Radiant/Lucint
visible light
thermal infrared light
ESCAPADE Photos of Earth and Moon
July 3, 2026
In these images from NASA’s ESCAPADE mission, Earth (left) and Moon (right) can be seen. The image to the left of the slider shows visible light reflected by the Sun while the infrared image to the right shows the bodies’ emitted energy. White rings have been added in the thermal image to show the actual size of Earth and the Moon. Credit: NASA/UCB-SSL/NAU-Radiant/Lucint
The ESCAPADE mission used its Visible and Infrared Observation System cameras, provided by Northern Arizona University in Flagstaff, to capture the images, which are more than just road trip photo album snaps.
“We are thrilled that ESCAPADE was able to accommodate these excellent space-qualified cameras which will search for visible Martian aurora and investigate thermal properties of the Martian surface and atmosphere,” said Rob Lillis, the mission’s principal investigator at the University of California, Berkeley. “Since Earth and the Moon are well-known targets, imaging them provides an important calibration check for ESCAPADE’s cameras.”
The ESCAPADE spacecraft, which were built by Rocket Lab, are currently in a “loiter” orbit around Lagrange point 2, a location in space about a million miles from Earth. In November 2026, the spacecraft will fly by Earth to use the planet’s gravity to slingshot their way to Mars. When the spacecraft arrive in September 2027, they will study how a million-mile-per-hour stream of material flowing from the Sun, known as solar wind, interacts with the Martian environment and how that drives atmospheric loss at the Red Planet.
The ESCAPADE mission is funded by NASA’s Heliophysics Division and is part of the NASA Small Innovative Missions for Planetary Exploration program. The UC Berkeley’s Space Sciences Laboratory leads the mission with key partners Rocket Lab; NASA’s Goddard Space Flight Center in Greenbelt, Maryland; Embry-Riddle Aeronautical University; Advanced Space; and Blue Origin.
By Mara Johnson-Groh NASA’s Goddard Space Flight Center, Greenbelt, Md.
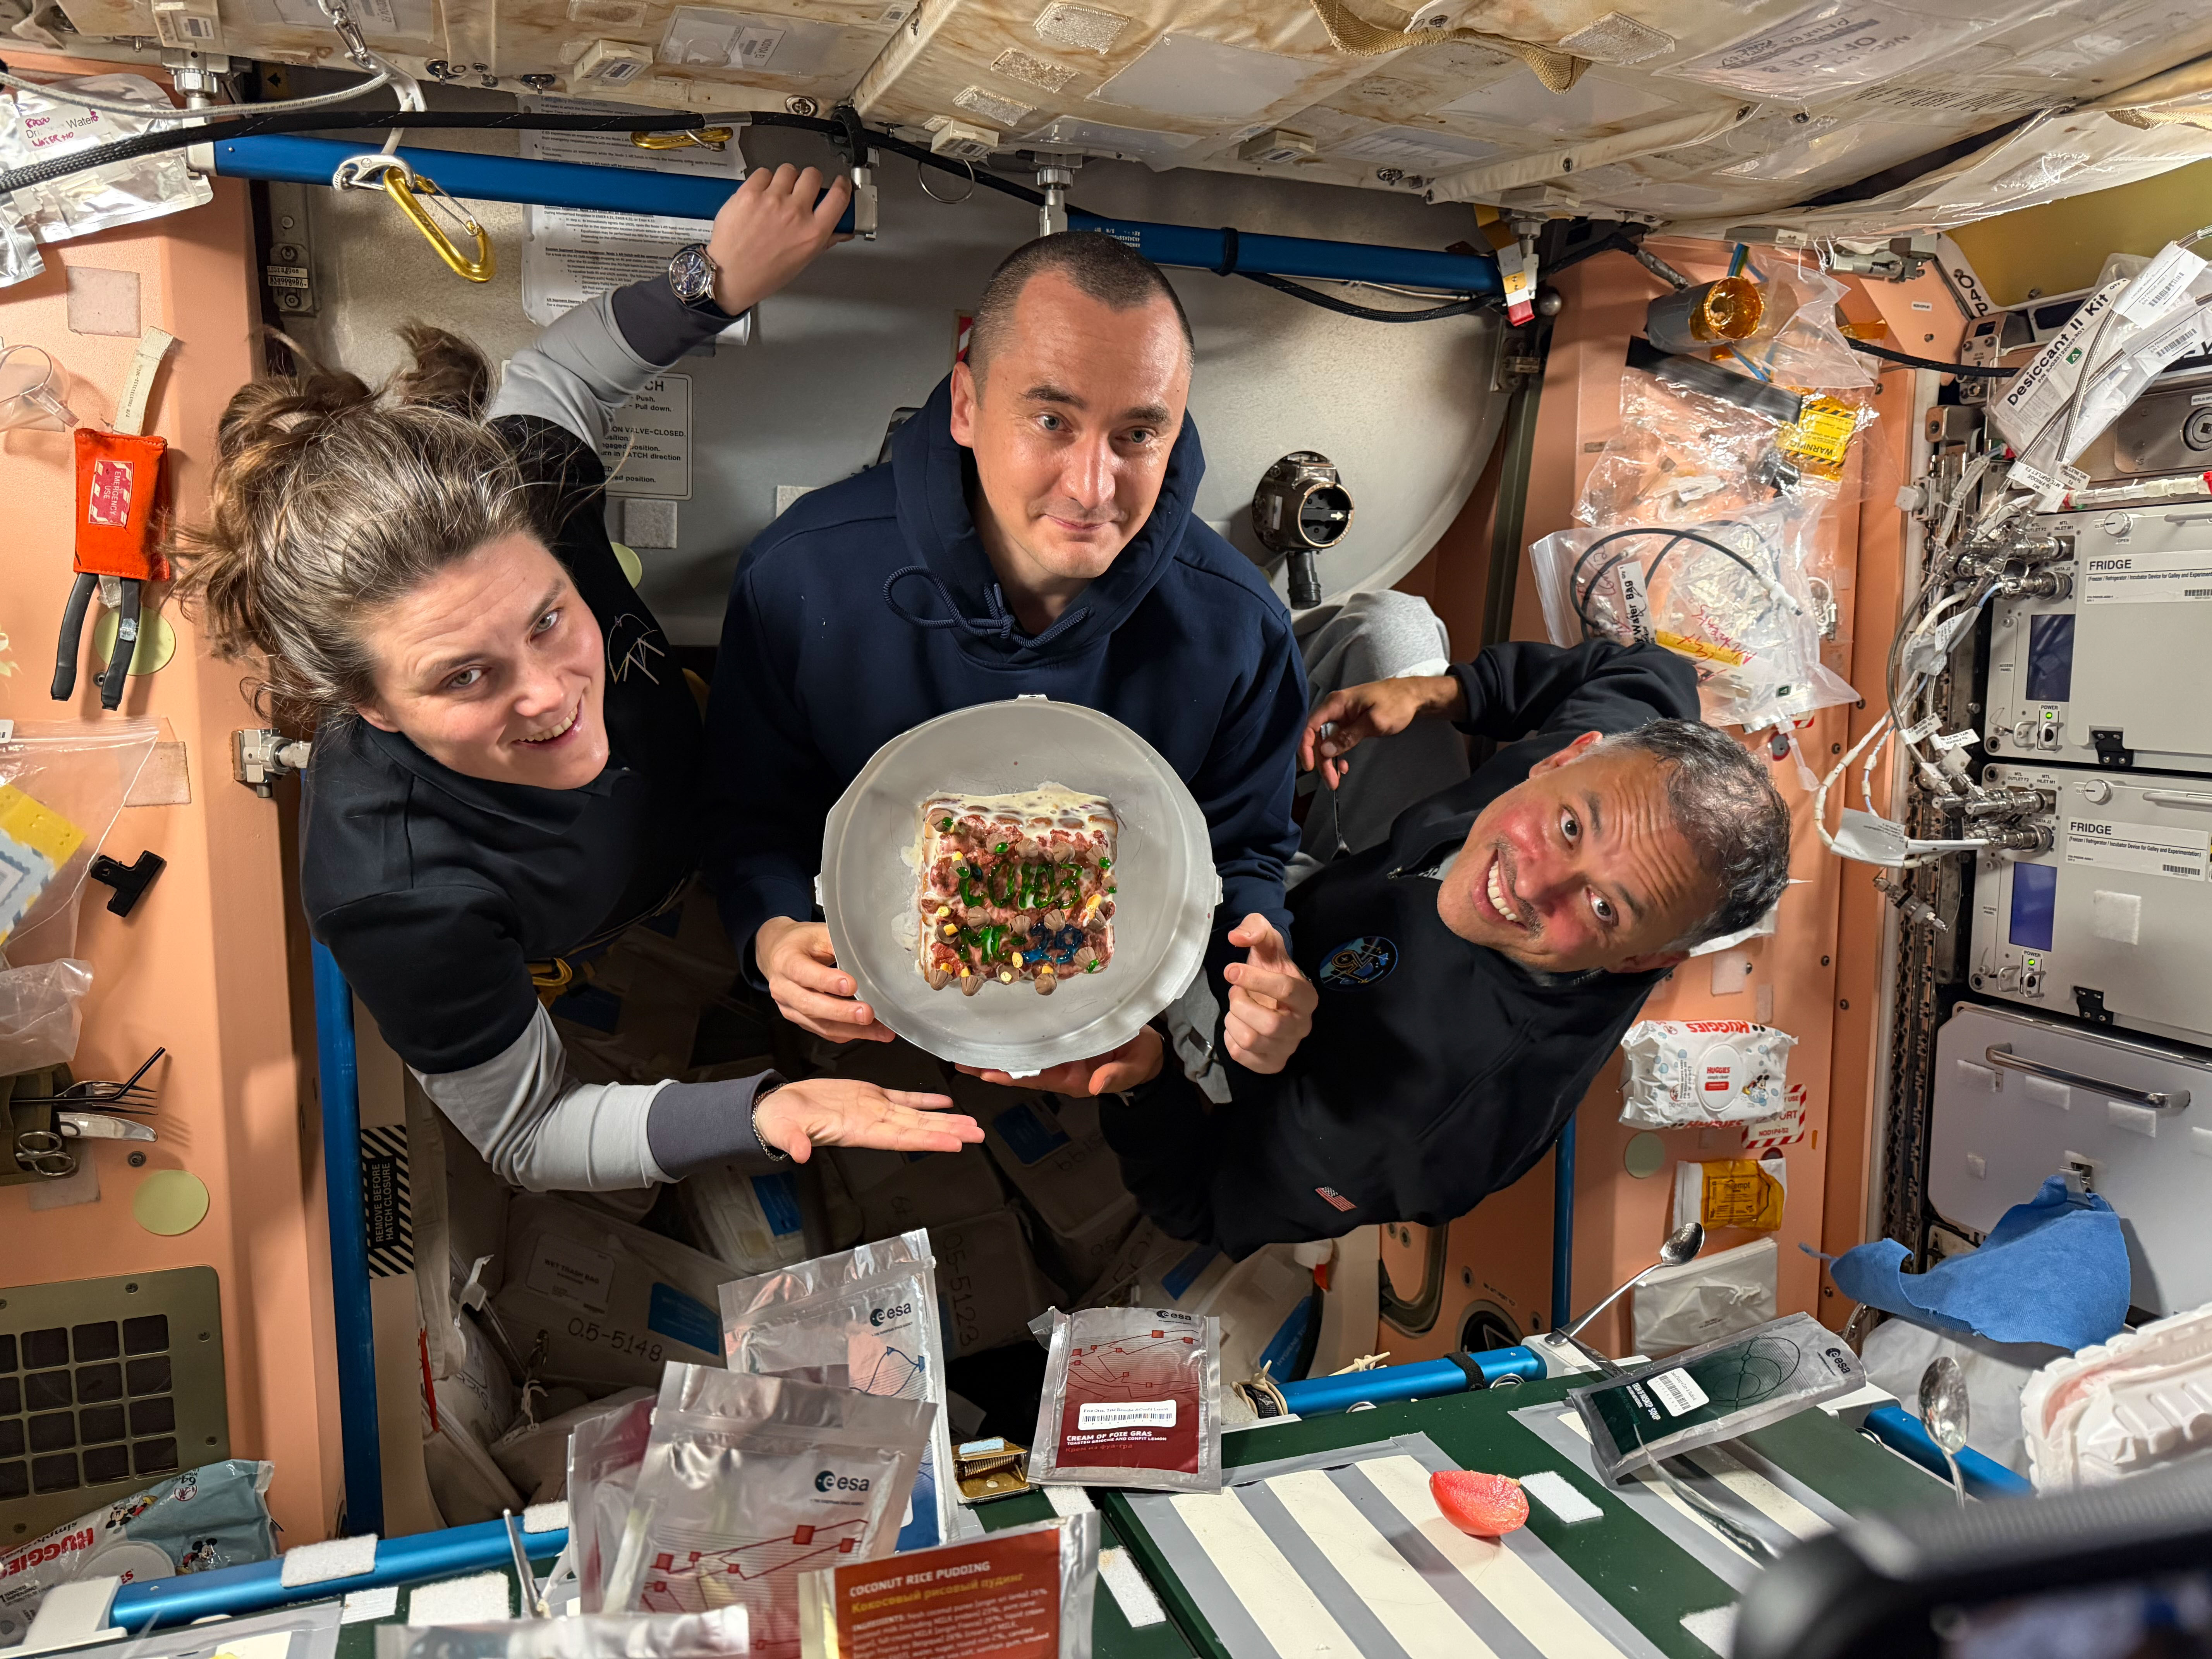
From left, Expedition 74 flight engineers Anna Kikina and Pyotr Dubrov of Roscosmos, and Anil Menon of NASA pose for a July 18, 2026, photo while holding a cake celebrating their recent arrival aboard the International Space Station. The trio arrived at the space station on July 14, 2026, after launching from the Baikonur Cosmodrome in Kazakhstan earlier the same day.
Kikina, Dubrov, and Menon are in the second week of their planned eight-and-a-half-month mission. They are using their new skills to conduct space research while still familiarizing themselves with living and working in space.
Preparations for Next Moonwalk Simulations Underway (and Underwater)
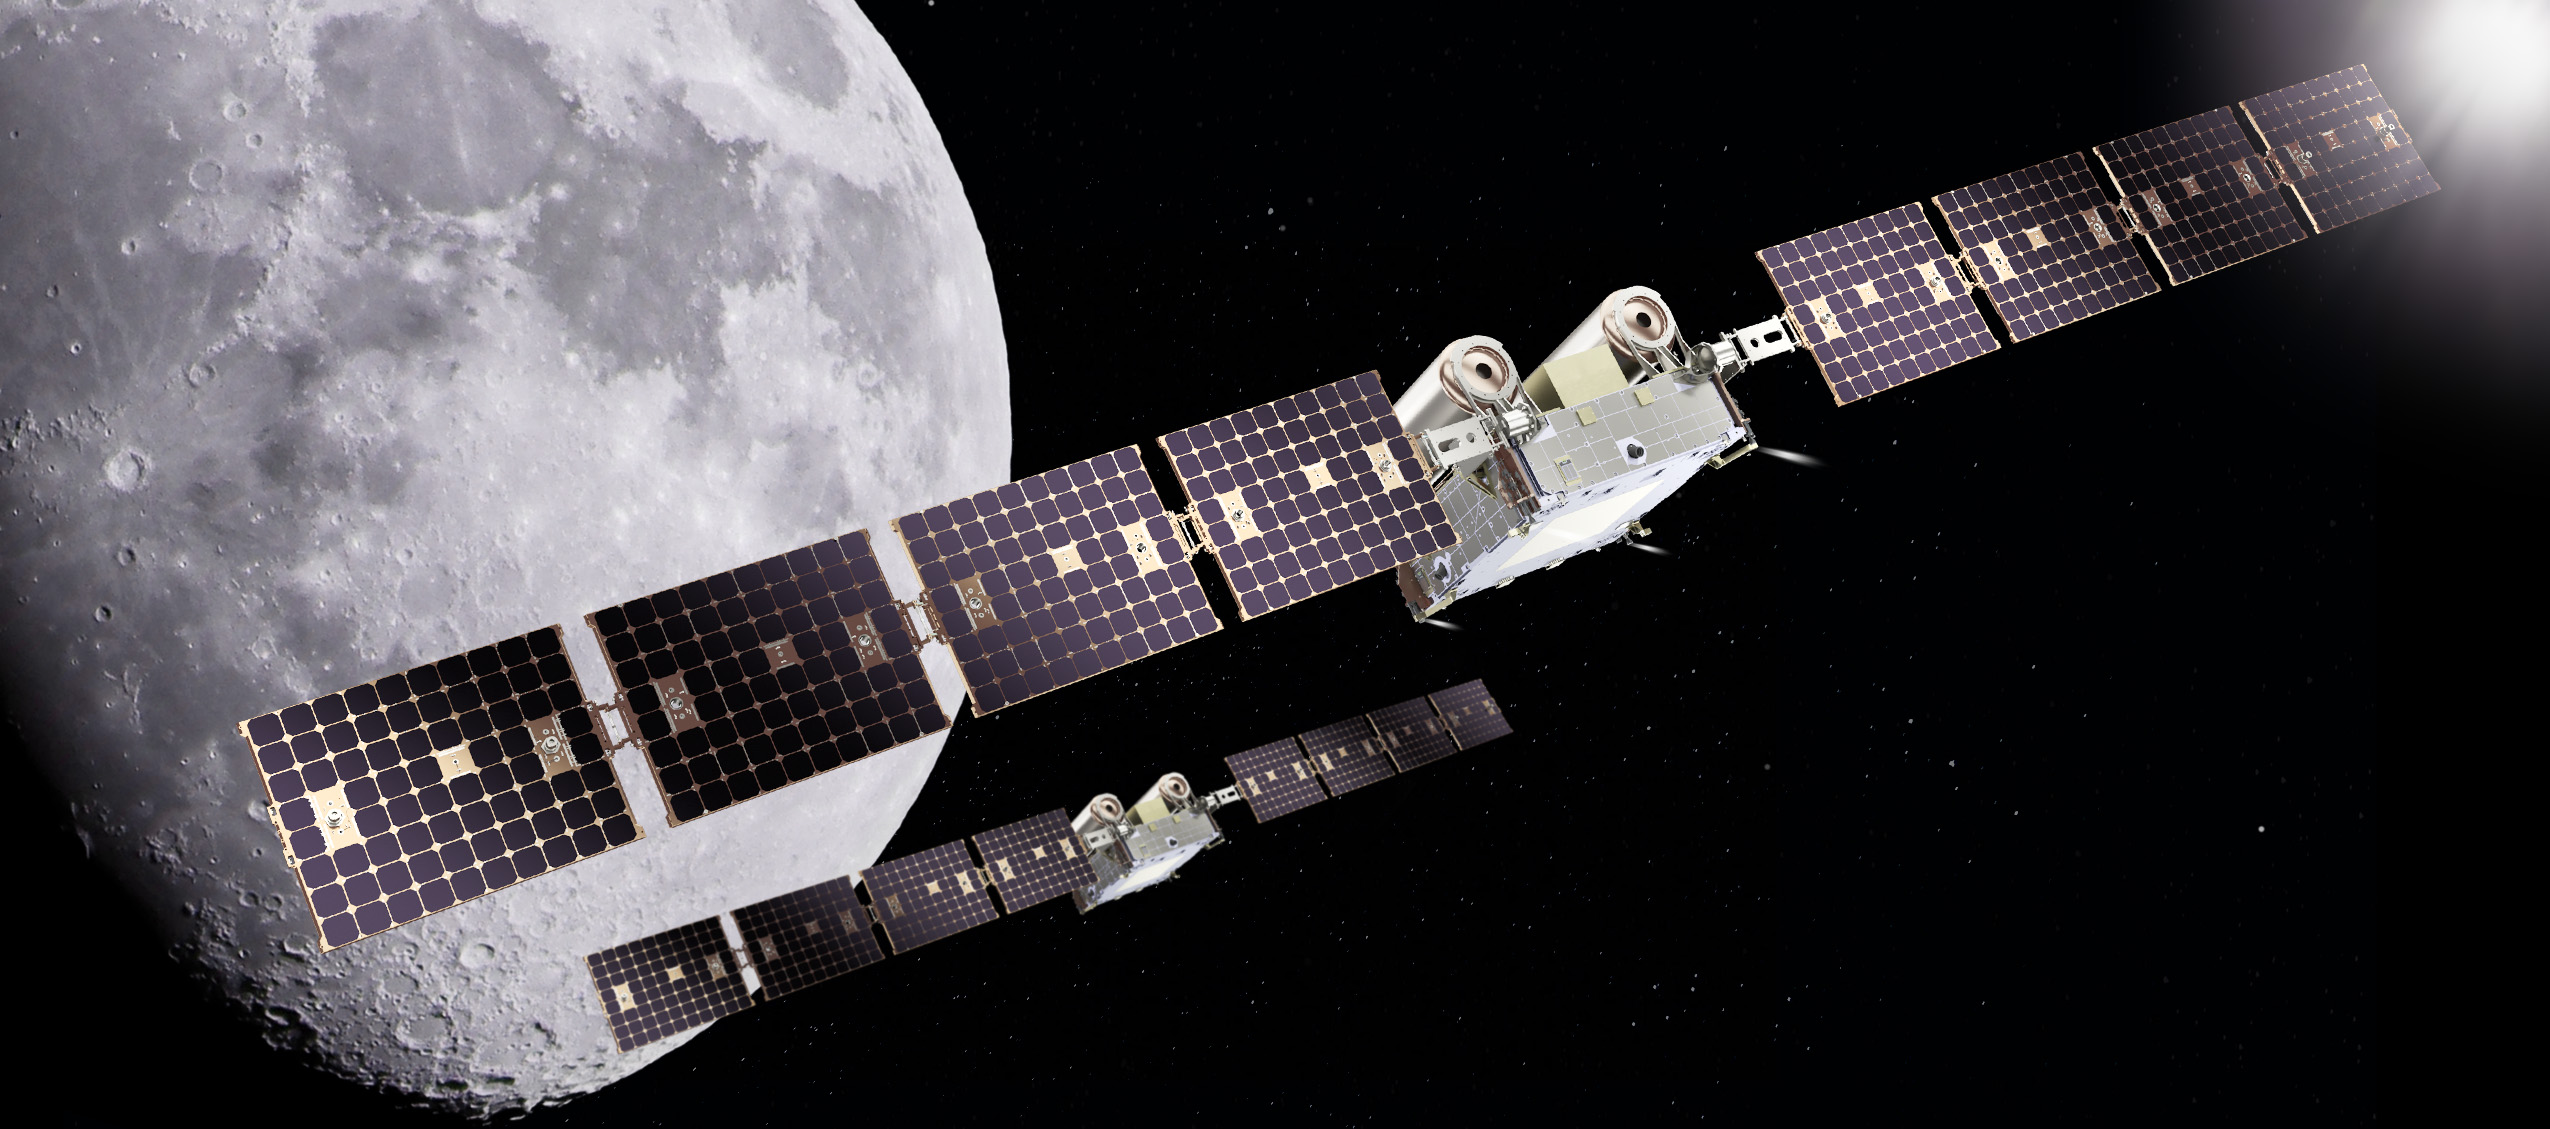
An artist’s rendering of NASA’s CAPSTONE 02 spacecraft in lunar orbit. The mission features two identical small spacecraft that will further mature technologies to support Artemis, Moon Base, and deep space exploration.
Terran Orbital
NASA is working with industry to advance the next phase of cislunar infrastructure for the agency’s Artemis program and Moon Base, including orbital assets and demonstrations. Under a contract awarded to Advanced Space, the agency’s CAPSTONE 02 mission will demonstrate rendezvous and proximity operations, autonomous navigation, and cislunar communication capabilities while continuing to characterize the radiation environment at the Moon.
The CAPSTONE 02 mission, targeted for launch in 2027, will use two small spacecraft in lunar orbit to facilitate these demonstrations to support future NASA lunar and deep space missions.
NASA’s original CAPSTONE demonstration, short for Cislunar Autonomous Positioning System Technology Operations and Navigation Experiment, became the first U.S. commercial mission to the Moon and the first spacecraft to operate in a near rectilinear halo orbit around the Moon. This is a nearly stable orbit, thanks to the interactive pull of gravity from both the Earth and the Moon.
The mission successfully validated communications, networking, and autonomous navigation capabilities while gathering operational experience in cislunar space. The second CAPSTONE mission expands upon these accomplishments by transitioning from orbit validation to demonstrations that will inform future lunar exploration and infrastructure development.
Achieving our most ambitious space exploration goals requires iterative, risk-tolerant demonstrations in partnership with industry. Technology development through flight testing is how we convert hard problems into the lasting capabilities needed for a permanent presence at the Moon.
Christopher Baker
Lead of the In‑Space Infrastructure portfolio within the Research and Technology Mission Directorate at NASA Headquarters in Washington, DC.
NASA’s CAPSTONE 02 mission will demonstrate advanced relative navigation technologies for rendezvous and proximity operations in cislunar space. These techniques are more sophisticated than those used in low Earth orbit and are designed to support NASA astronauts as they dock with Moon landers in cislunar orbit, enabling safe crew transfers to and from the lunar surface.
The demonstration will fly two identical spacecraft of approximately 400 kilograms (882 pounds) from Terran Orbital Systems, Inc. Mission operators will conduct a series of rendezvous and proximity operations and loitering – or formation flying – techniques in lunar orbit with each spacecraft to better understand the trajectories of the spacecraft under the simultaneous influence of Earth and Moon gravities, otherwise known as three-body orbits.
The CAPSTONE 02 mission will use ground tracking measurements, optical sensors, and celestial bodies to help one spacecraft locate and rendezvous with another. The mission will apply navigation strategies similar to those planned for Orion’s approach to a lunar lander in deep space, helping NASA build confidence in these techniques for future exploration.
Each CAPSTONE 02 spacecraft will have the ability to switch between ‘chaser’ and ‘target’ roles, testing a broad range of operational scenarios under a variety of environmental conditions in cislunar space. Transporting crew to the lunar surface from cislunar orbit depends on knowing how well navigation systems will perform during these operations. Since these conditions can’t be fully recreated on Earth, they must be tested in space.
The CAPSTONE 02 mission also will serve as an operational testbed, enabling testing of three NASA-developed navigation software suites. Each software application will collect data during CAPSTONE 02’s low energy transfer trajectory, which will take it from the Earth to beyond the Moon before settling into a lunar orbit. The spacecraft will carry an optical imaging payload from Lawrence Livermore National Laboratory to support the navigation demonstration as well as capture imagery of the Moon. In addition, the mission will further mature the Cislunar Autonomous Positioning System navigation software that was first demonstrated on CAPSTONE as a method of determining spacecraft position relative to other spacecraft without relying on Earth-based tracking.
The suite of technologies on CAPSTONE 02 are designed to automate routine navigation tasks, reduce reliance on traditional space-to-ground data, and enable new mission concepts that may be derived from increased inter-satellite coordination. Additionally, the CAPSTONE 02 spacecraft are designed for cost-effective, rapid deployment, demonstrating a scalable and repeatable mission model.
“This mission represents an important step in the maturation of cislunar capabilities,” said Sean Fuller, Moon Base CAPSTONE manager. “By expanding on the lessons learned from CAPSTONE to demonstrate increasingly sophisticated operational concepts, CAPSTONE 02 lays the foundation for lunar infrastructure and commercial services that support Artemis, Moon Base, and future missions to deep space.”
The CAPSTONE 02 mission is funded by NASA’s Human Spaceflight Mission Directorate with support from the Research and Technology Mission Directorate. The mission is managed by Small Spacecraft & Distributed Systems, based at NASA’s Ames Research Center in California’s Silicon Valley, within the Research and Technology Mission Directorate. NASA used a Small Business Innovation Research Phase III contract to fund the mission.
To learn more about NASA’s CAPSTONE mission, visit:
An image shows the B-1 and B-2 test stands at NASA’s Stennis Space Center near Bay St. Louis, Mississippi, on July 7, 2026. The test stand features dual, vertical firing positions built in the 1960s to test Saturn V rocket stages that carried humans to the Moon during the Apollo Program. The B-1 position, right, is equipped for single engine tests, while the B-2 position is designed to test full rocket stages. NASA announced an agreement with Blue Origin on July 24, 2026, to use the B-2 test stand for engine testing to advance rocket development for future missions to the Moon under the Artemis program.
Credit: NASA/Danny Nowlin
NASA and Blue Origin announced Friday they recently agreed to conduct second stage hot fire testing for the company’s New Glenn rocket on the B-2 test stand at the agency’s Stennis Space Center near Bay St. Louis, Mississippi.
The annex to a reimbursable Space Act Agreement signed earlier this month highlights NASA’s commitment to working alongside commercial partners toward Artemis missions in 2027 and beyond.
“Stennis continues to be a hub for the commercial space industry,” said Sen. Roger Wicker. “Mississippi warmly welcomes Blue Origin’s return to the coast and to our legendary rocket testing facilities.”
“The success of Artemis II has roots at NASA Stennis, and I’m excited about the prospect of Blue Origin establishing a rigorous test program in Mississippi as part of future American crewed missions to the Moon and beyond. I hope its use of B-2 test stand becomes a long-term arrangement that broadens our state’s contribution to space exploration. I will certainly do what I can to make that a reality,” said Sen. Cindy Hyde-Smith.
“Mississippi continues to play a vital role in America’s space program, and this agreement between NASA and Blue Origin is another major win for Stennis Space Center. The world-class capabilities at the B-2 test stand will help advance the next generation of rocket propulsion while supporting high-skilled jobs and strengthening our nation’s leadership in space exploration. I look forward to seeing the innovation that comes from this partnership,” said Rep. Mike Ezell.
Testing, targeted to begin this fall, directly supports NASA’s work to achieve the national goal of landing American astronauts on the surface of the Moon and building a Moon Base near the lunar South Pole. These efforts aim to strengthen American leadership in space, unlock scientific discovery, drive innovation with industry, and prepare for human missions to Mars.
“Winning the new space race means moving faster and working alongside a strong commercial industry. Supporting Blue Origin at NASA’s Stennis Space Center puts world-class American infrastructure to work advancing the capabilities needed to return astronauts to the Moon, establish a sustained lunar presence, and prepare for Mars. Partnerships like this strengthen our industrial base and help ensure the United States remains the world’s leader in space,” said NASA Administrator Jared Isaacman.
Building on the successful Artemis II flight from April, Artemis III is a highly choreographed, multi-launch campaign that will require four astronauts to test rendezvous and docking capabilities of NASA’s Orion spacecraft with commercial human landing systems from Blue Origin and SpaceX in low Earth orbit.
In addition, Blue Origin’s New Glenn will be used to launch missions that will land on the Moon.
“We are proud to partner with NASA and build on our shared commitment to returning America to the Moon and our broader mission to build a road to space for the benefit of Earth,” said Blue Origin CEO Dave Limp. “Stennis helped take Americans to the Moon, and through this partnership, it will help take us back.”
In May, NASA announced the first three Moon Base missions to begin building sustained operations, including an award to Blue Origin to launch a robotic mission this fall. The company’s Blue Moon Mark 1 Endurance lander will deliver NASA payloads to the lunar South Pole’s Shackleton Connecting Ridge, demonstrating capabilities that reduce risk for astronauts to land on the Moon during Artemis IV and V in 2028.
To support upcoming testing at Stennis, NASA will provide the engineers, equipment, and building services needed to design, build, and install parts that will prepare the B-2 for second stage testing of the rocket named in honor of the late NASA astronaut John Glenn, the first American to orbit Earth. The rocket’s second stage is powered by two BE‑3 engines that use liquid oxygen and liquid hydrogen propellants, with each engine generating 200,000 pounds of thrust in vacuum.
In addition to providing hands‑on technical support, NASA also will assist Blue Origin’s test operations by providing dedicated workspace and sharing agency expertise and lessons learned from propulsion testing conducted at the test stand.
Blue Origin will work toward second stage rocket testing on a stand with a history of testing rocket stages for Moon missions dating back to the 1960s. The agency constructed the stand to test the Saturn V rocket stages that carried humans to the Moon during the Apollo Program. More recently, NASA conducted a Green Run test series of the SLS core stage on the stand before the Artemis I test flight.
For more information about NASA’s Artemis program, visit:
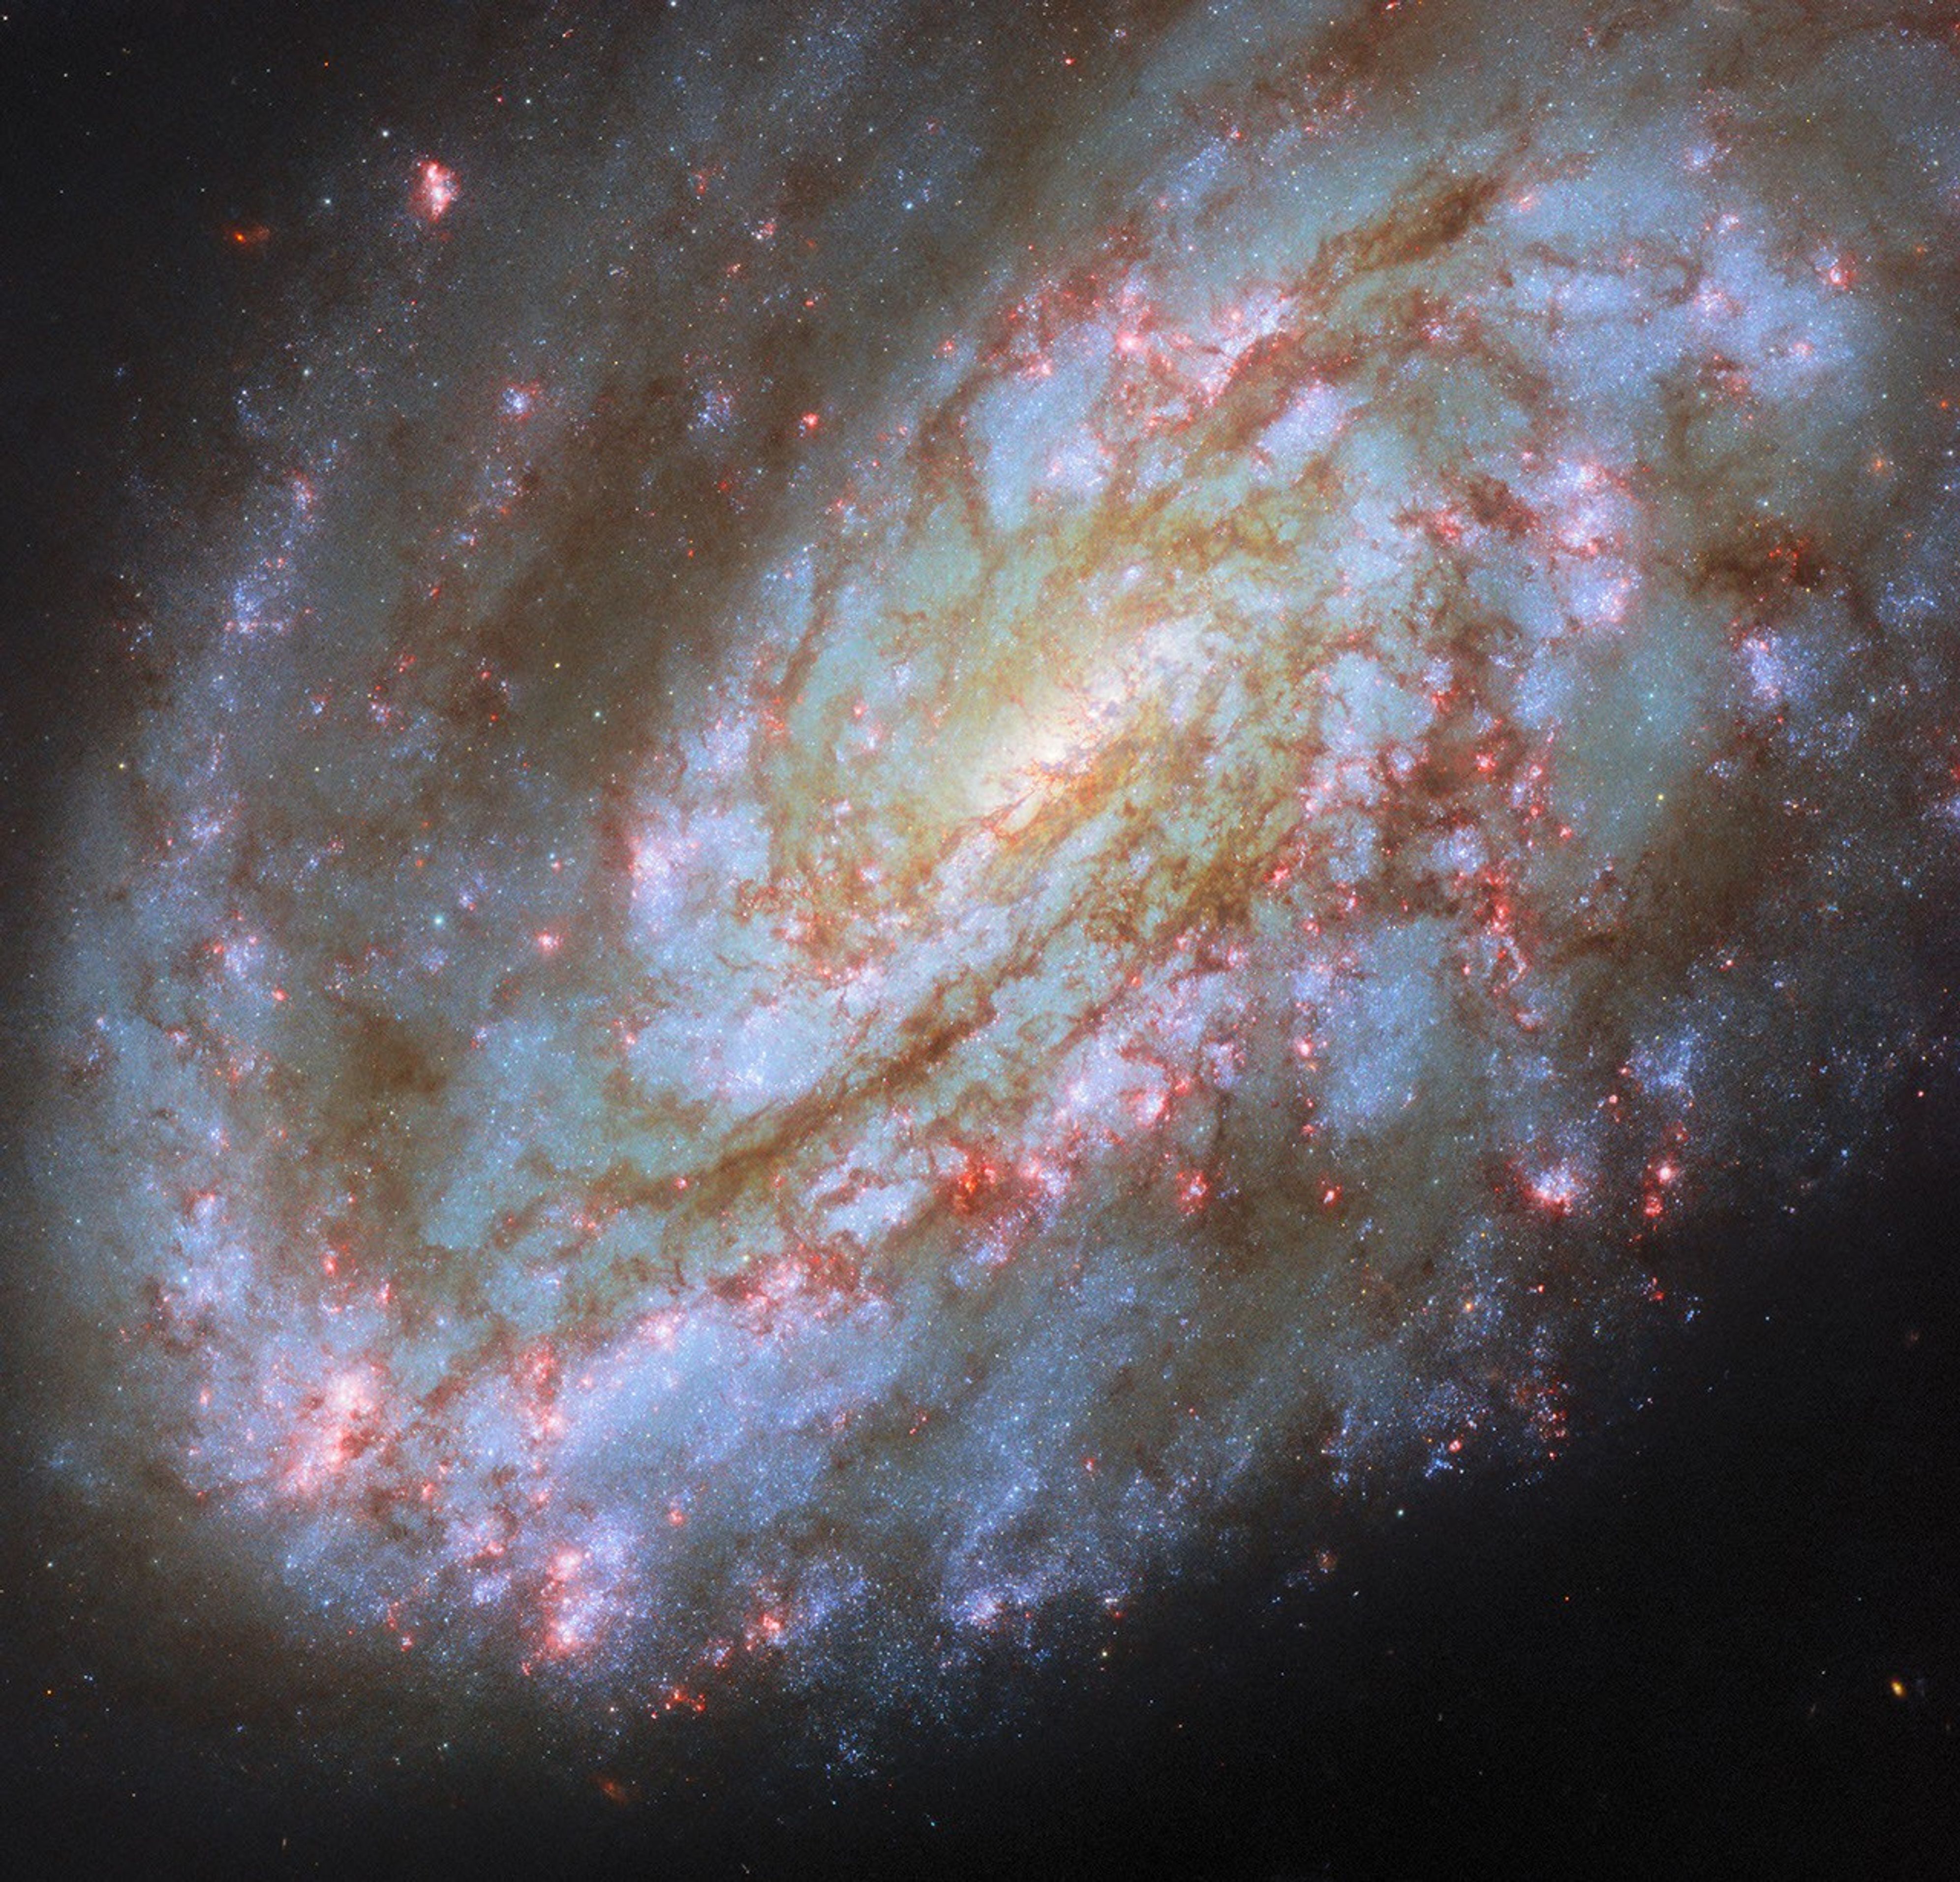
This NASA/ESA Hubble Space Telescope image features the spiral galaxy NGC 4654, located 72 million light-years away in the constellation Virgo (the Maiden).
NASA, ESA/Hubble, D. Thilker, J. Lee, and the PHANGS-HST Team
The subject of this NASA/ESA Hubble Space Telescope image is a spiral galaxy struggling against titanic forces that appear on galactic scales in space. This is NGC 4654, an intermediate spiral galaxy in the constellation Virgo (the Maiden). It is classified as an “intermediate” because its overall shape lies between spiral galaxies that have a bar across their centers and those that don’t. NGC 4654 has a weak bar structure at its center and is located 72 million light-years from Earth in the Virgo Cluster, a particularly massive and populous galaxy cluster.
NGC 4654 is particularly asymmetric, with a rounded and clearly-defined edge on one side and a long tail of gas stretching out from the opposite side — outside the field of view captured in this image. This gaseous tail is the result of ram pressure stripping, a force that galaxies can experience as they plow through space. NGC 4654 moves with such high velocity that it sweeps up and rams through the hot, rarefied gas filling the space between the Virgo Cluster’s galaxies. This intracluster medium in turn exerts a “ram pressure” on the galaxy, compressing the galaxy’s leading edge and dragging its gas behind the galaxy, creating the elongated tail.
It’s not just the galaxy’s gas that is unevenly distributed: its stars are too, and this is more unusual for a spiral galaxy. While the spiral arm on its leading edge is rich with stars and gas, the opposite arm noticeably lacks stars, influencing the galaxy’s lopsided spiral shape. Astronomers think that ram pressure alone is unlikely to cause this effect. Rather, NGC 4654 was also subjected to the gravitational force of fellow Virgo Cluster galaxy NGC 4639. While the two galaxies are far apart now, it’s thought that a fly-by interaction between them around 500 million years ago ripped away NGC 4654’s gas along one side, limiting star formation there and creating the asymmetry in its shape.
Many galaxies that undergo ram pressure stripping suffer reduced star formation rates as the cold gas that collapses to form their stars is pulled away and lost. NGC 4654, however, is still forming nearly two Suns’ worth of stars every year, a rate comparable to other galaxies of similar size. The active star formation is visible in the latest Hubble data included in this image. The data picks up on a wavelength of red light emitted by the clouds of energized gas where newborn stars lurk. The bright pink bubbles that appear across NGC 4654 — from its forward spiral arm, to around its weak bar, and out to the edge of its disk — are areas where these newborn stars shine.
The data used in this image came from two observing programs (#15654, #17502) that aim to link the gas in galaxies with star formation. By observing many prominent galaxies in the vicinity of our own, researchers hope to better understand how gas moves in galaxies, where and when it collapses to form stars and star clusters, and what effect those new stars have on the gas around them.
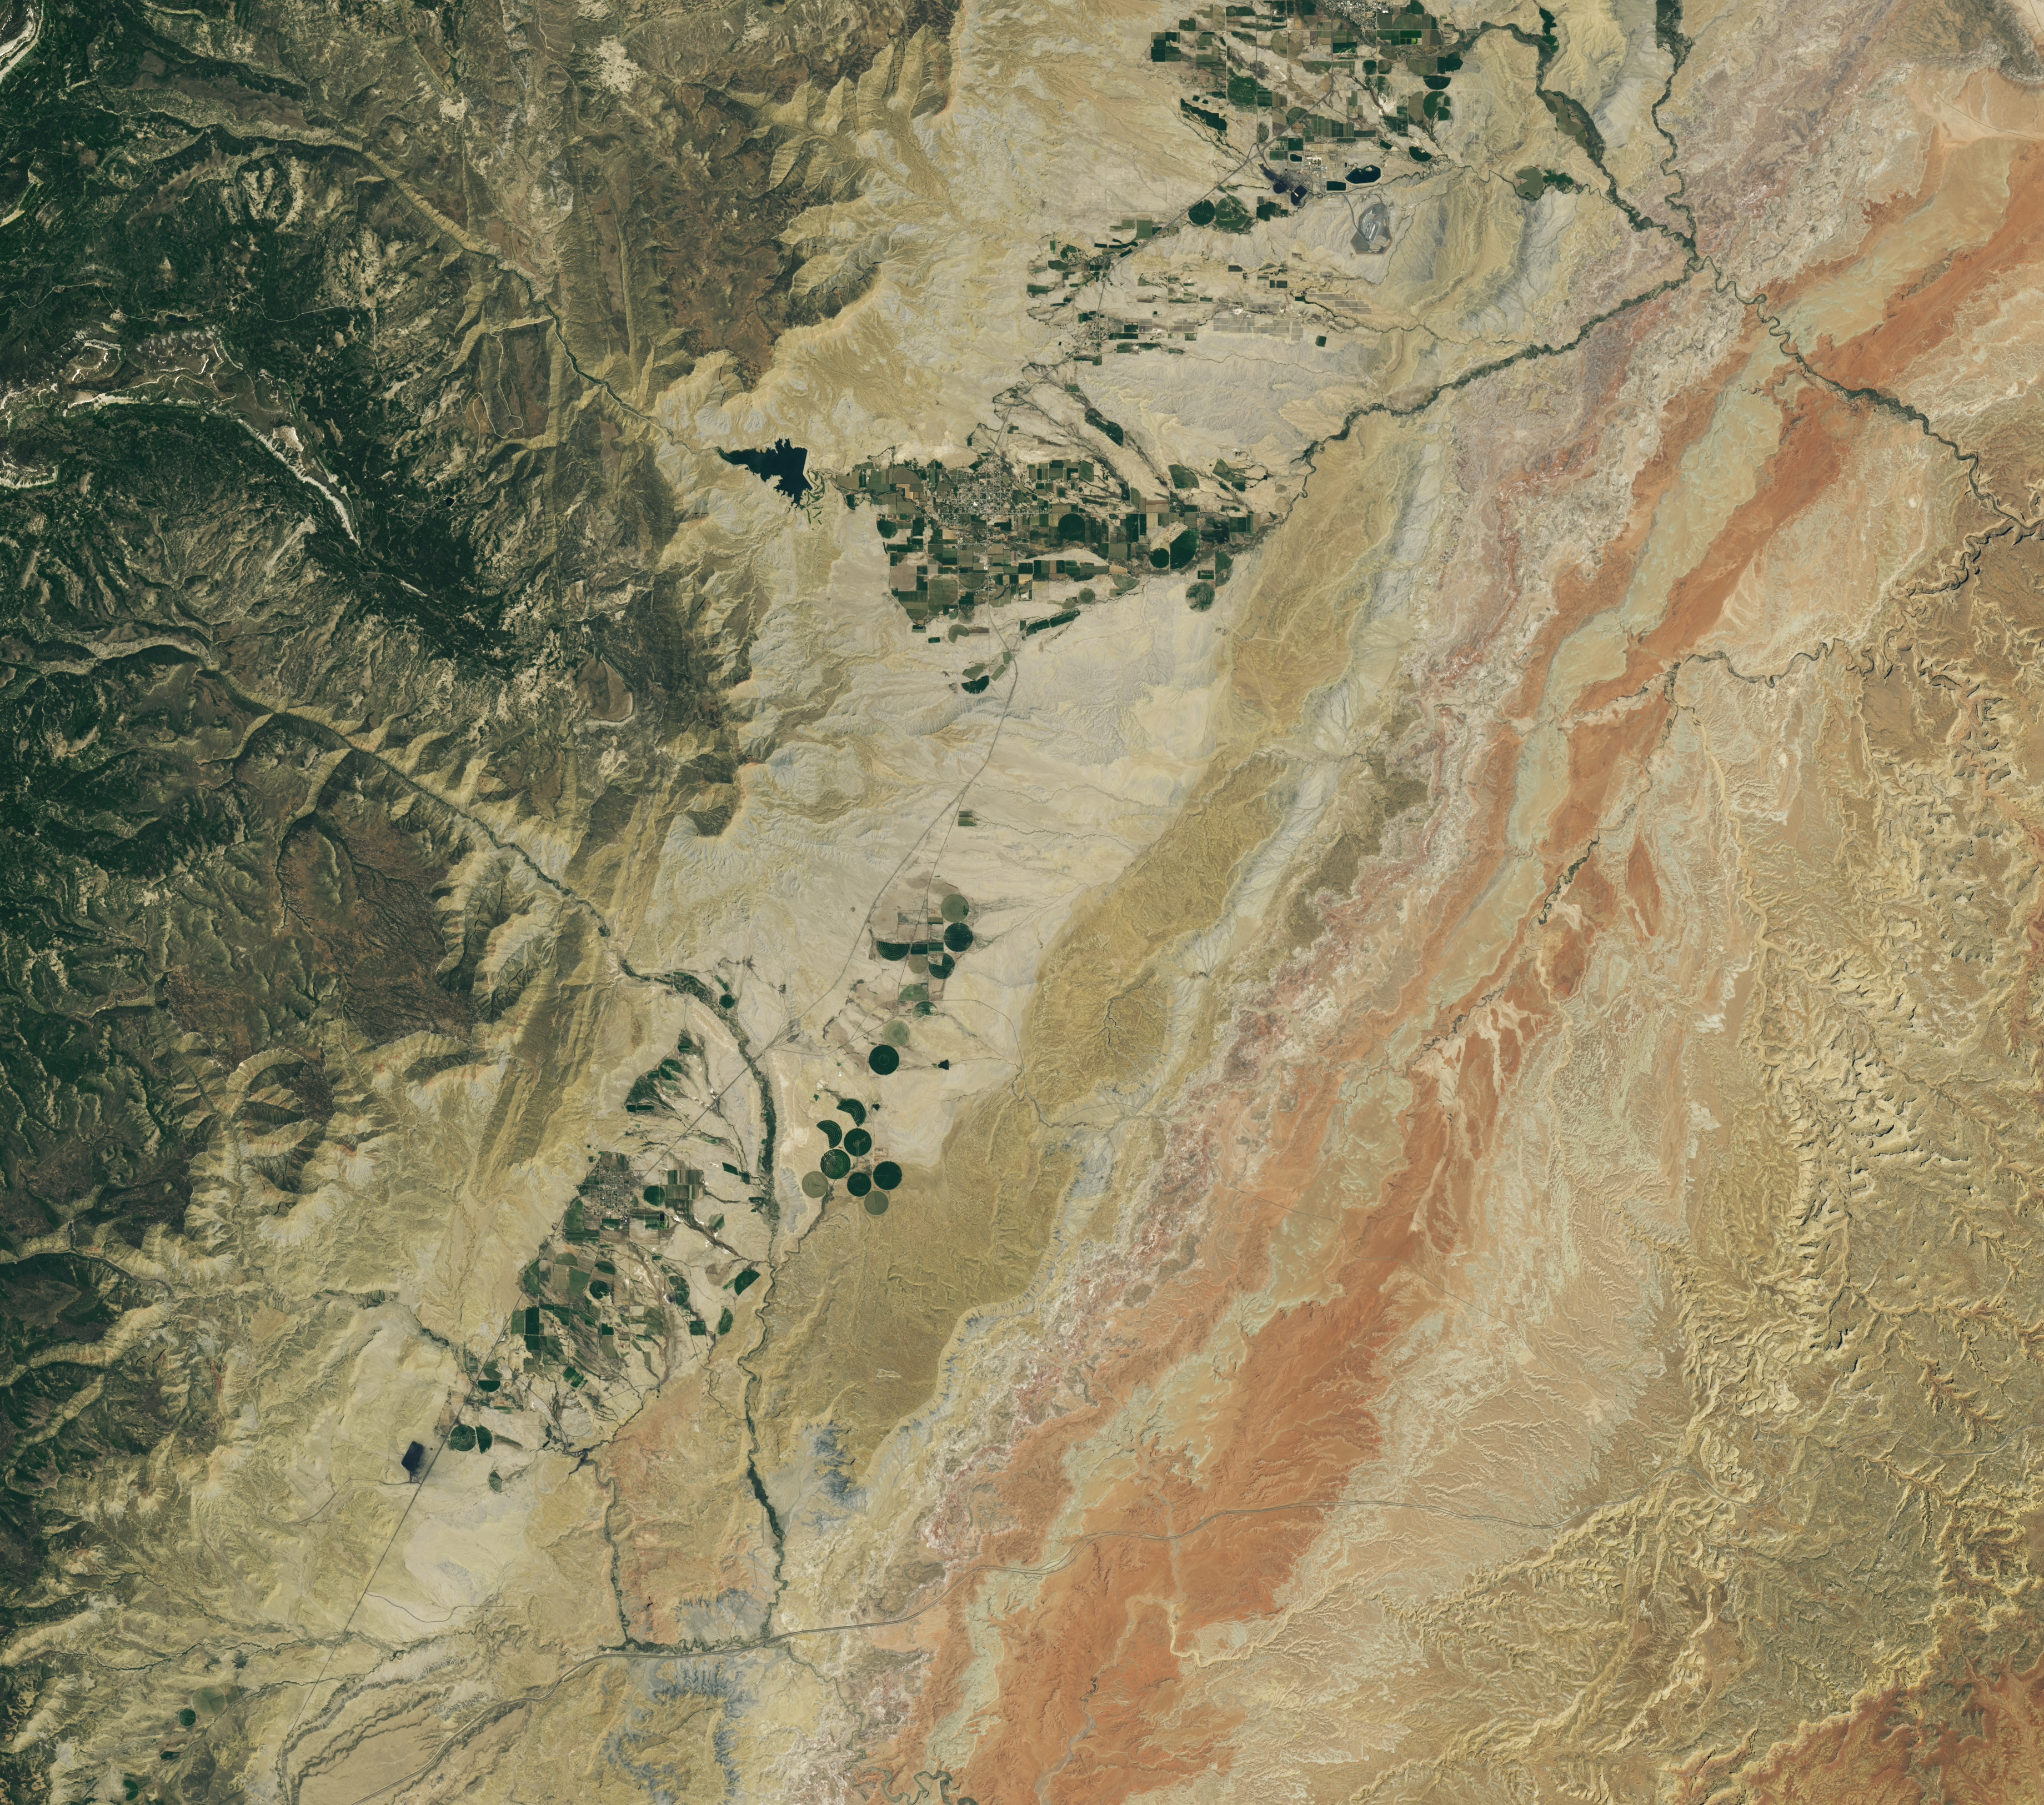
A dry, tan-colored valley containing a few circular irrigated fields runs roughly north-south through the image.
NASA Earth Observatory / Lauren Dauphin
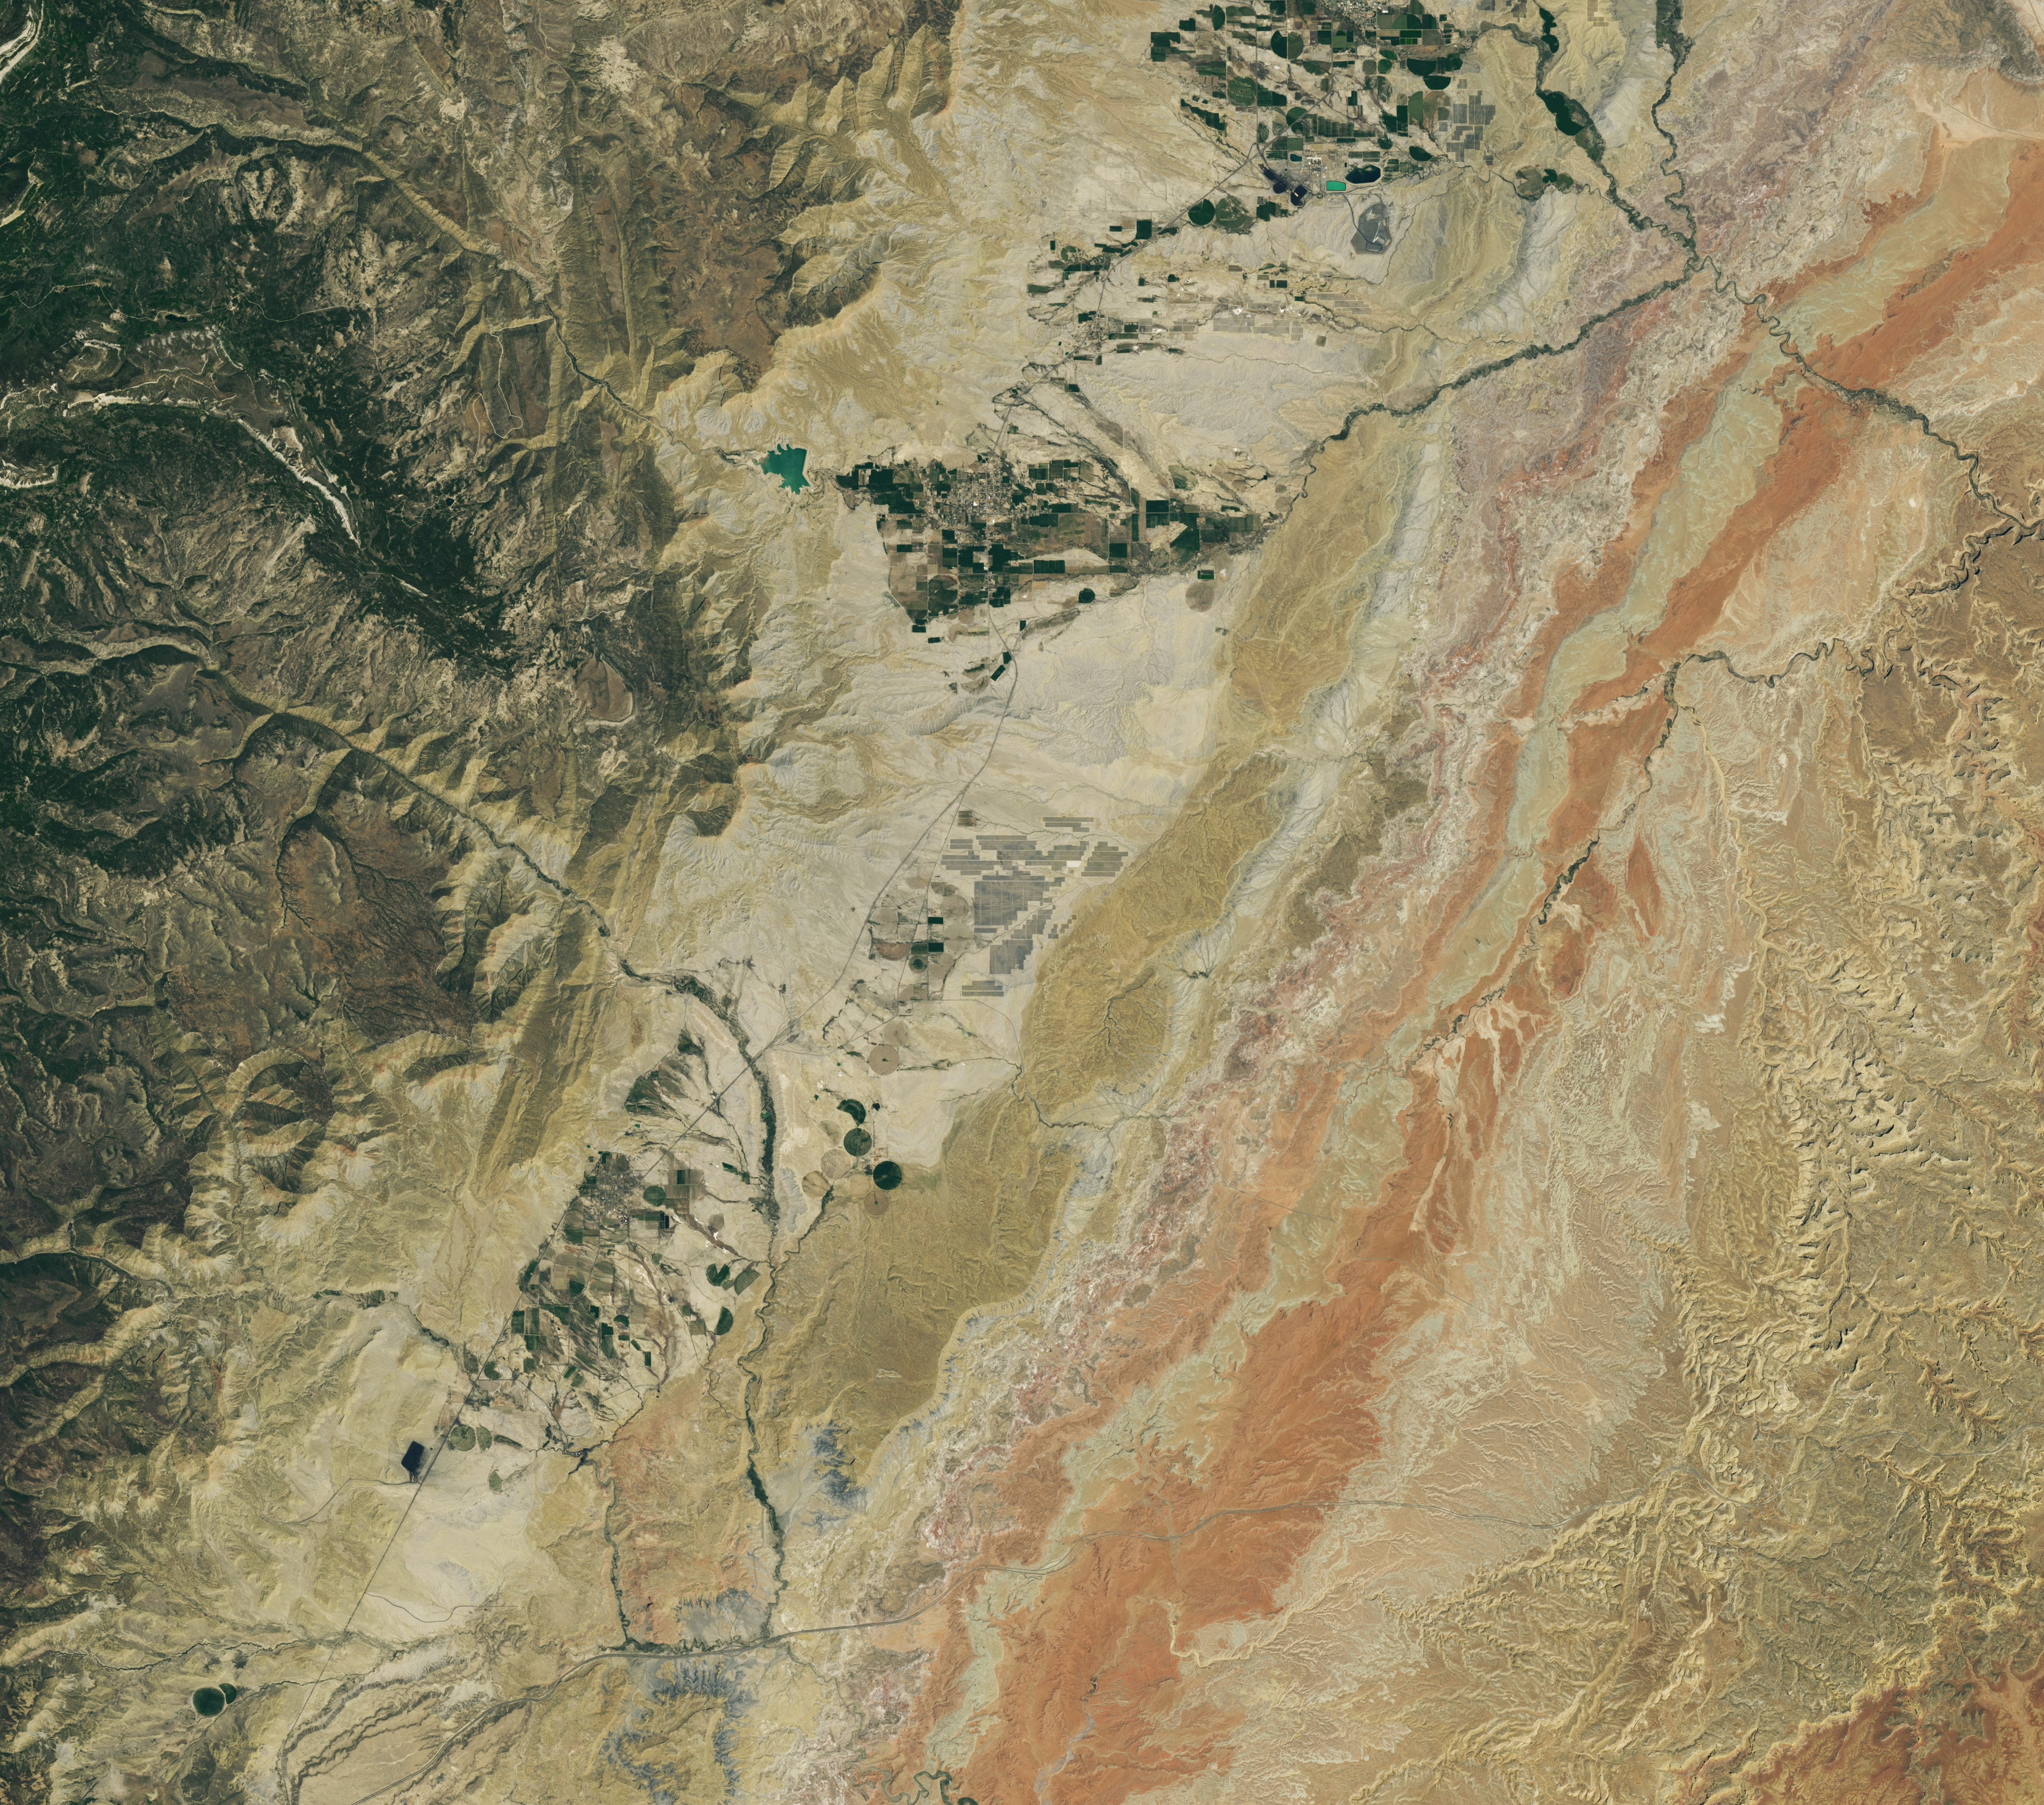
Grid-like arrays of solar panels cover parts of a valley floor in a brown, dry-looking area of Utah.
NASA Earth Observatory / Lauren Dauphin
A dry, tan-colored valley containing a few circular irrigated fields runs roughly north-south through the image.
NASA Earth Observatory / Lauren Dauphin
Grid-like arrays of solar panels cover parts of a valley floor in a brown, dry-looking area of Utah.
NASA Earth Observatory / Lauren Dauphin
June 16, 2024
June 6, 2026
The nearly one million photovoltaic panels of a solar energy and battery storage facility in Utah appear in the right image, acquired with the OLI (Operational Land Imager) on Landsat 8 on June 6, 2026. The same sensor captured the left image on June 16, 2024. NASA Earth Observatory images by Lauren Dauphin.
Historically, central Utah’s Castle Valley has been a coal hub, with mining operations on the slopes of the Wasatch Plateau to the west active since the late 1800s. A different energy development arrived in the region in June 2026, when a large solar power and battery storage plant came online in the sunny valley about 130 miles (210 kilometers) southeast of Salt Lake City.
The recently constructed Green River Energy Center, seen in the Landsat 8 image above (right), features nearly one million solar panels and roughly 500 batteries on several square miles of previously undeveloped land. The facility has 400 megawatts of solar-generating capacity with another 400 megawatts of battery storage. That places it among the many utility-scale solar power and battery storage projects that the U.S. Energy Information Administration expects to be plugged into the country’s grid in 2026.
The Utah facility is slated to supply power to Salt Lake City and other areas across the state, according to news reports, and project staff estimate it could produce enough electricity for more than 100,000 homes. With its integrated battery storage, the plant has the potential to generate power at all hours, even when the Sun isn’t shining. And the Green River Energy Center can build on Castle Valley’s energy legacy by utilizing existing transmission lines originally built for coal-fired power plants in the area.
Though Utah adopted coal as its state rock and has long relied on it for energy, other sources, such as solar and geothermal, are becoming larger parts of the state’s energy mix. In 2025, coal fueled about half of the state’s electricity generation, down from about 75 percent in 2015. Meanwhile, solar grew to account for about 14 percent of generation in 2025, up from nearly zero a decade before. Satellite data can be useful to planners and policymakers involved in energy transitions for assessing the potential of renewable energy systems and tracking their adoption and performance.
NASA Earth Observatory images by Lauren Dauphin, using Landsat data from the U.S. Geological Survey. Story by Lindsey Doermann.
Curiosity Blog, Sols 4954–4960: Celebrating Our Rover Engineers Past and Present
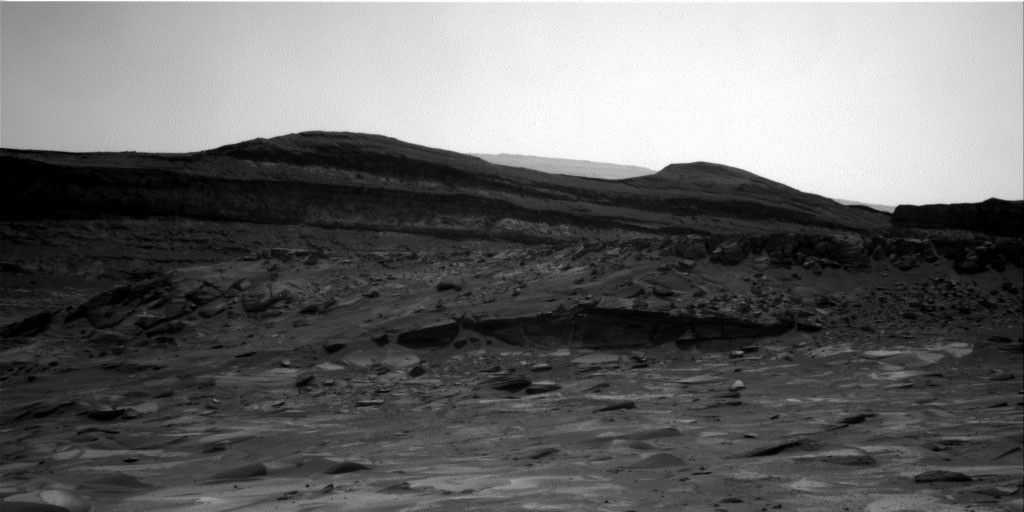
In this image acquired by NASA’s Mars rover Curiosity, the relatively light-toned bedrock in the foreground gives way to darker-toned rocks in the middle of the image, along what could be an erosional surface. Curiosity acquired the image using its Right Navigation Camera on July 15, 2026 — Sol 4955, or Martian day 4,955 of the Mars Science Laboratory mission — at 05:51:59 UTC.
NASA/JPL-Caltech
Written by Lucy Thompson, Senior Research Scientist, University of New Brunswick, Canada
Earth planning date: Friday, July 27, 2026
As an APXS uplink lead and strategic planner, I have the privilege of working with the rover engineers most days that I am on operations. The APXS instrument measures the chemistry of rocks, unconsolidated materials and the atmosphere, and is situated on the end of Curiosity’s robotic arm. This means that any target of interest that we wish to analyze has to be safe to deploy the arm, APXS, and MAHLI (the closeup imager) to. We therefore rely on the rover engineers for their assessment and to sequence the arm moves to place us safely on the targets. Recently, our workspaces have been dusty with varied relief, but the rover engineers have successfully found areas that they have been able to brush and deploy APXS and MAHLI. This week was no exception, despite some of our workspaces appearing less than ideal upon initial observation. The team managed to find rock targets of interest (x5), which the rover engineers were able to safely place the arm on and brush so that we could analyze them with APXS and MAHLI. This ensures that we acquire high-quality compositional data and images as we continue our ascent of Mount Sharp, through rock layers of varying tone and texture, tracking potential changes in chemistry, and the depositional and alteration environment.
The rover engineers are also responsible for safely driving Curiosity to the areas of interest identified by the science team. They must assess the terrain for potential hazards such as large resistant blocks that could damage the rover wheels, sand/soil patches where we could get stuck, and high slopes that the rover could slip on. Despite unexpected damage to the wheels early in the mission and getting a little bogged down in some soil/sand just as we started to climb Mount Sharp, the engineers have successfully navigated us safely along more than 23 miles (37 kilometers) of drive distance and more than 4,400 feet (about 1.35 kilometers) of elevation gain. We recently requested to drive to specific locations in order to image what the team thinks could be an erosional surface within the Mg-sulfate/carbonate-bearing unit (see the image accompanying this post). Of course, the engineers were able to accommodate our desires, with the first stop crossed off in Monday’s plan, and the drive that is being planned this weekend taking us toward the next stop.
The rover engineers also ensure that our drilling activities execute safely and successfully, and are responsible for sequencing the arm motion required to deliver the drilled samples to our internal CheMin and SAM instruments. This required completely reconfiguring how we drill after a motor failed back in 2016, with extensive behind-the-scenes work at JPL for nearly a year and a half before we resumed. Curiosity has since drilled more than 20 rock targets.
So, thanks to the rover engineers and all the engineers and scientists on Curiosity’s team, we have had another full week of activities at Gale crater. We continue to track the chemistry, textures, tone and sedimentary structures of the sulfate/carbonate unit as we climb Mount Sharp and get ever closer to the Yardang unit with APXS, ChemCam, MAHLI and Mastcam. Curiosity continues to also monitor the local environment within Gale and the atmosphere in general.
Continuing agency efforts to bring space closer to home, NASA+ is heading to more streaming platforms. On Thursday, NASA announced its programming is on Fire TV Channels. Fire TV customers can easily access this content by asking Alexa+ on compatible devices.
Future programming on Fire TV may include science mission launches, a test flight for rendezvous and docking with human landing systems, robotic lunar deliveries, the first crewed mission to the Moon under Artemis, and more. As always, NASA+ also remains available for free, with no ads, through the NASA app and on the agency’s website.
“The National Aeronautics and Space Act of 1958 calls on us to share our story of space exploration with the broadest possible audience, and our streaming partners help us accomplish that,” said Rebecca Sirmons, general manager of NASA+ at the agency’s Headquarters in Washington. “Artemis II captured the hearts and minds of viewers globally, inspiring the Artemis generation. As we work toward building humanity’s first Moon Base, we will continue to provide transparent, engaging content coverage every step of the way.”
Earlier this year during its Ignition event, NASA shared plans for a bold path forward for the agency, including increasing its cadence of Artemis missions to the lunar surface, and building the first Moon Base, among other agency priorities. This distribution partnership is another step in executing NASA’s promise to the public for a greater look into the agency, making mission and educational content available on multiple devices for viewers on their preferred channels.
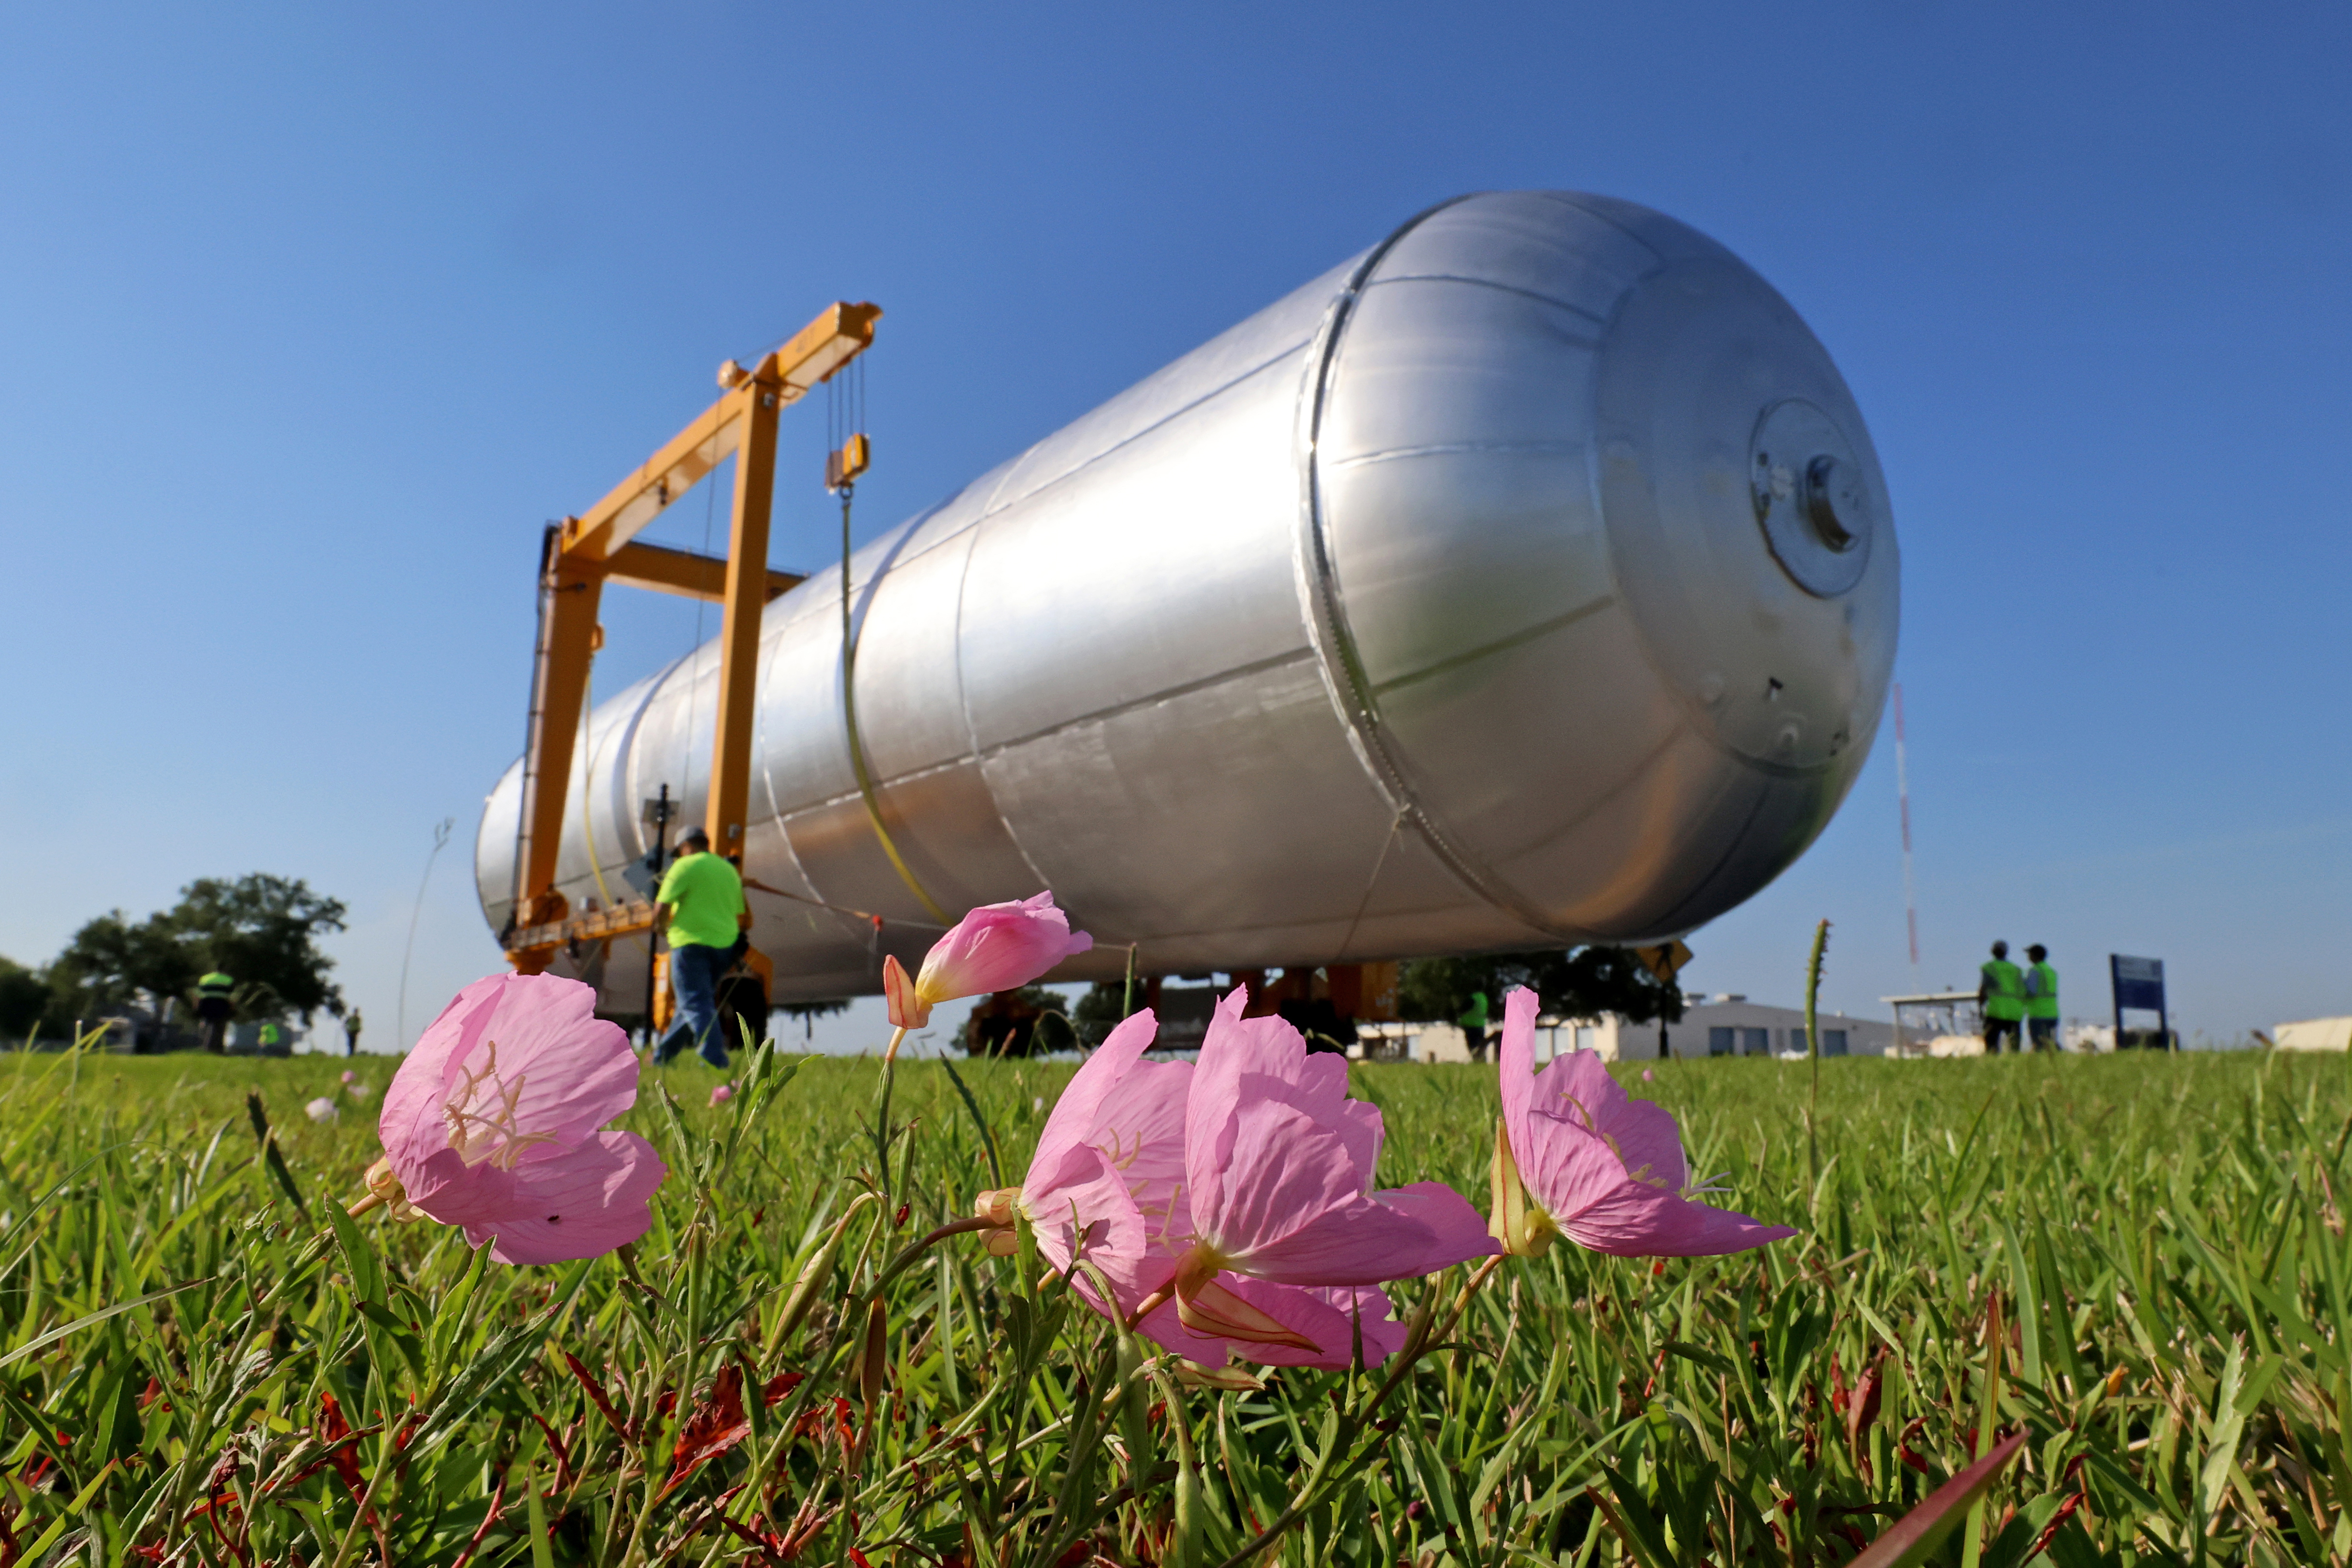
Crews at NASA’s Michoud Assembly Facility in New Orleans transport the 130-foot-tall Artemis IV liquid hydrogen tank out of a production cell inside the main factory building into a detached test building on a separate portion of the 829-acre site on May 15, 2026. The liquid hydrogen tank will form part of the core stage for the SLS (Space Launch System) rocket, providing thousands of gallons of super-cold propellant to one of four RS-25 engines.
This illustration depicts charged particles from a solar storm stripping away charged particles of Mars’ atmosphere, one of the processes of Martian atmosphere loss studied by NASA’s MAVEN mission.
NASA/GSFC
NASA MAVEN (Mars Atmosphere and Volatile Evolution) mission scientists have uncovered a key puzzle piece in understanding certain types of auroras on Mars, finding that they form in a similar way to Earth-based auroras.
Results published Thursday in Nature Communications show the same mechanism that circulates and catapults charged particles into Earth’s atmosphere is happening at Mars on much smaller scales because of differences in the two planets’ magnetic fields.
The MAVEN spacecraft, in orbit around Mars, experienced a loss of signal with ground stations on Earth on Dec. 6, 2025. On June 3, NASA declared the mission had concluded after finding the spacecraft to be unrecoverable. However, data from the mission is still being used to inform NASA science and future missions to Mars.
When the Sun’s magnetic field lines get close to Earth’s magnetosphere, the large magnetic bubble protecting the planet, they can reconnect and inject energy and mass throughout Earth’s magnetosphere and magnetotail, ultimately firing electrons back into the atmosphere to generate Earth’s auroras. This process, called the Dungey cycle, drives electrical currents, accelerates charged particles that create auroras, and controls the circulation of plasma in Earth’s magnetosphere and ionosphere.
This new study shows that a miniature version of the Dungey cycle is happening over Mars’ strong crustal magnetic fields, which gives scientists a better look into the physics of Martian auroras.
“We knew that magnetic reconnection was happening at Mars but did not expect it to be like the Dungey cycle,” said Shaosui Xu, lead author of the study and associate research physicist at the Space Sciences Laboratory at the University of California, Berkeley.
Mars does not have a global magnetic field like Earth. Earth’s magnetic field is created by our planet’s churning core, while Mars has numerous miniature magnetospheres that arise from intensely magnetized crust scattered around the planet. These regions were formed around 4 billion years ago when lava cooled in the presence of Mars’ ancient global magnetic field, which has since disappeared due to intense solar wind stripping the planet’s atmosphere.
The MAVEN mission has observed highly localized auroras over these crustal fields, similar to Earth’s auroras at the poles, but it wasn’t until now that scientists could fully understand the physics of how they form. The study used several instruments aboard the MAVEN spacecraft to build up a picture of the Dungey-like behavior: the Magnetometer and Solar Wind Electron Analyzer instruments, which were used to determine the magnetic configuration and derive electrical currents, and the STATIC (Suprathermal and Thermal Ion Composition) instrument, which was used to measure plasma flows in the ionosphere.
“We really pushed the limit of STATIC to get the data we needed,” said Xu. “It was the final piece to the puzzle in understanding these localized auroras.”
The realization that a Dungey-like cycle was happening within these crustal magnetic fields answered the question of how the electrons were being energized to create the auroras. It also shows that a Dungey-like mechanism can happen on both large and small scales, giving more insight into where in the solar system this process could be taking place.
“This is a remarkable result that changes how we think of Martian auroras and is another important step toward understanding why Mars and Earth have evolved so differently despite being governed by the same underlying physics.” said Shannon Curry, MAVEN’s principal investigator and a research scientist at the Laboratory for Atmospheric and Space Physics at the University of Colorado Boulder. “I am incredibly proud of our team’s work on this discovery and excited to uncover new insights into the Red Planet and its evolution.”
By finding out more about this process, scientists also are gaining a better understanding of how the solar environment interacts with the Red Planet as a whole, which is essential for future robotic and crewed missions.
“I remember in graduate school discussing with my advisor how the cycling of crustal magnetic fields could work at Mars,” said Xu. “It’s incredible to be part of the team that found the answer to that question.”
The MAVEN mission is part of NASA’s Mars Exploration Program portfolio. The mission’s principal investigator is based at the Laboratory for Atmospheric and Space Physics at the University of Colorado Boulder, which also is responsible for managing science operations and public outreach and communications. NASA’s Goddard Space Flight Center in Greenbelt, Maryland, manages the MAVEN mission. Lockheed Martin Space built the spacecraft and is responsible for mission operations. NASA’s Jet Propulsion Laboratory in Southern California provides navigation and Deep Space Network support.
For more information on NASA’s MAVEN mission, visit:

 Login