❌

Normal view

Astronomers Finally Find Milky Way’s Missing Black Hole Wind

8 June 2026 at 18:42
This image shows the evidence for the wind blowing away from Sagittarius A*: the white dot in the center of the image shows the supermassive black hole; in orange is data from ALMA, mapping the location of cold gas composed of carbon monoxide in the image; in blue is X-ray data from Chandra; a large cone-shaped cavity, visible as an absence of cold gas in the ALMA data, is filled by hot X-ray-emitting gas in the Chandra data. Image credit: NASA / CXC / UMass / Wang et al. / ALMA / ESO / NAOJ / NRAO / Longmore et al. / Minniti et al.

After a 50-year search, astronomers have uncovered evidence that Sagittarius A* -- the 4.3-million-solar-mass black hole that resides at the center of our Milky Way Galaxy -- is blowing a hot cosmic wind into its surroundings, carving out a giant cavity near the Galaxy’s heart.

The post Astronomers Finally Find Milky Way’s Missing Black Hole Wind appeared first on Sci.News: Breaking Science News.

Black Hole Baby Photos: JWST and Chandra Observe M31-2014-DS1

4 March 2026 at 17:00

illustration of M31-2014-DS1

One of the most luminous supergiant stars in the Andromeda Galaxy, M31-2014-DS1, has disappeared, potentially leaving behind a black hole shrouded in dusty gas. What do new infrared and X-ray observations tell us about this event?

Failure to Explode?

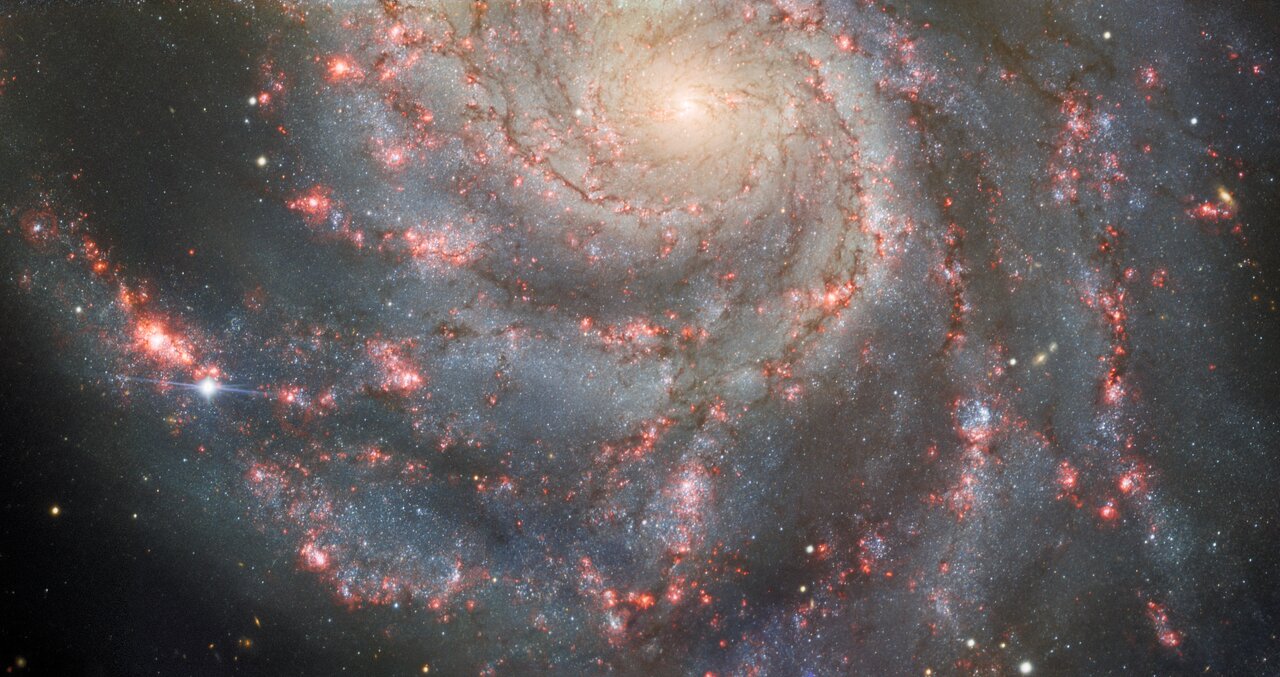
SN 2023ixf in Messier 101

This image from Gemini North shows the supernova SN 2023ixf along one of the spiral arms of Messier 101. Though less showy than core-collapse supernovae, “failed” supernovae may be another way to form stellar-mass black holes. [International Gemini Observatory/NOIRLab/NSF/AURA; CC BY 4.0]

Massive stars are famous for going out with a bang. After swelling into supergiants, these stars bring their brief lives to a close in a cosmic fireworks show: a supernova explosion that creates a neutron star or a black hole.

But a splashy supernova explosion may not be the only way for a massive star to go out. As observations have begun to suggest, some massive stars may — for reasons not yet fully understood — quietly collapse in upon themselves, going out with a whimper rather than a bang. Though less spectacular and far harder to spot, these “failed” supernovae highlight a possible pathway for the formation of stellar-mass black holes.

A Newborn Black Hole in a Dense, Dusty Blanket

Just last month, researchers reported their discovery of a potential failed supernova. The supergiant M31-2014-DS1 suddenly brightened in 2014 before fading to obscurity, leading researchers to suspect that the star had experienced a failed supernova and created a black hole. The event shared similarities with another failed supernova candidate, NGC6946-BH1.

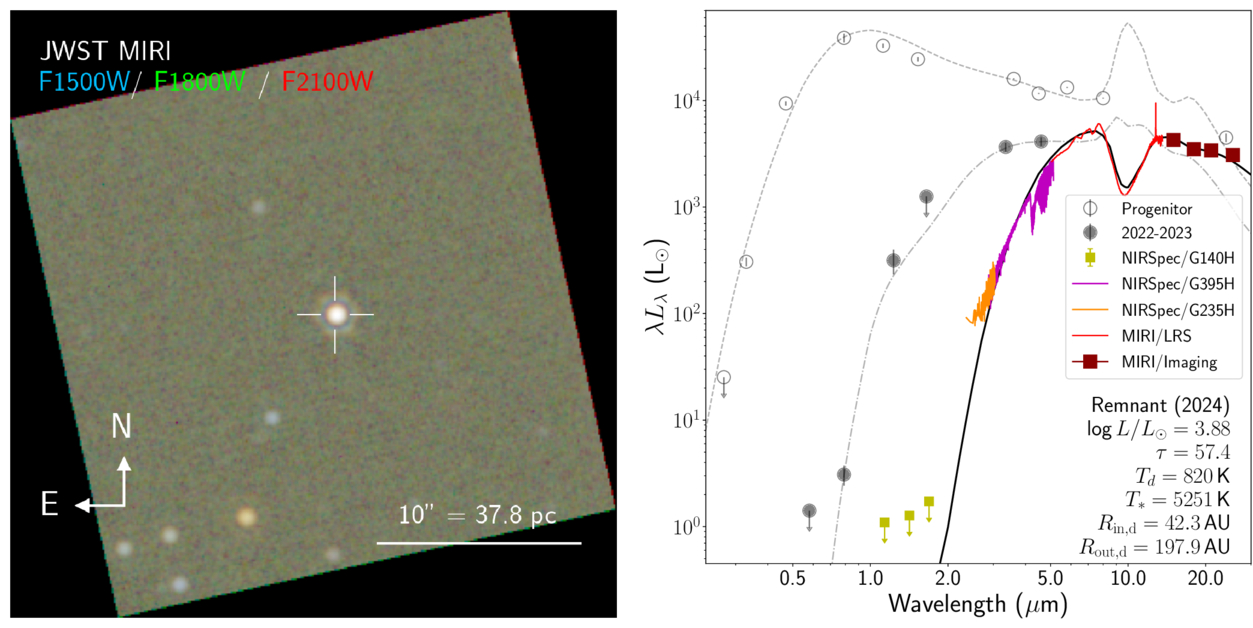
JWST data of M31-2014-DS 1

Left: A JWST image of M31-2014-DS 1. Right: Spectral energy distributions of the progenitor star/the remnant using data from 2005 to 2012 (empty circles), 2022 to 2023 (filled circles), and 2024 (colored lines). Click to enlarge. [De et al. 2026]

In a new article published in the Astrophysical Journal Letters, Kishalay De (Columbia University; Flatiron Institute) and coauthors have used JWST and the Chandra X-ray Observatory to learn more about what remained after M31-2014-DS1 disappeared. The JWST observations show an extremely red object that has faded considerably in just a few years, with a deep absorption feature from silicate dust and numerous narrow molecular absorption lines. Chandra did not detect any X-rays.

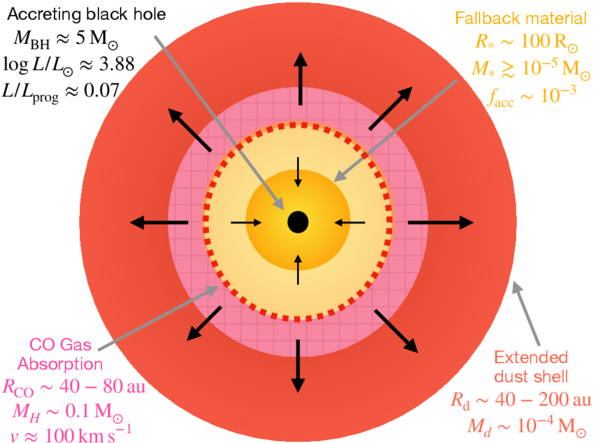
Together, these observations support a model in which the collapsing star ejected its outer layers in a relatively low-energy event (somewhere in the broad ballpark of one hundred-millionth to one ten-thousandth the energy of a typical core-collapse supernova) and formed a black hole. Some of the ejected material fell backward and fed the newborn black hole, while the remainder created a dense blanket that blocked the light from the accreting black hole from view.

Continued Evolution

schematic of the gas surrounding a newborn black hole

Cartoon showing the authors’ model and the model parameters inferred from the observations. Click to enlarge. [De et al. 2026]

In observations from 2024, the source had faded to just 7% of the progenitor star’s luminosity, supporting the conclusion that the star has disappeared and what lies beneath the dusty ejecta is a black hole. De’s team expects that as time goes on, the gas that obscures the accretion-powered luminosity of the newborn black hole will expand and become less dense along our line of sight. At some point — estimated to be no sooner than about 27 years from now — the X-ray emission from the accreting black hole should pierce the dusty shroud and become visible to sensitive X-ray observatories. In the infrared, JWST will be able to track the source’s evolution caused by continued dust creation in the expanding shell.

Thanks to its location in a neighboring galaxy, M31-2014-DS1 has granted astronomers a front-row seat to a poorly understood pathway for black hole formation. Going forward, we can expect further insights into M31-2014-DS1 and, hopefully, the discovery of many more sources like it.

Citation

“Fading into Darkness: A Weak Mass Ejection and Low-Efficiency Fallback Accompanying Black Hole Formation in M31-2014-DS1,” Kishalay De et al 2026 ApJL 999 L25. doi:10.3847/2041-8213/ae468d

The post Black Hole Baby Photos: JWST and Chandra Observe M31-2014-DS1 appeared first on AAS Nova.

Chandra Spies a Supernova Shock Front Speeding Along

7 November 2025 at 17:00

Supernova remnant N132D

Beautiful bubbles of hot ionized gas, supernova remnants trace the dying days of massive stars. A recent study uses the Chandra X-ray Observatory to detail the motion and understand the origins of one supernova remnant.

Retracing Supernova Remnants

Massive stars, about 8 solar masses or larger, will end their short lives in violent core-collapse supernovae. These explosions barrel into any surrounding interstellar medium, carving out low-density cavities and blowing material outward. Appearing as a bubble or shell of hot gas, a supernova remnant carries the signatures of the type of star that produced it and the ways that star shaped its environment throughout its life. 

Nearby, in the Large Magellanic Cloud, is the 2,500-year-old supernova remnant N132D — the most X-ray luminous supernova remnant within the Local Group. Though N132D’s size, likely progenitor mass, and chemical composition are well constrained, astronomers have yet to nail down the velocity of the X-ray shock front — the outer edge of the supernova remnant that rams into the interstellar medium. This measurement is critical to understanding the local conditions the supernova first encountered and how its expansion will continue to impact the interstellar medium over time.

Chandra Observations of N132D

Determining the shock front velocity requires astronomers to focus on the thin outer edge of the soaring supernova remnant — how do we measure the motion of such a narrow strip of gas? X-ray spectroscopy of N132D yields a measurement from a single epoch of observations, but it cannot isolate the narrow shock front, making a reliable velocity measurement difficult to attain.

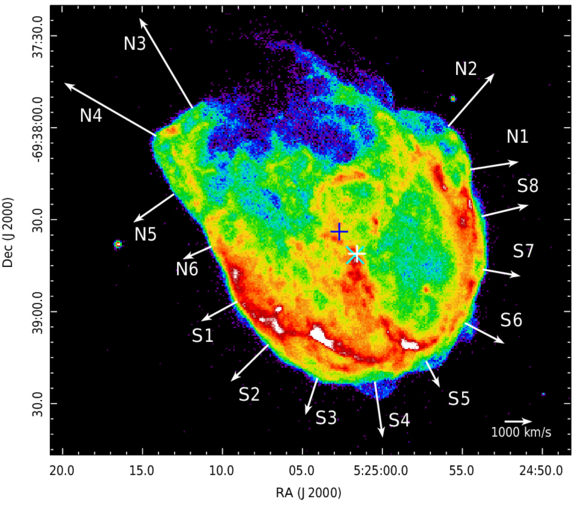
supernova remnant velocity

The expansion of supernova remnant N132D around the rim for each of the regions analyzed in this study. The arrow lengths are proportional to their estimated expansion velocities. Click to enlarge. [Long et al 2025]

Circumventing the challenges of spectral analyses, Xi Long (University of Hong Kong) and collaborators used two sets of X-ray observations of N132D from the Chandra X-ray Observatory taken about 14.5 years apart to measure the motion of the shock front across the sky over time. This measurement, known as proper motion, compares the location of the foreground supernova remnant to stationary background stars to estimate its angular speed. 

The authors focus on small regions on the very edge of the supernova shock front, six northern and eight southern, to carefully measure the motion of the shock between the two sets of observations. In separating the shock front into smaller regions, the authors can determine any variations in speed along the shock front. The southern edge of N132D moves with the same expansion rate of 1,620 km/s. The northern edge has an average expansion rate of 3,820 km/s, but its speed is more varied, which isn’t unexpected given its blown-out appearance.

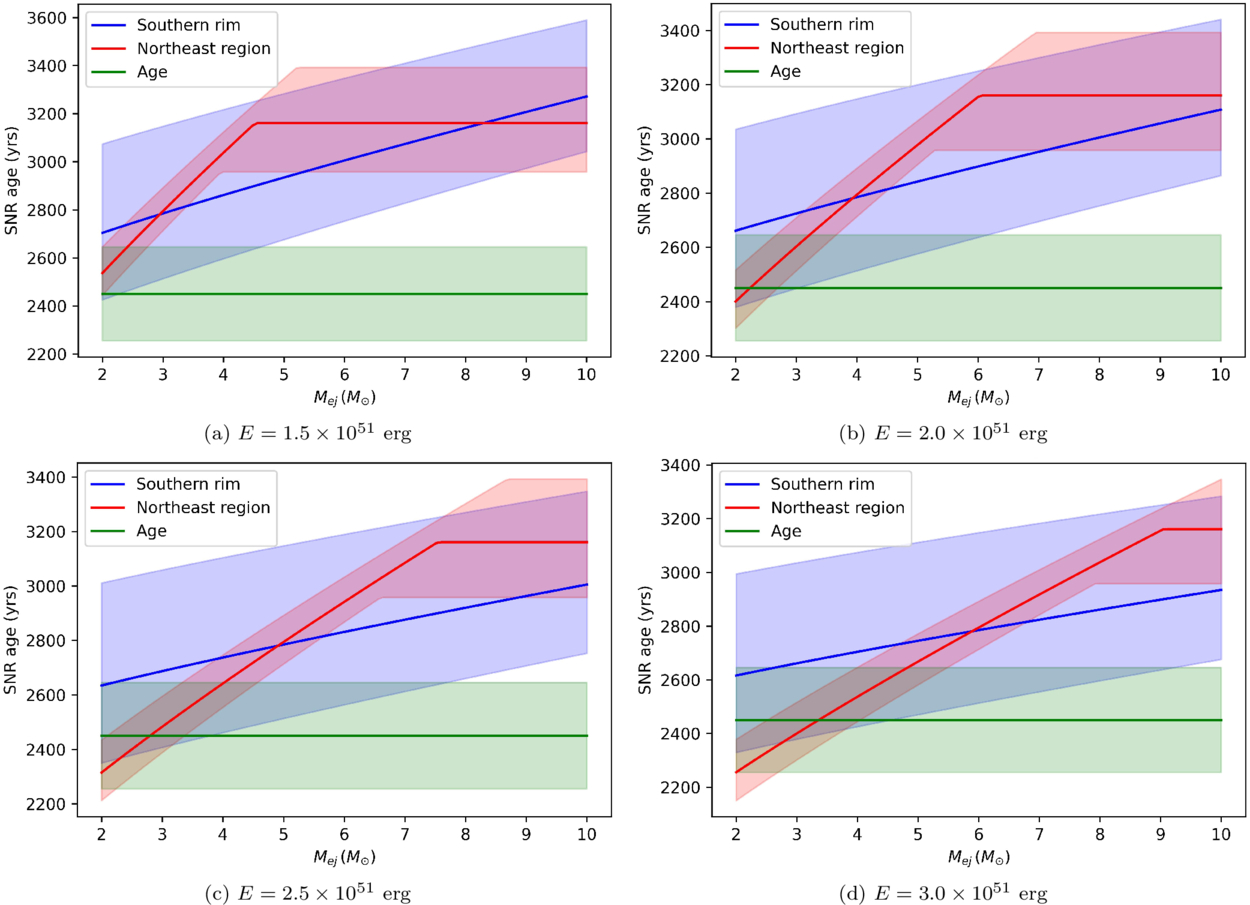
Modeling results showing the supernova age versus ejecta mass for the northern (red) and southern (blue) regions compared to the age estimate from an optical study of N132D. For the explosion energies and estimated ejecta masses between 2 and 6 solar masses, the models are consistent for all three. Click to enlarge. [Long et al 2025]

Comparing to Prior Studies

In addition to determining the velocity of the forward shock, the authors model the evolution of the supernova remnant to estimate the initial conditions of N132D including progenitor star mass, explosion energy, and ejecta mass. Their results agree with other studies that suggested N132D originated from a roughly 15-solar-mass star that exploded 2,500 years ago into a low-density cavity. 

This study showcases the unique ability of Chandra’s high-resolution instruments to carefully measure the evolution of supernova remnants, and further studies will continue to determine the detailed characteristics of supernova remnants across the Local Group.

Citation

“Chandra Large Project Observations of the Supernova Remnant N132D: Measuring the Expansion of the Forward Shock,” Xi Long et al 2025 ApJ 993 136. doi:10.3847/1538-4357/ae07c7

The post Chandra Spies a Supernova Shock Front Speeding Along appeared first on AAS Nova.

Get a Kick Out of This: Researchers Waited 15 Years to Measure a Neutron Star’s Journey

1 August 2025 at 17:00

Crab Nebula

With a measurement 15 years in the making, astronomers have pinned down the path of a neutron star launched by a collapsing star. This finding helps to explain how neutron stars are “kicked” into space by supernovae.

Just for Kicks

Crab Nebula pulsar

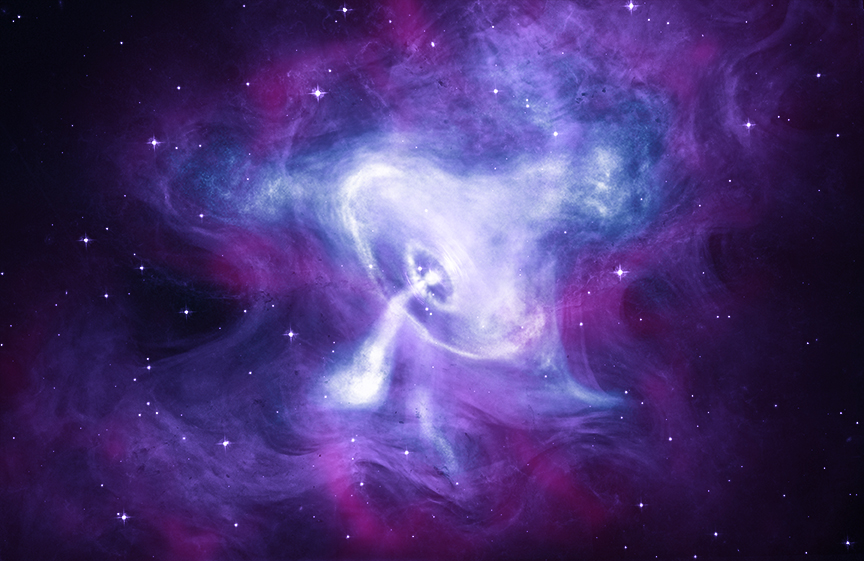
This multiwavelength image shows the pulsar — a type of neutron star — at the center of the Crab Nebula supernova remnant. [X-ray: NASA/CXC/SAO; Optical: NASA/STScI; Infrared: NASA-JPL-Caltech]

When massive stars reach the end of their lives, they expire in a final, fantastic cosmic display: a core-collapse supernova. These events can leave behind remnants called neutron stars, which are composed of highly compressed neutrons arranged in a sphere roughly as wide as the island of Manhattan is long.

Many neutron stars have been observed to zip through space at hundreds of kilometers per second, which suggests that these stars get a “kick” when they’re born in a supernova. However, the details of this kick are not yet clear. Are neutron stars launched into space in the opposite direction from the material ejected in the explosion, as some studies suggest? Or is the neutron star’s motion determined by the burst of neutrinos that carries off most of the supernova’s energy, as other studies hint?

Worth the Wait

To answer these questions, astronomers must compare the velocities of young neutron stars to the movement of their associated supernova remnants. In a recent research article, Tyler Holland-Ashford (NASA Goddard Space Flight Center) and collaborators measured the motion of the neutron star affiliated with the G18.9–1.1 supernova remnant, using Chandra observations made 15 years apart in September 2009 and July 2024.

Chandra images of the field containing the neutron star

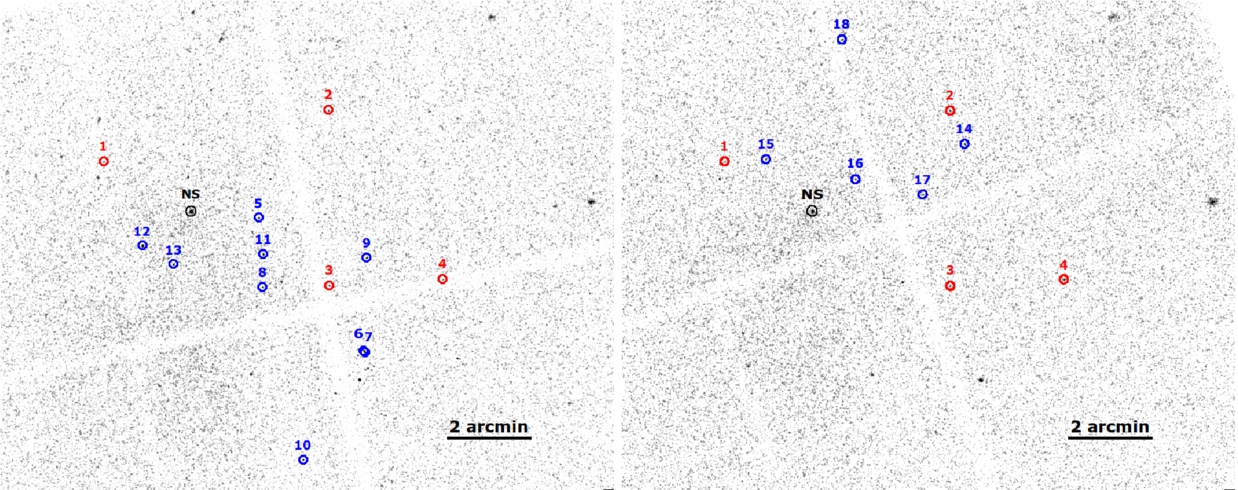
Chandra images from 2009 (left) and 2024 (right; this image is the merged product of two observations). The neutron star is shown in black. Blue and red sources were used for astrometric correction. The red sources were present in both observations. Click to enlarge. [Holland-Ashford et al. 2025]

Making this measurement is trickier than it sounds, requiring more finesse than simply charting the location of the neutron star at different times. Holland-Ashford’s team used measurements from the ultra-precise star-mapping Gaia spacecraft to account for the proper motions of other sources in the images and to put the observations from the two time periods into the same frame of reference. After these adjustments, they measured the proper motion of the neutron star to be 24.7 milliarcseconds per year.

Because the distance to the supernova remnant is uncertain, this proper motion could correspond to a range of transverse velocities. For distance estimates of 6,800 and 12,400 light-years, this puts the neutron star’s transverse velocity at 264 or 474 km/s, respectively.

A Distinct Offset

supernova remnant and neutron star location

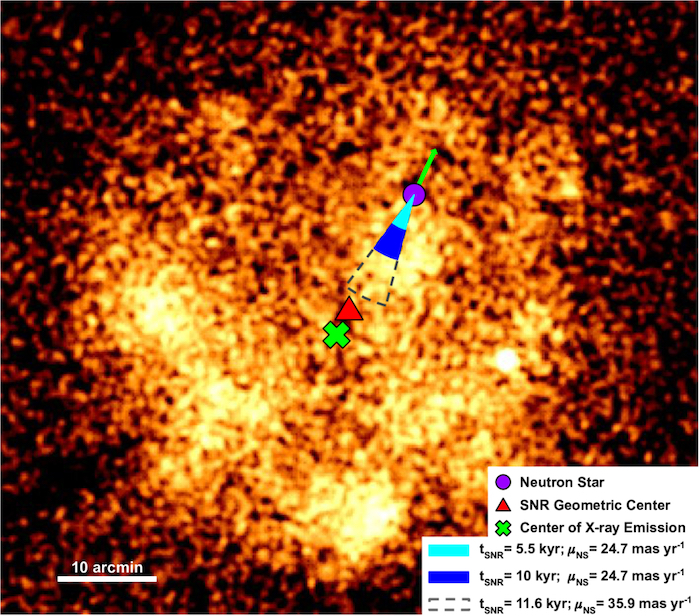
Current location of the neutron star (purple) compared to the geometric center of the supernova remnant (red) and the center of its X-ray emission (green). Even assuming the oldest reasonable age for the supernova remnant, there is a distinct offset between the neutron star’s birthplace and the center of the remnant. Click to enlarge. [Holland-Ashford et al. 2025]

What does this velocity tell us about the kick this neutron star received at birth? To probe the origin of the kick, the team first used the neutron star’s measured velocity and the likely age of the supernova remnant to trace the neutron star’s trajectory back to its birth site. This showed that the neutron star’s birthplace is offset from the center of the supernova remnant by several arcseconds, though both locations fall along the trajectory set by the neutron star’s motion. This suggests that the ejected stellar material and the newborn material were kicked in opposite directions by the supernova, most likely by a theorized “conservation-of-momentum-like” process.

Currently, Chandra is the only X-ray observatory with fine enough resolution to make the kind of measurement needed in this study. Luckily, Chandra’s observations of neutron stars stretch back to 1999, and combining this wealth of data with sensitive measurements from future high-resolution X-ray instruments should provide the long time baselines needed to trace the trajectories of more neutron stars and further explore the origins of neutron star kicks.

Citation

“Proper Motion of the Neutron Star in the Supernova Remnant G18.9–1.1,” Tyler Holland-Ashford et al 2025 ApJ 988 218. doi:10.3847/1538-4357/adeb7e

The post Get a Kick Out of This: Researchers Waited 15 Years to Measure a Neutron Star’s Journey appeared first on AAS Nova.

NCIS JWST: Analyzing the Aftermath of the Bullet Cluster’s Collision

20 June 2025 at 17:00

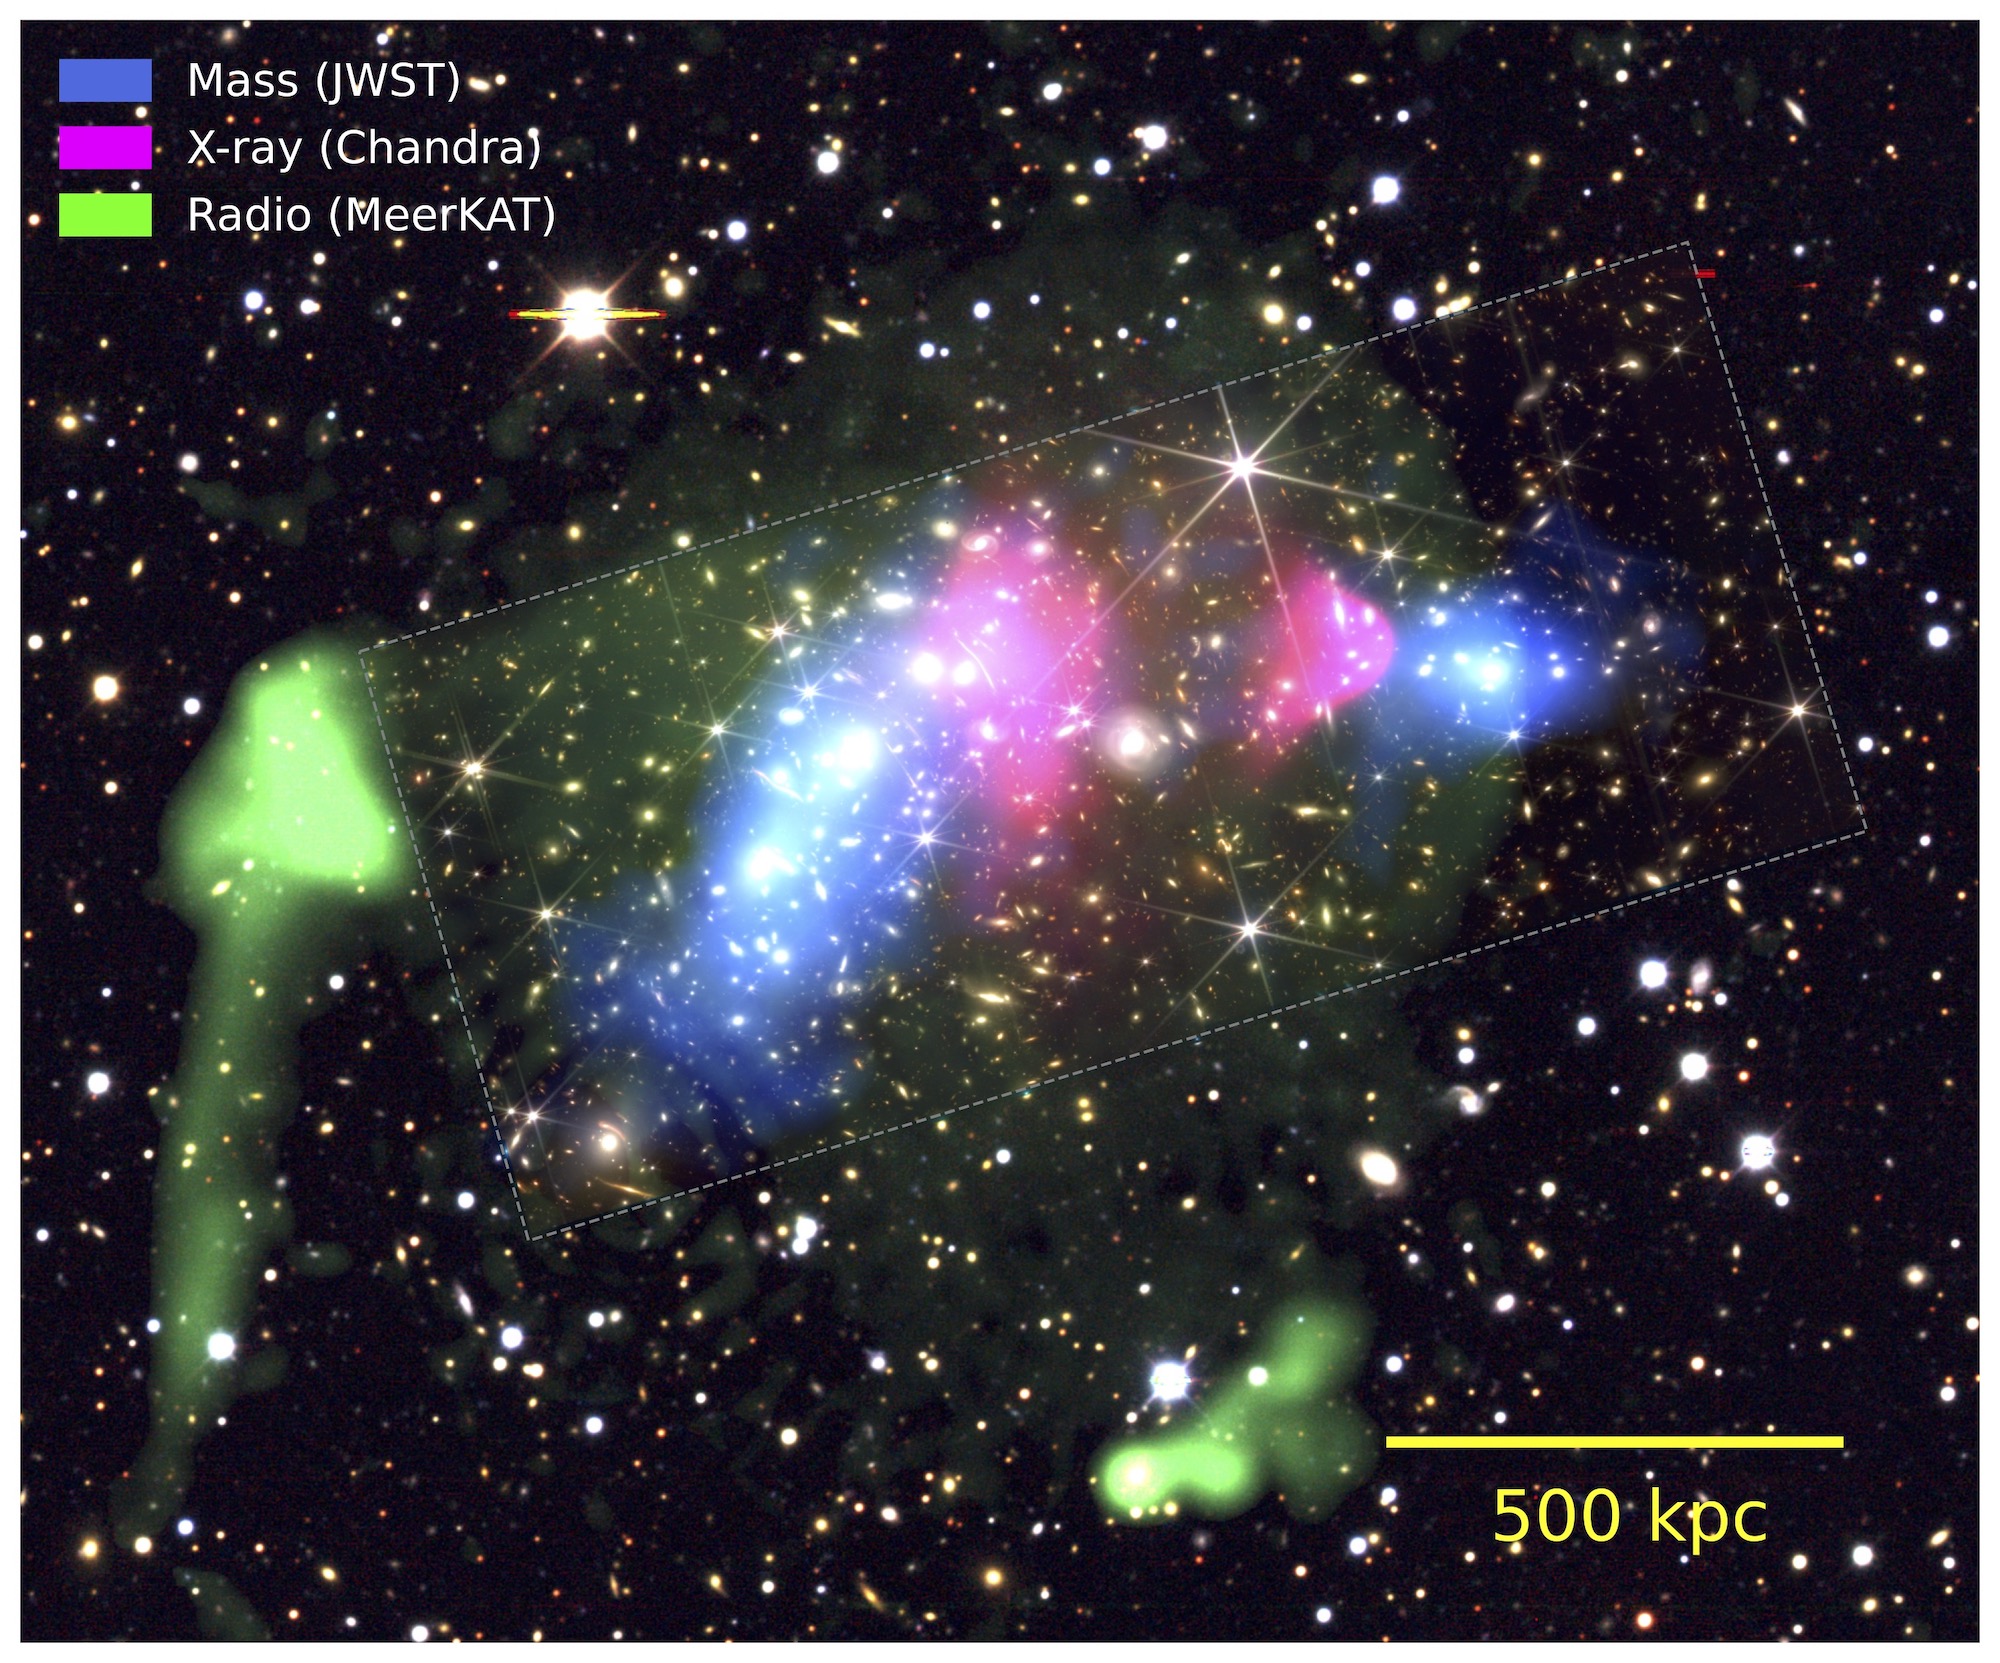
multi-wavelength image of the Bullet Cluster

Editor’s Note: Astrobites is a graduate-student-run organization that digests astrophysical literature for undergraduate students. As part of the partnership between the AAS and astrobites, we occasionally repost astrobites content here at AAS Nova. We hope you enjoy this post from astrobites; the original can be viewed at astrobites.org.

Title: A High-Caliber View of the Bullet Cluster Through JWST Strong and Weak Lensing Analyses
Authors: Sangjun Cha et al.
First Author’s Institution: Yonsei University
Status: Published in ApJL

Despite the extreme depth and resolution of JWST observations, there’s still no smoking gun to be found in the hunt for dark matter. Yet, the extremely high-velocity collision in today’s article might aid in the search for what this mysterious material is made of. The target of today’s article is the Bullet Cluster (Figure 1). Despite its name, the Bullet Cluster is not one, but actually two massive clusters of galaxies gravitationally interacting with one another. Due to the high speed with which the smaller “bullet” subcluster collided and passed through the larger one, a strong bow shock caused the gas in the system to compress and heat to millions of degrees. Typically, this alone would make this system interesting to astronomers, but the real kicker here is that this collision was powerful enough to separate the dark matter from the normal, luminous matter. This has made the Bullet Cluster an important testing ground for theories on the nature of dark matter and is exactly what the authors of today’s article attempt to use it for.

multi-wavelength view of the Bullet Cluster

Figure 1: The Bullet Cluster, colour coded based on the strong and weak lensing–based mass reconstruction (blue/JWST), X-ray intensity (pink/Chandra), and radio intensity (green/MeerKAT) using three different telescopes. The dashed rectangle indicates JWST’s smaller field of view compared to Chandra and MeerKAT. [Cha et al., in press]

Mapping Hidden Mass

The authors used JWST imaging of the majority of the Bullet Cluster system to obtain high-resolution, multi-wavelength data. They then identified over 146 areas in the image subject to strong lensing, which is when the light from a background galaxy is bent around mass in the foreground Bullet Cluster system, since that mass distorts spacetime. They also obtained a weak lensing model for the image through statistical analysis, since the effects of weak lensing, while similar, are much more subtle than strong lensing. They then created a mass map for the system by feeding their strong lensing and weak lensing model into a reconstruction algorithm. Essentially, this algorithm creates the most likely distribution of mass, both dark matter and normal matter, that would re-create all the lensing that they observed.

What’s special about the algorithm that they used here is that it does not assume that light traces mass. In general, this assumption is correct, so other algorithms use it to get the most accurate mass estimate. But the authors here wanted to confirm that even in extreme environments like the Bullet Cluster that this is still the case, so they sent their algorithm in “blind.”

Comparing How the Light Traces the Dark

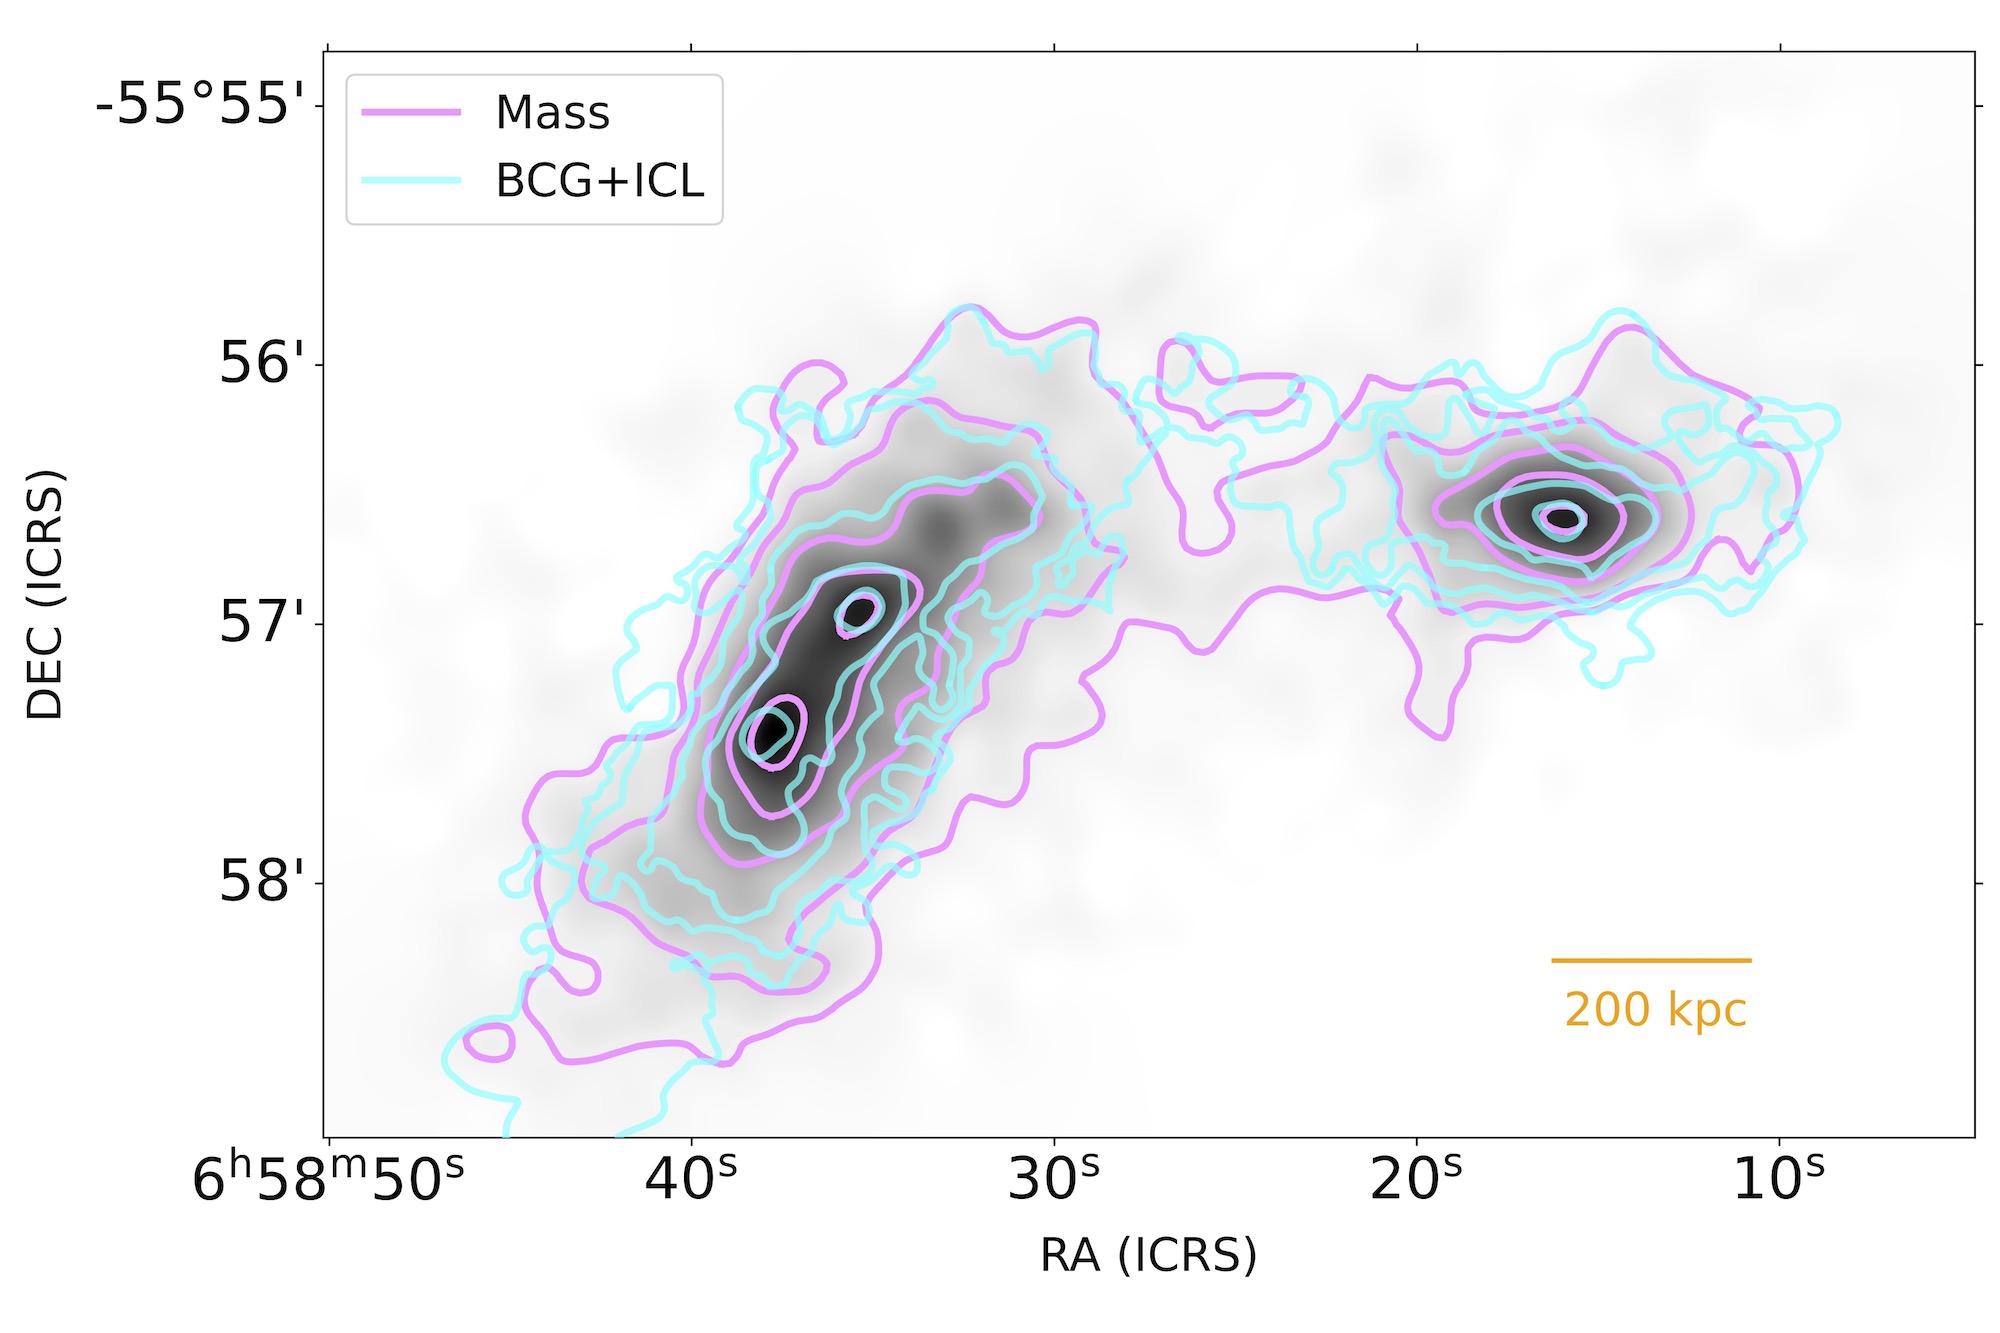
Once they had their mass map, which is dominated mostly by the dark matter in the system, they could compare it to the optical light between the system’s galaxies, referred to as the intracluster light (ICL). They used a statistical test called the modified Hausdorff distance to determine how similar the distribution of ICL and dark matter were to each other. They found that, despite the extreme gravitational interactions going on in the Bullet Cluster, the ICL still does an excellent job overall of tracing the system’s mass (see Figure 2).

comparison of dark matter mass map and distribution of light

Figure 2: Comparison of the dark matter mass map from the strong and weak lensing data (pink) and the distribution of light from the ICL and the most massive galaxy, also known as the brightest cluster galaxy (BCG), combined (blue). Note how the bottom-most centroid’s dark matter and ICL contours are offset from one another. [Cha et al., in press]

Next, they compared their mass map to the distributions of hot plasma, as observed in X-ray wavelengths with Chandra, and of hydrogen gas, as observed in radio wavelengths with MeerKAT (see Figure 1). They found that the dark matter was offset from both of these distributions, which was already known about this system. However, their measurement of these mass offsets indicated that it is unlikely that the Bullet Cluster was formed from a merger between just two galaxy clusters. The authors suggest that the Bullet Cluster’s formation is much more complicated than previously thought, but they aren’t able to give any guesses about the initial conditions.

What a Massive Cluster Tells Us About a Tiny Particle

Finally, the authors were able to use their mass map to put some constraints on one of the theories of dark matter: self-interacting dark matter. If dark matter particles interact with each other, then they have a cross section that can be calculated. Here, the authors calculate it from the offset between the position of the most massive galaxy in the Bullet Cluster and the position of the highest density of dark matter, which is about 60,000 light-years (see Figure 2). They were able to determine that the upper limit of this cross section is 0.5 cm2/g. This is the tightest constraint on self-interacting dark matter’s cross section to date, but we still have that pesky “per gram” in our units since we don’t know the mass of a dark matter particle (but this is being studied!).

This cross section is near the lower limit of what is thought to be a reasonable range for self-interacting dark matter theories (about 0.5–2 cm2/g), but it certainly doesn’t rule anything out. For further context, when dividing by mass, the cross section of a hydrogen atom is about 1.7×107 cm2/g, which is much bigger, but we would expect that when comparing an atom to a potential subatomic dark matter particle.

Altogether, the authors of this article were able to use both the precision of JWST and the impartiality of their mass-reconstruction algorithm to learn new things about both the structure of the Bullet Cluster and the nature of dark matter. Although there are still some open questions that will need to be answered, this study certainly is not just a shot in the dark!

Original astrobite edited by Maggie Verrico.

About the author, Veronika Dornan:

Veronika is a final-year PhD candidate at McMaster University. Her research is in observations of extragalactic globular star clusters and what they can tell us about galaxy evolution and dark matter distribution in the universe.

The post NCIS JWST: Analyzing the Aftermath of the Bullet Cluster’s Collision appeared first on AAS Nova.

❌