❌

Reading view

Summer Goes Out With a Heat Dome

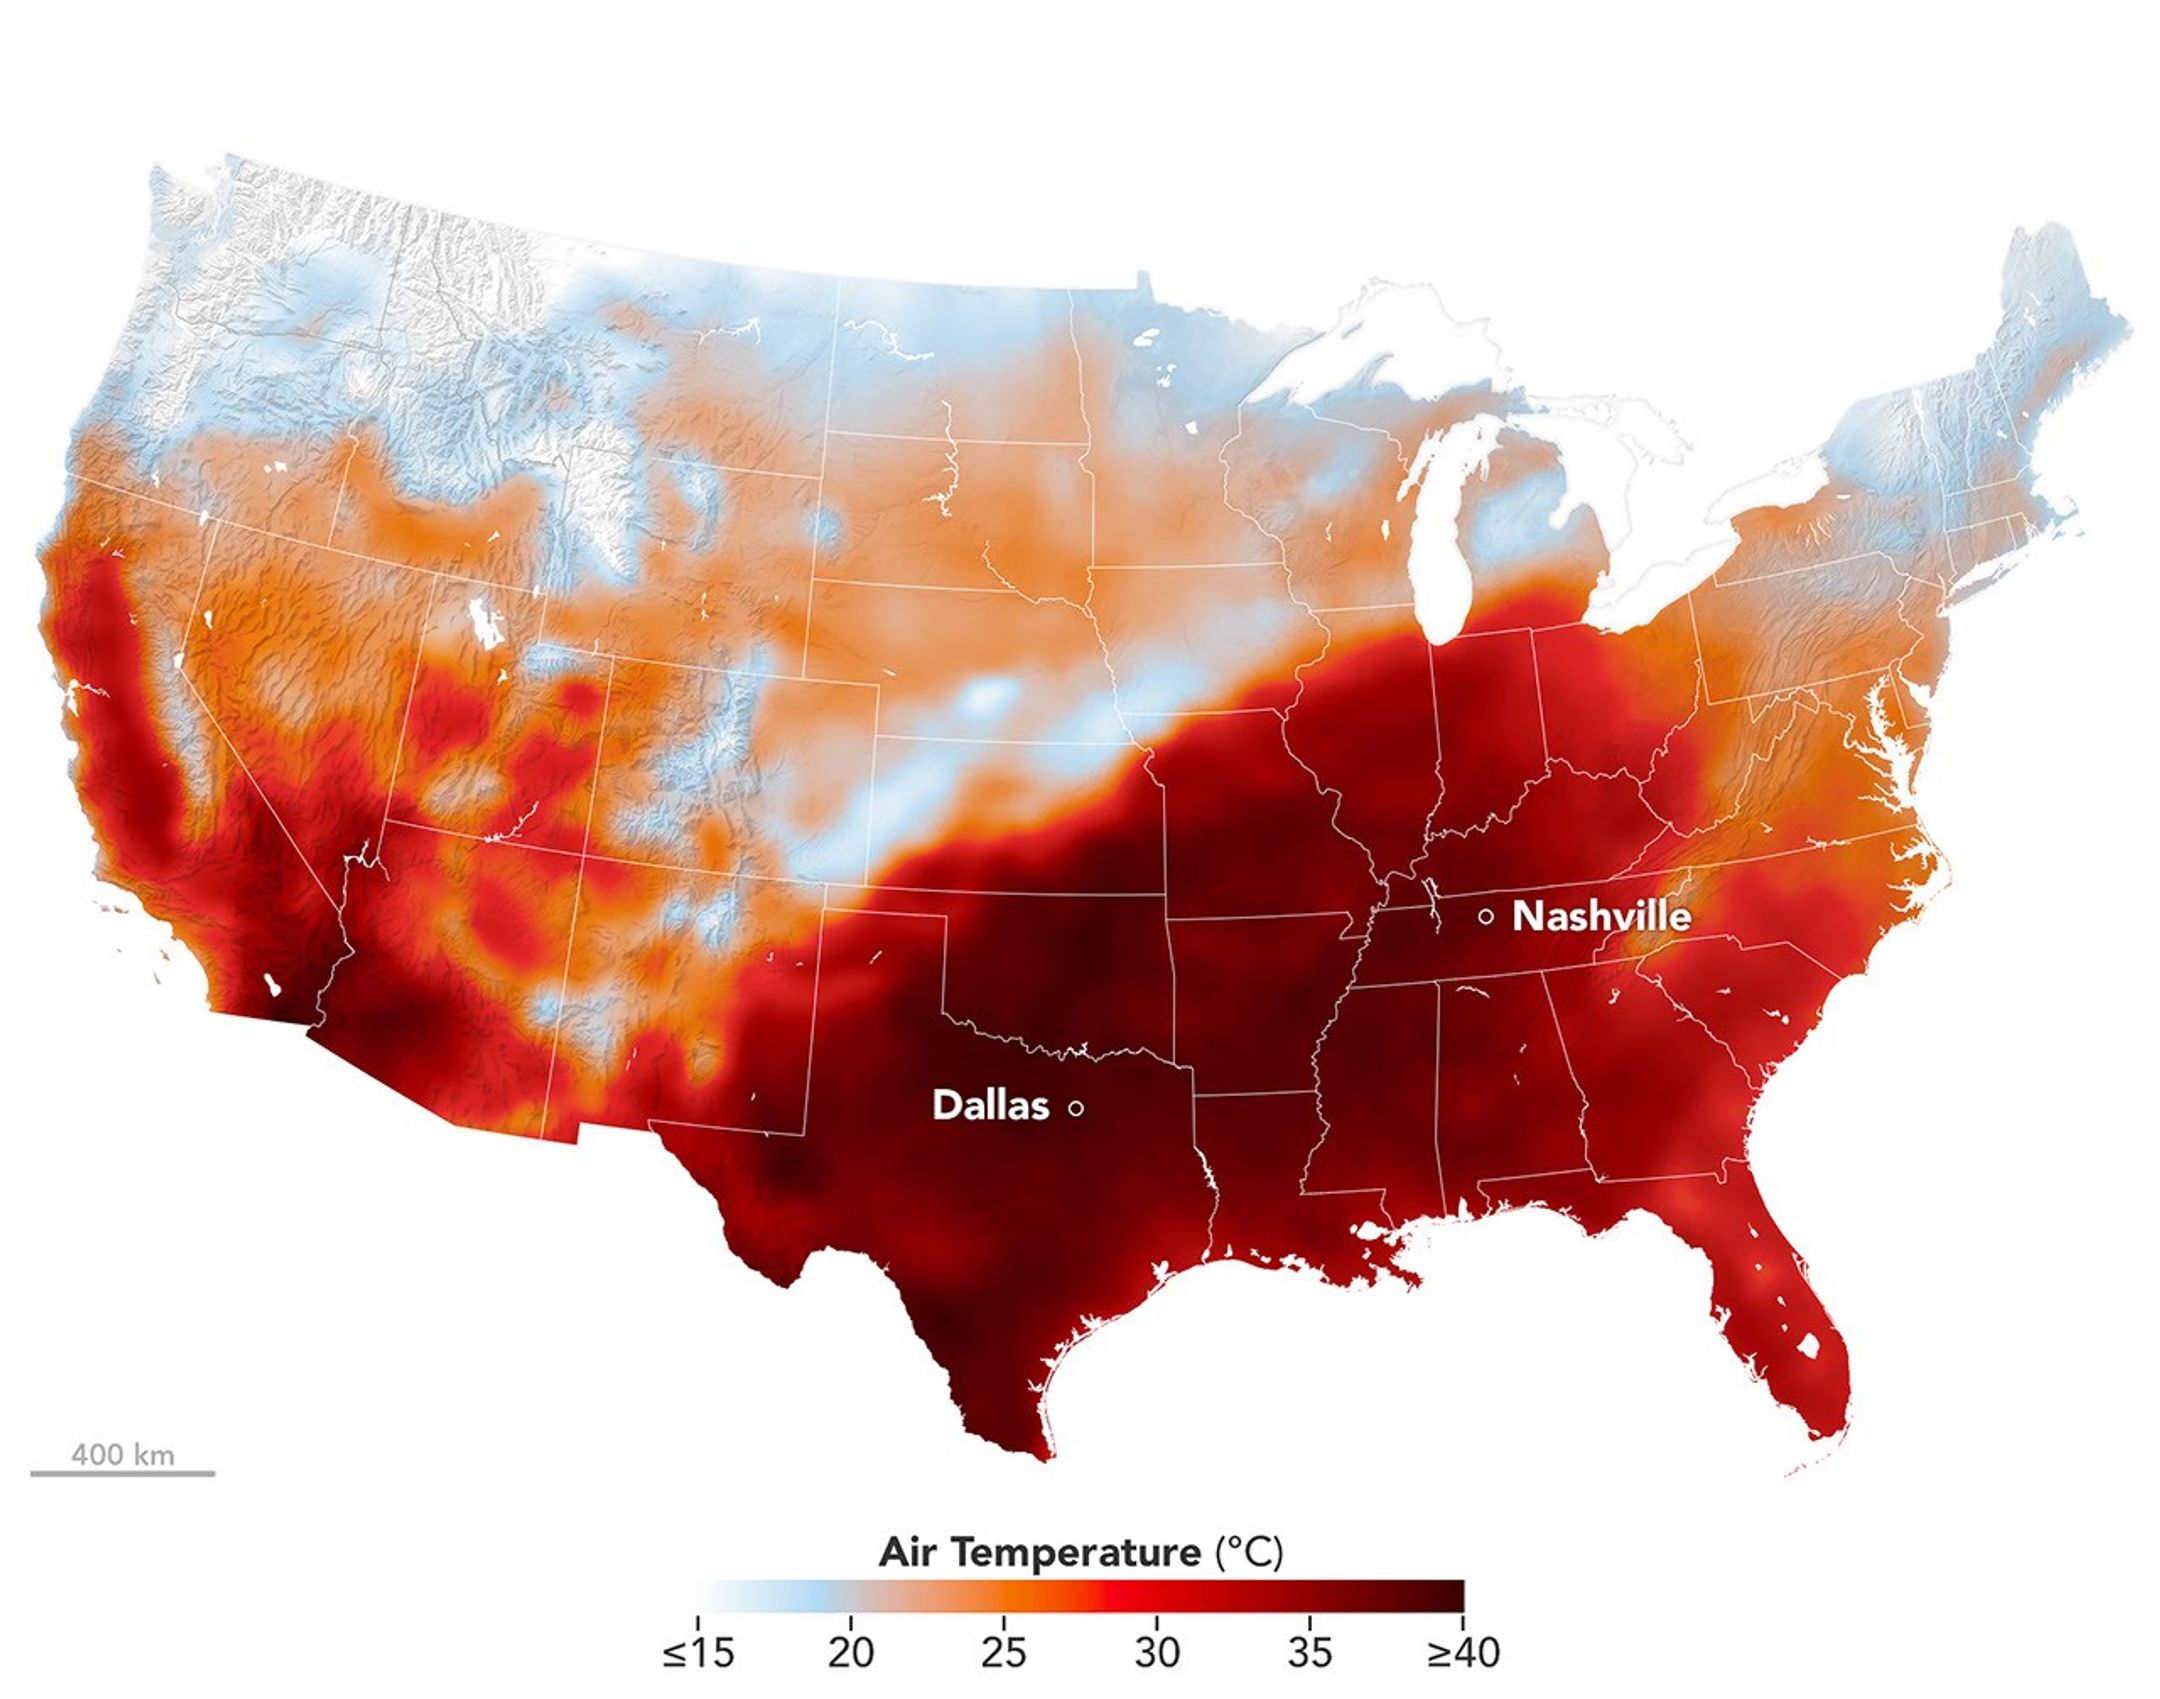
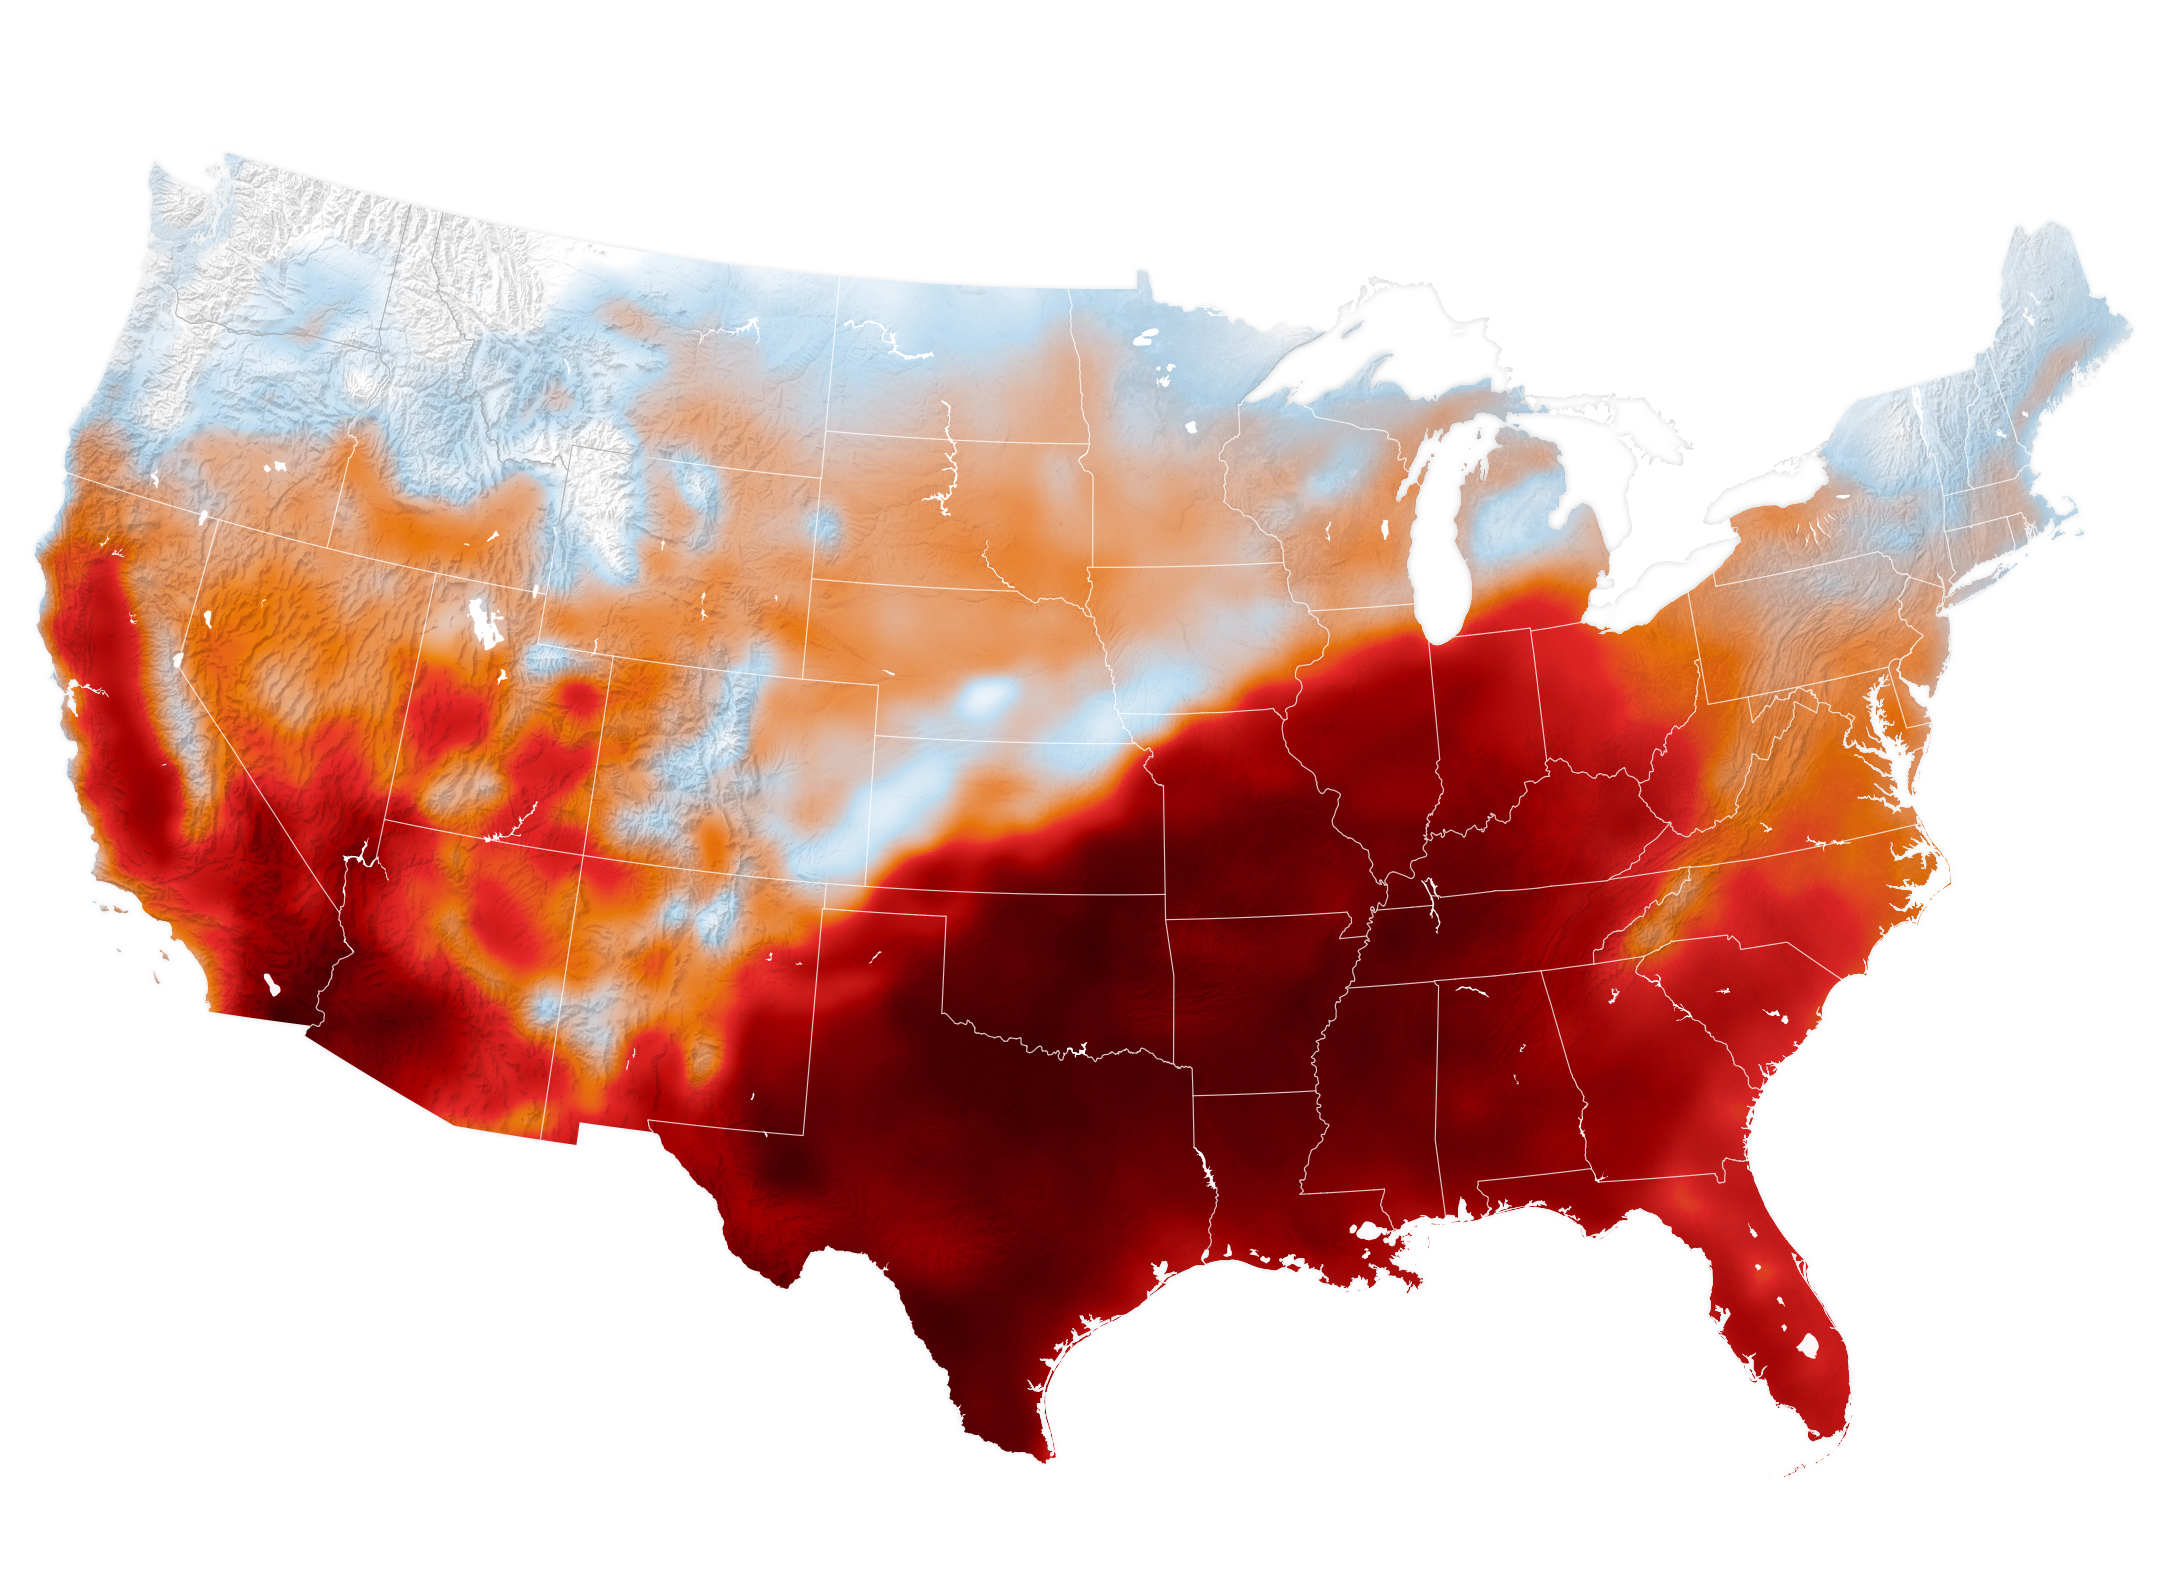
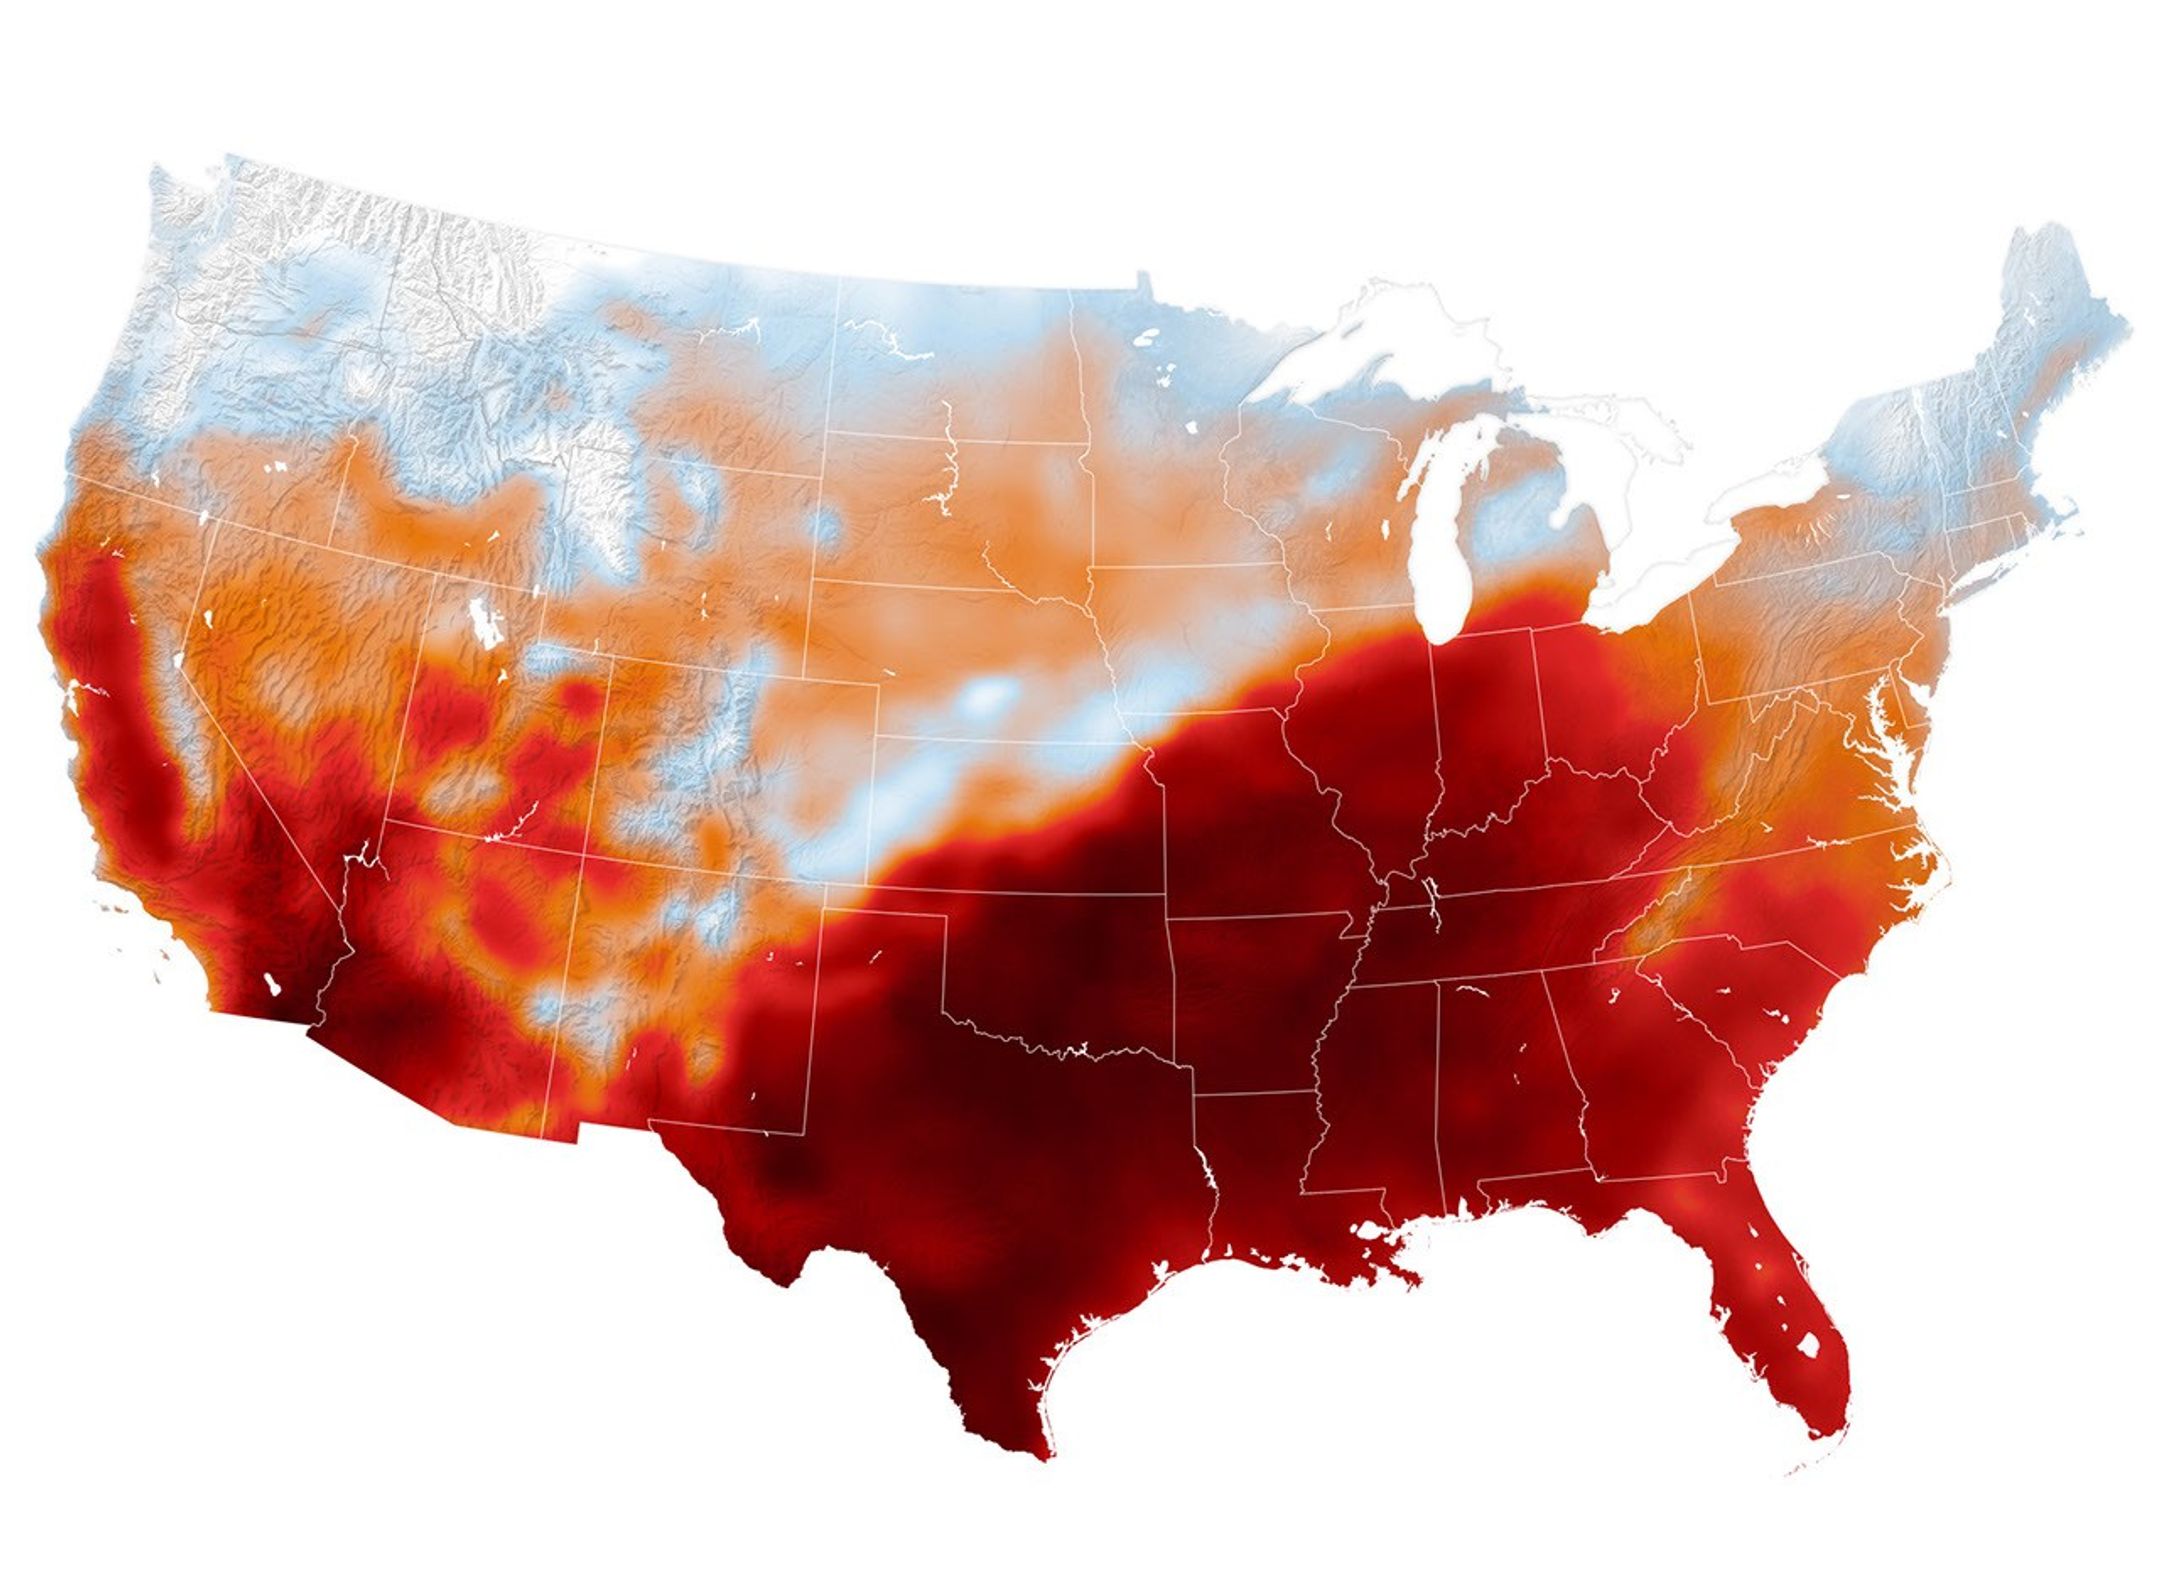
Air temperatures in the United States are depicted in white to light blue (cooler) and orange to red (warmer). An area of red, indicating temperatures around 100 degrees Fahrenheit, covers Texas and several states to the east and northeast.
An area of high pressure over the south-central U.S. produced unseasonable and, in some places, record-breaking warmth on September 15, 2026, as shown in this map of modeled air temperatures from GEOS (Goddard Earth Observing System).
NASA Earth Observatory/Michala Garrison

While the calendar indicated that astronomical summer was winding down, a swath of the south-central United States was sweltering under a heat dome in mid-September 2026.

This map shows air temperatures in the contiguous U.S. on September 15, 2026, at 4 p.m. Central Time (21:00 Universal Time), modeled at 2 meters (6.5 feet) above the ground. It was produced by combining satellite observations with temperatures predicted by a version of the GEOS (Goddard Earth Observing System) model, which uses mathematical equations to represent physical processes in the atmosphere. The darkest reds indicate areas where temperatures approached or exceeded 40 degrees Celsius (104 degrees Fahrenheit).

More than 41 million people in the U.S.—about 12 percent of the population—were under a National Weather Service extreme heat advisory, extreme heat watch, or extreme heat warning on September 15. The high temperatures spanned large portions of several states, such as Texas, Oklahoma, Arkansas, Missouri, and Tennessee. Meteorologists warned that high humidity, limited cloud cover, and light winds could make temperatures feel higher than thermometer readings and increase the risk of heat-related illnesses.

Several locations set new daily high temperature records on September 15. These included Dallas, Texas, at 101ºF (38ºC), Memphis, Tennessee, at 99ºF (37ºC), and Nashville, Tennessee, at 100ºF (38ºC). The cities were all at least 12ºF warmer than normal that day, with Nashville breaking its daily-high record from 1927. The day before, Nashville also set a record-high minimum temperature of 75ºF (24ºC).

A weather phenomenon meteorologists call a heat dome was responsible for driving temperatures up across the region. A heat dome develops when an area of high pressure in the upper atmosphere pushes hot air toward the surface and traps it there. Heat domes put the brakes on convection and suppress clouds and precipitation. This allows sunlight to reach Earth’s surface relatively unhindered and further elevate air temperatures.

The stretch of unseasonable temperatures follows the warmest June through August in the contiguous United States in a 132-year record, according to NOAA. The three-month period in 2026 was 0.4ºF warmer than the previous records, set in 1936 and 2021.

NASA Earth Observatory image by Michala Garrison, using GEOS-FP data from the Global Modeling and Assimilation Office at NASA GSFC. Story by Lindsey Doermann.
Downloads

Air temperatures in the United States are depicted in white to light blue (cooler) and orange to red (warmer). An area of red, indicating temperatures around 100 degrees Fahrenheit, covers Texas and several states to the east and northeast.

September 15, 2026

JPEG (1.22 MB)

References & Resources

You may also be interested in:

Stay up-to-date with the latest content from NASA as we explore the universe and discover more about our home planet.
Heat Dome Broils the Western U.S.
4 min read

A ridge of high pressure fueled record-breaking temperatures in Montana, Utah, and Wyoming on July 12, 2026.
Article
Europe’s Scorching Summer
6 min read

A series of heat waves in 2026 is breaking records and taking a toll in Europe.
Article
Sensing the Poles’ Hidden Heat
3 min read

New animations from NASA’s PREFIRE mission reveal two years of seasonal temperature swings at the Arctic and Antarctic.

Article

The post Summer Goes Out With a Heat Dome appeared first on NASA Science.

  •  

Summer Goes Out With a Heat Dome

Air temperatures in the United States are depicted in white to light blue (cooler) and orange to red (warmer). An area of red, indicating temperatures around 100 degrees Fahrenheit, covers Texas and several states to the east and northeast.
An area of high pressure over the south-central U.S. produced unseasonable and, in some places, record-breaking warmth on September 15, 2026, as shown in this map of modeled air temperatures from GEOS (Goddard Earth Observing System).
NASA Earth Observatory/Michala Garrison

While the calendar indicated that astronomical summer was winding down, a swath of the south-central United States was sweltering under a heat dome in mid-September 2026.

This map shows air temperatures in the contiguous U.S. on September 15, 2026, at 4 p.m. Central Time (21:00 Universal Time), modeled at 2 meters (6.5 feet) above the ground. It was produced by combining satellite observations with temperatures predicted by a version of the GEOS (Goddard Earth Observing System) model, which uses mathematical equations to represent physical processes in the atmosphere. The darkest reds indicate areas where temperatures approached or exceeded 40 degrees Celsius (104 degrees Fahrenheit).

More than 41 million people in the U.S.—about 12 percent of the population—were under a National Weather Service extreme heat advisory, extreme heat watch, or extreme heat warning on September 15. The high temperatures spanned large portions of several states, such as Texas, Oklahoma, Arkansas, Missouri, and Tennessee. Meteorologists warned that high humidity, limited cloud cover, and light winds could make temperatures feel higher than thermometer readings and increase the risk of heat-related illnesses.

Several locations set new daily high temperature records on September 15. These included Dallas, Texas, at 101ºF (38ºC), Memphis, Tennessee, at 99ºF (37ºC), and Nashville, Tennessee, at 100ºF (38ºC). The cities were all at least 12ºF warmer than normal that day, with Nashville breaking its daily-high record from 1927. The day before, Nashville also set a record-high minimum temperature of 75ºF (24ºC).

A weather phenomenon meteorologists call a heat dome was responsible for driving temperatures up across the region. A heat dome develops when an area of high pressure in the upper atmosphere pushes hot air toward the surface and traps it there. Heat domes put the brakes on convection and suppress clouds and precipitation. This allows sunlight to reach Earth’s surface relatively unhindered and further elevate air temperatures.

The stretch of unseasonable temperatures follows the warmest June through August in the contiguous United States in a 132-year record, according to NOAA. The three-month period in 2026 was 0.4ºF warmer than the previous records, set in 1936 and 2021.

NASA Earth Observatory image by Michala Garrison, using GEOS-FP data from the Global Modeling and Assimilation Office at NASA GSFC. Story by Lindsey Doermann.

Downloads

Air temperatures in the United States are depicted in white to light blue (cooler) and orange to red (warmer). An area of red, indicating temperatures around 100 degrees Fahrenheit, covers Texas and several states to the east and northeast.

September 15, 2026

JPEG (1.22 MB)

References & Resources

You may also be interested in:

Stay up-to-date with the latest content from NASA as we explore the universe and discover more about our home planet.

Heat Dome Broils the Western U.S.

4 min read

A ridge of high pressure fueled record-breaking temperatures in Montana, Utah, and Wyoming on July 12, 2026.

Article

Europe’s Scorching Summer

6 min read

A series of heat waves in 2026 is breaking records and taking a toll in Europe.

Article

Sensing the Poles’ Hidden Heat

3 min read

New animations from NASA’s PREFIRE mission reveal two years of seasonal temperature swings at the Arctic and Antarctic.

Article
  •  

Sensing the Poles’ Hidden Heat

Surface temperatures across Earth’s poles pulse with the seasons, as seen in this animation based on two years of data collected by NASA’s PREFIRE (Polar Radiant Energy in the Far-InfraRed Experiment) mission.
NASA/Chad Greene

At the top and bottom of the planet, the seasons arrive on a schedule all their own. Satellite data from a mission measuring infrared energy reveal just how differently—and how dramatically—surface temperatures swing across two full years at the poles.

In this animation, surface temperatures across the Arctic and Antarctic pulse between cold (dark blue) and milder to warm (lighter blue to red). Data for the animation come from NASA’s PREFIRE (Polar Radiant Energy in the Far-InfraRed Experiment) satellites. The mission’s twin CubeSats began collecting science data in July 2024 and have now captured two complete seasonal cycles at each pole.

Because the two poles sit in opposite hemispheres, their seasons occur at opposite times—and the swing between seasons differs, too. In the Arctic, cold, dark winters give way to summers warm enough to thaw vast stretches of tundra and sea ice. In Antarctica, Earth’s coldest continent, summer temperatures rarely climb above freezing before the bitter cold of winter returns.

Surface temperatures, and how they fluctuate, offer a window into Earth’s energy budget, the net flow of energy into and out of the Earth system. Sunlight absorbed by the surface is re-radiated as infrared heat, which bounces between Earth’s surface and atmosphere before escaping to space. The poles play an important role in this process. Atmospheric and ocean circulation carries excess heat absorbed in the tropics toward the poles, where it radiates away to space, helping regulate the planet’s temperature.

“By measuring invisible heat radiating from Earth’s coldest places, PREFIRE is helping scientists understand why the poles are changing so rapidly, and what those changes might mean for the rest of the planet,” said Chad Greene, a glaciologist at NASA’s Jet Propulsion Laboratory.

Scientists have long known that far-infrared radiation accounts for nearly 60 percent of the energy Earth loses to space, but that portion of the spectrum—invisible to human eyes—had never been comprehensively measured on a global scale. By directly tracking this invisible energy in near-real-time, the PREFIRE mission is helping scientists refine models and gain a better understanding of the Earth system.

“Weather systems, river flows, shipping routes, and ice sheet stability are all influenced by energy movement in a part of the spectrum that only PREFIRE can see,” said Tristan L’Ecuyer, an atmospheric scientist at the University of Wisconsin-Madison and principal investigator of the PREFIRE mission. “Now that the invisible has been made visible, we can begin to improve weather and climate predictions that industries, our national defense, and Arctic communities rely on.”

Maps courtesy of Chad Greene, NASA/JPL, using data from NASA’s PREFIRE mission. Story by Kathryn Hansen.

References & Resources

You may also be interested in:

Stay up-to-date with the latest content from NASA as we explore the universe and discover more about our home planet.

A Moonlit Earth as Seen From Artemis II

4 min read

An astronaut’s photo, taken en route to the Moon, reveals our planet and its place in space in a novel…

Article

Earthset From the Lunar Far Side

2 min read

The crew of NASA’s Artemis II mission captured extraordinary images of our home planet during their journey around the far…

Article

June 2026 Satellite Puzzler

2 min read

Your challenge is to tell us the location of the satellite image and why it is interesting.

Article
  •  

NRC is (sort of) getting rid of "as low as reasonably achievable" standard

Last week, just before the US started its break for the July Fourth holiday, the Nuclear Regulatory Commission (NRC) proposed a new rule that would change how it regulated exposure to radiation. The Trump administration has been pushing to restart construction of nuclear power plants in the US, and many pro-nuclear advocates have been complaining about the US's existing regulations, portraying them as the main barrier to the flourishing of the industry. So, it had seemed likely that major revisions were coming.

Instead, the NRC's proposed new rules endorse the science behind its current rules and suggest that any problems are largely in the vagueness of the terminology that it has been using. So, instead, it's endorsing standards that are meant to accomplish the same thing, but avoid using some of the language it had relied on. Probably the clearest indication of the evolutionary change at play is that the NRC estimates the changing rules will save industry—not just power, but also medical and research applications—only about $9.5 million a year.

LNT and ALARA

There are two technical abbreviations at the center of US nuclear regulations. The first is LNT, which stands for "linear non-threshold." It's in reference to the issue of whether there's any level of radiation that is so low that it no longer produces harmful biological effects—the "threshold" in LNT. The "non-threshold" implies that it doesn't, and that's in keeping with biology, which has demonstrated that even single particles or photons of radiation can damage DNA and that the mechanisms cells have for repairing that damage are inherently error-prone. The "linear" in LNT simply describes how the impact of radiation scales directly with the dose.

Read full article

Comments

© SOPA Images

  •  

Hawking Radiation Breakthrough: These Black Hole Emissions Could Reveal Quantum Gravity

New experiments are bringing into focus the mechanism behind Hawking radiation, the strange phenomenon that demonstrates black holes are not strictly a one-way street. 

While theoretical physicist Stephen Hawking’s prediction of this faint radiation from black holes has yet to be detected from space, researchers have replicated it in laboratory models and have developed complex theories to explain the phenomenon.

In their recent paper in Nature, an international team of researchers from Germany’s Paderborn University, Mexico’s Cinestav, and Israel’s Weizmann Institute of Science has developed laboratory models that may point to a much simpler mechanism underlying these theoretical black hole emissions.

Hawking Radiation

Stephen Hawking first described Hawking radiation in a 1974 theoretical model, characterizing this as a type of blackbody radiation, meaning it is in thermodynamic equilibrium with its environment and changes with the body’s temperature. His prior work had assumed that the pull of a black hole was so powerful that electromagnetic radiation could not escape it. But eventually he reconsidered the work of two Soviet scientists, Yakov Zeldovich and Alexei Starobinsky, who proposed in 1971 that black holes could create and emit particles.

A major consequence of this theoretical radiation is that if it were real, it would mean that black holes slowly evaporate as they lose electromagnetic radiation. Given enough time, if a black hole failed to feed, it would continue to shrink until it vanished entirely. 

Intriguingly, the rate at which this happens would be inversely proportional to the black hole’s mass, with smaller black holes emitting radiation at a faster rate. Therefore, micro black holes could disappear remarkably quickly compared to their larger siblings.

Modeling Black Hole Emissions

The international team’s work models the generation of Hawking radiation in a nonlinear optical environment, allowing them to identify a simple mechanism responsible for the emission and its impact on the system.

Earlier work described a significantly more complicated scenario, involving multiple quantum-mechanical processes interacting in a cascade to generate the Hawking radiation. The new solution utilized a fiber-optic model of a black hole’s event horizon, combined with precision experiments and rigorous modeling to reveal a much simpler mechanism by which radiation generates and feeds back.

“This simplifies the theoretical understanding and opens up new ways of calculating effects in such systems,” explained lead author Dr. Lorenzo M. Procopio, formerly of Weizmann but now of Paderborn University. “It might even shed light on how Hawking radiation arises in the context of gravity.”

Experimental Verification

The international researchers’ work goes beyond identifying the simplified mechanism; it also provides evidence that Hawking radiation interacts with the black hole system, rather than passively emitting from it into space.

Understanding this emission system is crucial to one of the great unanswered questions about black holes: do they lose mass over time or remain in permanent equilibrium? The enormous cosmic scale of a black hole and massive distances involved make such a precise study out of reach for current observational technology. 

However, this laboratory work provides a unique opportunity to study the effect of Hawking radiation on a measurable scale. Additionally, Hawking radiation experiments offer essential clues to the nature of elusive quantum gravity, in which physicists are still trying to determine how macroscopic gravity impacts the microscopic quantum world.

The paper, “Backreaction of Stimulated Hawking Radiation in an Optical Analogue,” appeared in Nature on July 1, 2026.

Ryan Whalen covers science and technology for The Debrief. He holds an MA in History and a Master of Library and Information Science with a certificate in Data Science. He can be contacted at ryan@thedebrief.org, and follow him on Twitter @mdntwvlf.

  •  

This Intriguing Exoplanet is Just 25 Light-Years from Earth—Is Its Too Dangerous to Be Home to Life?

Researchers have discovered a potentially habitable exoplanet just 25 light-years from Earth—but is its precarious location on the cosmic shore too dangerous to make it a home for extraterrestrial life?

In a recent paper in The Astrophysical Journal, researchers at the University of California, Irvine, revealed their discovery of GJ 3378b, an exoplanet that resides in the habitable zone, sometimes referred to as the “Goldilocks zone,” a distance from the host star ideal for liquid surface water.

The habitable zone is a key focus in the search for extraterrestrial life, as planets any closer would have their atmospheres and surface waters burned off, while those any further from their host star would be completely frozen.

Finding Another Earth

“This one’s exciting,” said lead author Paul Robertson, a UC Irvine assistant professor of astronomy and lead author of the new study. “It’s one of our closest cosmic neighbors. 25 light-years sounds like a long way, but the Milky Way is about 100,000 light-years across, so in that respect it’s our next-door neighbor.”

Robertson led the team in the exoplanet discovery, using the Habitable-zone Planet Finder on the Hobby-Eberly Telescope at McDonald Observatory in Texas, and the NEID Spectrometer on the WIYN Telescope at Kitt Peak National Observatory in Arizona.

GJ 3378b is about twice the size of Earth, making it what astronomers call a “super-Earth” for its increased size. Additionally, this potentially habitable exoplanet likely receives a comparable amount of stellar radiation to our planet.

“This super-Earth gets about 90 percent of the radiation from its host star as Earth gets from its sun, so it’s right in the sweet spot,” said Robertson.

Exoplanet Atmosphere

While GJ 3378b resides within its star’s habitable zone, it does so only barely. This fringe area astronomers refer to as “the cosmic shoreline,” a distance just outside of which the stellar radiation would become so intense that its atmosphere would be ripped away, and any potential surface water along with it.

Straddling this shoreline, researchers are uncertain whether GJ 3378b has an atmosphere or is still a victim of excessive stellar radiation, as its larger size relative to Earth may make it more susceptible.

Our own solar system also offers an excellent example of this: the planet Mars, which researchers suspect once had an Earth-like atmosphere, and potentially even life. However, intense solar radiation bombardment destroyed that atmosphere, taking the surface water with it, leaving a desolate wasteland.

“If you scale the Earth down to the size of an apple, its atmosphere would be about as thick as the skin of the apple,” said Robertson. “That’s just enough to maintain the kinds of surface pressures where you can have liquid water. It’s enough that there’ll be breathable air, and it provides maybe a little bit of protection from the harsh radiation environment of space.”

Extraterrestrial Life on Exoplanets

Although GJ 3377b is relatively close to Earth on a cosmic scale, current equipment cannot determine whether the planet harbors an atmosphere. To do so, advanced future observation platforms will be required, and just such work is on the horizon.

“If a planet in the habitable zone has a proper atmosphere, we can justify further research looking for biosignatures, liquid water, or other signs of life that require both an atmosphere and the right amount of heating from the host star,” said co-author Gogod James, a UC Irvine student in Robertson’s group who worked to characterize the size of GJ 3378b.

NASA plans to take a closer look at these potentially habitable worlds in about two decades with its upcoming Habitable Worlds Observatory (HWO). Launching in the 2020s, HWO will be a large infrared/optical/ultraviolet space telescope designed to confirm whether exoplanets have atmospheres, and then seek biosignatures within those atmospheres, which could indicate the presence of extraterrestrial life.

The paper, “A Revised Mass and Period for the Habitable Zone Super-Earth GJ 3378 b: A Planet Straddling the Cosmic Shoreline,” appeared in The Astrophysical Journal on June 30, 2026.

Ryan Whalen covers science and technology for The Debrief. He holds an MA in History and a Master of Library and Information Science with a certificate in Data Science. He can be contacted at ryan@thedebrief.org, and follow him on Twitter @mdntwvlf.

  •  

U.S. to Overhaul Radiation Safety Rules to Spur Nuclear Expansion

The Nuclear Regulatory Commission plans to end longstanding guidance that radiation exposure be “as low as reasonably achievable.”

© Audra Melton for The New York Times

The proposed rule changes could make it cheaper and easier to build and operate new nuclear power plants in the United States.
  •  
  •  

Understanding Dirty Electricity | Causes and Effects

The generation and evolution of electricity is discussed, highlighting significant milestones from early static electricity experiments to modern AC power generation techniques. Dirty electricity, characterized by high-frequency electrical noise, can lead to health issues. There is a strong need for more research on this electromagnetic pollution and its health impacts.

  •  

Standing For Truth Against the Big Bang

I presented on the subject of problems for the big bang on the YouTube channel Standing for Truth Ministries. I discussed the most common problems the big bang theory has, the contradictions, fudge factors and failures.

  •  
❌