❌

Reading view

How 2 US, European Satellites Are Studying Hurricanes During El Niño

5 min read

How 2 US, European Satellites Are Studying Hurricanes During El Niño
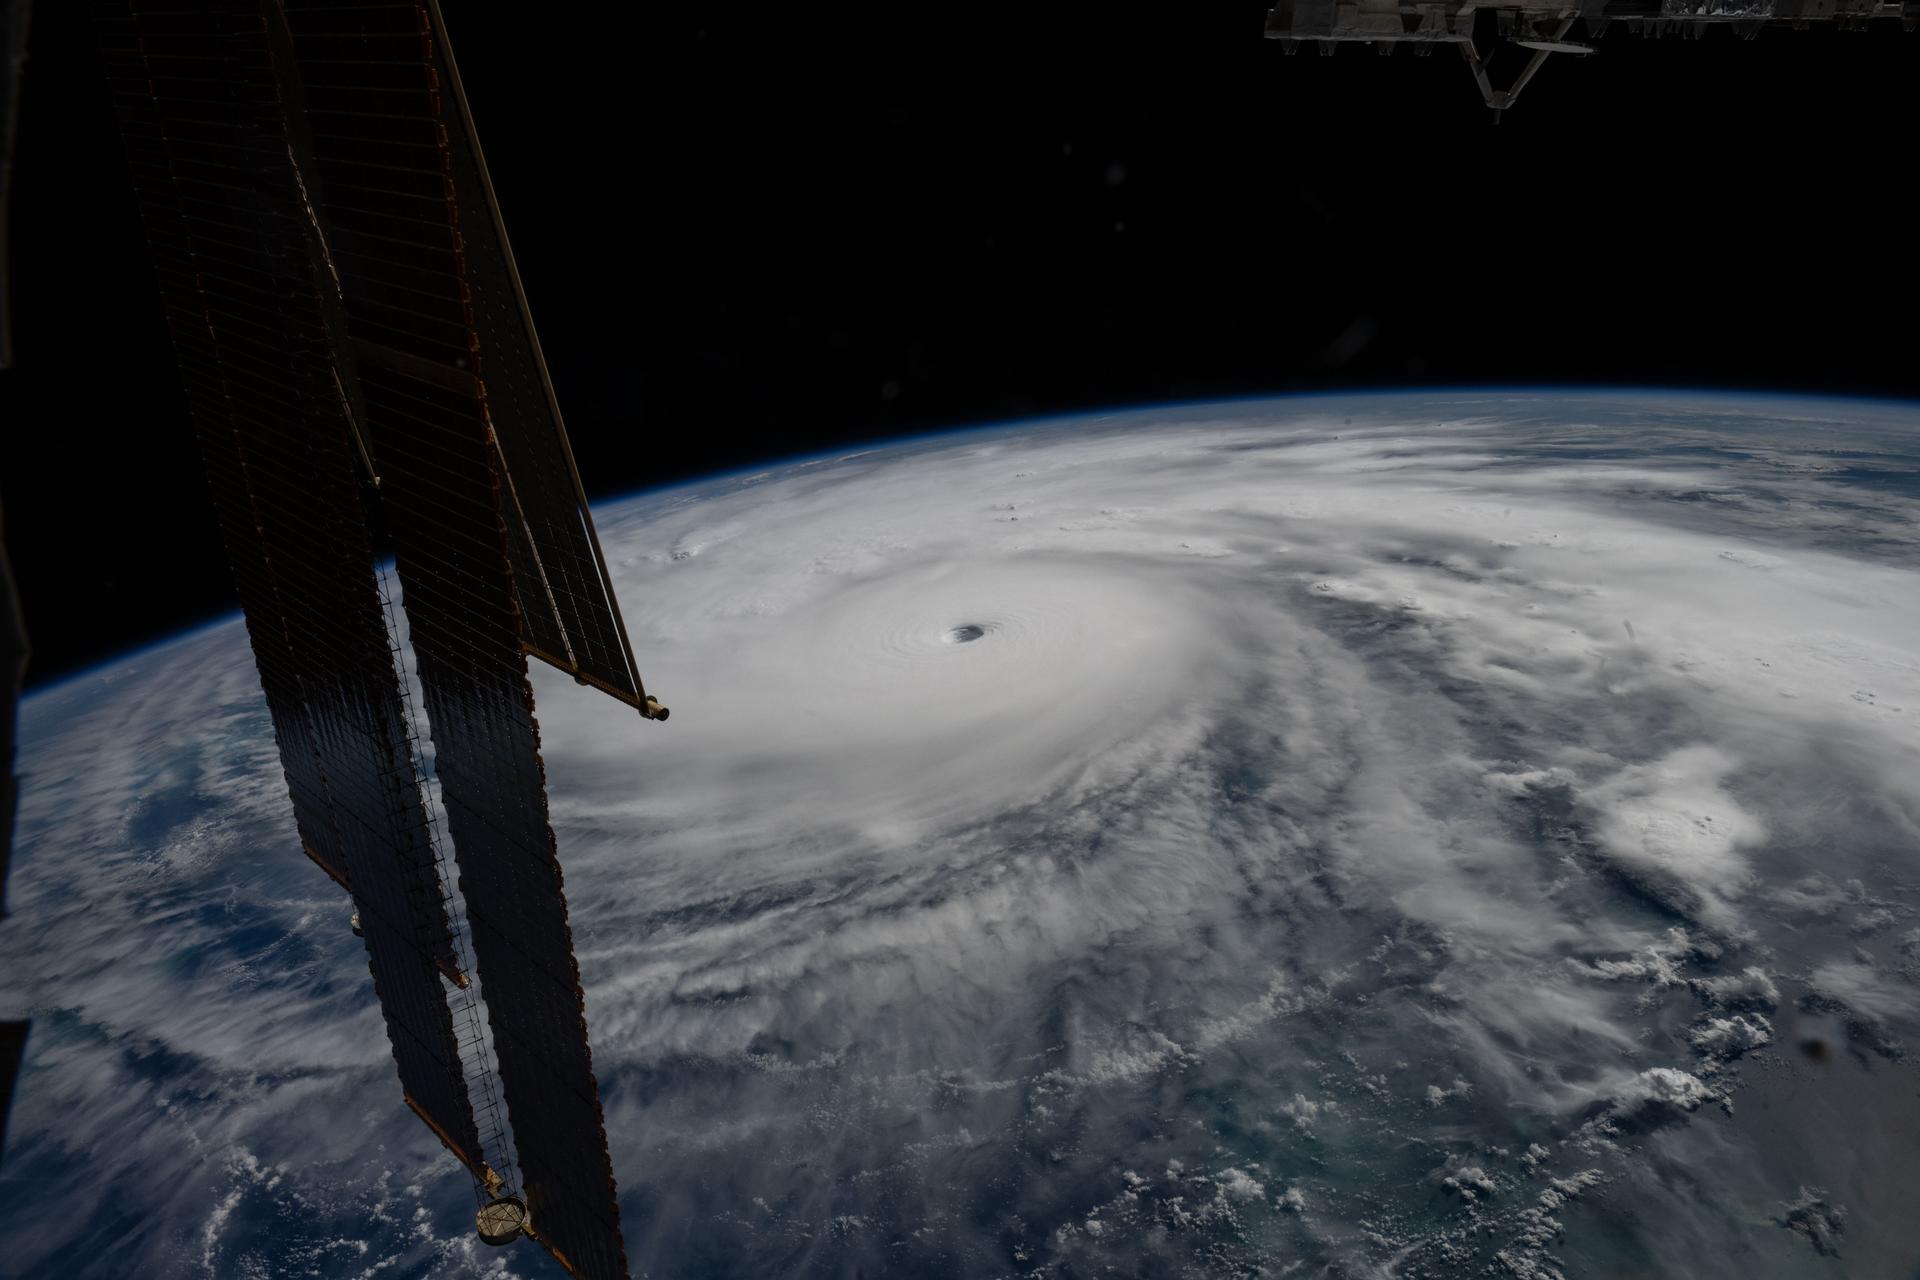
Category 5 Hurricane Melissa, one of the most powerful storms to strike the Caribbean in recent history, is pictured about 50 miles south of Jamaica in this photograph from the International Space Station as it orbited 262 miles above the Yucatan Peninsula.
Hurricane Melissa is seen 50 miles south of Jamaica in this photograph taken from the International Space Station on Oct. 28, 2025.
NASA

Last November, NASA and its European partners launched the Sentinel-6B satellite to improve hurricane forecasts, help protect infrastructure, and benefit commercial industries, including shipping. The satellite now is flying 30 seconds behind its predecessor, Sentinel-6 Michael Freilich. Both satellites are providing precise sea level height measurements during what oceanographers expect to be a historic El Niño, a naturally occurring oceanic phenomenon in which warmer-than-usual Pacific waters shift global weather patterns.

The two satellites make up the Copernicus Sentinel-6/Jason-CS (Continuity of Service) mission, the latest in a series of ocean-observing radar altimetry missions that have been monitoring Earth’s changing seas continuously since the early 1990s.

The data each satellite is collecting will not only allow scientists to better understand this year’s El Niño but will also help them create more accurate hurricane predictions.

“This El Niño was a late-bloomer,” said Josh Willis, Sentinel-6B’s project scientist at NASA’s Jet Propulsion Laboratory in Southern California. “It didn’t kick off until the middle of the year and is just now reaching a strength similar to what we’ve seen in the satellite record during significant El Niños in 1997 and 2015. We expect it to be big, and it’s already having big impacts.”

El Niños generally scramble weather patterns tied to rainfall and storms, including hurricanes. They also redistribute heat in the ocean, which affects sea level. Normally, Earth’s warmest ocean waters sit along the equator in the western Pacific. During El Niño, weakened winds, which usually blow westward along the equator, result in heat spreading east toward South America. The change in ocean heat shifts hurricane activity from the Atlantic to the Pacific Ocean.

Predicting hurricane strength

On July 15, Sentinel-6B began delivering low-latency data to scientists that could be used for weather predictions. That data will take some time to work its way into the research models on which meteorologists and climate scientists rely, but when it does, those improved models could save lives.

Data from Sentinel-6 satellite missions feeds into hurricane tracking algorithms used by federal and state agencies. Those predictions can activate disaster response efforts, mobilizing resources ranging from sandbag placement to National Guard activation. They also can lead to evacuation orders that require quick but well-informed decisions about logistics at a local level. More severe events may require engaging larger organizations, such as the Federal Emergency Management Agency.

A tropical storm can take a week or more to become a hurricane and make its way to a coastline, but a hurricane can rapidly intensify in the 48 hours prior to landfall, leaving planners little time to prepare.

“Hurricanes have been known to speed up quickly at the last moment, so the window in which to decide what to do is short,” said Deirdre Byrne, an oceanographer and altimetry expert with the National Oceanic and Atmospheric Administration (NOAA). “The goal is to forecast how much and how rapidly intensification will happen so that officials can make the right calls.”

Byrne oversees one of the country’s most crucial hurricane forecasting algorithms, NOAA’s Satellite Ocean Heat Content Suite, which has been operating since 2012.

Each Sentinel-6 satellite measures ocean height, as well as the size of waves and marine wind speed, using a radar altimeter, which bounces thousands of radar pulses a second off the crests and troughs of waves. Ocean height varies from place to place and provides insight into the ocean’s heat content, since warm water expands. That, in turn, helps forecast how fast hurricanes will grow.

The satellites each carry a second instrument, called the Global Navigation Satellite System – Radio Occultation (GNSS-RO), which measures atmospheric properties, such as humidity, pressure, and temperature.

Among the measurements Sentinel-6 is gathering, Byrne is most anticipating the ocean height data, which she plans to begin incorporating into the current Satellite Ocean Heat Content Suite algorithm by the end of the year.

“In terms of data quality, the Sentinel-6 missions are unparalleled,” Byrne said.

Together, the missions are also extending a precise dataset deep into its fourth decade. This record of sea level observations traces back to the TOPEX/Poseidon mission, which launched in 1992, and continues through to the present day with Sentinel-6 Michael Freilich. Sentinel-6B will take over for its predecessor as the reference satellite for global sea level measurements later this year.

“The key is consistency, measuring the same way, every time,” said Severine Fournier, Sentinel-6B deputy project scientist, JPL. “That’s what lets us predict hurricanes, and, in turn, protect coastal communities and infrastructure.”

More about Sentinel-6B

Sentinel-6 Michael Freilich, named after a former director of NASA’s Earth Science Division, is one of two satellites that compose the Copernicus Sentinel-6/Jason-CS mission.

Sentinel-6/Jason-CS, a part of the European Union’s Earth observation program called Copernicus, was jointly developed by ESA (European Space Agency), EUMETSAT (European Organisation for the Exploitation of Meteorological Satellites), NASA, and NOAA, with funding support from the European Commission and technical support on performance from the French space agency CNES (Centre National d’Études Spatiales). Spacecraft monitoring and control, as well as the processing of all the altimeter science data, is carried out by EUMETSAT on behalf of the European Union’s Copernicus Programme, with the support of all partner agencies.

NASA JPL, a division of Caltech in Pasadena, contributed three science instruments for each Sentinel-6 satellite: the Advanced Microwave Radiometer, the GNSS-RO, and the Laser Retroreflector Array. NASA also contributed launch services, ground systems supporting operation of the agency’s science instruments, the science data processors for two of these instruments, and support for the United States members of the international Ocean Surface Topography Science Team.

For more about Sentinel-6B, visit:

https://science.nasa.gov/mission/sentinel-6B

-end-

Media Contacts

Andrew Good / Andrew Wang
Jet Propulsion Laboratory, Pasadena, Calif.
818-393-2433 / 626-379-6874
andrew.c.good@jpl.nasa.gov / andrew.wang@jpl.nasa.gov

2026-060

The post How 2 US, European Satellites Are Studying Hurricanes During El Niño appeared first on NASA Science.
  •  

How 2 US, European Satellites Are Studying Hurricanes During El Niño

5 min read

Preparations for Next Moonwalk Simulations Underway (and Underwater)

Category 5 Hurricane Melissa, one of the most powerful storms to strike the Caribbean in recent history, is pictured about 50 miles south of Jamaica in this photograph from the International Space Station as it orbited 262 miles above the Yucatan Peninsula.
Hurricane Melissa is seen 50 miles south of Jamaica in this photograph taken from the International Space Station on Oct. 28, 2025.
NASA

Last November, NASA and its European partners launched the Sentinel-6B satellite to improve hurricane forecasts, help protect infrastructure, and benefit commercial industries, including shipping. The satellite now is flying 30 seconds behind its predecessor, Sentinel-6 Michael Freilich. Both satellites are providing precise sea level height measurements during what oceanographers expect to be a historic El Niño, a naturally occurring oceanic phenomenon in which warmer-than-usual Pacific waters shift global weather patterns.

The two satellites make up the Copernicus Sentinel-6/Jason-CS (Continuity of Service) mission, the latest in a series of ocean-observing radar altimetry missions that have been monitoring Earth’s changing seas continuously since the early 1990s.

The data each satellite is collecting will not only allow scientists to better understand this year’s El Niño but will also help them create more accurate hurricane predictions.

“This El Niño was a late-bloomer,” said Josh Willis, Sentinel-6B’s project scientist at NASA’s Jet Propulsion Laboratory in Southern California. “It didn’t kick off until the middle of the year and is just now reaching a strength similar to what we’ve seen in the satellite record during significant El Niños in 1997 and 2015. We expect it to be big, and it’s already having big impacts.”

El Niños generally scramble weather patterns tied to rainfall and storms, including hurricanes. They also redistribute heat in the ocean, which affects sea level. Normally, Earth’s warmest ocean waters sit along the equator in the western Pacific. During El Niño, weakened winds, which usually blow westward along the equator, result in heat spreading east toward South America. The change in ocean heat shifts hurricane activity from the Atlantic to the Pacific Ocean.

Predicting hurricane strength

On July 15, Sentinel-6B began delivering low-latency data to scientists that could be used for weather predictions. That data will take some time to work its way into the research models on which meteorologists and climate scientists rely, but when it does, those improved models could save lives.

Data from Sentinel-6 satellite missions feeds into hurricane tracking algorithms used by federal and state agencies. Those predictions can activate disaster response efforts, mobilizing resources ranging from sandbag placement to National Guard activation. They also can lead to evacuation orders that require quick but well-informed decisions about logistics at a local level. More severe events may require engaging larger organizations, such as the Federal Emergency Management Agency.

A tropical storm can take a week or more to become a hurricane and make its way to a coastline, but a hurricane can rapidly intensify in the 48 hours prior to landfall, leaving planners little time to prepare.

“Hurricanes have been known to speed up quickly at the last moment, so the window in which to decide what to do is short,” said Deirdre Byrne, an oceanographer and altimetry expert with the National Oceanic and Atmospheric Administration (NOAA). “The goal is to forecast how much and how rapidly intensification will happen so that officials can make the right calls.”

Byrne oversees one of the country’s most crucial hurricane forecasting algorithms, NOAA’s Satellite Ocean Heat Content Suite, which has been operating since 2012.

Each Sentinel-6 satellite measures ocean height, as well as the size of waves and marine wind speed, using a radar altimeter, which bounces thousands of radar pulses a second off the crests and troughs of waves. Ocean height varies from place to place and provides insight into the ocean’s heat content, since warm water expands. That, in turn, helps forecast how fast hurricanes will grow.

The satellites each carry a second instrument, called the Global Navigation Satellite System – Radio Occultation (GNSS-RO), which measures atmospheric properties, such as humidity, pressure, and temperature.

Among the measurements Sentinel-6 is gathering, Byrne is most anticipating the ocean height data, which she plans to begin incorporating into the current Satellite Ocean Heat Content Suite algorithm by the end of the year.

“In terms of data quality, the Sentinel-6 missions are unparalleled,” Byrne said.

Together, the missions are also extending a precise dataset deep into its fourth decade. This record of sea level observations traces back to the TOPEX/Poseidon mission, which launched in 1992, and continues through to the present day with Sentinel-6 Michael Freilich. Sentinel-6B will take over for its predecessor as the reference satellite for global sea level measurements later this year.

“The key is consistency, measuring the same way, every time,” said Severine Fournier, Sentinel-6B deputy project scientist, JPL. “That’s what lets us predict hurricanes, and, in turn, protect coastal communities and infrastructure.”

More about Sentinel-6B

Sentinel-6 Michael Freilich, named after a former director of NASA’s Earth Science Division, is one of two satellites that compose the Copernicus Sentinel-6/Jason-CS mission.

Sentinel-6/Jason-CS, a part of the European Union’s Earth observation program called Copernicus, was jointly developed by ESA (European Space Agency), EUMETSAT (European Organisation for the Exploitation of Meteorological Satellites), NASA, and NOAA, with funding support from the European Commission and technical support on performance from the French space agency CNES (Centre National d’Études Spatiales). Spacecraft monitoring and control, as well as the processing of all the altimeter science data, is carried out by EUMETSAT on behalf of the European Union’s Copernicus Programme, with the support of all partner agencies.

NASA JPL, a division of Caltech in Pasadena, contributed three science instruments for each Sentinel-6 satellite: the Advanced Microwave Radiometer, the GNSS-RO, and the Laser Retroreflector Array. NASA also contributed launch services, ground systems supporting operation of the agency’s science instruments, the science data processors for two of these instruments, and support for the United States members of the international Ocean Surface Topography Science Team.

For more about Sentinel-6B, visit:

https://science.nasa.gov/mission/sentinel-6B

-end-

Media Contacts

Andrew Good / Andrew Wang
Jet Propulsion Laboratory, Pasadena, Calif.
818-393-2433 / 626-379-6874
andrew.c.good@jpl.nasa.gov / andrew.wang@jpl.nasa.gov

2026-060

  •  

Indonesian volcanic eruption spotted from space | Space photo of the day for Sept. 9, 2026

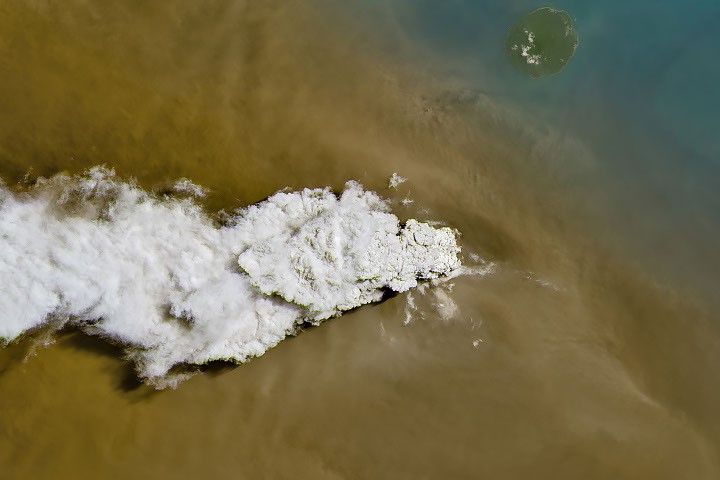
a plume of white-grey smoke rises from a small island, as seen from high overhead

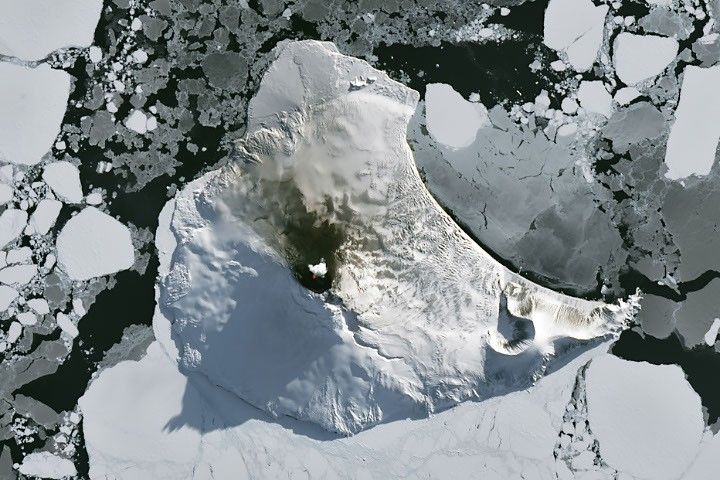
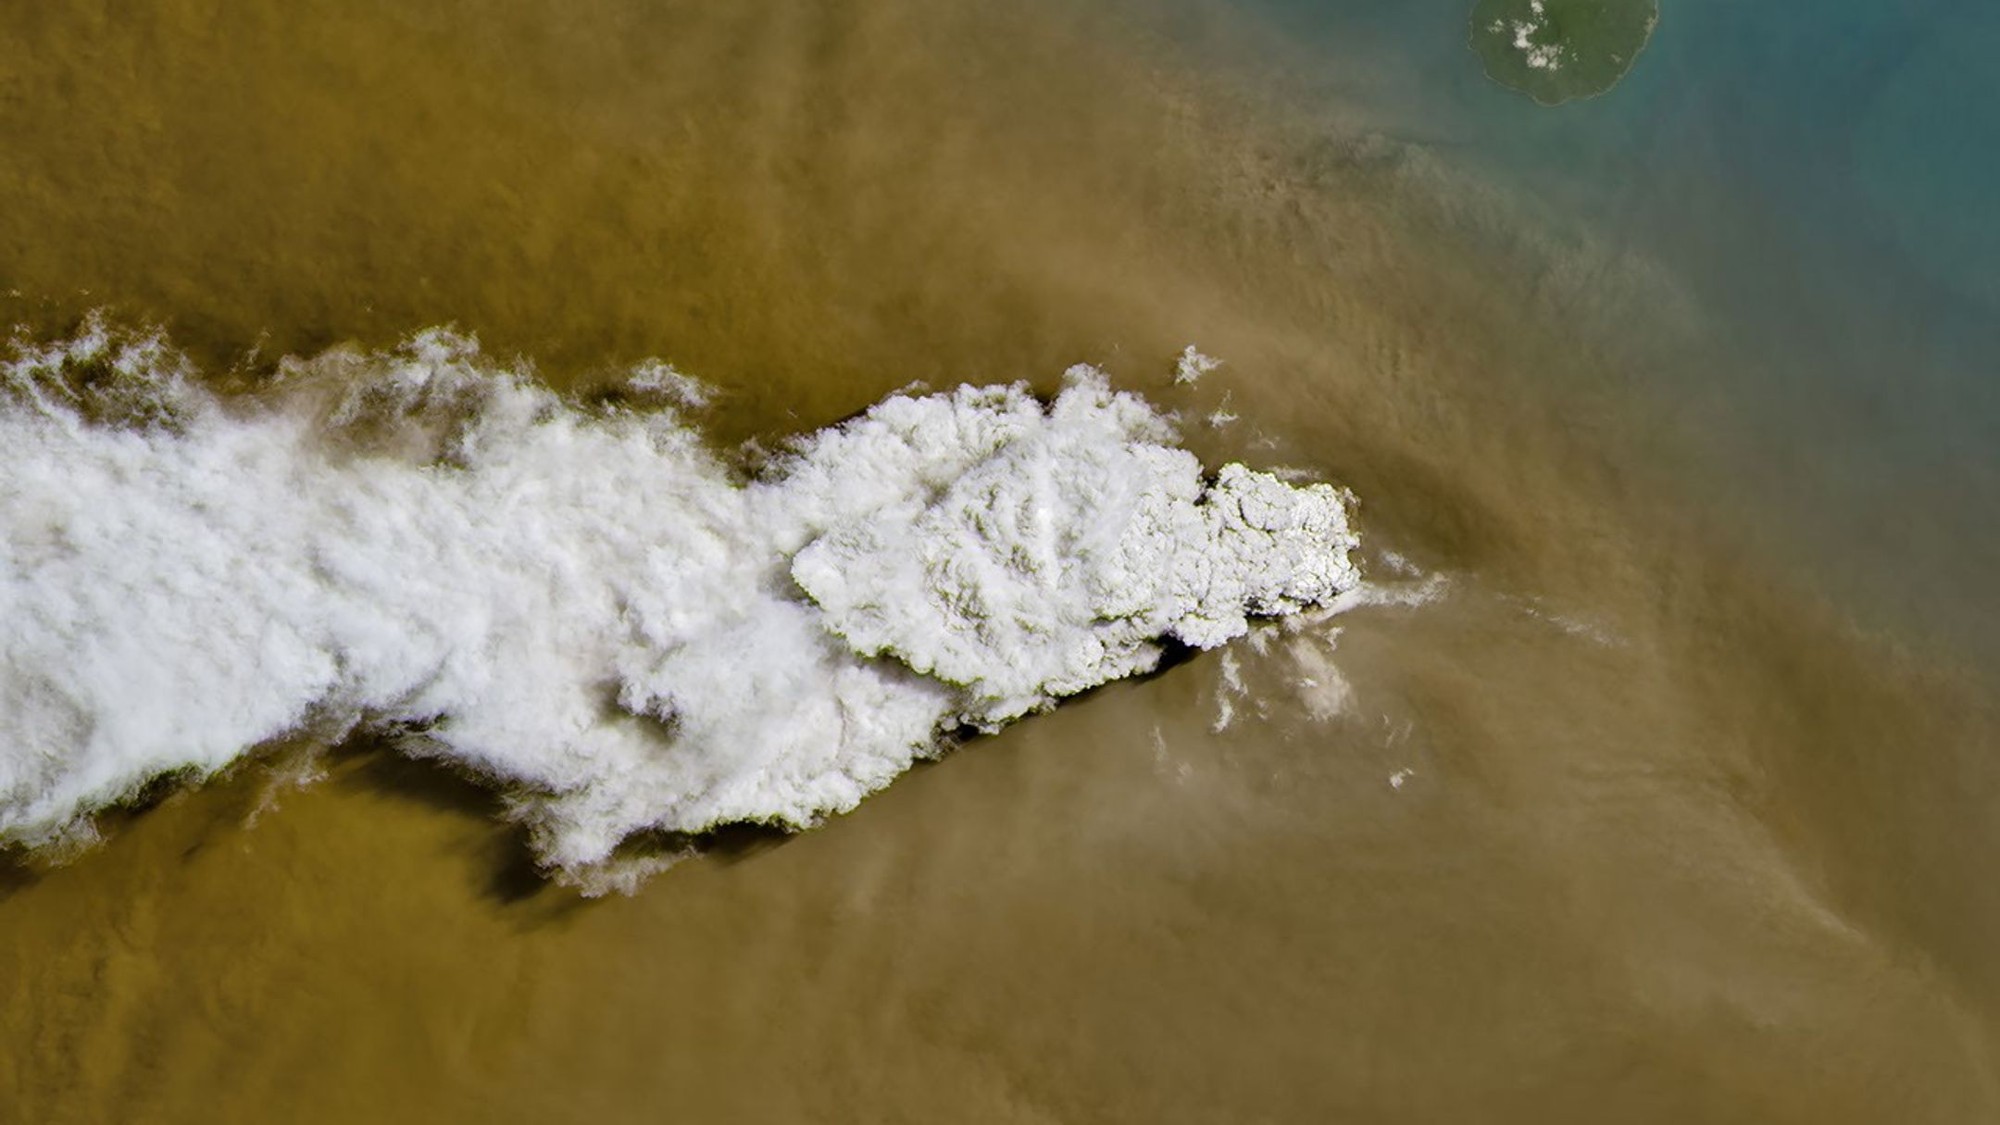
The Anak Krakatau volcano began erupting on Sept. 4, 2026, as seen here on Sept. 5 by the Landsat 8 satellite jointly operated between NASA and the U.S. Geological Survey (USGS) (Image credit: NASA Earth Observatory/Michala Garrison)

A volcano on an Indonesian archipelago began erupting on Sept. 4, and satellites in orbit have been watching closely.

What is it?

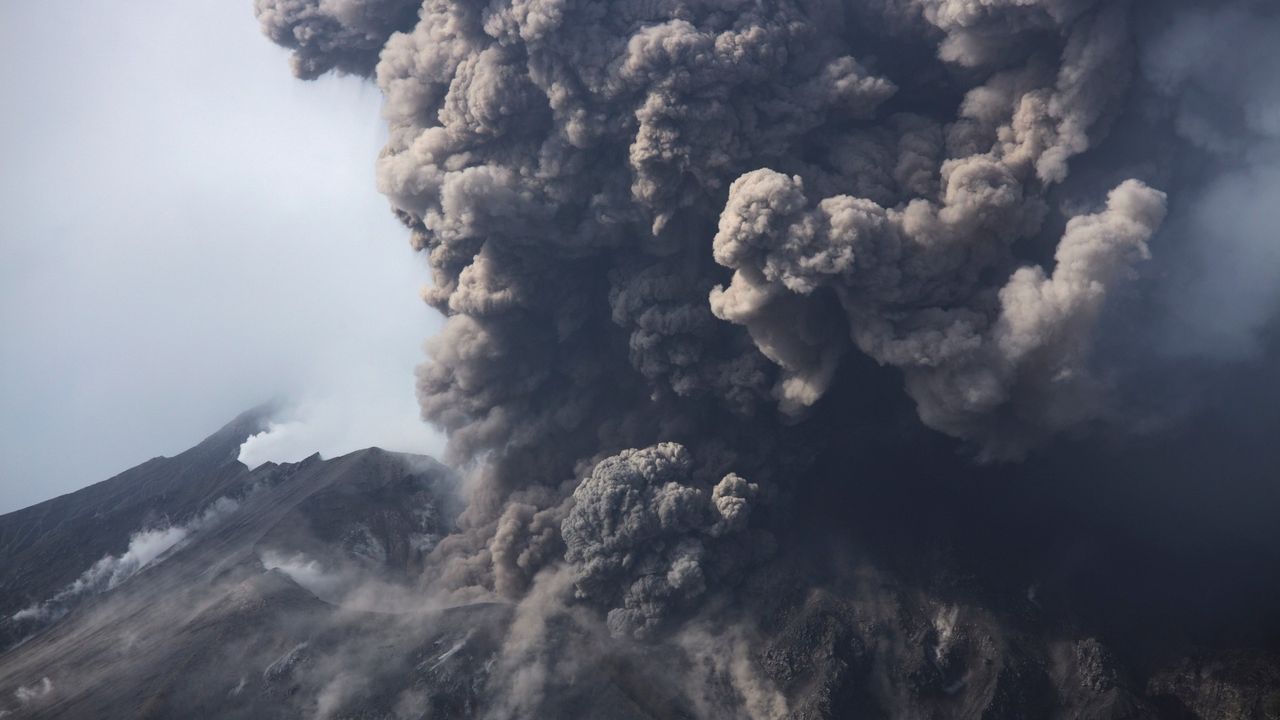
The volcano Anak Krakatau started spitting out ash and lava on Sept. 4. On an archipelago between Sumatra and Java, the island volcano's sudden eruption grounded flights, closed schools and even stopped fishing in the area.

The volcano launched ash into the air and into the city of Jakarta and the Lampung province during a 25-hour-long eruption. But even following this eruption, Anak Krakatau remained active throughout the weekend. In fact, the volcano is still so active that it could erupt again soon.

But it wasn't just people on Earth watching the volcano erupt this past weekend. The Landsat 8 satellite, operated by NASA and the U.S. Geological Survey (USGS), spotted a white plume of volcanic gas billowing into the atmosphere all the way from space. The white plumes of gas are thought to mainly contain water vapor, carbon dioxide and sulfur dioxide, while ash and debris make up the brown clouds surrounding the plumes.

Why is it incredible?

While Anak Krakatau simmers after this most recent eruption, this event isn't a major shock, as the volcano sits in what is known as the "Ring of Fire." This "ring" (a loose term, as it's not exactly a ring) snakes about 25,000 miles (40,000 kilometers) around the Pacific Ocean and includes over 750 volcanoes, some dormant and some active.

In fact, in Indonesia alone there are 500 volcanoes, and 127 of them are active, including Anak Krakatau. And this volcano has a particularly interesting story: It emerged from the sea in 1927, rising from the caldera formed by the 1883 eruption of Krakatau (also known as Krakotoa), which was one of the most famous and destructive volcanic events in history. (Anak Krakatau means "child of Krakatau" in the Indonesian language.)

While not all geologists agree on the exact margins of the Ring of Fire, it rests on a string of tectonic plates and has existed for over 35 million years. And not only is this ring home to hundreds of volcanoes, it's also a hot spot for earthquakes.

  •  

'Drops in the ocean can make waves': How the grassroots climate movement took off in the US

In this excerpt from "The Carbon Wave" (MIT Press, 2026), author Leah Stokes, an associate professor of environmental politics at the University of California, Santa Barbara, looks at a hopeful moment in U.S. politics when climate change took center stage: when Rep. Alexandria Ocasio-Cortez and Sen. Ed Markey ramped up calls for a "Green New Deal."

In September 2017, a still­-unknown Alexandria Ocasio-­Cortez watched as Hurricane Maria devastated Puerto Rico. Electricity went down for months. Like thousands of Puerto Ricans, her grandfather died in the storm's aftermath. She could see how climate change was hitting her community harder than others.

And it wasn't just Ocasio-­Cortez's community: the year before, she'd traveled to Standing Rock, North Dakota, to see firsthand how the fossil fuel industry was harming Indigenous people. It was mere weeks after the 2016 election, and the resistance to Trump had found its center in a makeshift camp along the Missouri River. People had united to oppose an oil pipeline.

Serendipitously, the day after Ocasio-­Cortez left the protest, a progressive organization reached out to ask her to run for Congress. Moved by the activists at Standing Rock, she said yes. In 2018, she ran a long-­shot primary campaign in a Bronx district occupied by a ten-­term congressman in House leadership. Her platform included an idea that some had bandied about before, but no one had developed in earnest: a Green New Deal. As she told journalists that summer, "The Green New Deal we are proposing will be similar in scale to the mobilization efforts seen in World War II or the Marshall Plan. We must again invest in the development, manufacturing, deployment, and distribution of energy, but this time green energy." In June, she won the primary. Her election signaled the beginning of a broader shift: climate change was back on the political agenda.

That fall, the world's leading climate science organization, the Intergovernmental Panel on Climate Change —­ often called the IPCC —­ released a short report concluding that limiting warming to 1.5°C would require emissions to fall by almost half by 2030. The news ricocheted around the world, with headlines like "We Have 12 Years to Limit Climate Catastrophe." In my own neighborhood, someone printed a copy and stuck it in the free lending library, labeling it "important reading." The report changed how many people thought about the problem: it wasn't something we could deal with in 50 years; it was something we had to deal with today.

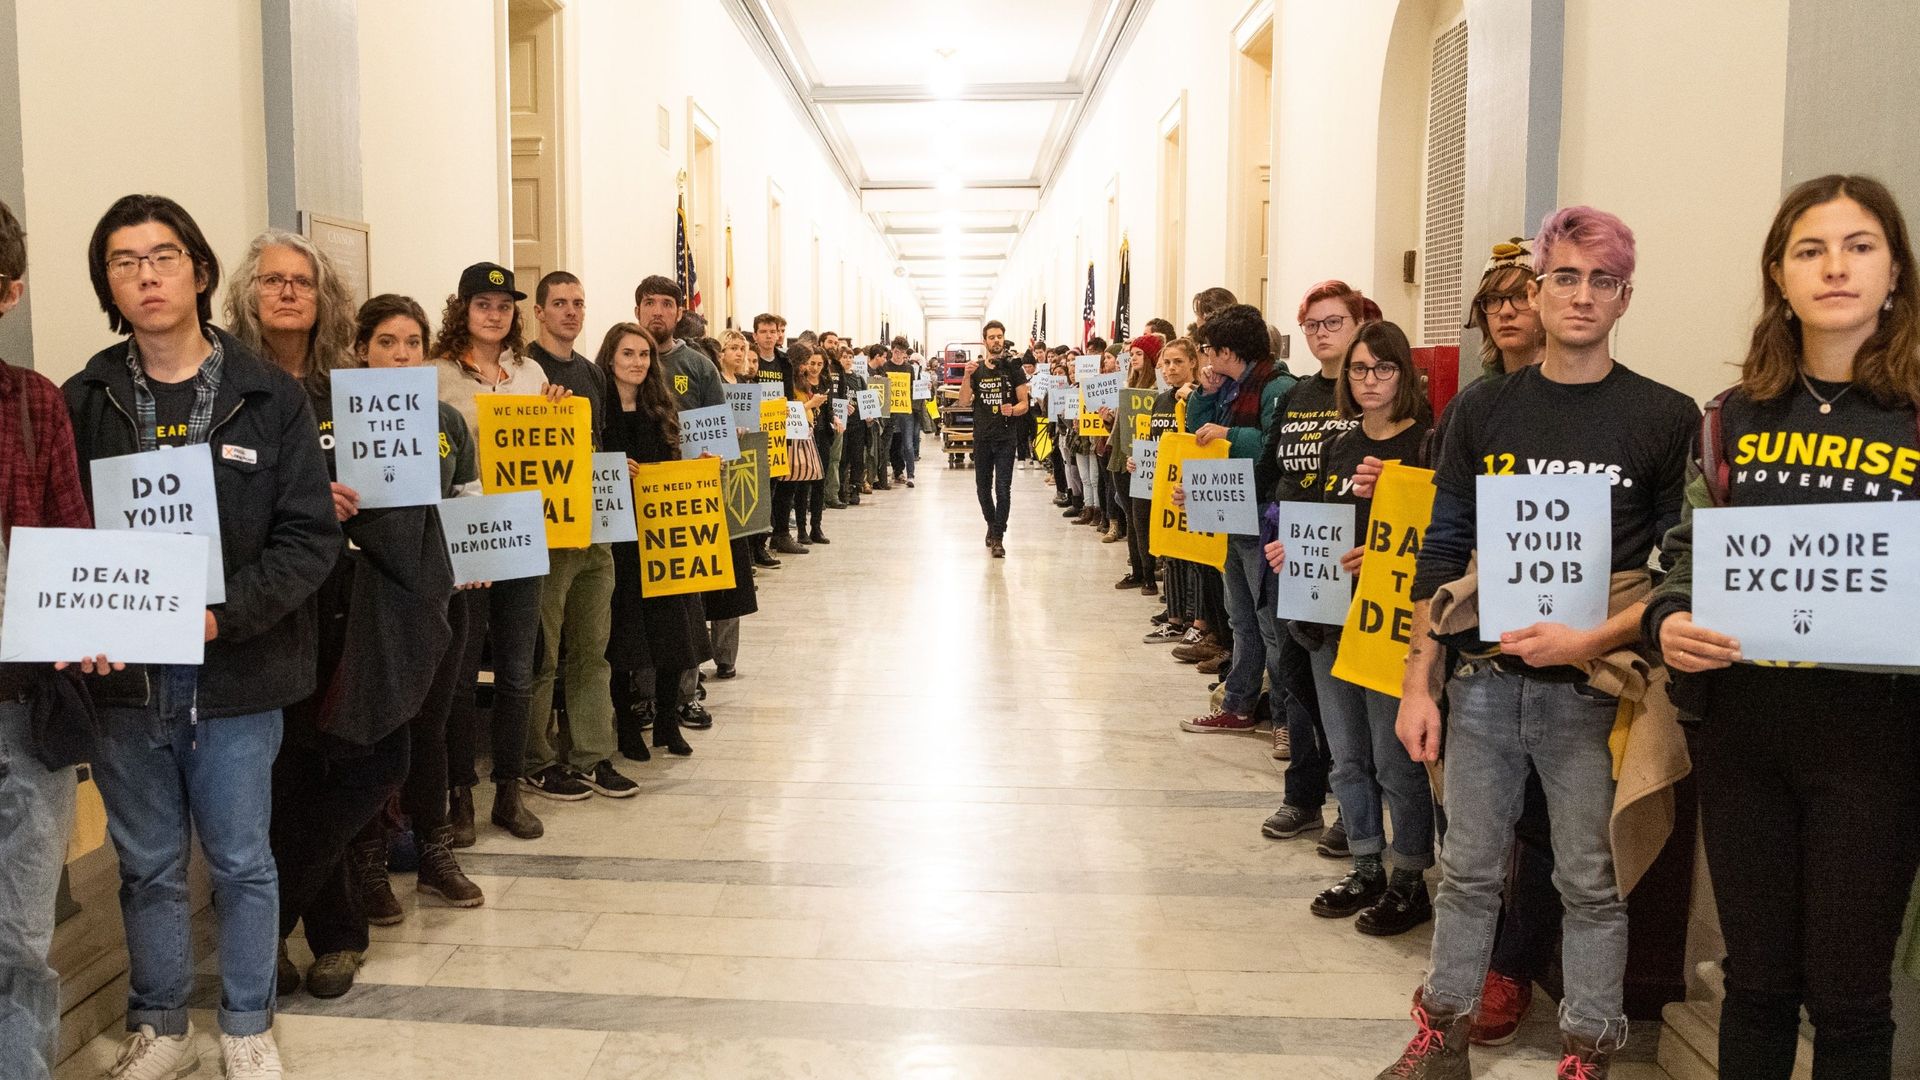
In the November 2018 midterm elections, two years into the first Trump administration, Democrats won big, paving the way for Nancy Pelosi to return as Speaker of the House after eight years as the minority leader. Days later, a group of young activists from the Sunrise Movement staged a sit-in at her office. Their bright yellow and­ black signs read "We have 12 years. What’s your plan?" referencing that scientific report.

protestors lining a hall with placards in the US Capitol building

Protestors from the Sunrise Movement in the office of former U.S. Representative Nancy Pelosi supporting the Green New Deal. (Image credit: SOPA Images/Getty Images)

Newly elected Representative Ocasio-­Cortez joined the action that day. She told the organizers they needed a clear ask and encouraged them to call for a Green New Deal. The idea broke through, sparking widespread coverage across the country. It was a new, hopeful vision for climate policy. These young people were not just talking about the climate disasters we needed to avoid —­ they were explaining how investments in clean energy could create good jobs. They were showing us the better world we could build together. If we only tried.

I watched these developments unfold in DC from my office by the Pacific Ocean and wanted to be a part of it. I wouldn't have to wait long. The Green New Deal held a force like gravity, pulling people into its orbit. By chance, I met some of the people tied to Ocasio-­Cortez at a conference and was invited to an early gathering to develop the idea into more detailed policy. By then, she'd released a framework for the plan with Senator Ed Markey of Massachusetts.

The meeting was held in March 2019, at a hip hotel in DC's Adams Morgan neighborhood, miles away from the Capitol. A wide swath of people were invited: youth activists, environmental justice leaders, political organizers, think tank wonks, and a few academics like me. It was a contentious meeting that opened with a protest, revealing fissures in the movement that would eventually grow into large cracks. Some people believed that frontline communities facing the greatest pollution burdens were not being adequately consulted or invited to participate in the event. At the time, I didn't understand these dynamics between the climate and environmental justice movements. I was just a political science professor trying to understand how I could make my work more practical and help get a climate law passed if we got the chance.

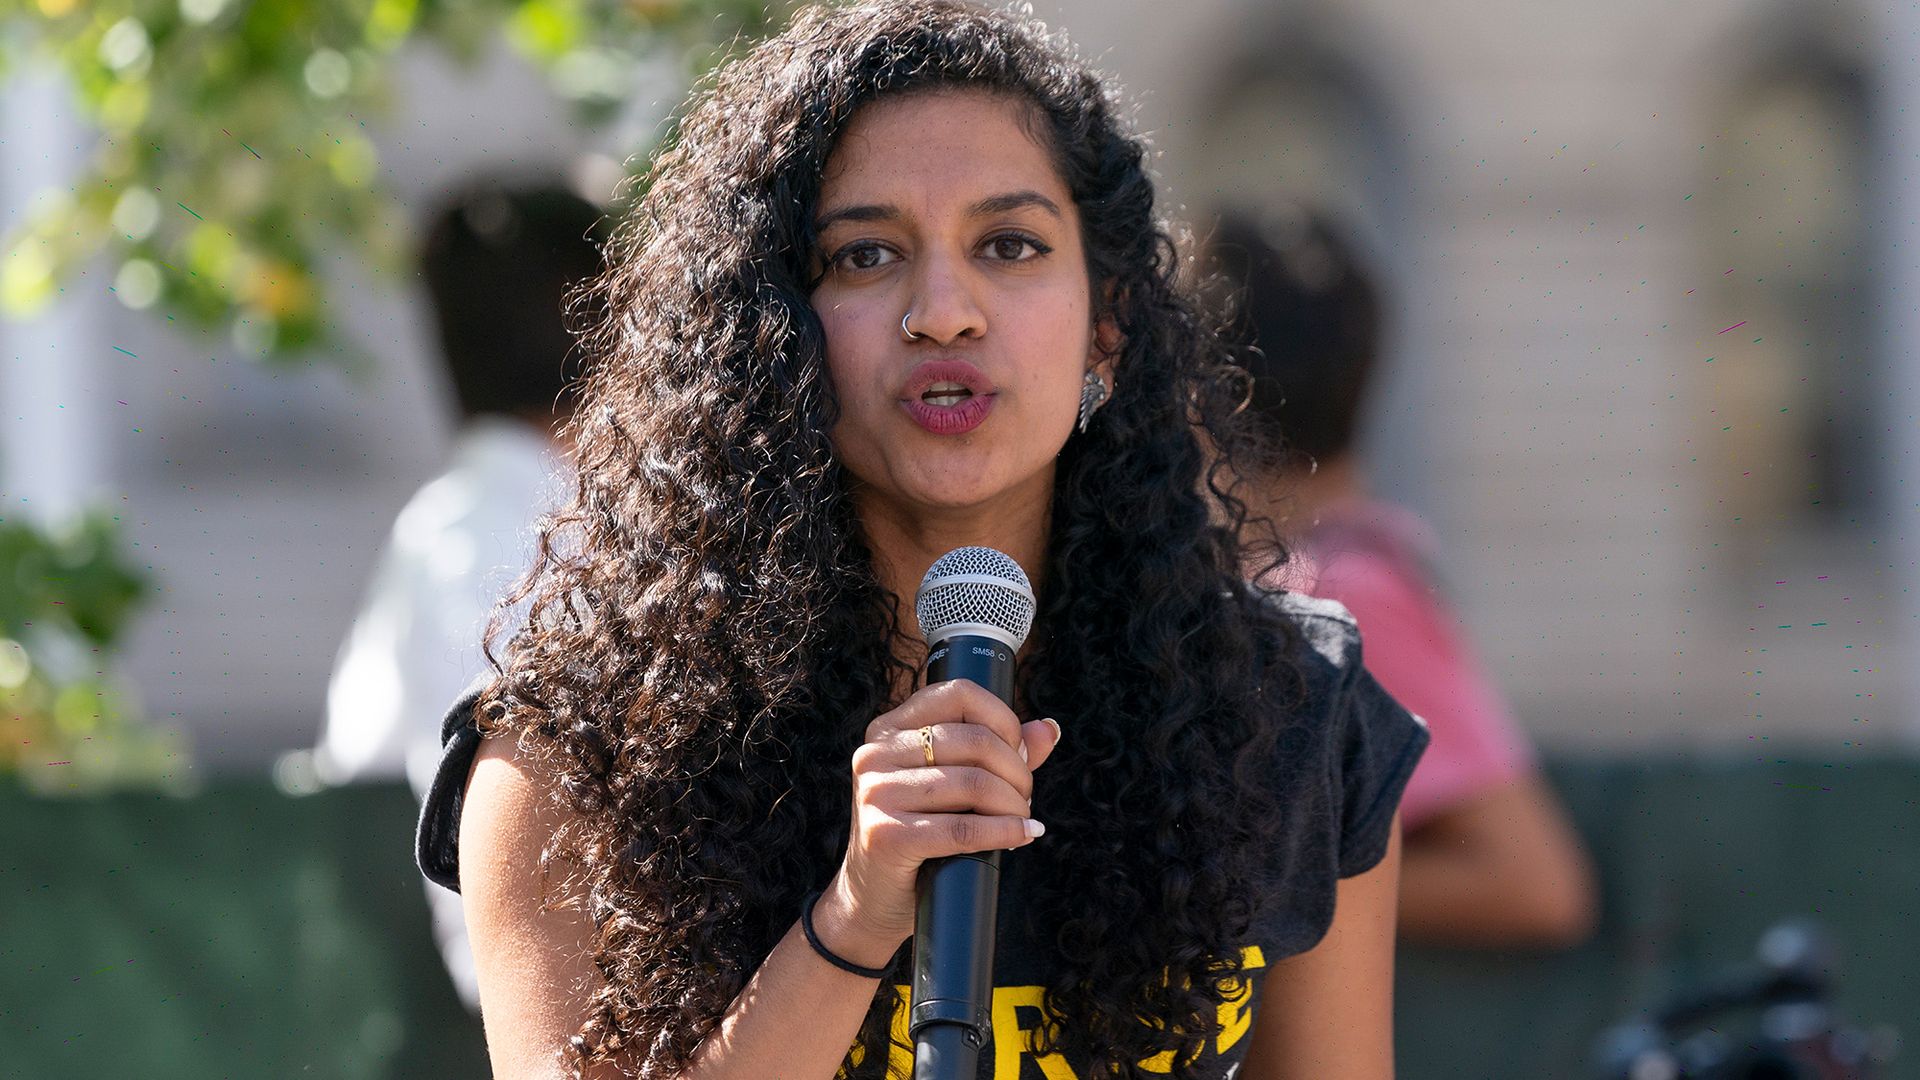
A woman with dark curly hair speaks into a microphone.

Varshini Prakash speaking during a Climate Strike rally in New York Citiy in 2019. (Image credit: Pacific Press via Getty Images)

It was at that event that I met Varshini Prakash, the executive director of the Sunrise Movement. I’d seen her photo many times, standing in the middle of Pelosi's office with her dark red jacket over a black­ and yellow T-­shirt, surrounded by young people sitting on the floor. Four months had passed since the sit-­in, and Varshini had ricocheted to the center of the climate movement. But she was also a recent college grad in her mid-­twenties, feeling a heavy burden from the climate crisis and the work involved in fighting it. At one point during the meeting, she spoke frankly about the stress that was on her and other young activists and cried. I found her vulnerability moving.

The fact was, Varshini had already changed history. She'd given me, and millions of others, a sense of hope and possibility. It was her actions, alongside all the other organizers in the Sunrise Movement, that brought us together in that first DC convening, and in countless other meetings to come. She inspired me to believe that I could do something bigger if I tried.

Too often, the way we think about cause and effect is simplistic. We're fed a linear model that favors the immediate. One person is responsible for their own carbon footprint. One person only has one vote. One person can only do so much. From this perspective, standing against more than a century of fossil fuels running through the heart of our society, it can feel like there's nothing we could do to shake the system loose. We're too small. Mere drops. But drops in the ocean can make waves.

Excerpted from The Carbon Wave: A Story of Democracy, Parenthood, and the Race to Protect Our Planet by Leah C. Stokes. Reprinted with permission from The MIT Press. Copyright 2026.

Help us improve Live Science Pro: We're always trying to make our content better. Leave us feedback about Pro here.

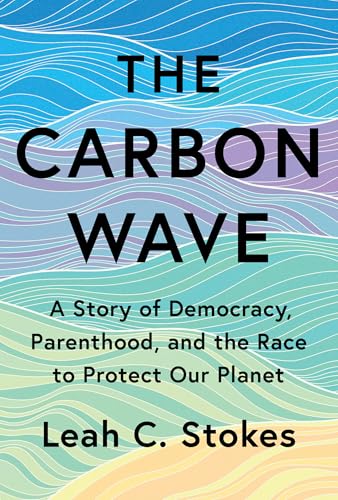
The Carbon Wave: a Story of Democracy, Parenthood, and the Race to Protect Our Planet

MIT Press
The Carbon Wave: a Story of Democracy, Parenthood, and the Race to Protect Our Planet

Interlacing personal narratives with stories from Congress, the White House, and outside activists, Stokes shows how dogged perseverance and collective action can still bend the course of history. The book concludes with an update from the second Trump administration, explaining the parts of the bill that were—and were not—rolled back, and why we should remain hopeful that progress is still being made.

  •  

Where on Earth is safest from global catastrophe?

In the event of a global catastrophe, such as a nuclear war, an enormous volcanic eruption or large asteroid strike, the best place to be is Australia, according to a new study.

Researchers looked at the places that were most resilient to global catastrophic risks, which are events that would kill more than 10% of the global population over several months or years.

"These kinds of catastrophes are under-researched" because they are not very likely, study first author Florian Ulrich Jehn, a researcher at FernUniversität in Hagen, Germany, told Live Science. "That makes them easy to ignore."

But they are still possible — and no country would be unaffected if they occurred, he said. And some places are more vulnerable than others.

In the new study, published Aug. 23 in the journal Global Challenges, researchers analyzed studies across a variety of disciplines such as food security, biological weapons, and volcanism, to identify potential global catastrophic risks and the factors that helped communities to endure them in the past or on a smaller scale. They also brought in subject experts to add discipline-specific papers to their database.

The team identified three broad types of risk: events that would block out sunlight, such as nuclear war or a huge volcano explosion); events that destroy global infrastructure, such as a geomagnetic storm or massive cyber attack; and biological hazards, such as natural or human-caused infectious diseases that would kill much of the population.

These events, the authors wrote, would have significant and long-lasting global consequences. Many would result in global famine from crops failing and trade networks falling apart. "The food system is often the thing that gets you," Jehn said.

A trade-off of risks

The team identified characteristics that made countries more resilient to catastrophe and better able to feed their inhabitants. And while "no single place on Earth" would be resilient against all catastrophic risks, the authors wrote, some would fare better than others.

The team found that wealthier countries and regions with a strong industrial base that are not highly reliant on global trade are better able to weather global disasters.

With a strong industrial base, countries are able to manufacture goods that they cannot import, making them more resilient.

Geography also plays a role. Large islands have an advantage over continents because they can easily isolate, but they also need to have an economy that can at least partially support itself, the researchers said. If an island is highly reliant on international trade, like Japan, it will struggle if global trade networks are disrupted, the study found.

Certain countries and regions are less resilient in the face of some types of catastrophes, even if they are wealthy. For example, countries with nuclear capabilities, such as the U.S., the U.K., France, Israel, Russia, Pakistan, and India, are more at risk of being involved in nuclear war. This makes the Northern Hemisphere, where NATO countries are situated, more vulnerable to nuclear attack than places in the Southern Hemisphere.

There are also fewer volcanoes in the southern half of the globe, while the Southern Hemisphere has more ocean to act as a climate buffer, making countries there more resilient to a huge volcanic eruption, the study found.

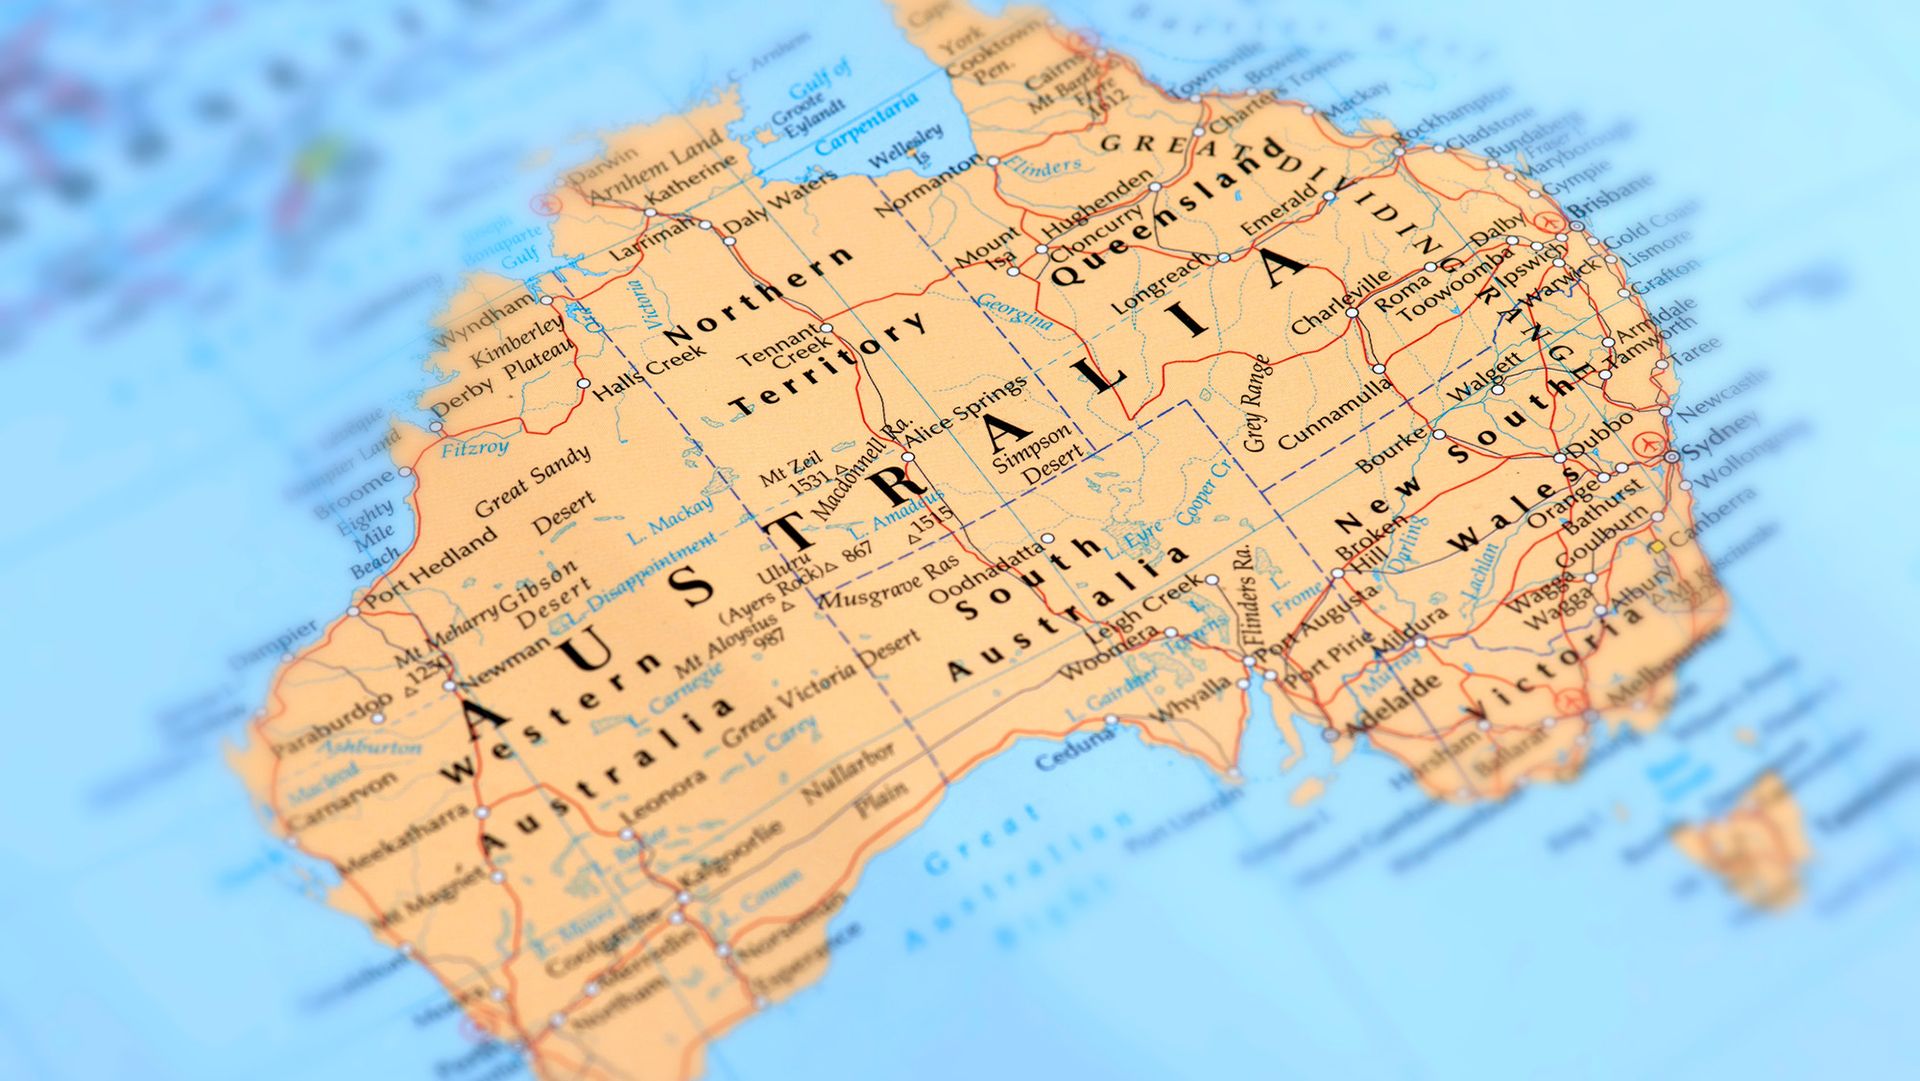
A map of Australia

Findings showed Australia is the best place to survive an apocalyptic event. (Image credit: omersukrugoksu via Getty Images)

Global resilience

There are some factors that make all countries better able to endure disasters in general, such as democratic processes and equality, Jehn said.

"When these catastrophes happen, you have to make the right decisions, and this depends on whether your country has functional governance," Jehn said. "Inequality makes governance worse, because it leads to things like elite rivalries, or less state capacity."

Australia came out as the best location to weather a catastrophic event that decimated global populations. It is in the Southern Hemisphere, so far away from the most likely location of a nuclear conflict (although the authors warn that it is allied with the U.S., which might increase its risk exposure). It is a major food producer, with diverse climatic zones, and has significant energy infrastructure.

Next best spots are Argentina, Brazil and New Zealand. New Zealand ranks lower than Australia because it has active volcanoes, a small industrial base, and is surrounded by water and vulnerable to tsunamis. Meanwhile, Brazil and Argentina have high levels of inequality and historical political instability, the authors wrote.

They also note that Iceland was a contender for a safe refuge, but its location in the far north makes it vulnerable to temperature shocks if a major incident were to block out sunshine.

The U.S. is not particularly well-placed to weather a global catastrophe, the study found. The country is exposed to the threat of geomagnetic storms because of its location and to nuclear war. The authors also pointed to the country’s poor COVID-19 outcomes, which appeared to be due to "a lack of political will and poor social cohesion."

David Denkenberger, director at Alliance to Feed the Earth in Disasters (ALLFED) and a researcher at the University of Canterbury in New Zealand, told Live Science that the new study aids our understanding of future risks by considering a wider range of catastrophes.

"No country is resilient to every catastrophe, and this is an important central finding," he said. "A useful next step would be to quantify the relative likelihood and severity of different catastrophes, and the importance of different resilience factors, because these factors can involve significant trade-offs," said Denkenberger, who has previously collaborated with Jehn but is not an author on the paper.

How to be more resilient

Even though these global catastrophes are unlikely, it is important to include them on national risk registers and have international trade agreements in place in case they come to pass, Jehn said. "When global catastrophes happen, then you would likely have to restructure the food system — where it is produced, where it is traded," he said. "The chance to find a good compromise after the catastrophe has happened seems slim."

Denkenberger echoed his comments. The study, he said, "makes it clear that regional resilience to global catastrophic risk requires investment in practical preparedness, including food-system resilience, critical infrastructure, coordinated trade and governance."

  •  

Arctic warming fuels 2 distinct climate regimes in Siberia that could wake up a methane 'sleeping giant'

Two distinct climate regimes that could trigger runaway methane emissions are emerging in Siberia due to Arctic warming, new research suggests.

While western Siberia is becoming wetter in response to rising heat and moisture transported from the North Atlantic Ocean, eastern Siberia is getting drier and more prone to wildfires, a study published Aug. 6 in the journal Science finds. The Yenisei River (also spelled Yenisey) in central Russia delineates the separate environmental states — referred to as regimes because they describe specific types of climates — on each side of the basin, the study authors said.

Between 2010 and 2023, methane emissions from Siberia rose by 5% per year, with western Siberia releasing methane mainly via microbial activity in thawing soils and eastern Siberia discharging the powerful greenhouse gas through biomass burning, the results showed.

"Given the observed increases in permafrost thaw, wetland activity, and wildfire occurrence, an increase in methane emissions was expected," study co-author Paul Palmer, a professor in the School of Geosciences at the University of Edinburgh, told Live Science in an email. "What is surprising is how large and sustained the increase appears to be."

Annual methane emissions grew by about 13.2 million tons (12 million metric tons) over the study period, almost mirroring the rate of increase in methane emissions from wetlands worldwide. Although Siberia currently makes up only about 5% of global methane emissions, the region is becoming one of the fastest-growing natural methane sources on the planet, Palmer said.

In their study, Palmer and his colleagues integrated satellite observations with near-surface measurements to map methane emissions from Siberia over time. Instead of adding up individual methane sources on the ground, the researchers used a modeling method known as a methane flux inversion system, which helped them limit the uncertainty in their estimates to roughly 10%.

Siberia is vast, remote, sparsely instrumented and currently inaccessible for many scientists due to the Russia-Ukraine war, making it hard to monitor methane consistently by any means other than satellites. Although satellites rely on sunlight, of which Siberia gets very little in the winter, most methane emissions are thought to occur in the spring and summer, when Siberia gets more sunlight, Palmer said.

The results of the study show that Arctic warming amplifies methane emissions via distinct pathways in western and eastern Siberia because the regions are influenced by different climate patterns. The researchers also used climate models to predict future methane emissions from Siberia and found that additional warming could unleash millions of tons of greenhouse gases stored in forests and permafrost, which would further accelerate the warming trend.

In western Siberia, methane is released mainly from permafrost, or ground that has stayed frozen for at least two consecutive years. Siberia holds 46% of the Northern Hemisphere's permafrost, and this icy sediment traps vast amounts of carbon that have accumulated for thousands of years, Palmer said.

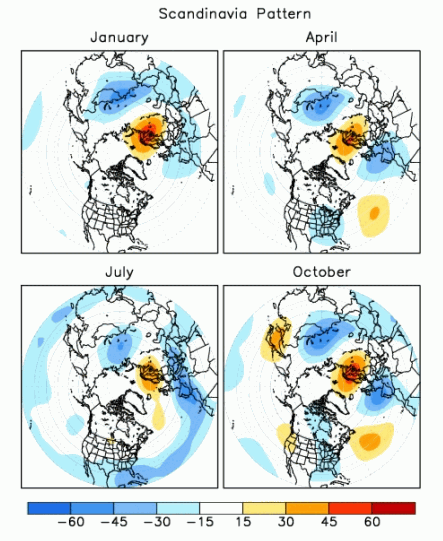
Western Siberia is influenced by the Scandinavian pattern of atmospheric circulation, a climate connection that consists of a main circulation center over Scandinavia and opposing weaker centers over Western Europe and eastern Russia. Global warming makes the Scandinavian pattern transport more warmth and moisture to western Siberia from the North Atlantic. Together with soaring temperatures in western Siberia itself, this triggers extensive permafrost thaw and unlocks carbon that microbes can convert into methane.

Maps showing a climate pattern known as the Scandinavian pattern of atmospheric circulation.

The Scandinavian pattern of atmospheric circulation (seen here in the positive phase) consists of different pressure systems above Scandinavia, Western Europe and eastern Russia/western Mongolia. (Image credit: NOAA)

Conversely, eastern Siberia is influenced by a climate pattern known as the Arctic Oscillation, which causes atmospheric air pressure to "seesaw" between the Arctic and the Northern Hemisphere's middle latitudes. Climate change affects the Arctic Oscillation, leading to persistent high-pressure systems that intensify heat waves, reduce cloud cover and promote wildfires in eastern Siberia, Palmer said.

The climate models showed that methane emissions will increase with temperature rise and that the increase could become steeper the hotter the world gets, triggering a feedback loop.

"Eastern Siberia appears to be the main driver of the projected increase because it is warming faster than western Siberia and has seen a sharp rise in extreme wildfires," Palmer said. "Whether that trend continues will depend on how much vegetation remains available to burn, but there is also evidence that fires may be accelerating permafrost thaw and the release of methane from previously frozen ground."

However, the rise in methane emissions reported in the study is small relative to global and projected future emissions, especially if wildfires are already destabilizing eastern Siberia's permafrost, Palmer said.

"Siberia's vast permafrost carbon store is a sleeping giant," he said. "Continued warming risks waking up a much larger source of greenhouse gases."

  •  

Let’s learn about humanmade seismic waves

In August 2023, some 70,000 people flocked to a stadium in Inglewood, Calif., for a Taylor Swift concert. During the show, dancing fans shook the stadium so hard that it created ground vibrations called seismic waves. During one song, those tremors released about as much energy as a minor earthquake.

Many natural events — including earthquakes and volcanic eruptions — make seismic waves. But a lot of human activity does, too. The thunderous excitement of that Taylor Swift show was just one case of humanmade vibrations.  

Other performances have also created such “concert tremors.” The roaring crowds at NFL games can rattle Earth, too. In fact, some scientists have used the trembling of the Seattle Seahawks’ stadium in Washington to test out earthquake sensors. Mining, traffic and other activities generate their own vibrations.

On the flip side, big events that stop people in their tracks can lead to seismic quieting. Global lockdowns during the COVID-19 pandemic cut the amount of humanmade seismic noise in half in some places. Likewise, ground vibrations fell quiet in cities that witnessed a total solar eclipse in April 2024.

Studying humanmade seismic waves is useful for a few reasons. It can help engineers construct safer buildings. City planners can better understand how and where people move during big events. And scientists can learn how to filter humanmade noise out of seismic data. That way, they can get a clearer view of those natural sources of seismic waves.

Want to know more? We’ve got some stories to get you started:

Earthquake sensor: Taylor Swift fans ‘Shake It Off’ Scientists determined dancing fans were behind the seismic waves recorded during Swift’s concerts. (5/3/2024) Readability: 7.7

Ground-thumping cheers help scientists Eager to test new sensors before the next ‘big one,’ earthquake scientists make use of a predictable source of ground-shaking: football fans. (8/14/2015) Readability: 7.4

Explainer: Seismic waves come in different ‘flavors’ When Earth begins to rock and roll and shimmy, it’s important to know what the various types of shakes mean. (1/12/2018) Readability: 7.7

If everyone on Earth jumped at the same time, could they make our planet move? BBC Earth Science explores.

Explore more

Scientists Say: Seismology

Let’s learn about earthquakes

Seismic data captured the sound of awe during a solar eclipse (from Science News)

COVID-19 lockdowns dramatically reduced seismic noise from humans (from Science News)

Deeply plowing farm fields can do more harm than good

Mystery solved: Why earthquakes haven’t wrecked Egypt’s Great Pyramid

Earth farts may explain some spooky floating lights

Analyze This: Where are U.S. earthquakes most likely?

What can ‘silent earthquakes’ teach us about the next Big One?

Activities

Scientists study ground shaking caused by earthquakes using seismographs. Want to see how they work? Try building your own with a cardboard box, a marker and some string, in an activity from Science Buddies. 

Word find

  •  

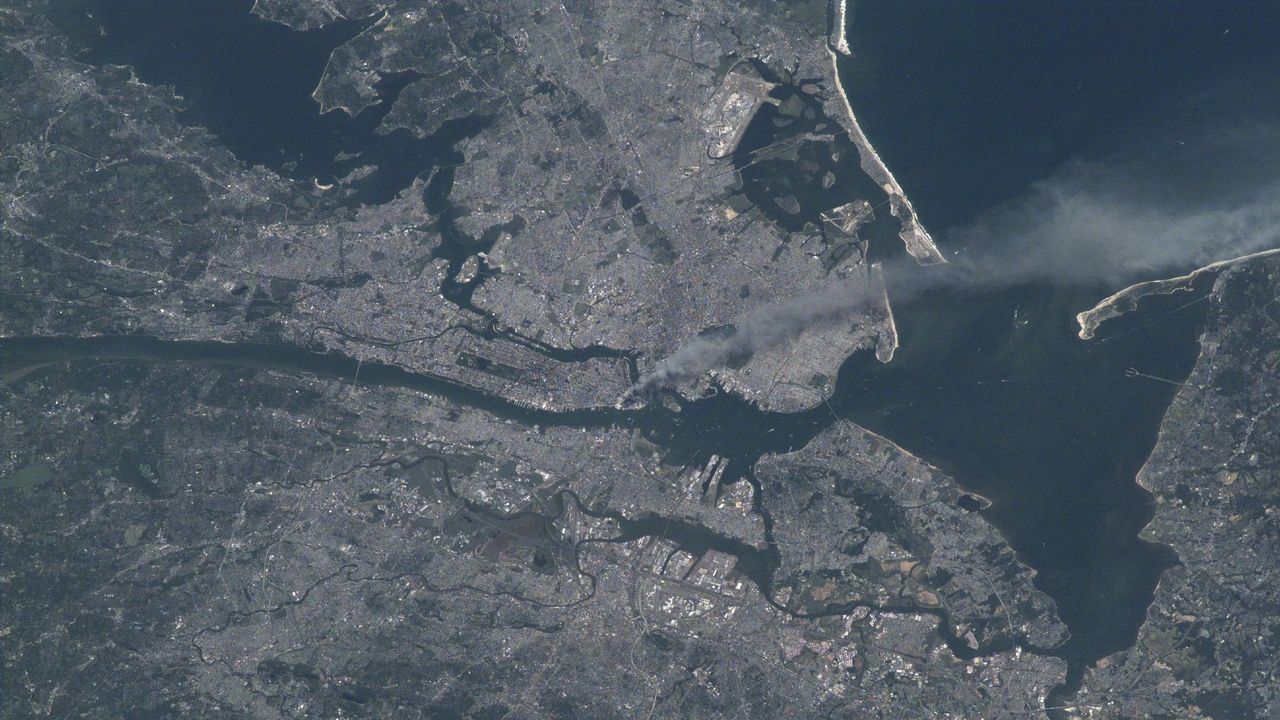
25 years ago, a NASA astronaut captured this haunting photo of the 9/11 attacks — Earth from space

QUICK FACTS

Where is it? New York City, NY [40.71113953, -74.01078602]

What's in the photo? A massive plume of smoke blowing from Manhattan in the wake of 9/11

Who took the photo? NASA astronaut Frank Culbertson, on board the ISS

When was it taken? Sept. 11, 2001

This iconic photo, captured by an American astronaut on board the International Space Station (ISS), shows a lengthy trail of thick smoke pouring across New York City in the immediate aftermath of the 9/11 attacks. A quarter of a century later, the image is as haunting as ever.

On the morning of Sept. 11, 2001, members of the terrorist group al-Qaeda hijacked four passenger airliners and crashed two of them into the twin towers — a pair of 110-story skyscrapers at the heart of the World Trade Center in lower Manhattan. The impact of these collisions, which occurred roughly 17 minutes apart, eventually caused both buildings to collapse.

Shortly after the second tower was hit, the third hijacked plane crashed into the Pentagon, the headquarters of the Department of Defense in Arlington, Virginia. Another attack — likely intended for Washington, D.C. — was thwarted when the passengers of a fourth plane fought back against their hijackers, causing the aircraft to crash near Shanksville, Pennsylvania. In total, 2,977 people were killed across the different attacks, according to the 9/11 Memorial and Museum.

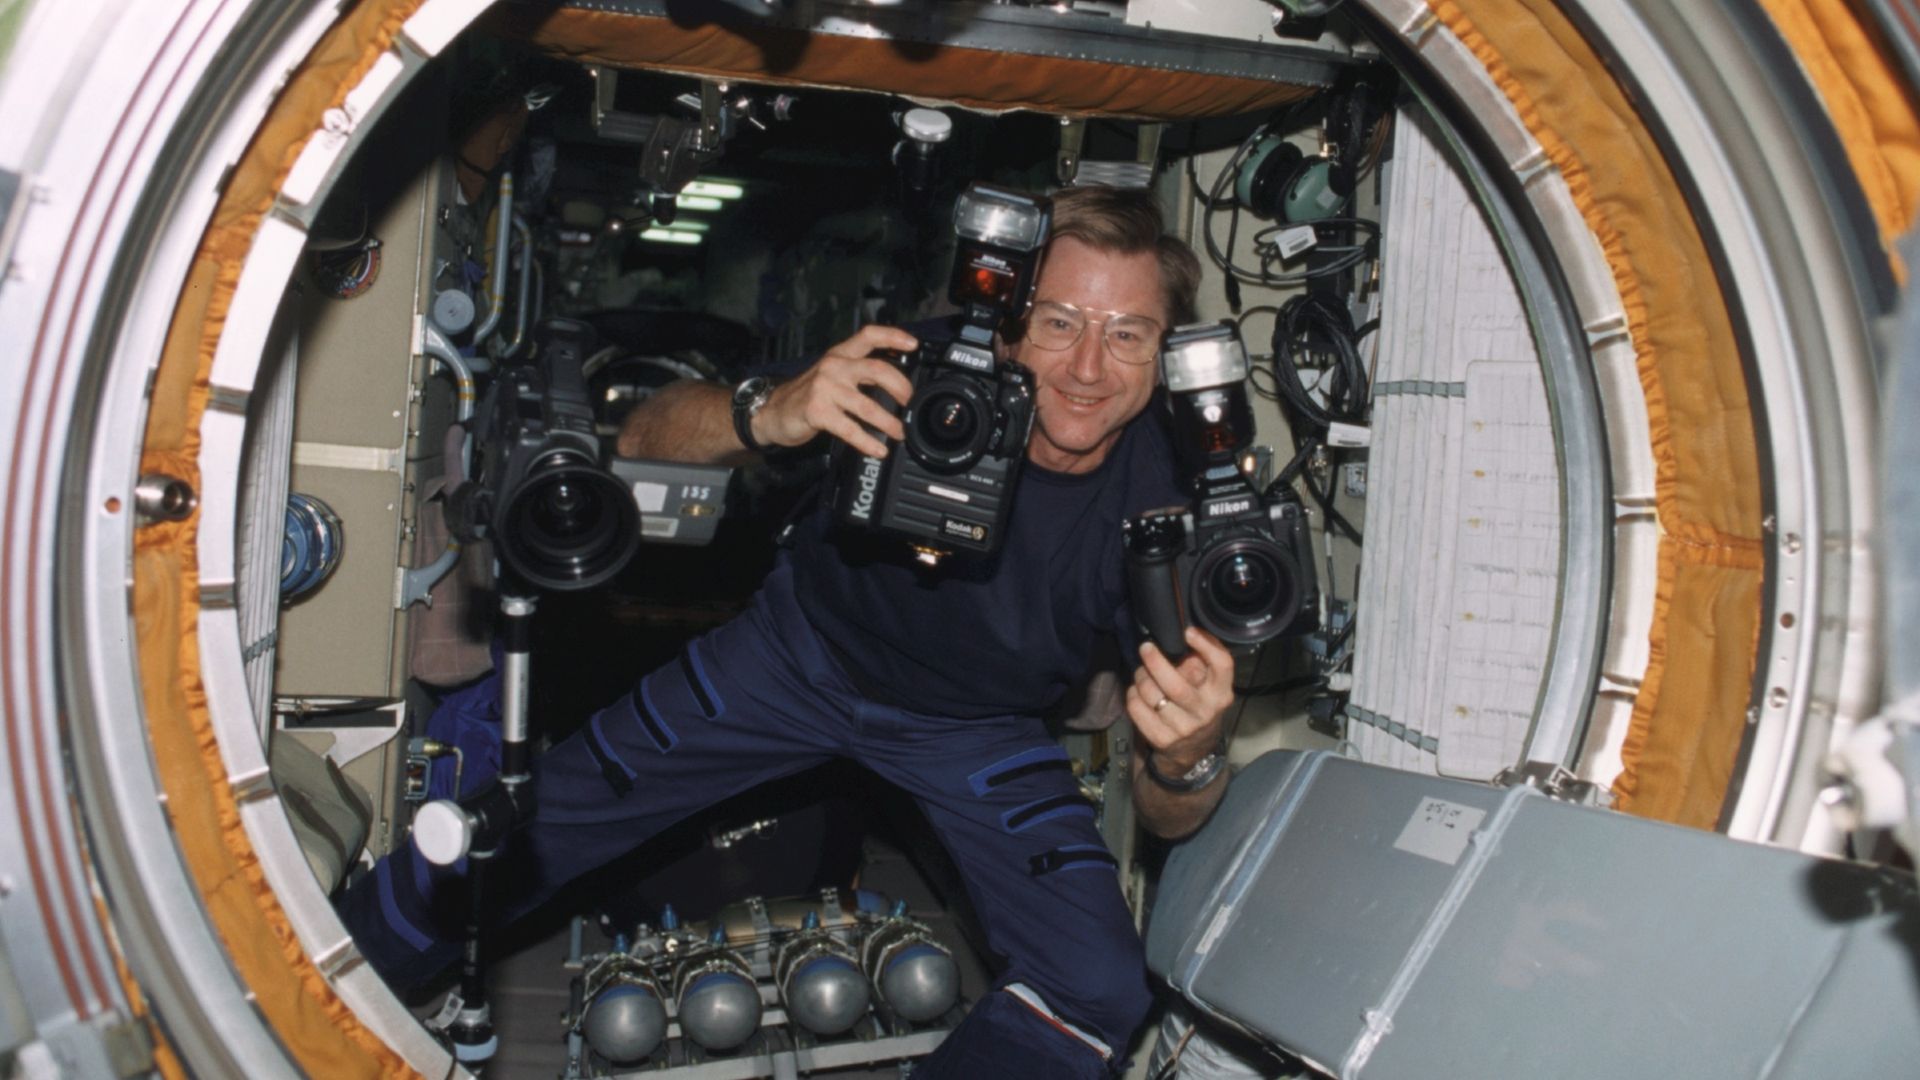
NASA astronaut and ISS commander Frank Culbertson — the only American not on Earth at the time of the attacks — passed over New York City shortly after being told about what was happening back home. He photographed the thick plume of smoke blowing away from Manhattan, at an altitude of roughly 250 miles (400 kilometers) above Earth's surface.

If you look closely, you may be able to see what Culbertson described as an "odd bloom" around the base of the column of smoke rising from the towers. This is likely a sign that the image was captured "around the time of, or shortly after, the collapse of the second tower," Culbertson said.

Astronaut Frank Culbertson holding two cameras while floating in zero gravity on the International Space Station in 2001

NASA astronaut and ISS commander Frank Culbertson captured the aftermath of 9/11 from space. This photo, taken Sept. 17, 2001, shows him holding his cameras in zero gravity. (Image credit: NASA)

Culbertson wrote several letters in the days following the attacks, sharing his unique perspective of the events. "It's horrible to see smoke pouring from wounds in your own country from such a fantastic vantage point," Culbertson wrote on Sept. 13. "The dichotomy of being on a spacecraft dedicated to improving life on the earth and watching life being destroyed by such willful, terrible acts is jolting to the psyche."

While in space, Culbertson learned that the pilot of the plane that was later hijacked and crashed into the Pentagon was his former flight school classmate Charles "Chic" Burlingame. When the ISS later passed over the Pentagon, the astronauts could see the large gash in the side of the building where the third plane had crashed. "Tears don't flow the same in space," Culbertson wrote while discussing his friend.

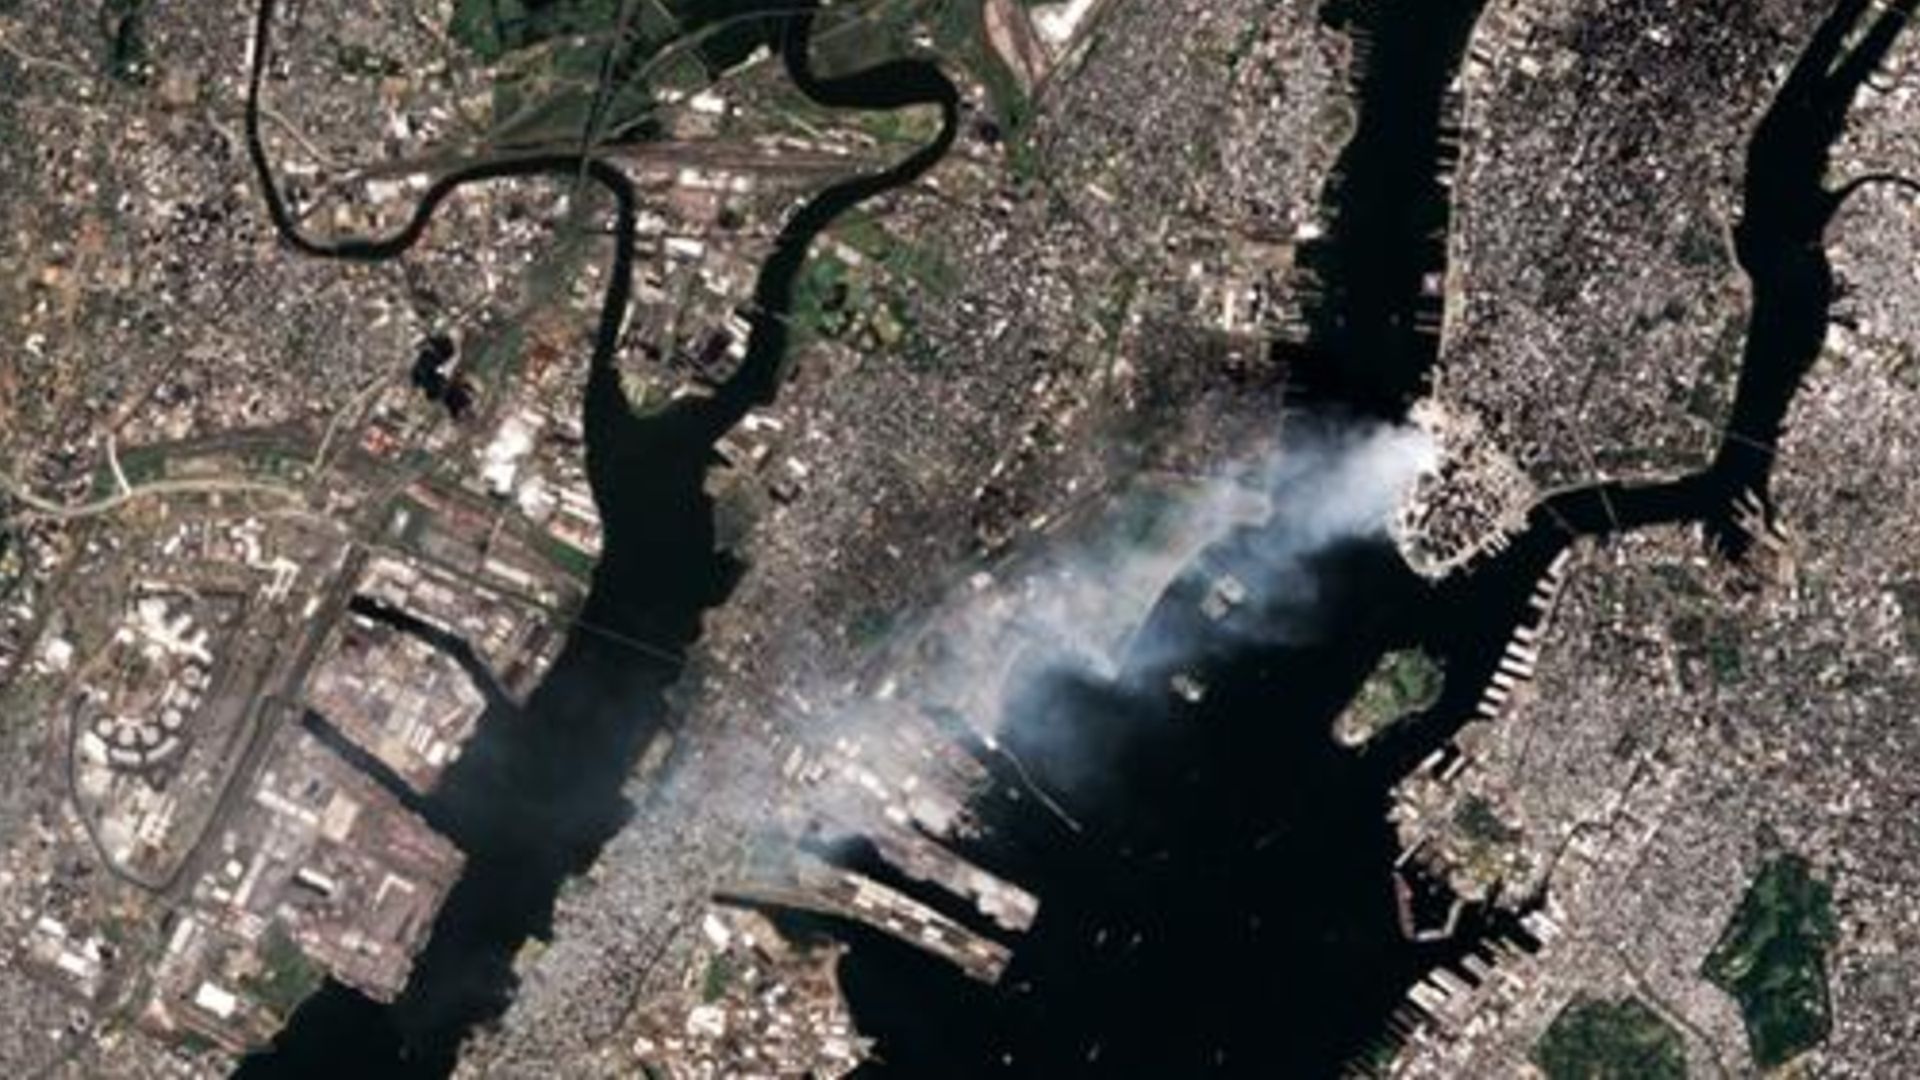
An additional satellite image showing smoke continuing to pour from Ground Zero on Sept. 12

Additional imagery — captured by the Landsat 7 satellite on Sept. 12, 2001 — shows that smoke continued to pour from Ground Zero for at least 24 hours. (Image credit: USGS/Landsat 7)

In 2017, Culbertson revealed that there was another striking thing he and the rest of his crew noticed in the wake of the attacks, according to Live Science's sister site Space.com. "One of the most startling effects was that within about two orbits, all of the contrails that are normally crisscrossing the United States had disappeared because they had grounded all the airplanes," he said.

However, there was one exception. The astronauts noticed a single contrail moving eastward across the Midwest. "That was Air Force One headed back to D.C. with President Bush," Culbertson said. It was a "very sobering" sight, he added.

See more Earth from space

Photo of a space shuttle with an open cargo bay over the Bahamas

Final Space Shuttle 'photobomb'

This 2011 astronaut photo captured one of NASA's iconic space shuttles passing between Earth and the International Space Station for the very last time.

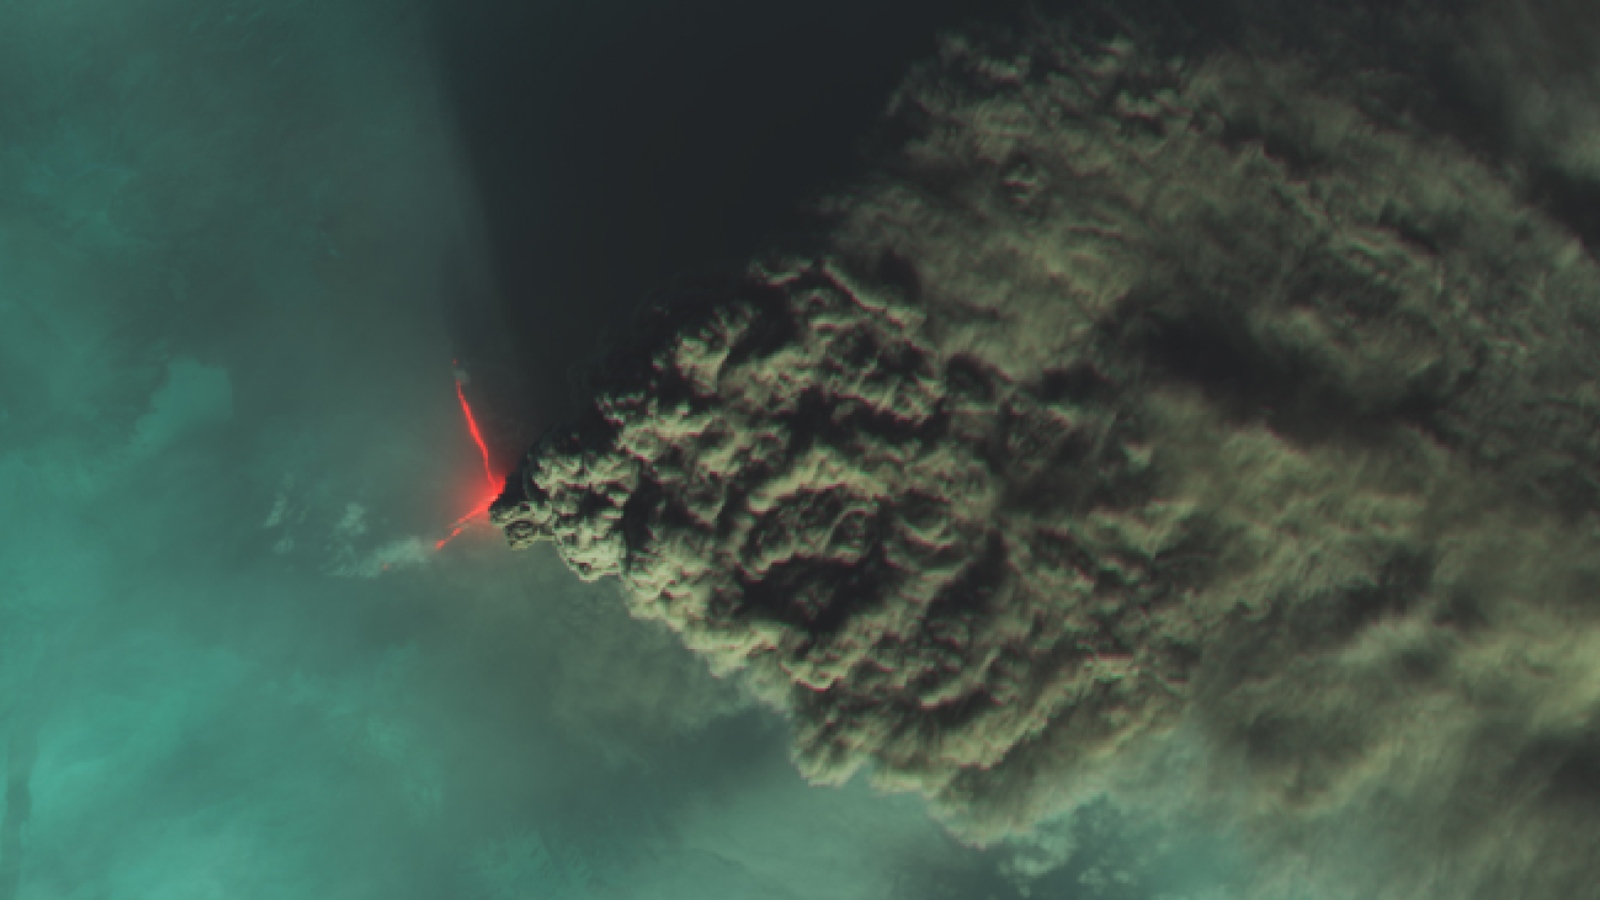
A dark cloud of smoke flows from a lava flow on a volcano

Russian 'river of smoke' eruption

A false-color satellite photo from 2023 shows a devilish pair of lava flows and an enormous plume of smoke spewing from Klyuchevskoy, the tallest volcano in Europe and Asia.

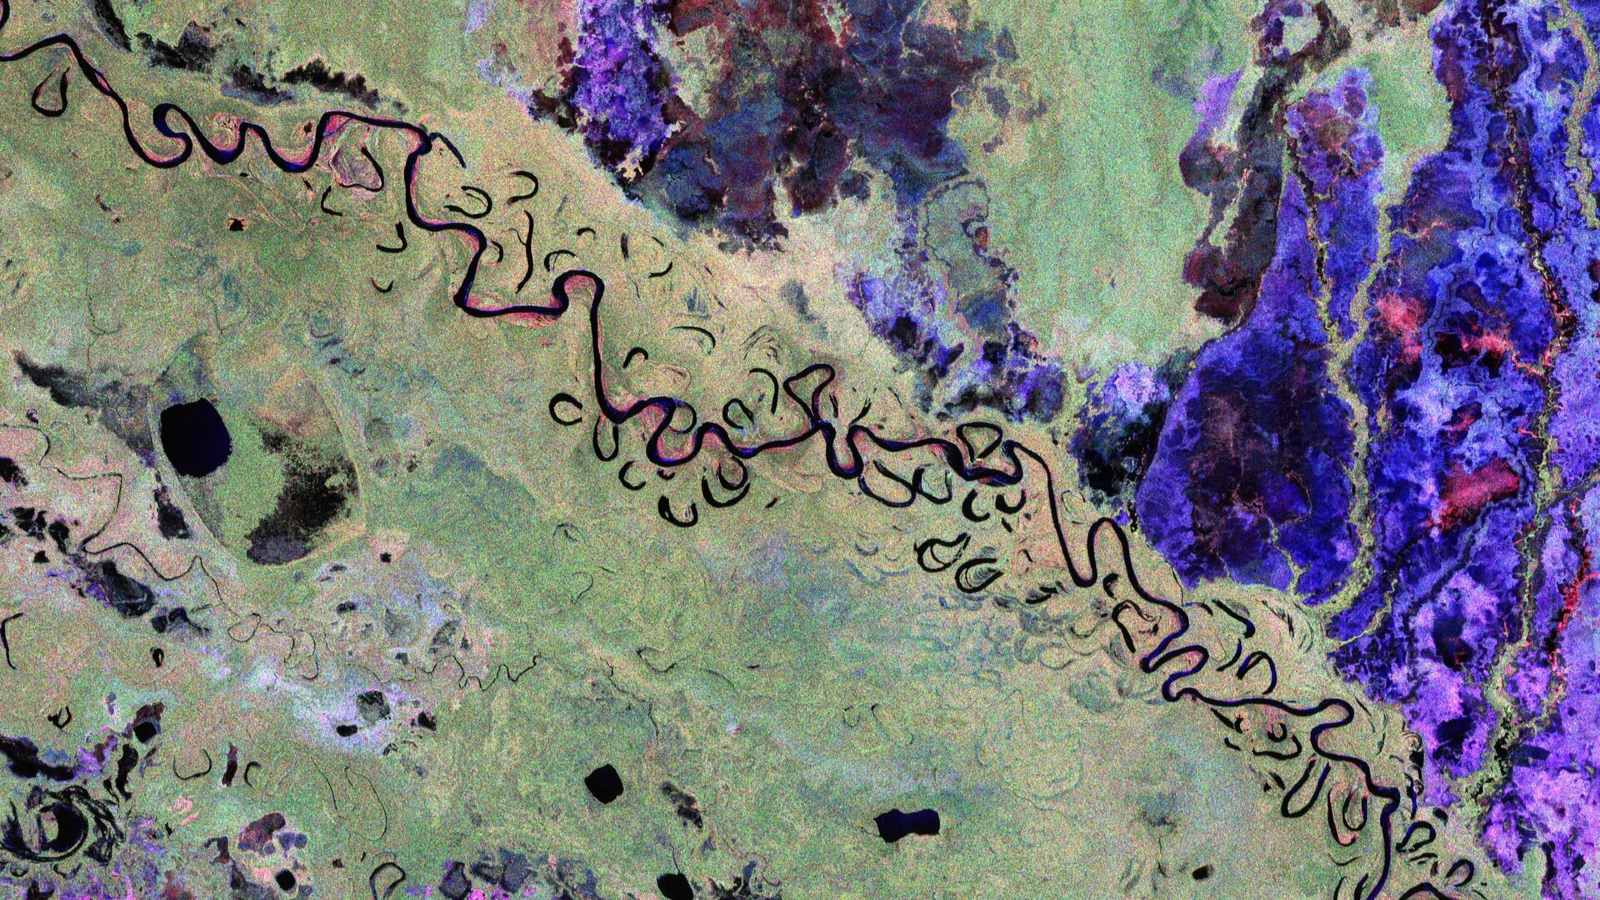
False-color satellite images of Earth taken by ESA's Biomass satellite

Trippy 'Biomass' satellite snap

The first false-color image from ESA's newly operational Biomass satellite shows off a unique perspective of the rainforests, grasslands and wetlands surrounding a winding river in Bolivia.

  •  

The future of Earth observation: Private satellites and AI bring benefits but also pose risks

We are a planet-based species: With a few notable (astronaut) exceptions, everyone who has ever lived remained glued to our spinning Earth, which now houses 8.3 billion people.

That's the gravity of the situation. But we're also a world of floods, typhoons, earthquakes, heat and cold calamities, volcanic eruptions and even encounters with sun-caused auroras and bruises from incoming asteroids.

It's quite a world worth watching — and for decades that's what spacecraft have been doing. But what do they view and who's on the other end of the space-based telescopes capturing our daily doings, faults and all, down here on terra firma?

long-distance view of earth in deep space

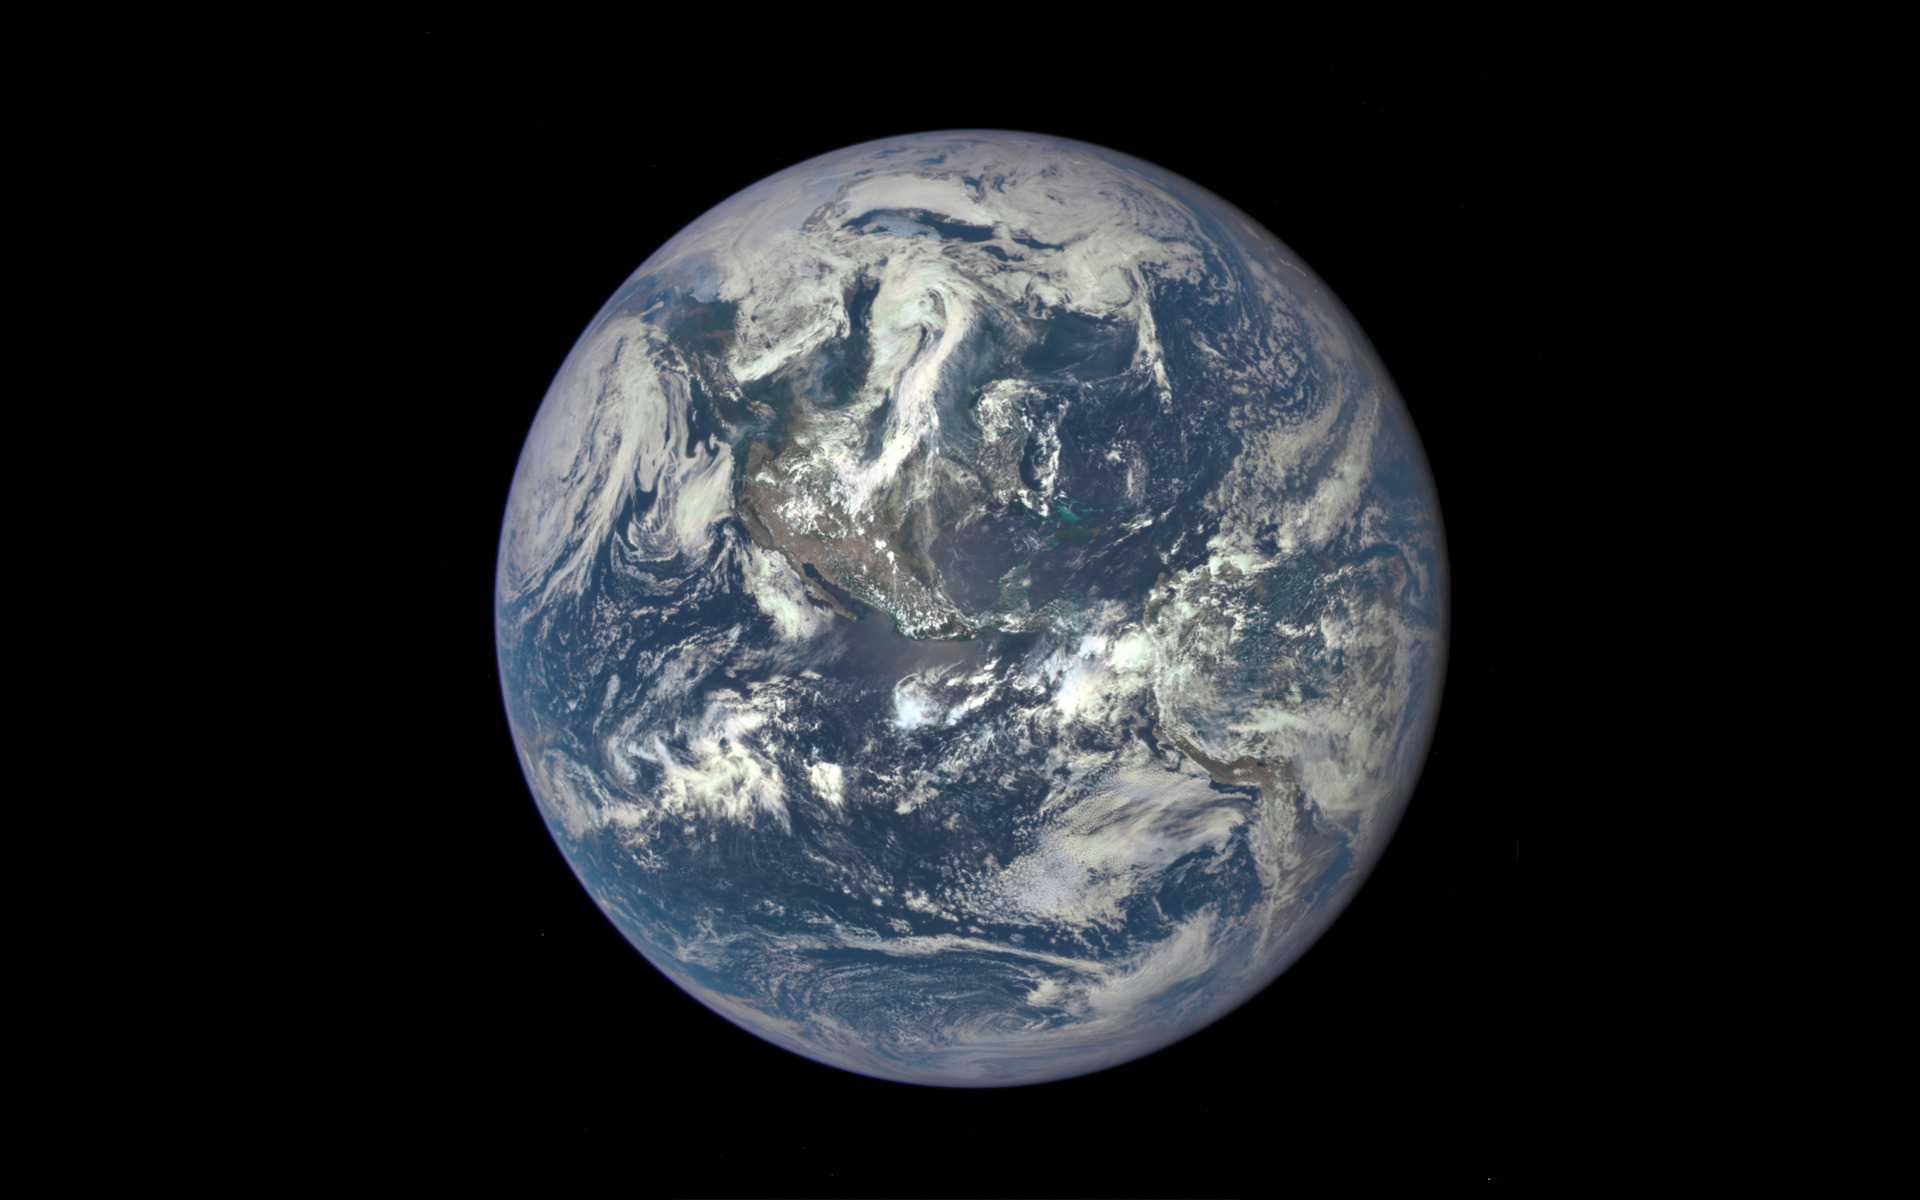
The U.S. government's Deep Space Climate Observatory (DSCOVR) satellite captured its first view of the entire sunlit side of Earth from one million miles away on July 6, 2015. (Image credit: NASA)

Privacy, security and trust

Recently, the Organization for Economic Co-operation and Development (OECD), a group based in Paris, published a report on the expanding access to satellite Earth-observation data, spotlighting what it means for privacy, security and trust.

"Advances in optical systems, photonics, cloud computing and artificial intelligence [AI] have democratized both the quality and accessibility of satellite data. However, this convergence of technologies also carries risks, including for national security and privacy," states the report, which was authored by the OECD's Marit Undseth and Claire Jolly.

Broadening access to advanced satellite data also creates new challenges, states the report, such as one of the key characteristics of Earth observation — its dual-use nature. "The same satellites used to track illegal fishing can often also detect military troop movements," the authors write.

Illustration of a satellite studying Earth, with orange and blue beams representing its data-gathering work

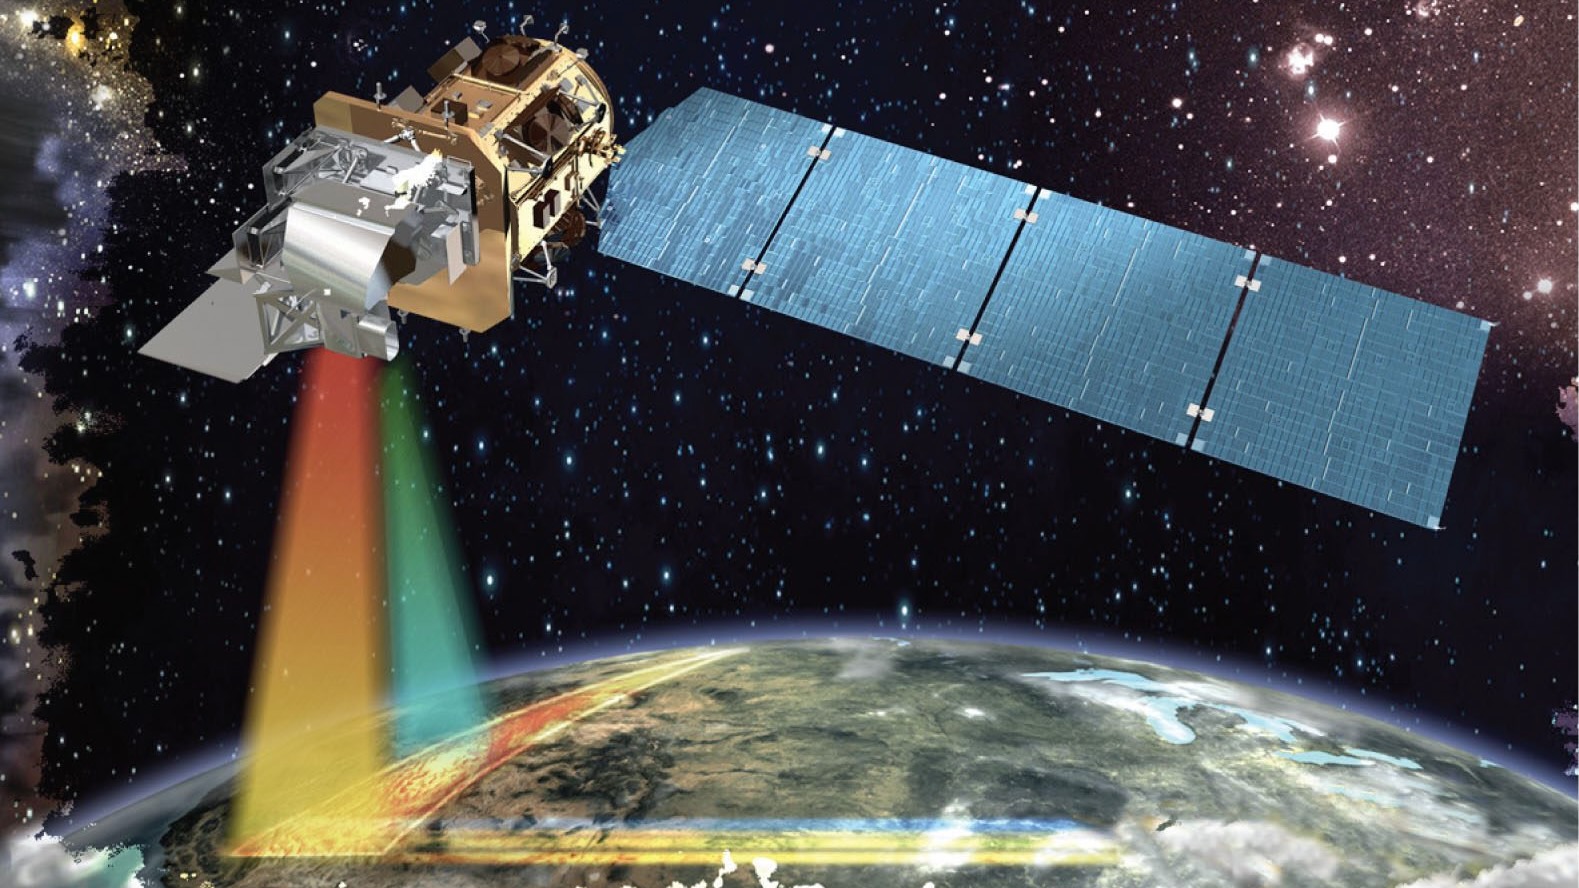
Illustration of a USGS-NASA Landsat remote-sensing satellite studying Earth. Government satellites the Landsat line were once the only craft doing such work. (Image credit: NASA)

New concerns

The OCED report notes that Earth-observation data and the technological convergence with artificial intelligence raise new concerns about national security, privacy and the ethical use of these data.

In fact, the report points to the growing hazard of fake or incorrectly used satellite imagery. "As part of the growing trend of digital disinformation, the trust in satellite data can be eroded by fake, misinterpreted or intentionally misrepresented imagery," it states.

Space.com asked leading remote-sensing specialists what's being done, what's being learned and what we should worry about.

Sovereignty and cost efficiency

Viktor Stoyanov is the chief operating officer of Smart Solutions at Space42, where he oversees the business unit's operational and financial performance.

Space42 is a United Arab Emirates-based space technology company that integrates satellite communications, geospatial analytics and AI capabilities. The group runs the Foresight Earth Observation constellation of synthetic aperture radar (SAR) satellites.

Space.com asked Stoyanov about the growing international use of remote-sensing data.

"Governments increasingly expect Earth-observation systems to deliver both sovereignty and cost efficiency, two goals that were long seen as mutually exclusive, as sovereignty typically meant heavy in-country investment in duplicative research and development and capital infrastructure," he responded.

Dual use

Stoyanov said Space42's focus is to combine those two outcomes.

"We believe that can only be achieved through international cooperation. Our Foresight constellation reflects this model, as the first sovereign dual-use synthetic aperture radar constellation in the region," Stoyanov said.

The satellites were manufactured in partnership with ICEYE in Finland, with critical integration and testing completed in the organization's facility in Abu Dhabi.

"The Abu Dhabi facility was built in cost-cautious and scalable manner, so that it can satisfy current sovereignty requirements commensurate with the constellation size, with the ability to expand the facility and meet demand of future programs," Stoyanov said.

Through cloud, dust and darkness

What new in-orbit technologies are being applied to Earth observation?

"The biggest shift in recent years has been the move from few, large, general-purpose platforms to constellations of small, specialized satellites and synthetic aperture radar," said Stoyanov.

"SAR satellites image through cloud, dust and darkness, which matters enormously for our region and for any customer who needs consistency regardless of timing and weather," he added.

Looking ahead, Stoyanov said that the short lifespan of satellites in low Earth orbit is an opportunity to ensure that each replenishment cycle becomes an upgrade cycle.

"As we plan to maintain and expand our fleet, we will continuously seek to deploy technical improvements across various performance metrics of the system — resolution, latency, satellite life, for example," said Stoyanov.

Artificial intelligence

A SAR constellation generates far more imagery than analysts can review manually within the allocated time, Stoyanov said. So the value lies in what can be extracted from it, not in the pixels themselves.

AI is therefore becoming increasingly important as a sorting tool for remote-sensing data, Stoyanov said. It is now the only practical way to work, for three reasons: volume, speed and accuracy.

Customers responding to a flood, a maritime incident or a supply-chain disruption need an answer in minutes, not a report next week — "decision-grade intelligence within minutes," explained Stoyanov.

On the topic of accuracy, while trained analysts are excellent at interpretation and large-object classification — like buildings and sea vessels — there are changes that the eye can easily miss. "Algorithms comparing each new pass against the historical baseline — they catch those consistently, without fatigue," said Stoyanov.

satellite photo of a dark plume of smoke ascending from a blue and red circular launch pad in a desert landscape

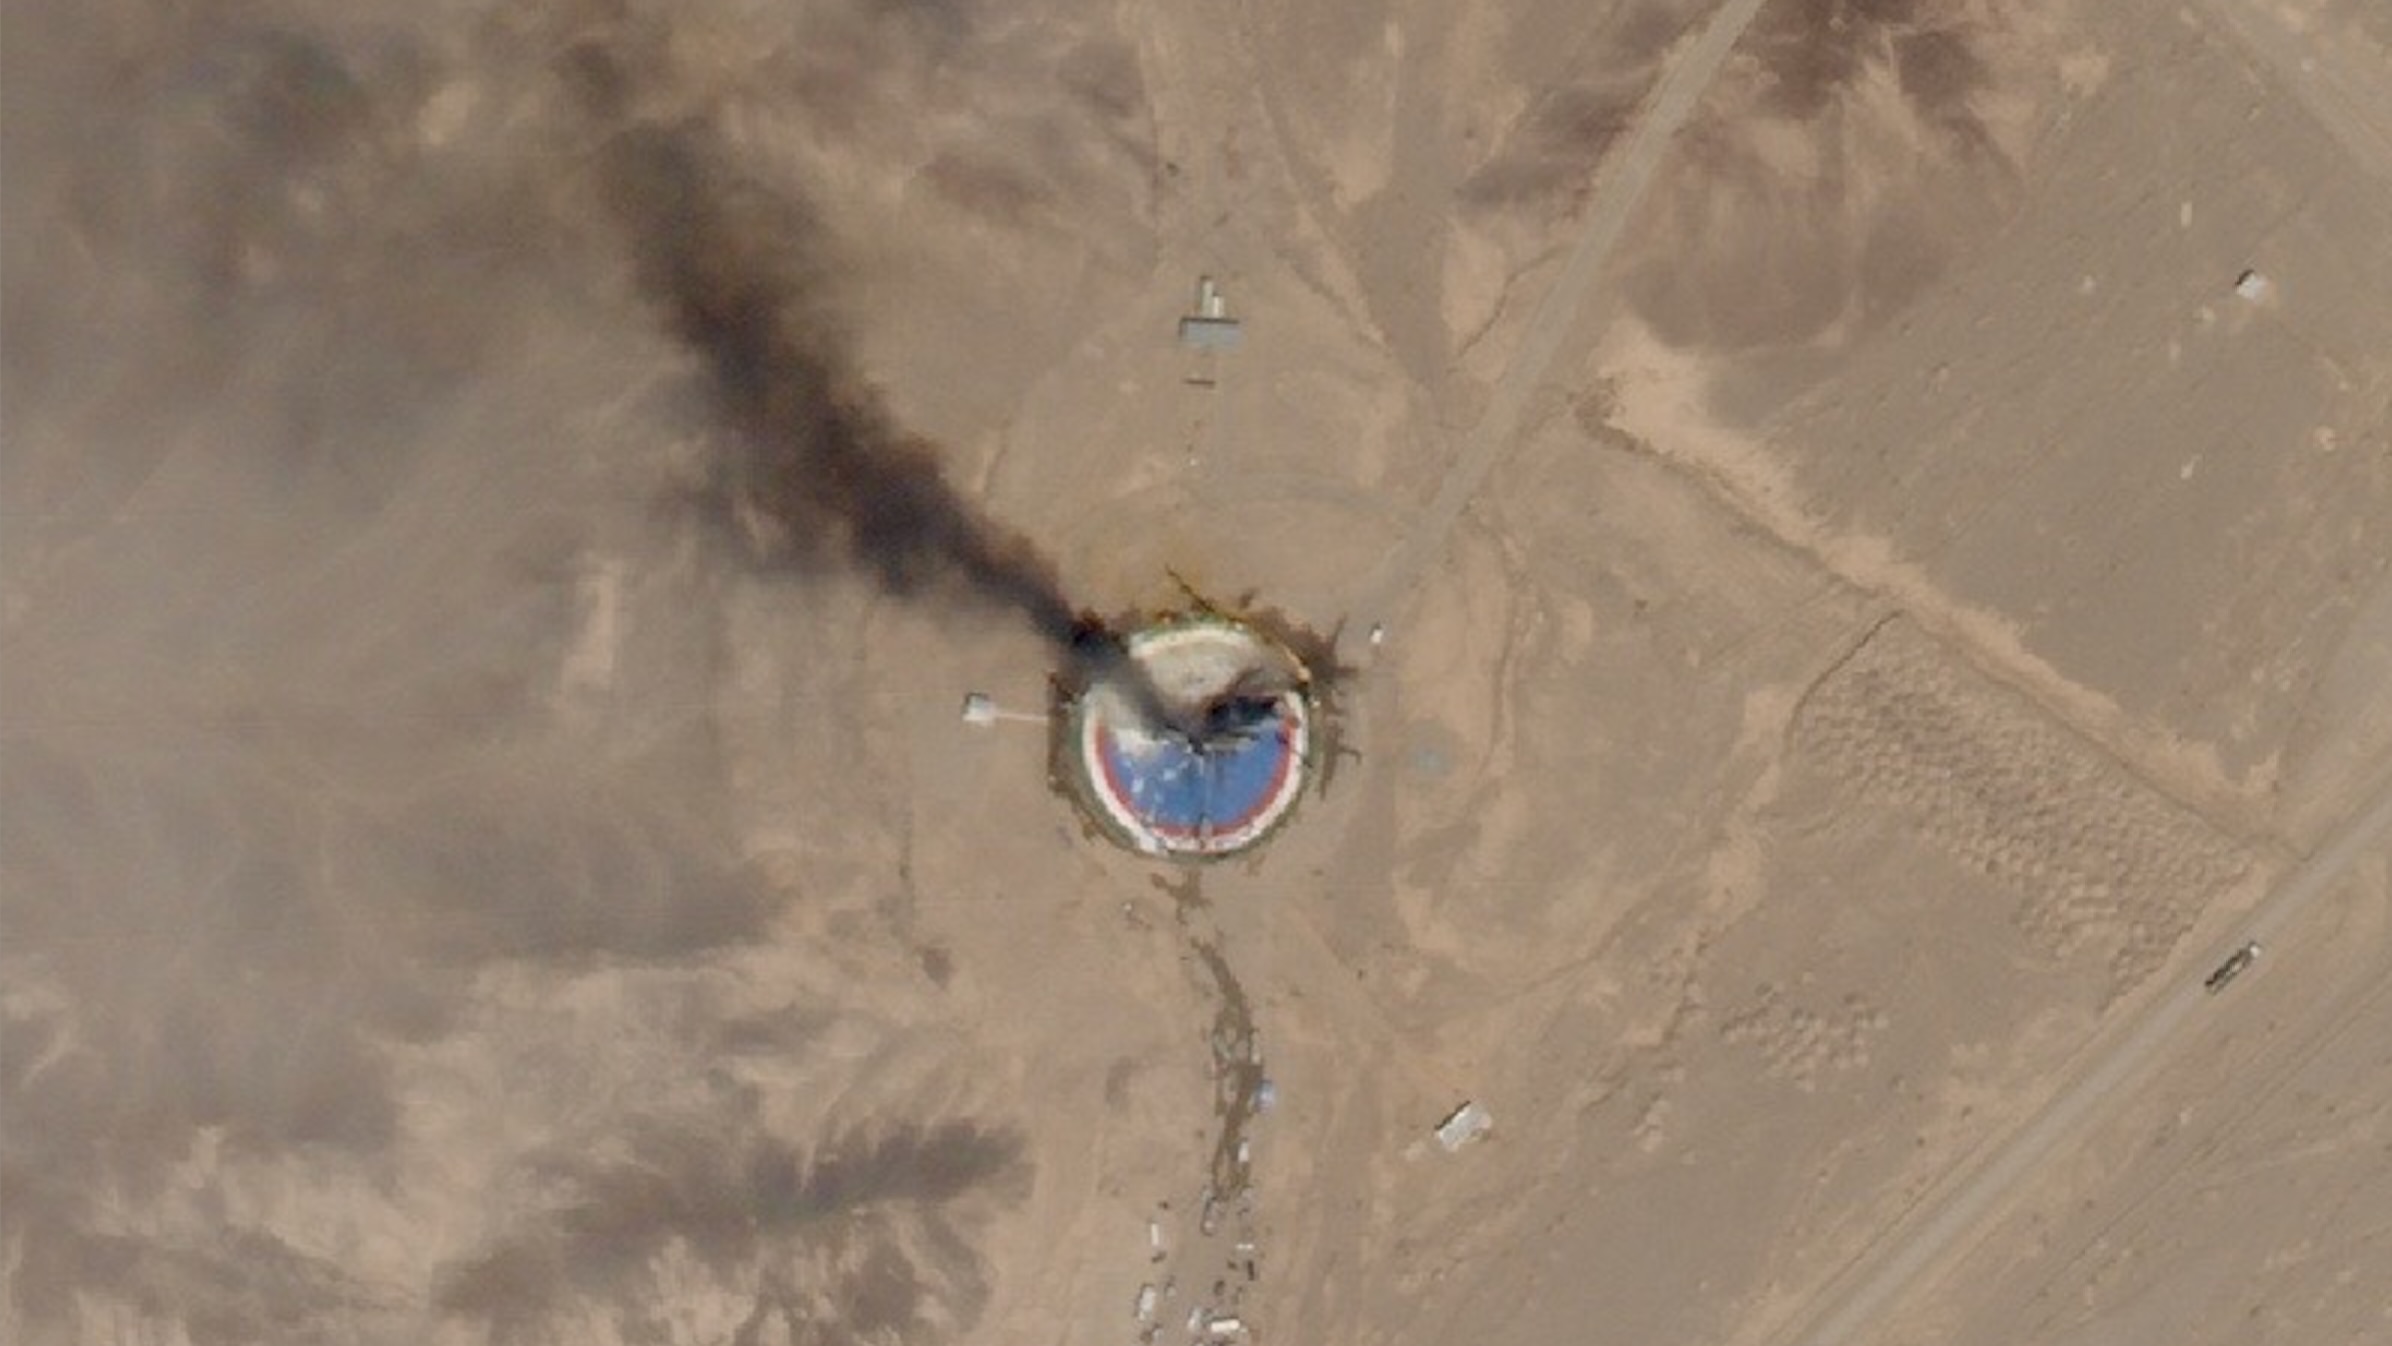
A SkySat Earth-observation satellite operated by the California company Planet spotted the wreckage of a failed launch out of Iran's Imam Khomeini Space Center on Aug. 29, 2019. (Image credit: Planet Labs, Inc.)

Hybrid model

Francis Doumet is the CEO and co-founder of Metaspectral, a company based in Vancouver, British Columbia, that builds AI technology to rapidly analyze hyperspectral imagery.

Doumet views collaboration between different national space agencies as "extensive and, somewhat uniquely, very open." Missions are frequently carried out through "shared funding, instruments, expertise and ground infrastructure," he said, with the resulting scientific data made available internationally.

Commercial imagery is less openly distributed because it is commercially licensed and may have security implications, Doumet said, but it is increasingly enabling international cooperation in the defense sector.

For example, the U.S. Space Force's Tactical Surveillance, Reconnaissance and Tracking (TacSRT) program combines commercial satellite imagery and analytics from American companies and allied nations to rapidly respond to operational requests, Doumet said.

"This has shaped the Earth-observation sector into a hybrid model," said Doumet. Governments and allies share requirements and intelligence, he explained, while commercial operators supply imagery and analytics "at a speed and scale that would be difficult or impossible for a single nation to produce alone."

illustration of a white, boxy satellite high above earth

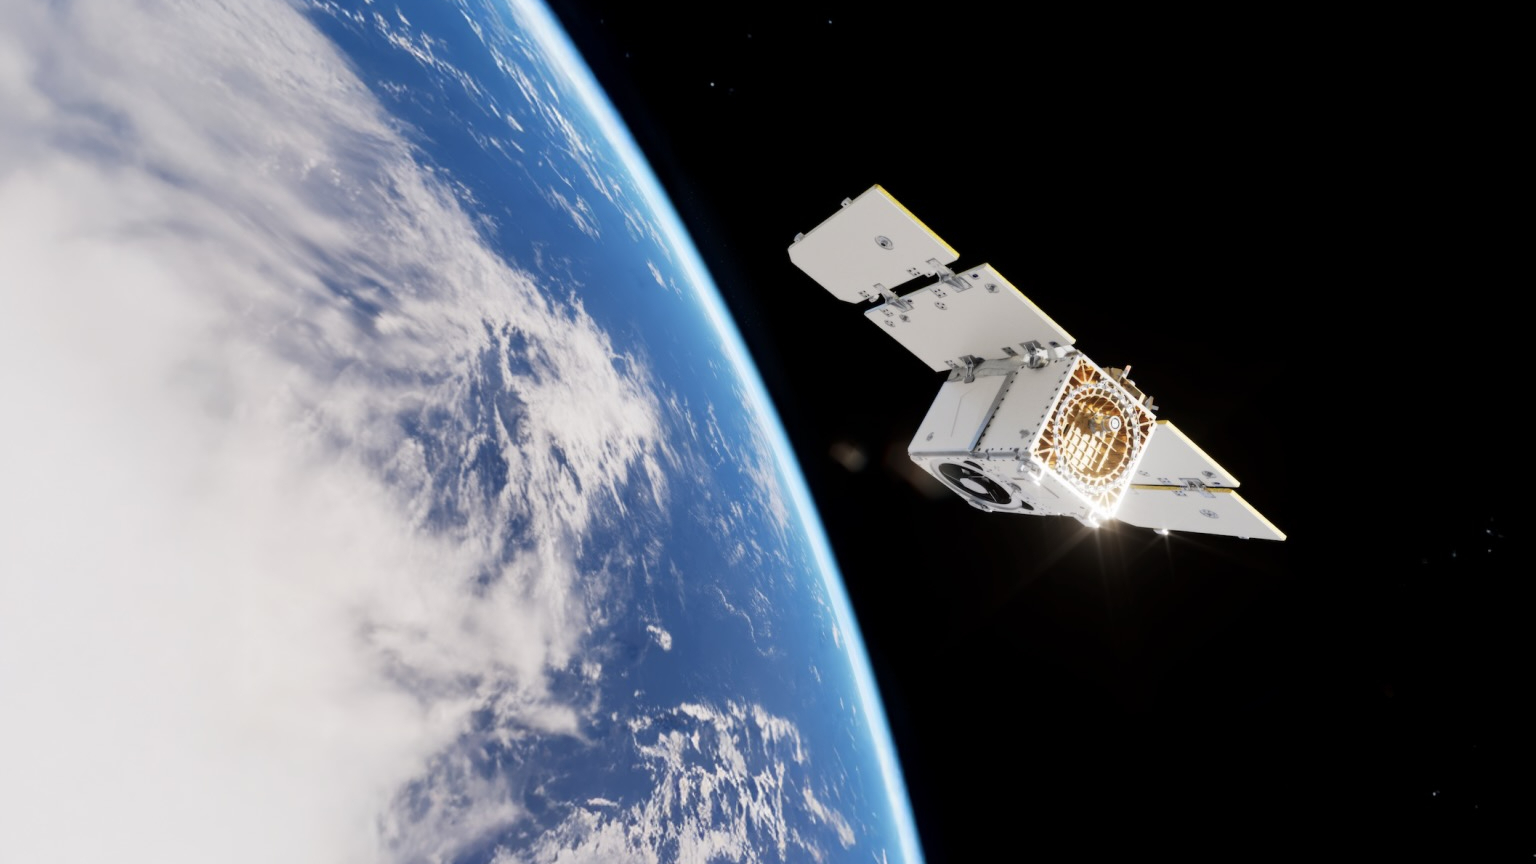
Artist's illustration of Planet's Pelican-2 Earth-observing satellite in orbit. (Image credit: Planet Labs PBC)

Hyperspectral sensors

The improvement in the spatial resolution of hyperspectral sensors is an important advance in Earth observation, Doumet pointed out.

Better sensors, high-speed compression and improved communications, such as optical links, are now narrowing a "resolution gap." Onboard AI is equally transformative, he added.

"Satellites can analyze imagery in real time, identify relevant signatures and transmit alerts or compact intelligence products instead of waiting to download an entire hyperspectral data cube," Doumet explained.

Spectral fingerprints

Angie Crews is a principal research associate with the University of Colorado, Boulder's Center for National Security Initiatives.

"There has been a tremendous growth in the commercial remote-sensing industry," Crews told Space.com, noting that this field had previously been government-based. "It's now possible for these commercial companies to deploy entire constellations of Earth-observing satellites, which fundamentally changes the architecture in place."

Crews pointed to the hyperspectral nature of Earth remote sensing — taking the "spectral fingerprints" of what's occurring on Earth.

"It's impressive how the industry is moving forward with some of these capabilities," she said.

Balancing act

"There are some tremendous benefits as well as some things that we need to think about" when it comes to the new direction that Earth observation is taking, Crews said. Remote-sensing data can be inherently dual use, she added.

"Overall, I think we're seeing some enormous benefits from our increasingly capable commercial remote-sensing systems. But it does raise some security and governance questions," said Crews.

It's a balancing act to manage, according to Crews. How best to secure the information for national security purposes versus not putting the squeeze on innovation exhibited by the private Earth-observation firms?

Meaningful information

Shifting to her teaching role at the University of Colorado, Boulder, Crews told Space.com that one of the things that's especially important is to train students in the remote-sensing field to think beyond any single sensor or dataset.

"The next generation needs to understand how different sensing technologies work and also how to work with very large datasets and extract meaningful information using AI and machine learning," Crews said.

"We also need to train the students on critical thinking and ensure they are aware of the limitations of AI. The underlying physics need to be understood and the results need to be validated so that the students use and interpret the results appropriately," she concluded.

  •  

Scientists Say: Virga

Virga (noun, “VER-gah”)

Virga refers to rain or snow that evaporates before it reaches the ground.

From a distance, virga looks like ghostly, grayish wisps that streak down from storm clouds. Virga occurs when rain or snow passes through dry, often warm air during its fall. So it tends to form in places such as deserts and the arid high plains of the western United States.

Pilots watch out for virga. That’s because virga can warn of dangerous downward swooshing pockets of air, called downdrafts. As falling rain or snow evaporates, the air cools. Cold air is denser than warm air and tends to drop. Sometimes, these downdrafts occur suddenly and in a small area. Small pockets of downward bursting air can rock an aircraft.

On Earth, virga consists of water. But scientists have observed evaporating precipitation elsewhere in the solar system, too. In Jupiter’s gas clouds, falling streaks of precipitation evaporate into the atmosphere below. This falling material could contain ammonium or water, depending on where in Jupiter’s atmosphere it occurs. Scientists have also noticed virga-like wisps in Mars’ atmosphere.

In a sentence

Dry, desert climates can produce unusual weather phenomena from ghostly virga to wall-like dust clouds.

Check out the full list of Scientists Say.

  •  

AI's water use is a problem, but shifting from electricity to solar or wind power could help

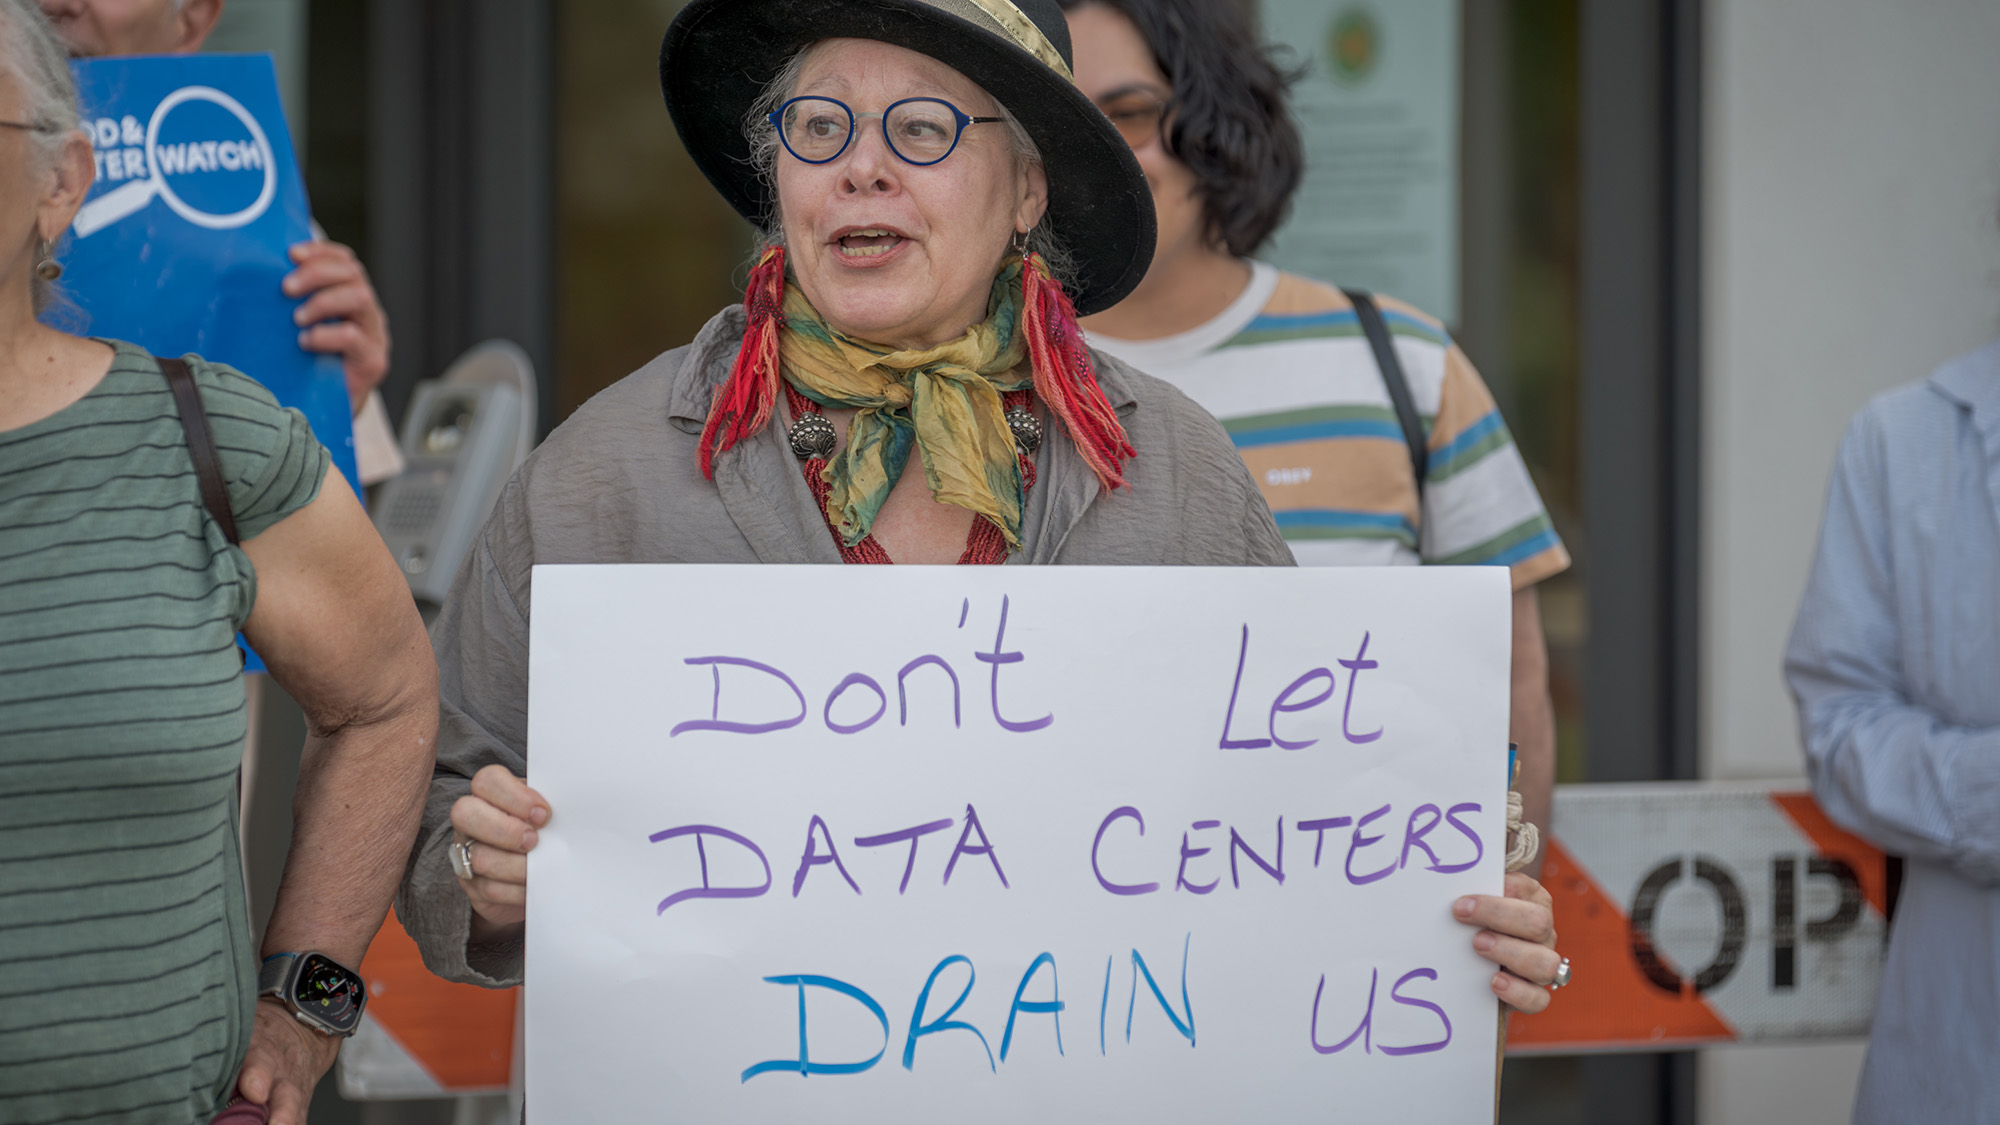
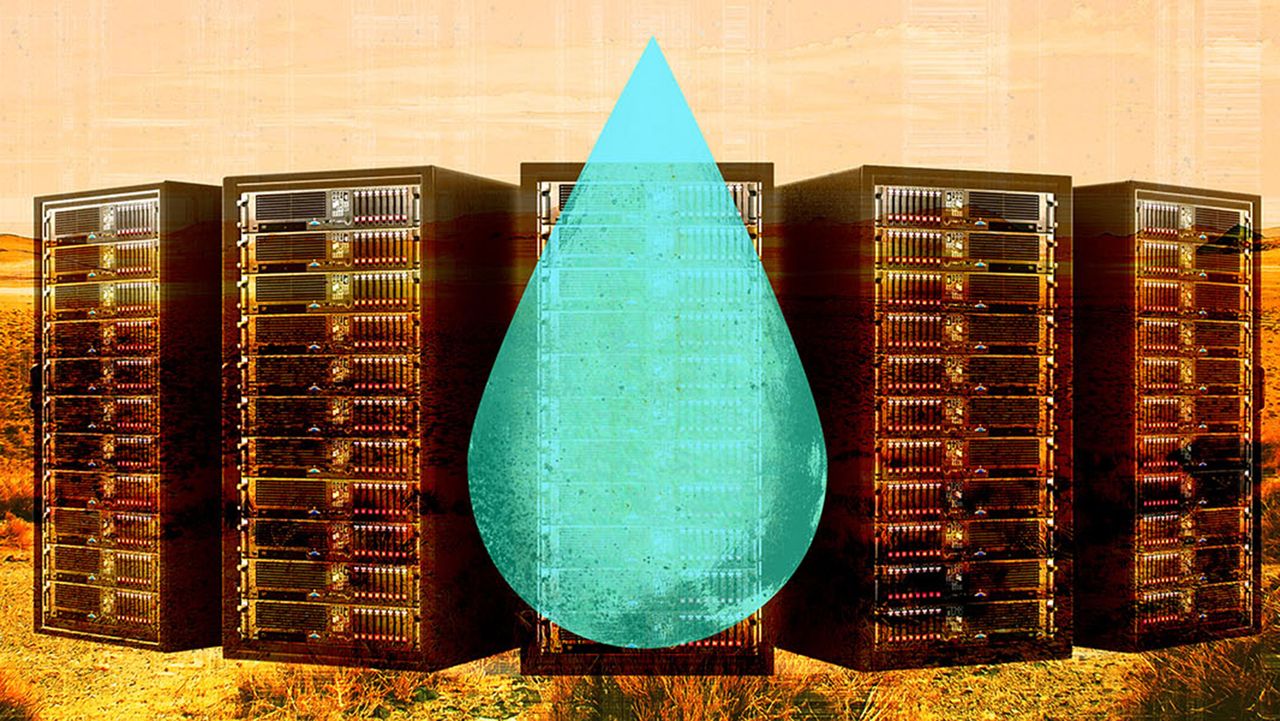
"Protect our water," "Water for people not AI," "Don't mess with our water," declare protest signs from Texas to New Mexico to Arizona. Angered by water use, energy consumption and pollution, locals are increasingly protesting the rapid expansion of data centers in the United States as tech companies work to rapidly expand capacity for AI.

Many data centers rely at least partly on water to absorb heat from air or surfaces, and then cause cooling as it evaporates, just like sweating keeps our bodies cool. The processors inside data centers can reach internal temperatures of up to 176 degrees Fahrenheit, for the same reasons that an overtaxed laptop heats up.

But while there's little doubt that data centers are consuming significant amounts of energy, water consumption is more complicated. Claims circulating online bring scant clarity, ranging from articles claiming that chatbots can consume 500 ml of water per query to some online commentators declaring AI's water issue to be nonexistent. And the consumption data from large tech companies themselves are often incomplete and inconsistent.

Experts stress that, overall, data center water consumption pales in comparison to the usage by industries like agriculture and some kinds of manufacturing. Researchers have estimated that data center cooling systems consumed 66 billion liters of water in 2023, less than 1 percent of the nation’s total consumption.

That figure could considerably rise with the rapid buildout of AI data centers, however — which may not be a big problem for water-rich regions but could significantly add to local water stress in drought-strapped places like New Mexico and Arizona.

Fortunately, engineers say there's a host of things that can be done — and are being done — to reduce the strain on local water resources. "There are many good ideas out there," says energy systems expert Fengqi You of Cornell University. When you add in efforts to replenish and restore natural water resources, "there's a good chance that, eventually, it could be net-zero water for the on-site cooling."

A woman wearing a dark hat and round glasses holds a protest sign.

AI's water consumption is one reason why local communities across the United State — such as here, in New York — are protesting against the construction of data centers. (Image credit: Erik McGregor via Getty Images)

More renewable energy and better siting

Recent advances in AI technology have already reduced water demand for many data centers. Electrical and computer engineer Shaolei Ren of the University of California, Riverside, says that an estimate he made based on GPT-4, an earlier version of the model powering ChatGPT, as recently as 2024 — that drafting a short email would consume 500 milliliters of water — is already outdated because AI models have become more efficient. (This study was the origin of the half-liter-per-query claim.) In 2025, Google estimated that five drops of water are spent on processing a median-length query with its chatbot Gemini.

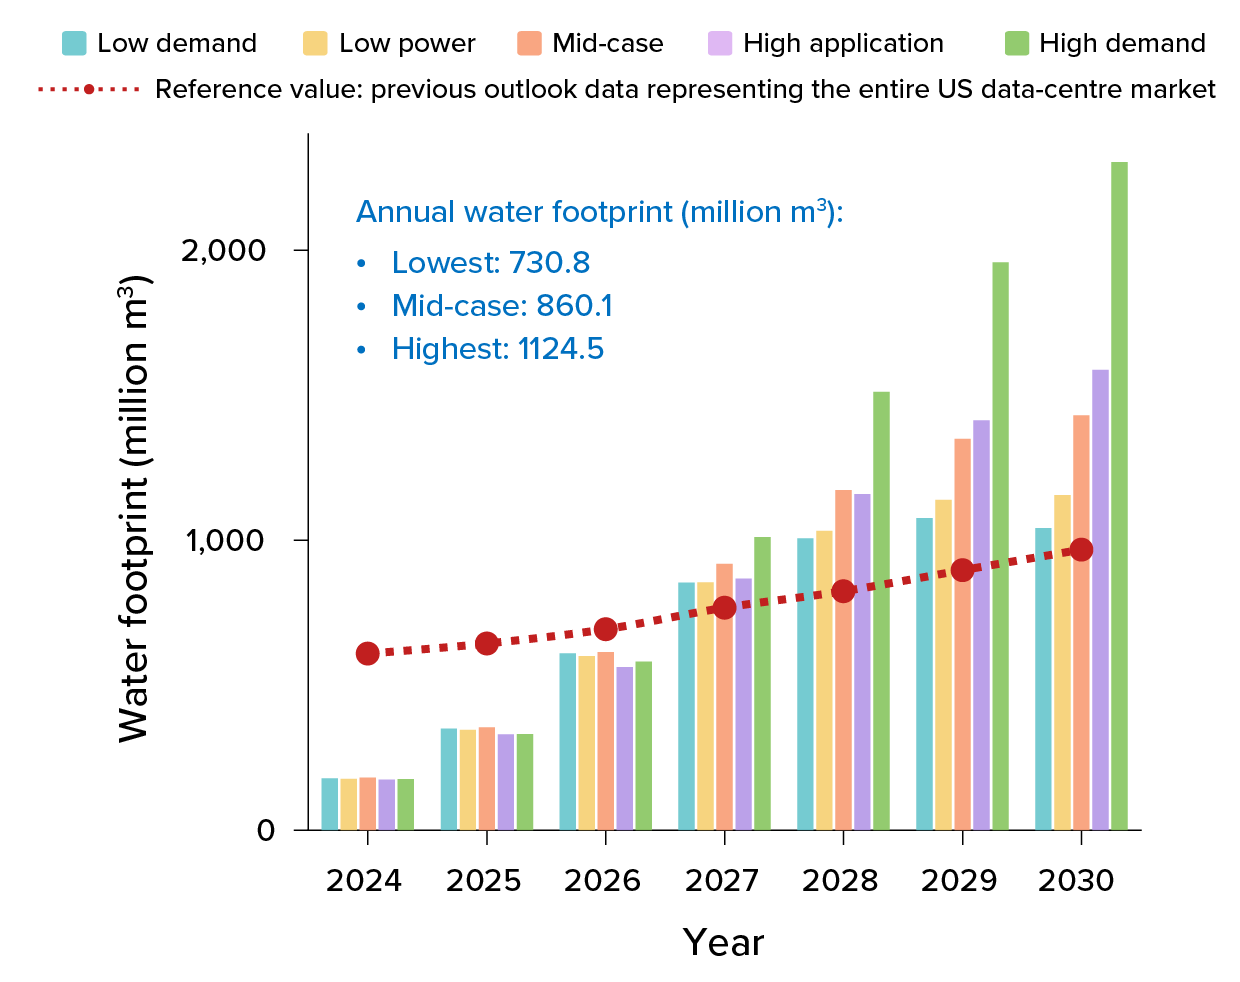
But even tiny amounts add up, given the rise in AI use. You's group recently predicted that by 2030, US data centers could consume 731 billion to 1,125 billion liters annually — the latter roughly equivalent to New York City's annual drinking water supply.

A colorful bar chart showing water usage.

Experts predict that the use of water for cooling AI data centers, as well as for generating fossil fuel-powered electricity to run them, will rise as numbers of data centers increase. One 2025 study projected future water consumption in the United States under different scenarios and found that solutions such as shifting to renewables, improving the efficiency of AI processors and the strategic siting of data centers could significantly curb AI's water use. (Numbers in blue depict the projected average annual water footprint over the full 2024 to 2030 period under low-demand, mid-demand and high-demand scenarios.) (Image credit:  T. XIAO ET AL / NATURE SUSTAINABILITY 2025)

Still, these numbers factor in not just cooling, but also a greater amount of water used to generate the electricity that powers data centers. Much of that comes from burning coal or gas, with water being used to cool steam back into liquid after it's been used to spin the electricity-generating turbines. In other words, AI's water consumption can be significantly reduced by shifting to solar and wind, which require little to no water to operate, You says.

You adds that companies should site data centers in areas less prone to drought and with ample renewable energy sources, like regions in Montana, Nebraska, parts of Texas and South Dakota, instead of constructing new data centers in water-stressed places, such as in Arizona, New Mexico and Southern California. Strategic siting along with other measures could reduce AI's future water footprint by up to 86 percent, he says.

New cooling technologies

Advances in cooling technologies are also helping. The newest data centers that specialize in AI are already more water-efficient than their predecessors.

Pre-AI data centers use fans to carry away the heat from processor-filled racks, then use chilling systems funneling cool water through the building to cool the warm air down again. The heated water is then fed into a cooling tower that removes the heat but also loses some of the water to the atmosphere. This evaporative cooling uses a lot of water, says Eric Masanet of the University of California, Santa Barbara, who researches data center sustainability.

But the energy-hungry processors inside AI data centers generate so much heat that it's hard to remove it with air alone. That’s why many tech companies — including Amazon, Microsoft and Google — use a more efficient technique called liquid cooling.

In this method, a system of pipes filled with water, sometimes mixed with temperature-regulating chemicals, runs on top of the hardware, cooling the processors directly rather than cooling the entire data center. And because this is a closed-loop system, no water is lost: The heated fluid can be cooled down by exposing the pipes to the outside air, if conditions are cool enough, or an air-conditioner-like system, which uses energy.

But when it's extremely hot or humid, the centers need to bring online extra, more effective methods that involve water; one of these is to mist the air around the pipes. Mechanical engineer Vaibhav Bahadur at the University of Texas at Austin says that most AI data centers in Texas only use this kind of water-based cooling for the hottest parts of the summer.

Still, he and his colleagues recently estimated that the state's growing number of data centers — which currently consume less than a percent of the state's water demand — could be using 3 to 9 percent of that water by 2040. He expects that figure to reduce considerably, though. "Data centers are becoming much more efficient in their water usage," he says.

Indeed, recent technological developments have made it easier to avoid water-based cooling, even in hot climates, says Josh Parker, head of sustainability for NVIDIA, the company that designs many of the processors that populate AI-specialized data centers. Their latest generation of processors run at such high temperatures that they can be cooled with water at around 113 degrees Fahrenheit which, Parker says, is significantly warmer than traditional approaches. That reduces the need to bring on water-based cooling. Unless local temperatures regularly exceed 113 Fahrenheit, a threshold generally crossed only during severe heat waves, "typically we can just get away with large efficient fans cooling the infrastructure and the ambient air is sufficient to pull the heat away," Parker says.

Ren cautions that some companies may not want to run their processors that hot because it can interfere with computational performance, while some also house non-AI servers in the same space that cannot take the heat. But other cooling technologies are in development.

Some of these rely on elaborately designed pipe systems that draw heat even more effectively from processors. A number of US companies are exploring immersion cooling, where data center hardware sits in a tank filled with cooling liquid. In China, some companies have taken a similar approach by installing data centers in the ocean, although this makes them hard to access should hardware need replacing or upgrading, Bahadur says.

Advances in cooling technology will be necessary for tech companies to meet sustainability goals they have set for their operations. According to a statement from Amazon, its Web Services "set a goal to be water positive by 2030 — returning more water to communities than our direct operations use — and as of 2024, we're more than halfway there."

A spokesperson for OpenAI points to a web page outlining the company's plans to minimize water use, while Google aims to replenish 120 percent of the freshwater its data centers consume by 2030 through a variety of water stewardship projects.

Some companies, such as Google, are also finding smart ways to use waste heat from data centers to help address other sustainability challenges, such as making building heating less reliant on fossil fuels. Across Europe, some data centers are funneling heat from cooling circuits into district heating systems used to warm buildings.

The future of AI's water usage hinges on decisions that tech companies, engineers and policymakers will make in the coming years, Masanet says: where data centers are sited, their local energy infrastructure and climate, and how they're designed. "If you choose one set of choices, your number is going to be off the charts," he says. "You choose another set of choices, it's going to be way down here."

This article originally appeared in Knowable Magazine, a nonprofit publication dedicated to making scientific knowledge accessible to all. Sign up for Knowable Magazine’s newsletter.

  •  

Has Dark Matter Finally Been Detected?

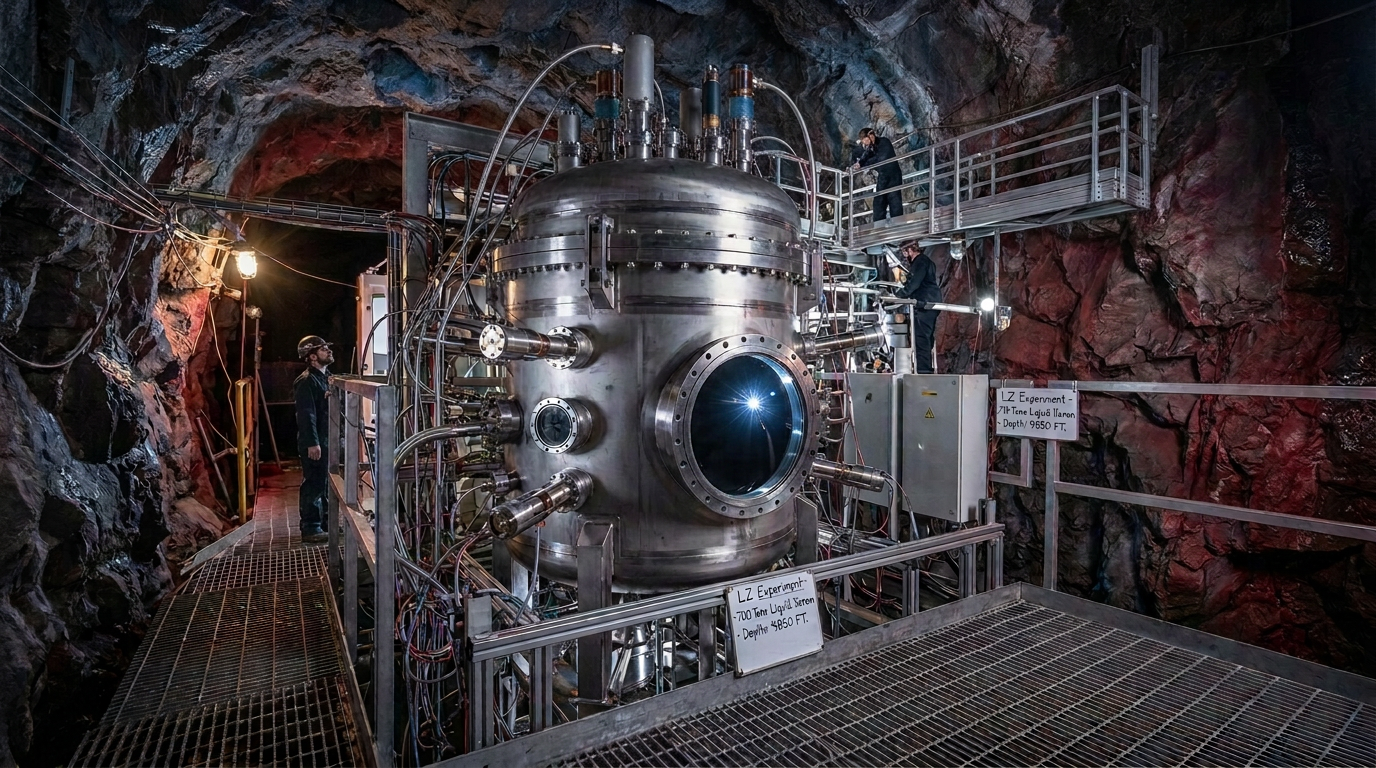
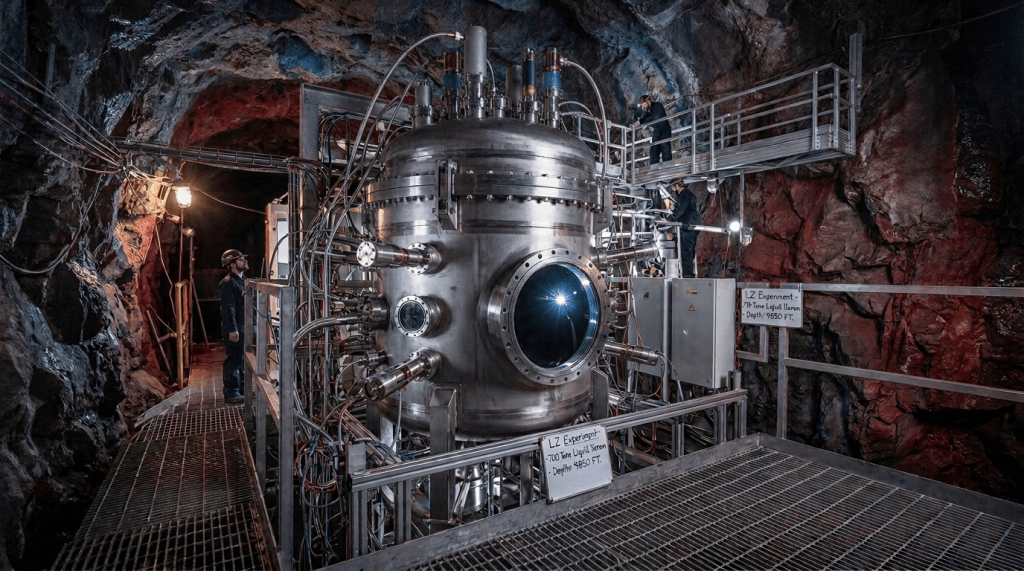
The LUX-ZEPLIN experiment in South Dakota recorded an unexplained flash of light in 2023, suggesting a potential dark matter particle interaction. While the statistical significance of 2.6-sigma indicates low odds of error, much more evidence is needed before confirming a dark matter discovery, which remains elusive despite ongoing research.

  •  

What Caused Antarctica to Freeze Millions of Years Ago? New Clues Could Finally Solve This Longstanding Climate Mystery

New clues to the formation of our planet’s oldest and largest ice sheet could help resolve a longstanding enigma about the southernmost continent.

Around 34 million years ago, Antarctica’s ice sheet began to take shape during a period when global temperatures were predominantly warmer than they are at present. The exact reason why such a large portion of Earth’s water would be subsumed into a massive ice sheet under such conditions has long perplexed researchers.

Now, a new study published in the journal Science suggests that clues to the mystery may exist beneath the ice itself, according to researchers who point to geological evidence that could help explain what led to the formation of Antarctica’s glaciers during a comparatively warm period in our planet’s history.

Clues to Why a Continent Froze

The East Antarctic Ice Sheet (EAIS) holds enough frozen water that it could raise sea levels around the world by more than 50 meters if a sudden, total melting event were ever to occur. Fortunately, scientists don’t anticipate that happening any time soon, although questions over what caused the formation of the largest mass of ice on our planet have remained one of the most predominant mysteries about Antarctica’s ancient history.

Based on geological evidence and paleo-climatological proxy data, the ice sheet’s formation occurred near the transition between the Eocene and Oligocene eras around 34 million years ago, marking a significant step along our planet’s path toward the cooler conditions that prevail today, even amid anthropogenic factors that contribute to ongoing climate changes.

As far as the causes behind this, scientists have long pointed to a reduction in atmospheric carbon dioxide as one potential driver of glaciation in Antarctica. However, this explanation also leads to questions: namely, that if falling CO2 and global cooling are believed to be the main factors behind the formation of Antarctica’s ice, then similar freezing should have occurred close to the North Pole as well.

Curiously, evidence suggests that glaciation in Earth’s northernmost regions didn’t begin catching up to its southern counterpart for another 20 to 25 million years. But what might account for this?

An Ancient Climate Missing Link

The new research, led by scientists at the University of Southampton in collaboration with an international team of researchers from Durham University and several other institutions, points to Antarctica’s changing landscape as a likely missing piece to this ancient puzzle.

“Antarctica’s land surface was gradually lifted to the point where ice could gain a permanent foothold, even while the surrounding polar oceans as well as global temperatures remained surprisingly warm,” said Thomas Gernon, a Professor of Earth Science at the University of Southampton and the study’s lead author.

By employing models that helped the team map the evolution of the Antarctic landscape, they were able to successfully reconstruct the ancient geological processes going all the way back to the original breakup between Africa and Antarctica that reshaped East Antarctica. This continental breakup led to the formation of a coastal escarpment in the region identified today as Dronning Maud Land, where an elevated plateau rose to nearly two kilometers, and extended close to 2,000 kilometers inland.

Over the 100 million years that followed, a wave of uplift and erosion gradually migrated inland toward Antarctica’s Gamburtsev Mountains, a process which would recur again during the Eocene, further elevating the region and increasing the amount of ancient Antarctica’s landmass that was above the permanent snow line, all of which occurred roughly 15 million years before mass-scale glaciation would begin on the continent.

Based on the team’s models, these major changes to the landscape shifted East Antarctica above the threshold where ice-sheet growth could begin occurring, the onset of which began around 45 million years ago.

Combined Factors Behind Antarctica’s Freeze

Another factor the team identified involves how the large-scale glaciation also caused more sunlight to be reflected away from Earth due to the icy surface’s light coloration, a process known as albedo feedback. The team believes this reflected sunlight may have contributed to as much as an additional degree Celsius of total global cooling.

That cooling alone, the researchers note, would not have been enough to cause widespread glaciation across the Northern Hemisphere, which generally features lower elevations.

Overall, the findings do indicate that Earth’s transition into an icehouse wasn’t something that was driven solely by climate. Instead, what seems most likely is that slow geological transformations occurring over many millions of years were likely to have been a primary contributor to this process, raising Antarctica’s landscape enough to facilitate ice sheet formation, and revealing how the evolution of landscapes can ultimately reshape the climate of an entire planet.

The recent study, “Continental breakup–driven uplift instigated East Antarctic Ice Sheet formation,” appeared in the journal Science.
Micah Hanks is the Editor-in-Chief and Co-Founder of The Debrief. A longtime reporter on science, defense, and technology with a focus on space and astronomy, he can be reached at micah@thedebrief.org. Follow him on X @MicahHanks, and at micahhanks.com.

  •  

'A worrying snapshot': Satellite image shows large patches of open water less than 40 miles from the North Pole

Large patches of open water were visible just 37 miles (60 kilometers) from the North Pole on Aug. 29, a NASA satellite image shows. Although this doesn't necessarily mean that Arctic ice is worse off this year than the past few years, the image reveals how severely climate change is affecting the region, experts say.

The image is from the NASA Worldview satellite photo browsing tool and was shared last week on the blog Arctic News. The patches are "quite striking," but it's not the first time that water has encroached upon Arctic ice in this way, said Julienne Stroeve, a professor of polar observation and modeling at University College London.

"We can see open water at times at the North Pole but I don't think it's ever been this extensive," Stroeve told Live Science in an email. For instance, the central Arctic Ocean and regions north of 80 degrees north latitude, an imaginary line that crosses Canada's Ellesmere Island and Spitsbergen in Norway, were highly fragmented in early September 2016.

The time of year is one reason water is now visible in this region, said Zachary Labe, a climate scientist at Climate Central, a nonprofit news organization that analyzes and reports on the climate. "By the end of summer, the sea ice generally becomes more fragmented, with areas of open water appearing more widespread between pieces of sea ice," Labe told Live Science in an email.

This means that local weather conditions and ocean currents can create large gaps between ice floes, Labe said. For example, strong winds can push ice fragments together or pull them apart, leading areas of water to widen or close within hours or days.

"Individual satellite images from around the North Pole in just the last two weeks show dramatic changes in the amount and location of visible open water," he noted.

The current extent of Arctic sea ice isn't particularly low when compared with record-setting years, but that's now very changeable due to the diffuseness of the ice, Stroeve said. "Winds could change and compress the ice into a more compact ice cover leading to sudden drops in total extent," she said.

There is no specific distance from the North Pole at which open water should normally stop, because Arctic conditions can vary substantially from year to year, Labe said. However, the summer ice has become thinner and more fragile in recent years, so open water is consistently reaching closer to the North Pole than it did before.

"To me, this image doesn't necessarily show that conditions are dramatically worse this year compared to other recent years," Labe said. "Instead, it represents a worrying snapshot of a very different Arctic Ocean than only a few decades ago and one that is quickly changing over time."

The Arctic is warming nearly four times faster than the global average. Some of the northernmost regions that have historically boasted expansive, thick and persistent ice at the end of summer now have young, brittle ice floes instead, Labe said.

"The broader implications of more open water across the Arctic Ocean are wide-ranging, from changes in local weather and ocean conditions to impacts on marine ecosystems and greater coastal risks like erosion and flooding for Arctic communities," he said.

Scientists expect that sea ice will start to refreeze by mid- to late September, closing at least some of the gaps.

  •  

'The apple you eat isn't the apple your granddaughter will eat': What's on the menu in a warming world?

Burning Up

As the planet warms, our environment will be transformed, but so will our bodies. In this series, we investigate the health impacts of climate change, focusing on heat, air quality, food and infection risk. We also evaluate the promising solutions that could help us adapt to our warmer future.

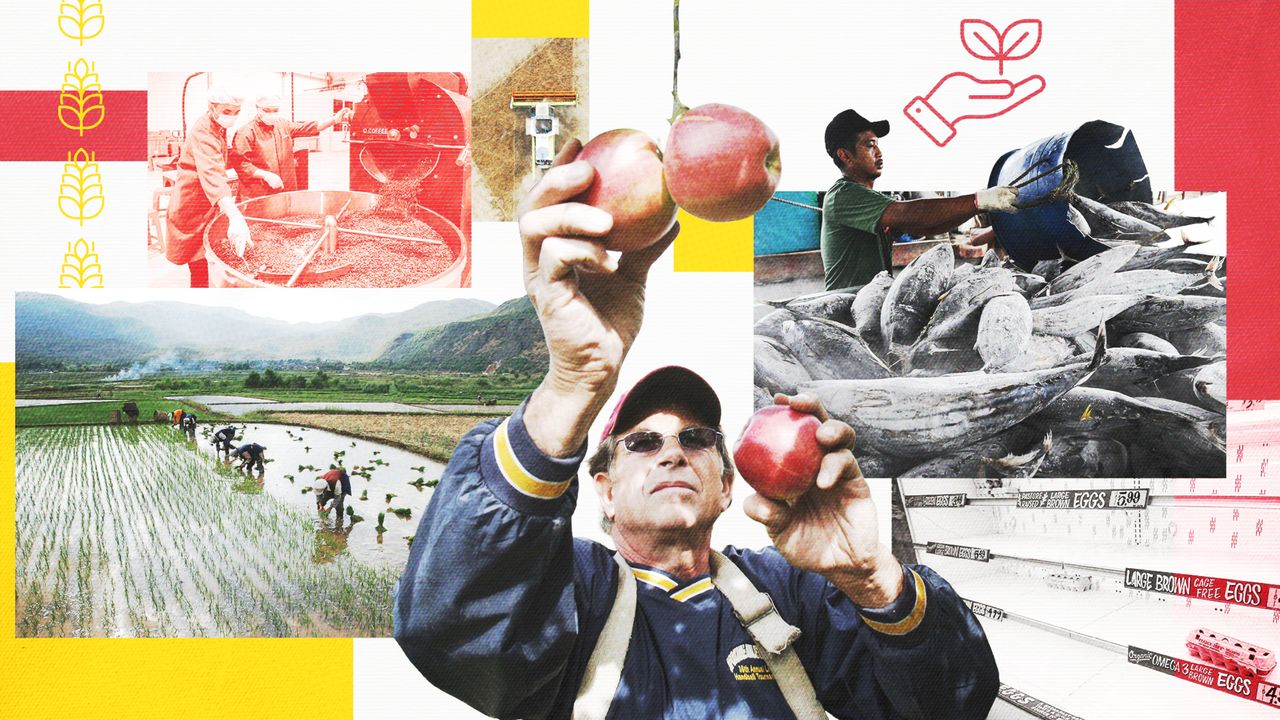
With only a couple of months to go before the harvest season for winter wheat in Colorado, the crop faced a whiplash: After a warm, dry winter, a cold snap plunged the plants into freezing weather for 12 hours, and temperatures soared to nearly 90 degrees Fahrenheit (32.2 degrees Celsius) two days later. When the final harvest numbers were tallied in July, 73% of the crops were in poor or very poor condition. According to early estimates by Colorado Wheat, 2026's winter wheat crop was the smallest in the state since 1965.

Pick a crop, any crop, and you'll hear a similar story: Extreme weather and climate change are rocking the food supply. The warming climate makes food less nutritious, threatens crop survival, and triggers tipping points that would upend farming as we know it.

The impacts will be felt most intensely in less-developed regions of the world, where many people can't afford imported food and climate-related famines and nutritional scarcity are already happening.

A traditional farming village surrounded by plowed fields in Democratic Republic of the Congo. But when did farming start?

Climate change is threatening farming around the globe. (Image credit: Jason Edwards/Getty Images)

But the U.S. is facing big changes to its food systems too, and no one is immune. Humans have overcome looming agricultural disasters before, but experts say the challenge should not be underestimated.

"There are real food security and nutrition concerns," said Andrew Hultgren, an environmental economist at the University of Illinois, Urbana-Champaign, "especially under these high-warming futures."

Food is becoming less nutritious

As the planet warms, food crops are expected to become less nutritious. That's because, due to plant biology that's not yet fully understood, crops grown under higher levels of carbon dioxide are deficient in zinc, protein, magnesium, iron and other micronutrients. Crops are already less nutritious than they were in the 1950s, but this is partly due to breeding decisions that prioritize yield over nutrition. The carbon dioxide deficiencies will exacerbate this nutrition decline.

The global monthly average concentration of carbon dioxide in the atmosphere is now over 420 parts per million (ppm), well over the preindustrial average of 280 ppm. By the end of the century, those levels will increase to at least 550 ppm in all but the most optimistic scenarios.

That will mean an additional 175 million people will be zinc deficient and an additional 122 million people will be protein deficient by 2050, a 2018 study found. Zinc deficiency has consequences for immune and skin health and may lead to poor growth in childhood; protein deficiency can also cause stunted growth as well as fatigue, muscle weakness and stress fractures. Those figures account only for the effects of carbon dioxide. A cascade of climate shifts and extreme weather may also affect the number of nutrients (and calories) available to the world.

The threats are myriad: Rising sea levels may inundate farmland and lead to saltier soil in coastal regions where, for example, rice farming is common. Soil salinity can make it impossible to grow crops in some regions. Droughts, heat waves, storms or temperature swings like those seen in Colorado this year might take out certain crops in particular places, leading to year-by-year price spikes or shortages. In the U.S., the results might look a lot like the recent egg shortages triggered by bird flu; temporarily empty shelves, price spikes, or even restrictions on the amount a customer can purchase in a visit for an affected food.

A view of the Atlantic Ocean and the US east coast with blue colors in the dark ocean.

Phytoplankton blooms, like the one that grew off the Atlantic coast in April, can make seafood toxic. Such blooms will become more common as climate change worsens. (Image credit: NASA Earth Observatory/Michala Garrison)

Climate shifts that harm pollinators and fuel the spread and introduction of plant pathogens such as harmful fungi will also likely reduce crop yields.

Areas that depend on the ocean for food are also facing steep challenges, due to both ocean acidification and the degradation of coral reef ecosystems, which are sources of food for many coastal communities and form much of the base of food chains for the larger fish people eat.

Hotter weather also affects food safety, said Christopher Golden, a professor of nutrition and public health at the Harvard T.H. Chan School of Public Health.

"Increasing sea temperature and increasing sedimentation within seas could lead to harmful algal blooms or increasing food poisoning events from temperature-related food spoilage," Golden said. Algal blooms can contaminate shellfish like oysters or scallops with neurotoxins that can sicken and kill people who eat them. Food spoilage is a concern in regions such as Madagascar, where catches are brought ashore and readied for consumption in the open air.

Meanwhile, fish may move poleward to avoid the hottest sea temperatures, leaving the most vulnerable regions ‪—‬ such as Southeast Asia, the Caribbean, Africa, Central America and the Pacific ‪—‬ with fewer fish in their waters. How bad this looks depends on the extent of the climate swings, with research suggesting that without any mitigation, fishers could see their catches decline by 58% to 92% off small islands in the Pacific and by 70% to 86% in Southeast Asia. This would drive food insecurity and malnutrition in those regions. The U.S. will likely face impacts too, as most of its seafood is imported from subtropical or tropical waters elsewhere.

Climate change is bad in that it's a slow-moving wave. You don't really notice that it's shifting underneath you and that the apple you eat isn't the apple your granddaughter will eat.

Elizabeth Wolkovich, professor of forestry at the University of British Columbia

There may be shifts in trade networks that lessen the blow for U.S. consumers, Golden said, but it's hard to predict. Some possibilities include "price shifts or trade shifts that lead to changing dietary patterns or more shelf-stable and heavily processed items that we know aren't good for your health," he said. In other words, less fresh-caught snapper and more potted meats.

Changing foods on the table

Individual producers are adapting, sometimes in ways that may not be immediately obvious to consumers. "Climate change is bad in that it's a slow-moving wave," said Elizabeth Wolkovich, a professor of forestry at the University of British Columbia. "You don't really notice that it's shifting underneath you and that the apple you eat isn't the apple your granddaughter will eat."

On that note, growers in the Pacific Northwest and U.S. Northeast will face challenges getting apples to lunch boxes around the world. Fewer cold days and more extreme-heat days will likely reduce apple yields by affecting how and when trees go dormant and bloom. Because it takes five or more years to establish fruiting trees in new regions, this could mean a reduced apple supply and higher prices.

Today's smooth arabica coffee (Coffea arabica) varieties may get harder to find and more expensive as climate change forces coffee growers out of many of the places they used to farm and droughts reduce supply. Earthier, more bitter robusta coffee beans (Coffea canephora) do better in warming temperatures, but even those beans could struggle with increasing seasonal variability caused by climate change.

Climate has already shifted wines in favor of less-acidic and higher-alcohol varieties, Wolkovich said, but it's happened slowly enough that, unless you're a connoisseur, you may not have noticed. Wine lovers can expect more changes: Wolkovich has found that the varieties of wine grapes that growers can produce will shift with climate change. Wildfires in grape-growing regions like California can also produce an unpleasant acrid and smoky flavor in wine.

A large cloud of gray smoke is seen behind a mountain with rows of green crops in the foreground.

Wildfires, which will become more common, can lend a smoky, acrid flavor to wines. (Image credit: George Rose via Getty Images)

And it's not just flavors that will be affected. U.S. dairy cattle breeds originated in cool and cloudy Northern Europe, and their milk output goes down as temperatures climb. Such heat stress reduced annual milk yield by an average of 1% a year between 2012 and 2016 alone, and heat-related losses are expected to balloon by 30% by 2050.

Americans have long been drinking less milk from the glass, but their demand for yogurt and cheese is rising, said Jared Hutchins, an assistant professor of agricultural and consumer economics at the University of Illinois Urbana-Champaign and first author of the study on milk yield. Those products depend heavily on the fat and protein content in milk, which is the first thing to drop when cattle are hot. "Fat and protein are what deliver the cultured dairy products that are in high demand," Hutchins told Live Science.
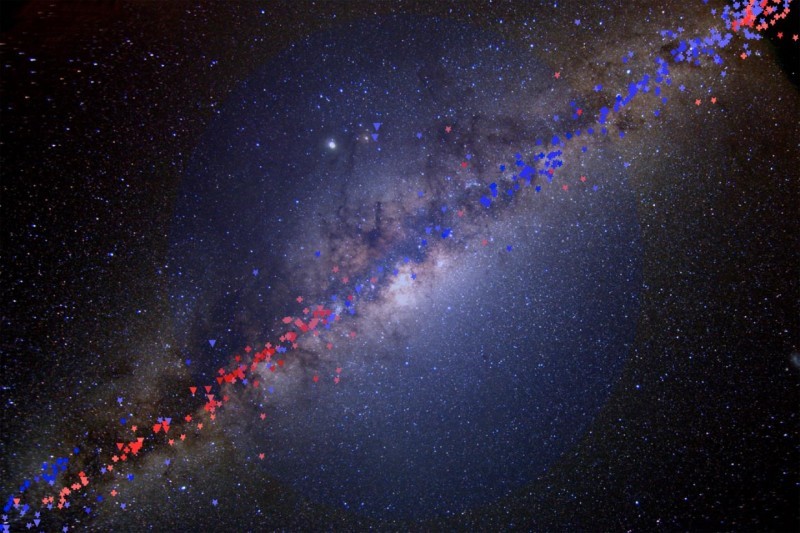
A man stands in a feedlot surrounded by brown and white cows.

For many of the European cattle breeds currently used in dairy production, overall yield, as well as the protein and fat content, decrease in hotter conditions. (Image credit: Pierre Crom via Getty Images)

The story repeats itself across agricultural products, Hultgren said. "For each degree of that global temperature rise, caloric output [from crops] drops by 120 kilocalories or U.S. calories per person per day," he said, "which is about 4.5% of a person's daily recommended caloric intake."

That calculation, published by Hultgren and his colleagues in the journal Nature in 2025, already accounted for adaptations that farmers can make to reduce crop losses. Without those adaptations, the number would be over 30% higher, he said.

Reductions in available calories will translate to food shortages in vulnerable places, such as the Horn of Africa or India, said Marina Romanello, executive director of a multinational research project that tracks the impacts of climate on health at University College London. In North America, "it would feel like inflation," Hultgren said ‪—‬ yet another factor driving up grocery prices.

Worst-case scenarios

For farmers, the year-by-year uncertainty of climate change is a problem. Will this year bring drought? Will there be a sudden storm or flood that will wash away the spring crop? Should they take a risk on a new heat-resistant plant or agricultural technique?

Similar uncertainty haunts the long-term forecast. Climate tipping points can lead to sudden, irreversible changes in the system. For agriculture, one of the scariest tipping points is the potential collapse of the Atlantic Meridional Overturning Circulation (AMOC). This pattern of ocean currents brings warm surface water north from the equator and circulates cold water south, warming Northern Europe and the northern parts of North America and cooling the Southern Hemisphere.

If this current were to collapse, northwestern Europe would cool dramatically, with studies suggesting that London could see temperature lows of minus 4 F (minus 20 C) ‪— ‬colder than the city's lowest temperatures on record. Precipitation would decline across Europe, leading to drought. Meanwhile, in the Amazon, the wet season could become the dry season and vice versa, said René van Westen, a climate researcher at Utrecht University in the Netherlands who has studied the impacts of an AMOC collapse.

On the other hand, if the AMOC doesn't collapse, London is expected to warm by 4.9 F (2.7 C) and see 15% to 18% more precipitation, depending on the season. The uncertainty in these predictions makes preparations difficult. There is still a lot of controversy over whether the AMOC will collapse and, if so, when. Should farmers plan for England to become increasingly toasty, or should they expect it to be plunged into a little ice age?

AMOC-related changes will take decades to centuries to unfold, even with a total collapse, van Westen told Live Science. But even so, they would require a total rewriting of agriculture in Europe and the northeastern U.S. "It will be very challenging to adapt to such a scenario," he said.
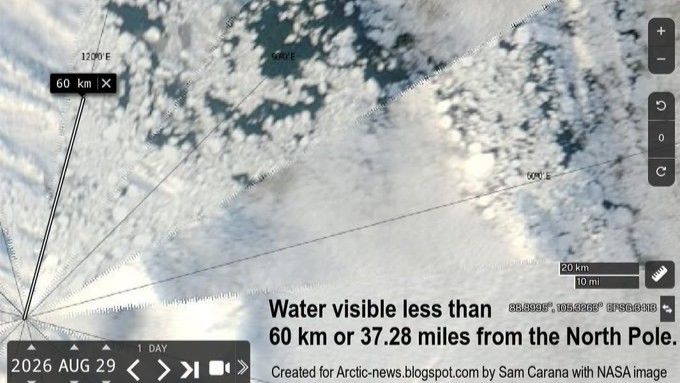
That doesn't mean a collapse of the world food system is inevitable. Farmers are already adapting to the early impacts of climate change by scaling back water-hungry crops in drought years and, in some places, testing new, heat-resistant varieties of crops in an attempt to stem the losses.

A person wearing jeans and a pink hoodie stands on a ladder next to an apple tree.

The apples we eat now, like honeycrisps, may not fare well under climate change. (Image credit: Bloomberg via Getty Images)

And humans have overcome looming disaster in agriculture before: In the 1950s and 1960s, new varieties of rice and wheat, along with the availability of synthetic nitrogen fertilizers, spurred the "Green Revolution," tripling the world's yield of cereal crops while expanding farmland by only 30%. Similar innovations could limit hunger even as the world warms.

But the biggest way to mitigate these impacts is the most obvious one. While Hultgren and his colleagues found that adaptation could cut caloric losses under climate change by 30%, mitigating warming by reducing emissions today could slash them by half. Similarly, the AMOC is on a path toward weakening, van Westen said, but as long as humans slow the pace of climate change, the current can recover.

"If you are cutting your emissions," van Westen said, "you can lower your risk."

Help us improve Live Science Pro: We're always trying to make our content better. Leave us feedback about Pro here.

Do you know where pumpkins and blueberries come from? Find out with our fruits and vegetables quiz!

  •  

An ancient 'supervolcano' has been found hiding beneath eastern England. But experts say there's not enough evidence to call it that.

Scientists have identified an ancient volcano on England's east coast that is so eroded, it took researchers three decades to piece together its enormous size and explosive past. What remains of the caldera system is located beneath the English counties of Norfolk and Lincolnshire.

However, while the volcano undoubtedly produced at least one huge-scale eruption, some experts don't think there is enough evidence for the structure to be called a supervolcano.

"It obviously must have been a very large eruption, but it would be very difficult to calculate the volume of the eruption given the poor preservation of the deposits," said Michael Poland, a research geophysicist with the Cascades Volcano Observatory and the scientist-in-charge of the Yellowstone Volcano Observatory. "This is part of the reason I really hate the term 'supervolcano,'" Poland, who was not involved in the discovery, told Live Science in an email.

In a recent analysis, published April 29 in the Geological Society of America Bulletin, scientists examined zircon crystals that were taken 80 years ago from boreholes 40 miles (65 kilometers) apart in Norfolk and Lincolnshire. Zircon crystals are smaller than the diameter of a human hair and form within molten magma underground before a volcano erupts. They contain uranium that decays into lead isotopes at a known rate, enabling researchers to precisely date eruptions.

The results showed an age match between the zircon crystals from Norfolk and Lincolnshire and counterparts taken from the Kinnekulle tephra, a thick layer of volcanic ash covering Scandinavia and the Baltic region. This suggests the ash plume from the volcano in what is now eastern England blew across the Tornquist Sea, a body of water that existed during the Ordovician period (488.3 million to 443.7 million years ago), and settled on what is now Scandinavia.

Evidence of the ancient volcanic ash near train tracks in Norway.

The Kinnekulle tephra is visible next to train track north of Oslo in Norway. Dipping strata of the Arnestad Formation (Late Ordovician) contain thin beds of gray-green altered volcanic ash. (Image credit: © Tim Pharaoh)

Researchers already knew that the Kinnekulle tephra was formed during a massive volcanic eruption. But the recent analysis shows for the first time how far the ash traveled and, therefore, how big the eruption really was.

The eruption would have also produced huge pyroclastic flows, or avalanches of rocky debris, ash and hot gas that race down the sides of some erupting volcanoes, said Peter Rowley, a volcanologist and senior lecturer at the University of Bristol in the U.K. who was not involved in the analysis. "The last eruption of this kind of scale was the Oranui event at Taupō in New Zealand, over 26,000 years ago," he told Live Science in an email.

However, while the explosion would have been impressive and equivalent to the force of thousands of atomic bombs, experts said the definition of a supervolcano is vague and there are better ways to describe what happened.

"The scientific definition of a supervolcano varies a little; it’s a term we tend not to use as volcanologists much," Rowley said. "In this case we would describe it as an ultraplinian eruption."

Ultraplinian eruptions are the most violent type of volcanic explosions, ejecting more than 240 cubic miles (1,000 cubic kilometers) of material. It's difficult to say exactly what the eruption that formed the Kinnekulle tephra would have looked like, but it likely lasted days to weeks and formed ash clouds taller than 25 miles (40 km) that reached into the stratosphere.

Geologists tend to reject the term supervolcano because it is imprecise, instead preferring to describe eruptions by the volume of material they eject.

Stephen Self, a physical volcanologist at the University of California, Berkeley, agreed that the term supervolcano can be too vague. "Supervolcano has become a kind-of buzz-word," he told Live Science in an email. "It's the deposits of the eruptions that are recognized, not the volcano."

Very little of the material ejected in England's ultraplinian eruption remains today, because most of it was eroded or buried. "The geological record is far from complete so it can be very difficult to say much about these eruption volumes with very old volcanoes," Rowley said.

A field in England where scientists drilled boreholes into an ancient volcano.

The location of one of the borehole samples studied, at North Creake in Norfolk. (Image credit: © Tim Pharaoh)

Similarly, the Kinnekulle tephra has been degraded over time, Poland said.

The analysis also found evidence for an earlier eruption of the volcano that occurred 453.7 million years ago. However, there is no trace of these eruptions at the surface today; the boreholes are located in some of England's flattest landscapes, study first author Tim Pharaoh, a geophysicist with the British Geological Survey, said in a statement in August.

It's not surprising to find traces of big, ancient volcanoes in England. The recently identified volcano is part of a wider volcanic system that was active 450 million years ago and includes Eryri National Park in Wales and the Lake District in northwestern England, Rowley said.

"It's best not to imagine whole preserved volcanoes, but rather that we have deposits from their eruptions, or rocks which formed in the magma reservoirs beneath the original volcano," Rowley said. "These are often deformed and altered by tectonic events meaning that it takes some careful geological investigation to interpret the true picture."

  •  

China reaches solar energy milestone — what does this mean for the world's largest greenhouse gas emitter?

China's solar power capacity has overtaken coal for the first time, marking a major milestone in the country's rapid expansion of renewable energy.

China had about 1,288 gigawatts (GW) of installed solar capacity at the end of July, compared with 1,285 GW of coal-fired capacity, according to figures from the country's energy administration reported by the South China Morning Post.

The milestone could have major implications for global efforts to tackle climate change: China is the world's largest annual greenhouse gas emitter, accounting for around 30% of global planet-warming emissions. If its rapid expansion of renewable energy begins to displace coal-fired power ‪—‬ one of the country's primary sources of greenhouse gas emissions ‪—‬ the impact could extend well beyond Chinese borders.

"China reaching around 1,288 GW of installed solar capacity, marginally overtaking coal, is a major milestone," Matthew Davies, UNESCO chair in sustainable energy technologies and a professor of chemical engineering at Swansea University in the U.K., told Live Science.

However, installed capacity doesn't necessarily equate to actual electricity generation. "Solar only generates when sunlight is available, whereas coal plants can run for much longer periods, so solar still supplies a much smaller share of China's electricity than coal," Davies said.

In other words, China has more solar capacity than coal capacity, but coal remains far more important when it comes to the amount of electricity actually delivered to the grid.

Between January and July this year, Chinese solar power output rose 15.5% compared to the same time period in 2025. Over those seven months, it reached 802.4 TWh, which is around 13% of the country's total electricity consumption.

"I would see this as a structural turning point, not the point at which solar has replaced coal," Davies said. "The key question is whether renewable generation can grow fast enough not only to meet rising electricity demand but to push coal generation down in absolute terms. Given the scale of China's power system, sustained reductions in coal use could have a major impact on global CO₂ emissions."

To do that, China will need to do more than build solar farms. One of the biggest challenges will be integrating all of the new renewable power into the electricity system.

"Installing solar is only part of the transition; grids, transmission, storage and demand flexibility all need to keep pace so that renewable electricity can actually be used," Davies said.

This transition toward solar panels will also make renewable energy more accessible around the world, as China's enormous manufacturing capacity will help drive down the global cost of solar panels. However, Davies said the next phase of the transition is to ensure the whole solar production process is sustainable. "We need to think about where technologies are made, where materials come from, how long they last, and how they are reused or recycled," he said.

Solar panel manufacturing involves raw material extraction, processing, manufacture, transport and installation, so it has an initial carbon footprint. High energy requirement for polysilicon production is a considerable factor as it uses coal-fired power plants. But, this is offset by the electricity they generate.

There is also a case for expanding local and regional manufacturing, Davies noted. Doing so could strengthen supply chains, create local skills and economic value, and make the global energy transition more resilient and equitable. That could be particularly important for expanding access to electricity in parts of the world where reliable power remains limited.

"The global energy transition is not only about replacing fossil fuels in existing electricity systems; it is also about enabling people who still lack reliable electricity to gain access to clean, affordable power," Davies said. "Ultimately, success is not simply about installing more solar panels. It is about building a clean-energy system that is affordable, sustainable, resilient and accessible globally."

  •  

Nobody is preparing for the worst day in history

A massive volcano erupts in Southeast Asia. Ash fall delays flights and destroys crops, while pyroclastic flows wipe out entire towns. Over the following weeks, the sulfur dioxide pumped out turns into a haze of fine acid droplets, eventually wrapping around the entire planet, scattering sunlight back to space. The sun turns pale, shadows go soft, the sky glows violet after sunset and the ground below cools. The next summer never appears. Harvests fail from the American Midwest to the monsoon belt in Asia. Countries close their borders, and people who have never heard of the volcano begin to starve.
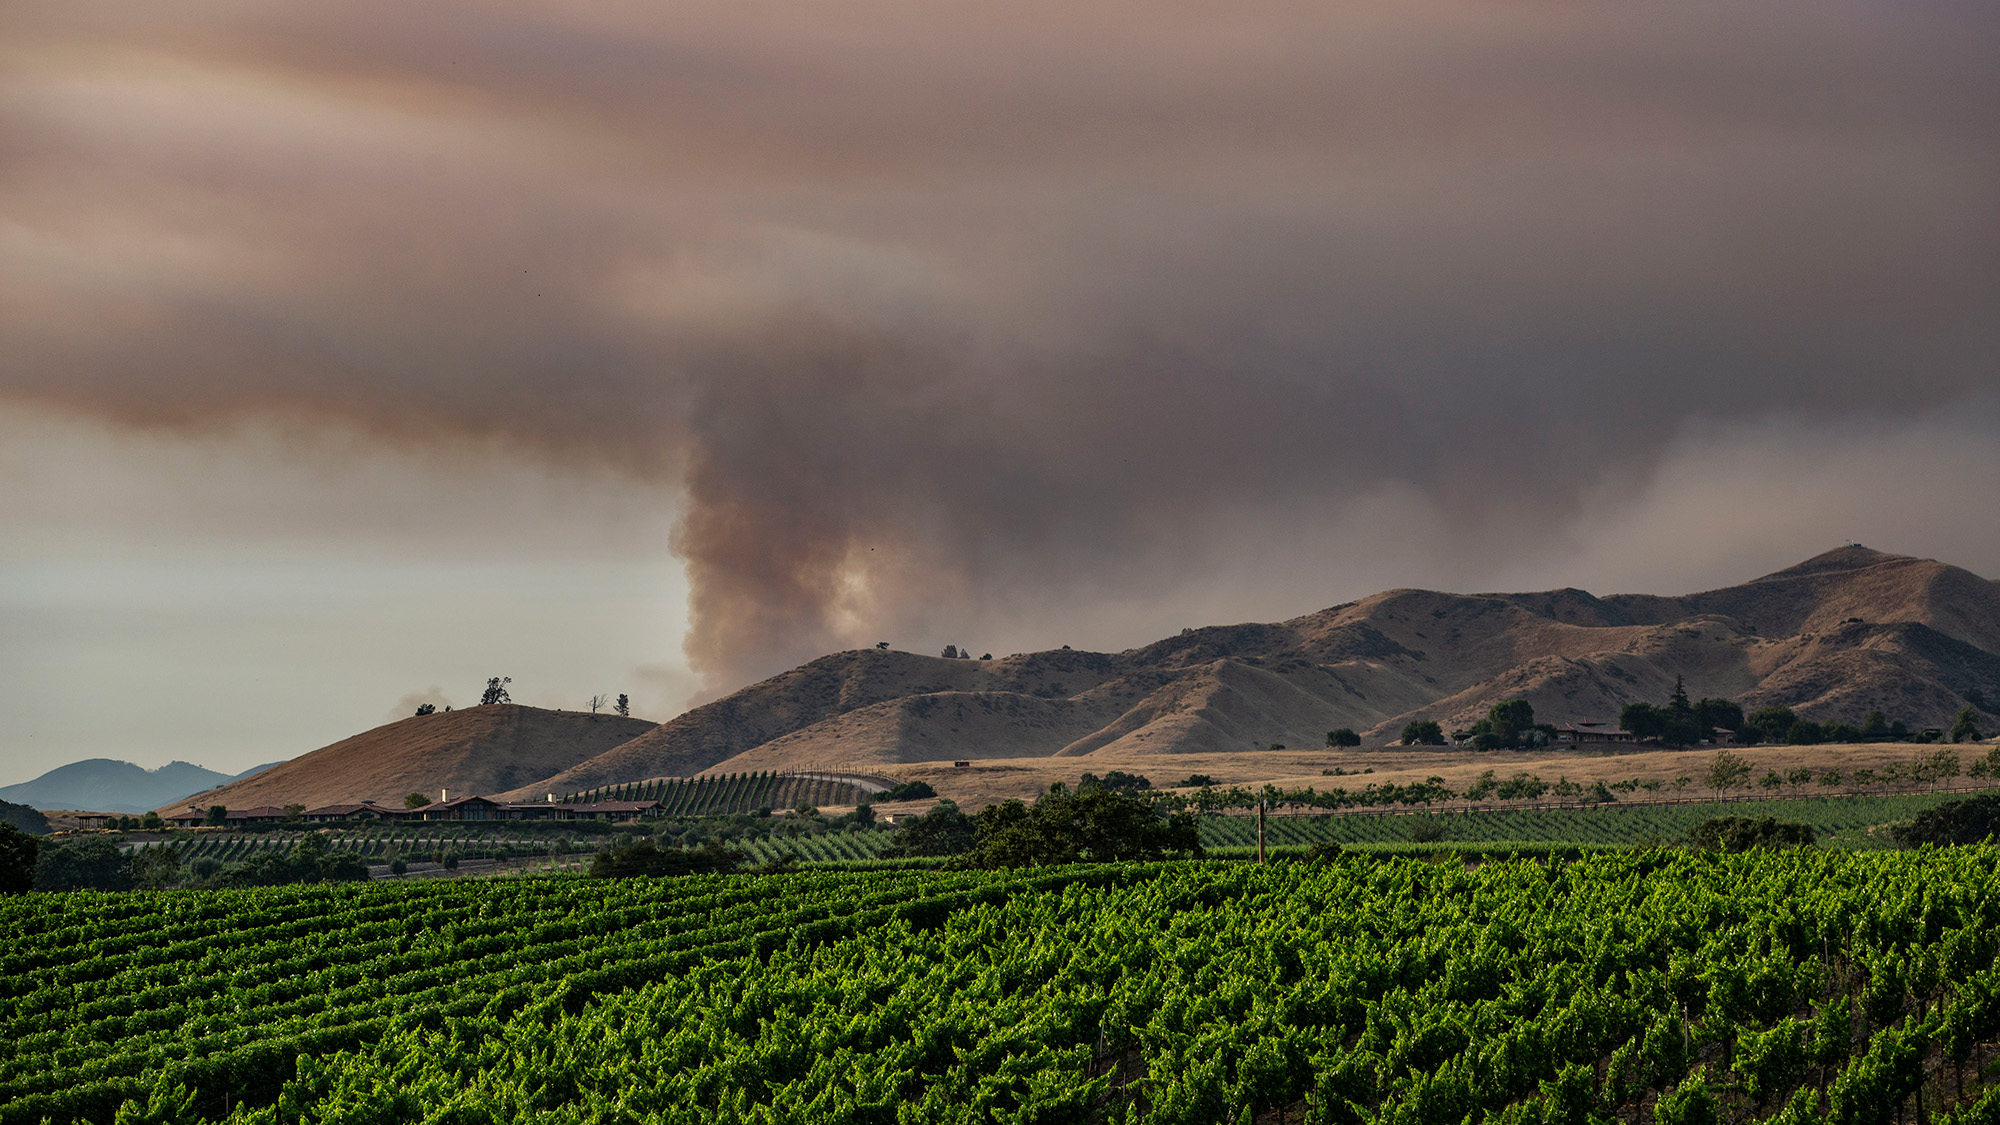
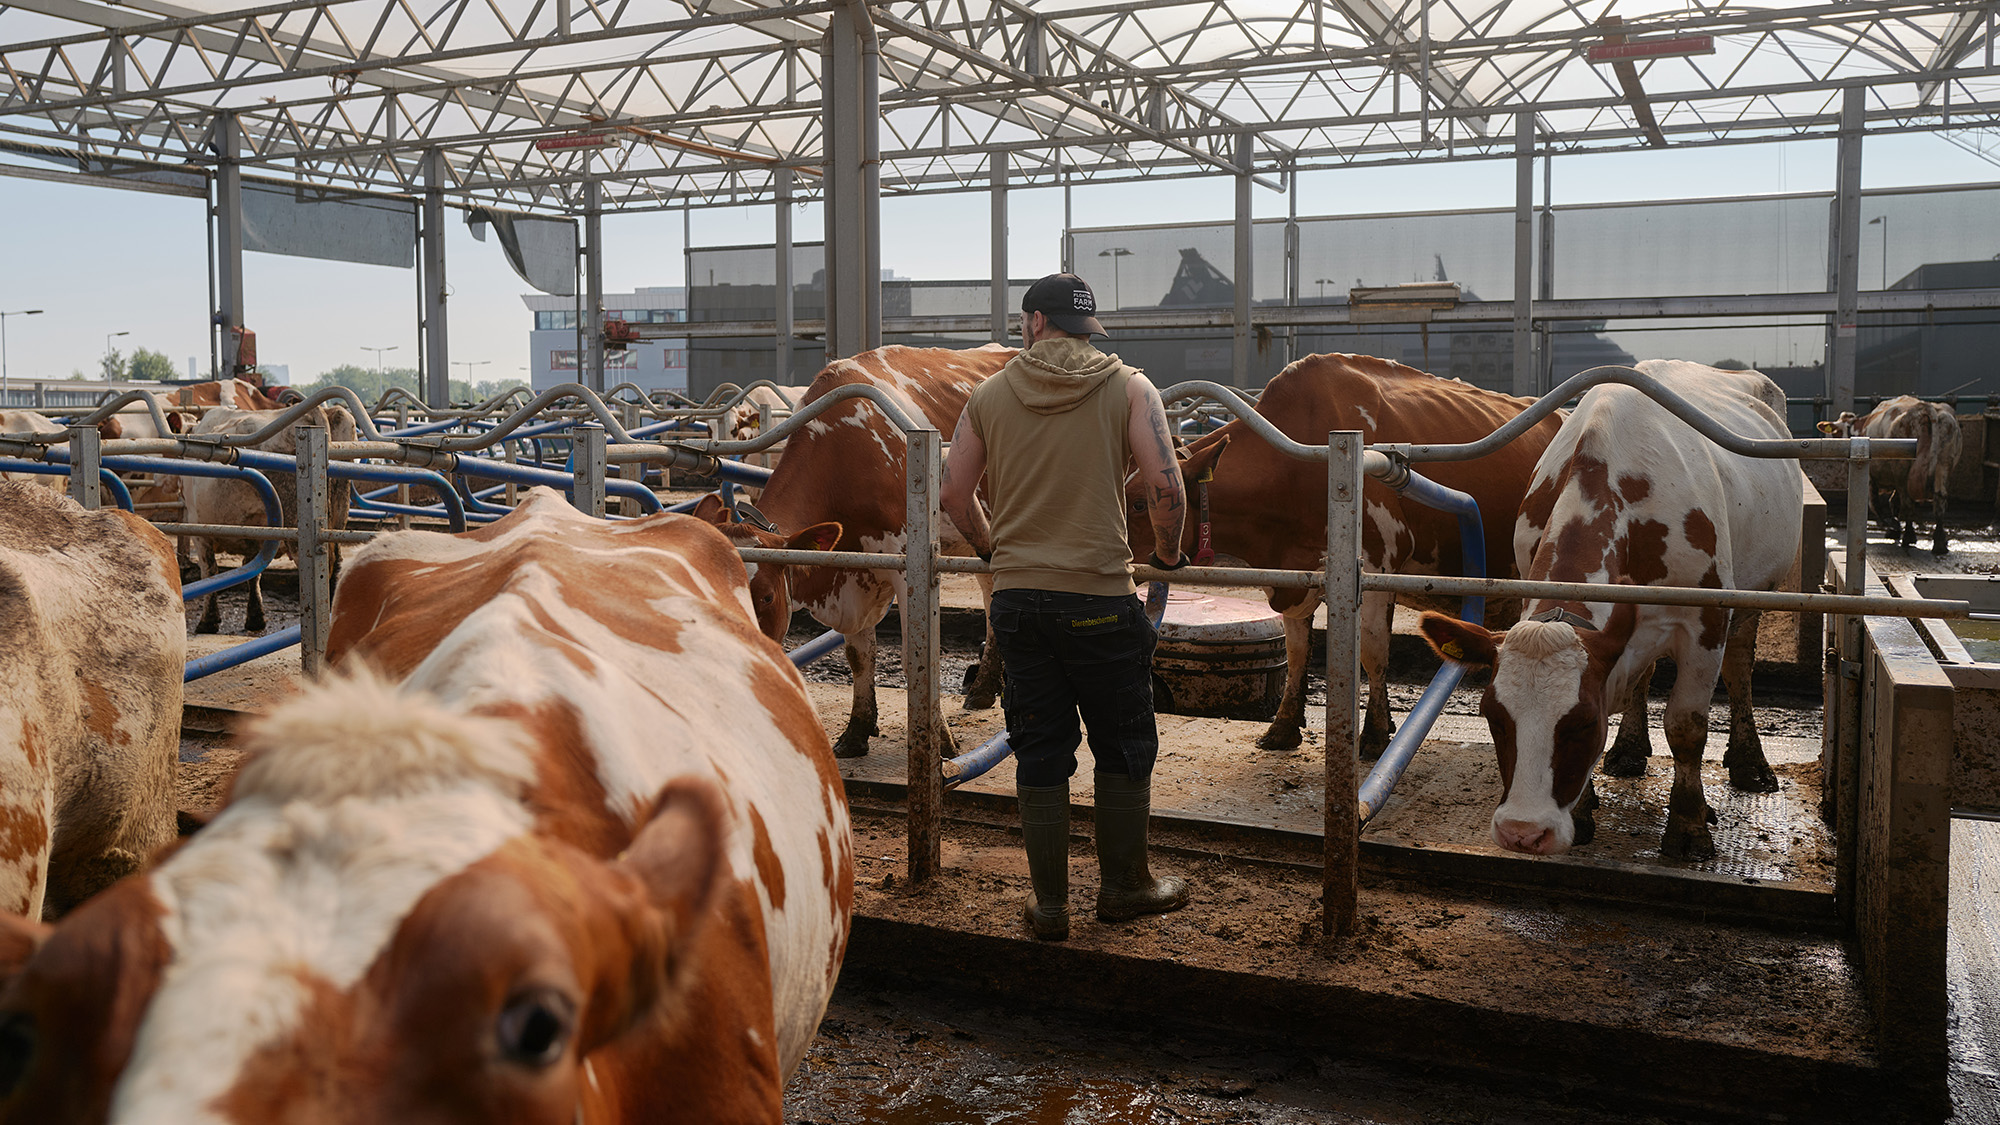
This nightmare scenario has yet to happen, but it's not a matter of if but when a world-changing event like this will hit, and governments need to start preparing for global catastrophes that could disrupt the food system on an unprecedented scale.
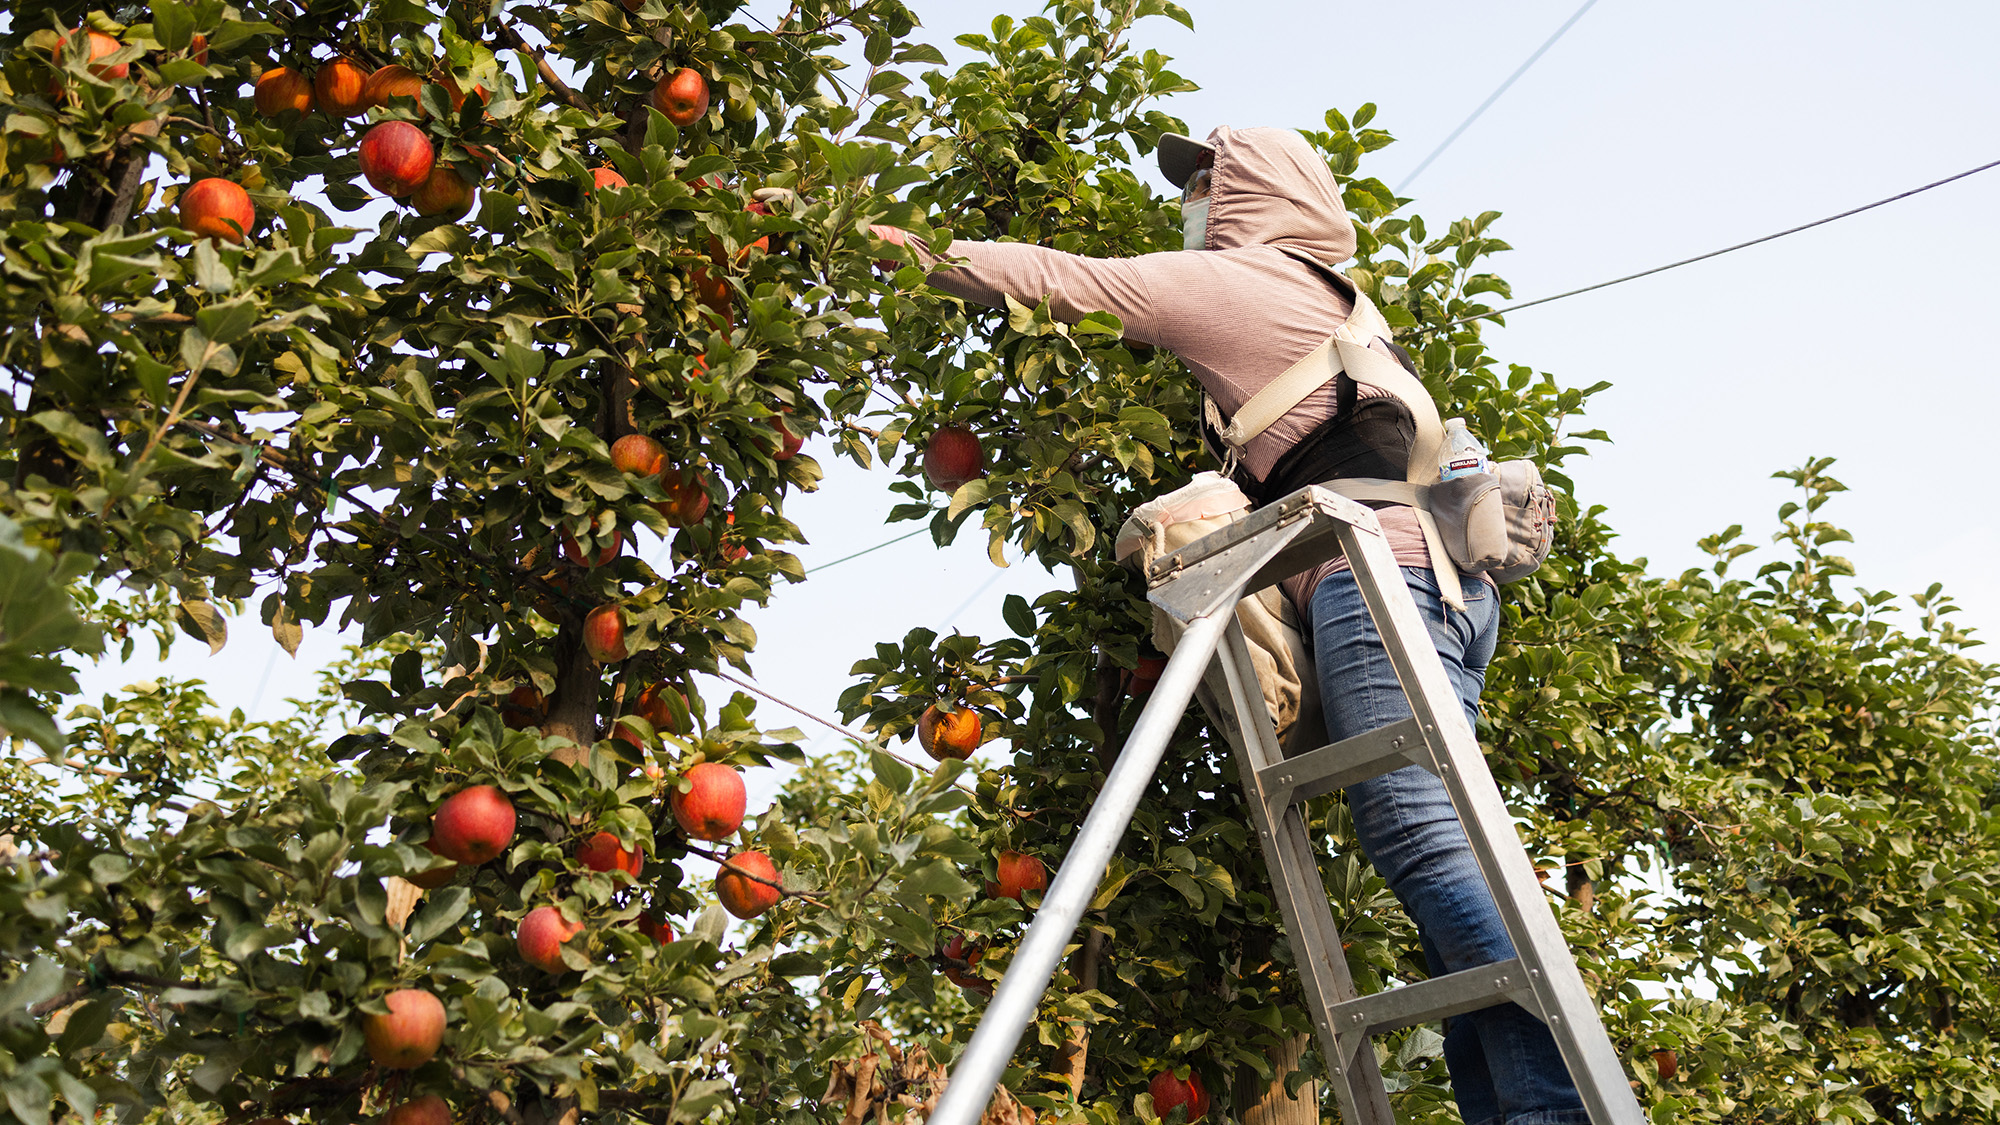
There are three main steps we need to take soon: put events like nuclear war, a huge volcanic eruption and a continent-wide blackout into national risk assessments; agree to trade rules for such an emergency before it arrives; and fund pilot projects now for foods so we know what can be produced at scale without much sunlight or without fertilizer.

We've been faced with turbulent times the last few years with COVID, the Russian invasion of Ukraine and the Iran war. And the current outlook indicates there's more trouble ahead — the closure of the Strait of Hormuz alone could disrupt global food production, for example. A significant part of the world's traded fertilizer passes through it, and the United Nations Food and Agriculture Organization has warned that the shortfall will cut yields into 2027.

This shows that in today’s interconnected world, regional crises will influence countries far away from it. With larger catastrophes, these ripple effects in the global system would be more widespread, quicker to take hold and on a higher magnitude.

Critics might question why we need to prepare for such Black Swan events. But global catastrophes are not as unlikely as they feel. Ice cores enable us to count large eruptions of the past. On that basis, volcanologists put the chance of a magnitude 7 eruption — the size of Tambora in 1815, which caused a "year without summer" — at roughly 1 in 6 this century. Estimates for a repeat of the 1859 Carrington solar storm, which could disrupt power grids on a continental scale, run from about 1% to 12% per decade. Nuclear-armed states are almost constantly engaged in conflicts, risking nuclear war.

The difference between the societies that prepared and those that did not will be measured in lives

Each of these events might seem unlikely. But in combination, they add up to a significant chance that at least one of them will happen this century.

What they all have in common is that they all would drastically impact the food system. A volcanic eruption, the firestorms of a nuclear war or a large asteroid impact all push particles into the upper atmosphere that block sunlight, which would lead to colder, drier growing seasons that could result in harvest losses up to total failure. In the most extreme nuclear war scenario, researchers estimate that global calorie production could drop by around 90%. A long blackout, caused by a powerful solar storm for example, works differently but has the same consequence: no fertilizer, no pesticides, no fuel, and the sharpest yield losses exactly where we produce most food today.

Hardly anyone is assessing these risks. Even the countries doing it best fall short. The U.K. and Switzerland are good examples. The U.K. National Risk Register lists 89 risks, including volcanic eruptions, severe space weather, pandemics and a nuclear miscalculation abroad. However, the catastrophic events it considers are all relatively small-scale — with a "reasonable" worst-case scenario of over 1,000 deaths and a cost of tens of billions of pounds — and the register does not even begin to consider events like a global famine or a nuclear war that could lead to tens of millions of deaths and cost trillions of pounds.

a big mushroom cloud from a volcano erupting with fields and buildings in foreground

The 1991 eruption of Mount Pinatubo in the Philippines reached a magnitude of 6 (of a maximum of 8) on the volcanic explosivity index. This is the biggest eruption of the last 100 years. The last VEI 8 eruption took place around 26,500 years ago. (Image credit: Arlan Naeg/Getty Images)

Switzerland's national risk analysis, meanwhile, covers 44 hazards including a solar storm, a foreign volcanic eruption and a meteor strike. Again, the scale is too small. The volcano is a moderate European eruption and the meteor is 66 feet (20 meters) across, comparable to the Chelyabinsk impact in 2013. Many other countries do not even consider risk on these limited scales.

No country can solve this alone. In a review, my colleagues and I highlighted the key factors that would make countries and communities more resilient to various global catastrophes. These include food self-sufficiency, decentralization, geographic isolation and governance quality — meaning working institutions, low corruption and low inequality. Australia scores best, but even Australia would struggle without imported fuel, medicine and fertilizer. Nowhere is a refuge on its own.

Countries will need international collaboration to make it through a crisis of this scale. Export bans have been a common reflex in food crises of the past. After a global catastrophe, they would only isolate countries from each other and lead to further damage, as export bans can easily lead to the situation where enough food is still around, but nobody is trading it and so people starve.

We need to work on rules to govern trade under those circumstances before a global emergency occurs.

You might say the probabilities are too small to justify the cost, and that money spent on hypothetical volcanoes is money not spent on floods, hospitals and defense. This criticism might land if you only look at a single catastrophe. However, there is a whole portfolio of events that could lead to global catastrophe. In combination, there is a good chance that one of them will hit, and if it does, we better be prepared. Also, many of the preparations needed are not even that expensive. Low-input farming, decentralized grids, a diverse food supply and more exhaustive risk assessment are within grasp of most countries.

This needs to happen now. Starting work on resilient foods or better international agreements when a global catastrophe has already occurred is too late. You cannot start an industry in the month the harvest fails. Clearly, prevention is better than resilience, but some of these events cannot be prevented at all. When one of them arrives, the difference between the societies that prepared and those that did not will be measured in lives.

Opinion on Live Science gives you insight on the most important issues in science that affect you and the world around you today, written by experts and leading scientists in their field.

  •  

The Search for a “Second Earth,” a Magnetic “Clock” in Ancient Pottery, and Alien Life Lurking in Venus’s Clouds

Roman telescope

This week in stories we’re tracking here at The Debrief: NASA’s Nancy Grace Roman Telescope was launched on Sunday, and experts think this could be one of its most important discoveries in the years ahead. Meanwhile, scientists have discovered a magnetic “clock” in ancient pottery that could help museums distinguish real artifacts from modern fakes. And elsewhere, scientists say it might be possible that aliens are lurking in the acidic clouds of Venus.

Ready to get caught up on more of the latest science news? Here’s a look at other stories we’re covering right now at The Debrief…

  •  
❌