❌

Reading view

The Cover-Up of Winter Excess Death Data

The ONS quietly axed its annual excess winter death reports after 2022. Why? asks Paul Homewood. Could it be because they vastly outstrip the number of people that die during summer heat waves?

The post The Cover-Up of Winter Excess Death Data appeared first on The Daily Sceptic.

  •  

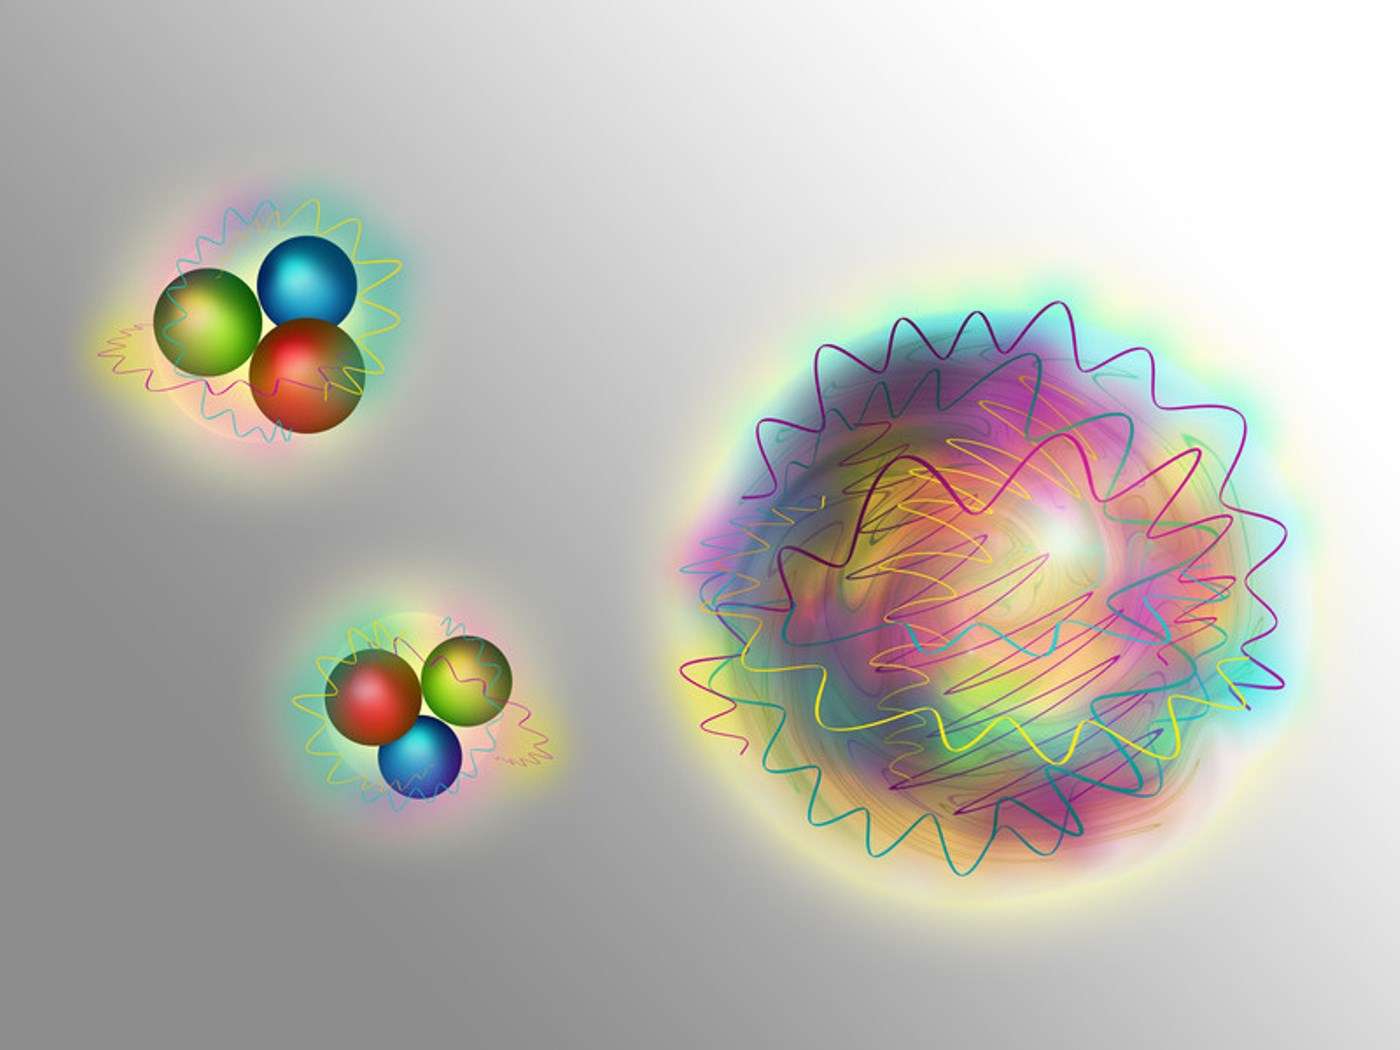
On a détecté des sortes de boules de « photons nucléaires », les glueballs !

Il existe un zoo très riche de particules liées aux forces nucléaires qui lient les protons et les neutrons dans les noyaux, forces qui découlent en fait d'autres plus profondes appelées forces nucléaires fortes et qui « collent » des particules élémentaires, les quarks, dans les protons et les...

  •  

The WHO’s High-Price Pandemic Plan Is Built on Smoke and Mirrors

The WHO and the World Bank want $31 billion a year for pandemic preparedness – but a new Leeds University study says the financial case is built on dubious assumptions and false accounting.

The post The WHO’s High-Price Pandemic Plan Is Built on Smoke and Mirrors appeared first on The Daily Sceptic.

  •  

Grok exfiltrates user data when malicious instructions are encrypted

Earlier this week, researchers outlined an attack that used a secret input provided by Microsoft 365 Copilot for enterprise to cause the AI assistant to exfiltrate a password present in the user’s inbox. Now, a separate team has devised a similar attack against Grok. The new data theft hack employs a deceptively simple trick to force the Elon Musk-owned large language model to steal user chats and other personal information. At the time this post went live, the assistant continued to cough up the data, despite xAI being informed of it in June.

The lesson from both this week’s episodes—and the countless other ones that have come before it—is that LLMs are incapable of solving the root causes for prompt injections, the most severe vulnerability classes they’re most prone to. That leaves AI developers with no other option but to build a guardrail that steers the model away from the harmful actions. As I noted in Tuesday’s story, the approach is tantamount to a road traffic safety engineer erecting a protective rail around a dangerous bend rather than banking the curve.

Cryptographic Context Injection in the house

Prompt injections exploit LLMs' training to comply with user requests whenever possible. Attackers can capitalize on the predilection by smuggling harmful instructions into emails or webpages the assistant is instructed to summarize. Because LLMs can’t reliably distinguish between content in an email sent by an untrusted party and user instructions entered directly into a prompt, the overly solicitous LLM faithfully follows them. To date, Grok and other LLMs' only recourse is to create guardrails that flag suspicious instructions and forbid them from being executed.

Read full article

Comments

© Getty Images | SOPA Images

  •  

‘LION’ – new TV series chronicles four-year journey of lion cub Kio

It’s very much a real-life doco version of ‘The Lion King’, with Jon Favreau executive producing, and music from Hans Zimmer echoing themes from the Disney classic. It took Disney+ and BBC Studios’...

The post ‘LION’ – new TV series chronicles four-year journey of lion cub Kio first appeared on Science Illustrated.

  •  

Aug. 17, 1877: Asaph Hall discovers Phobos

Astronomer Asaph Hall met Angeline Stickney at New York Central College in 1855. Two years his elder, she instructed him in geometry and German, and was reputedly so strong a mathematician that Hall and his classmate made a game of trying to stump her, yet never could. The pair were married the following year. ForContinue reading "Aug. 17, 1877: Asaph Hall discovers Phobos"

The post Aug. 17, 1877: Asaph Hall discovers Phobos appeared first on Astronomy Magazine.

  •  

The Sons of Míl: The Science Behind the Irish Legend That Traces the Origins of the Celts to Northern Spain

In 2006, geneticist Bryan Sykes, Professor of Human Genetics at the University of Oxford, published the results of a study that had taken him a decade to complete. His team had collected and analyzed the mitochondrial DNA and Y chromosome of 10,000 volunteers from England, Scotland, Wales, and Ireland, with the aim of reconstructing the […]

  •  

A Linear A Inscription Found on the Island of Crete Reveals a Minoan Ritual and the Name of a God Predating Dionysus

A small object made of dark stone, carved with astonishing precision almost 3,500 years ago, has provided researchers with one of the clearest windows yet into the religion of ancient Crete. It is the inscription known as IO Za 2, engraved on a tiny libation table made of dark green serpentinite, measuring just 4.3 centimeters […]

  •  

Stops Along the Path of Totality

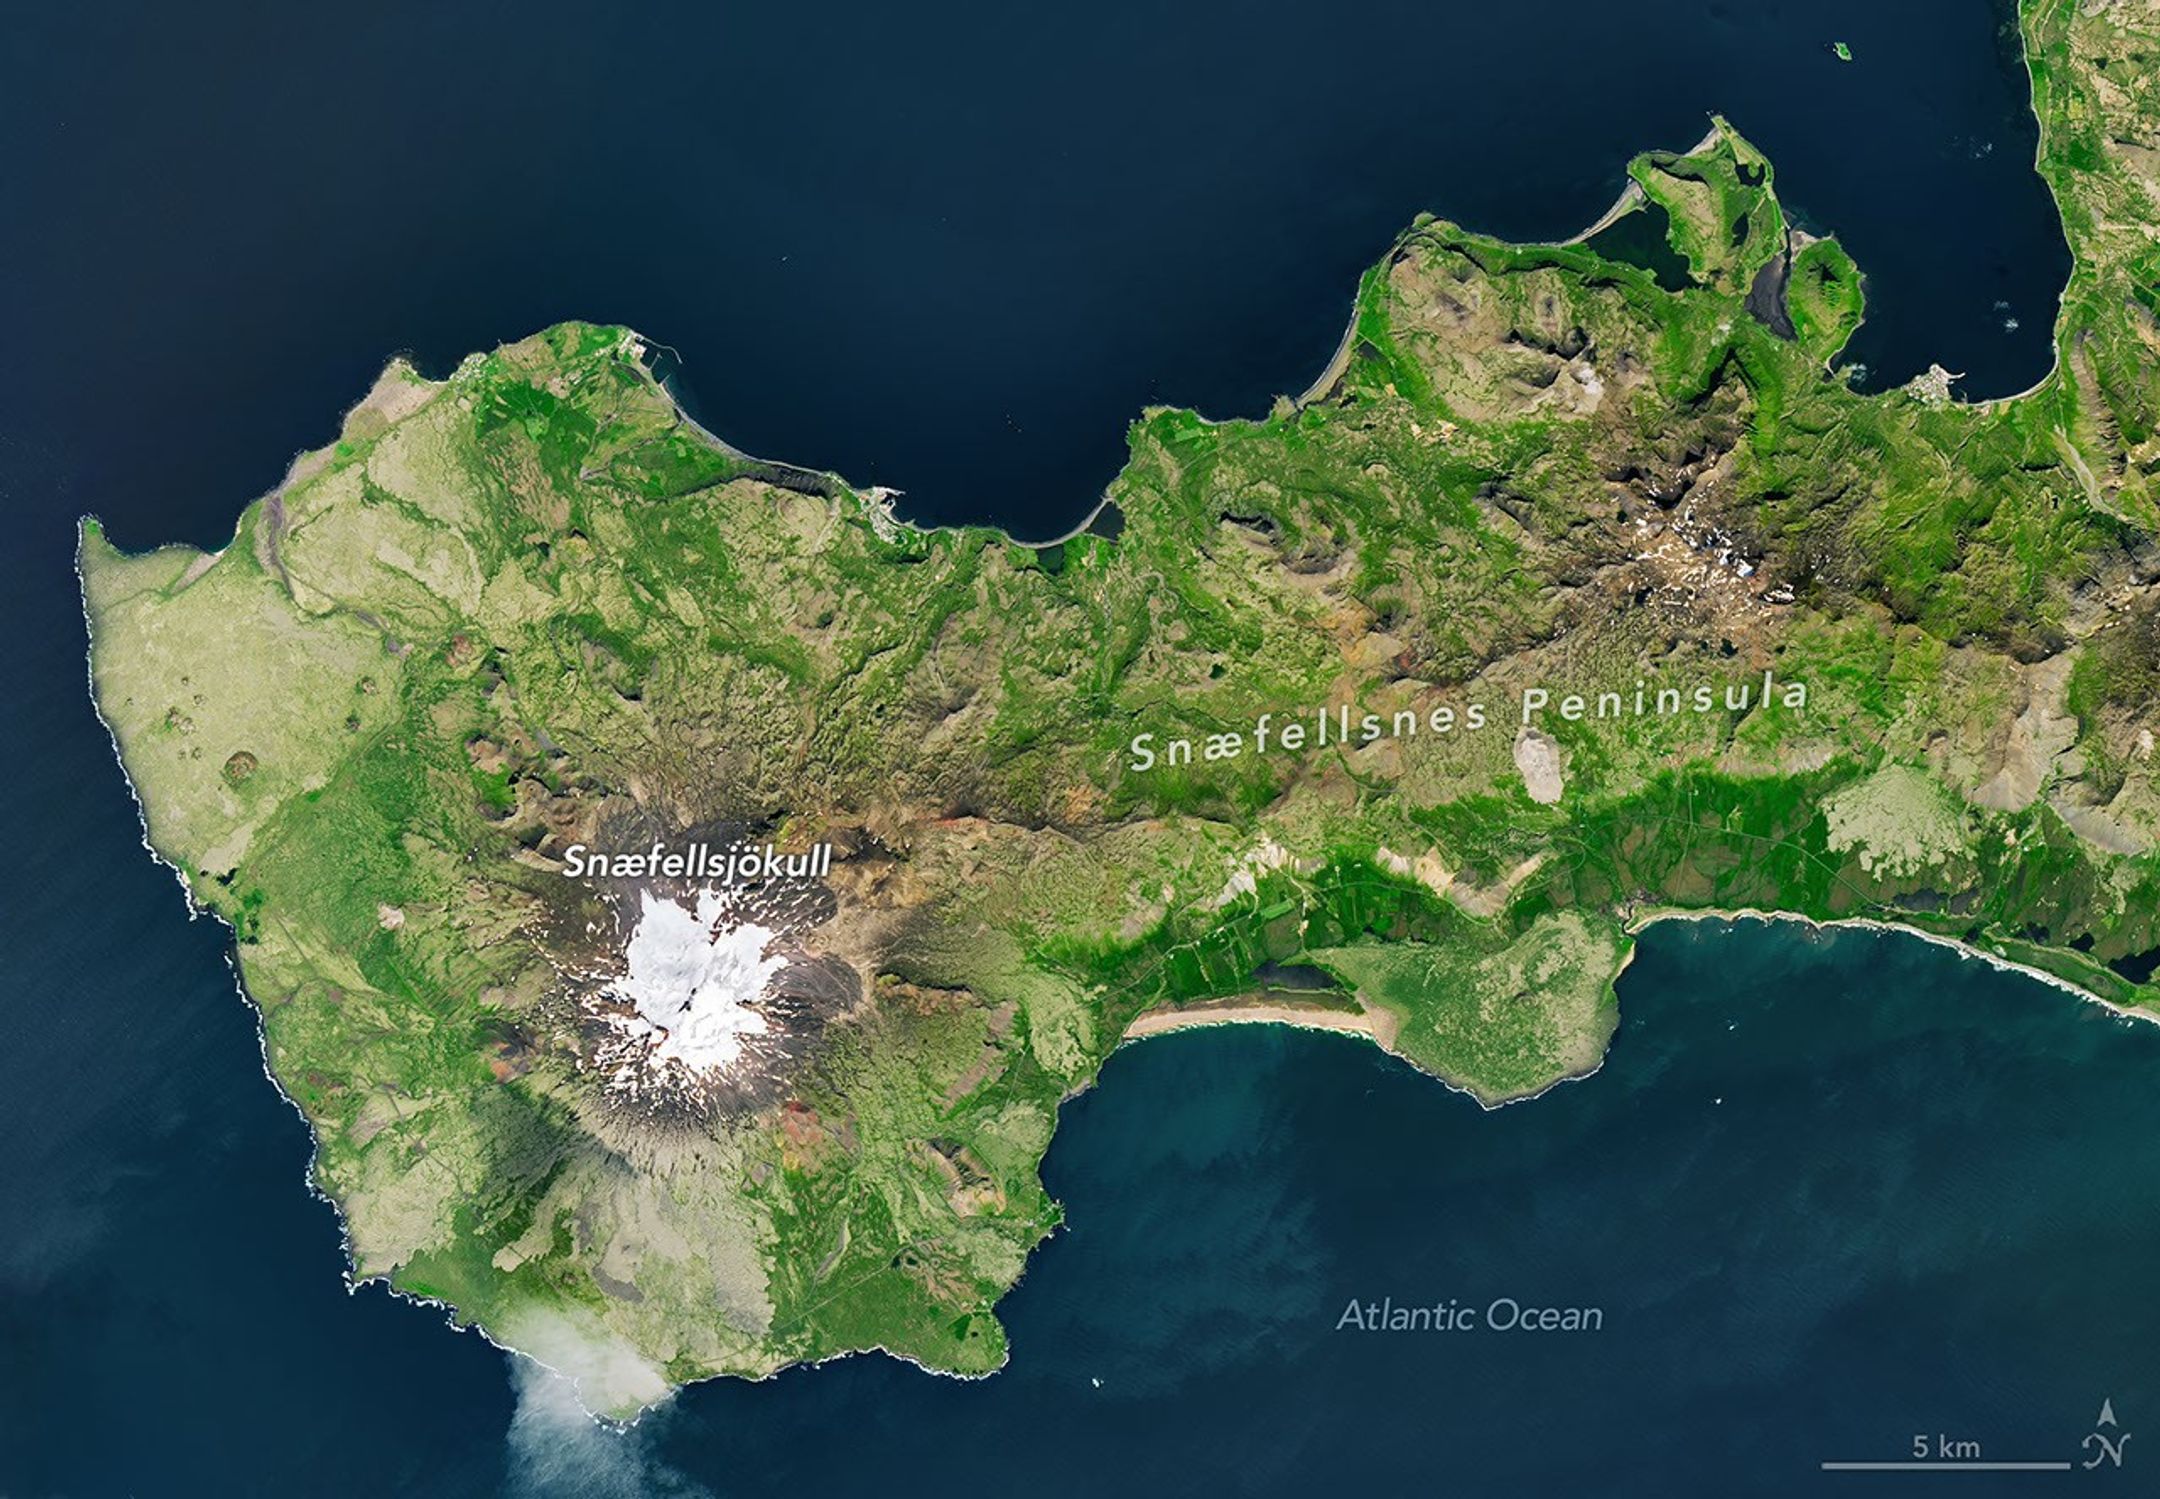
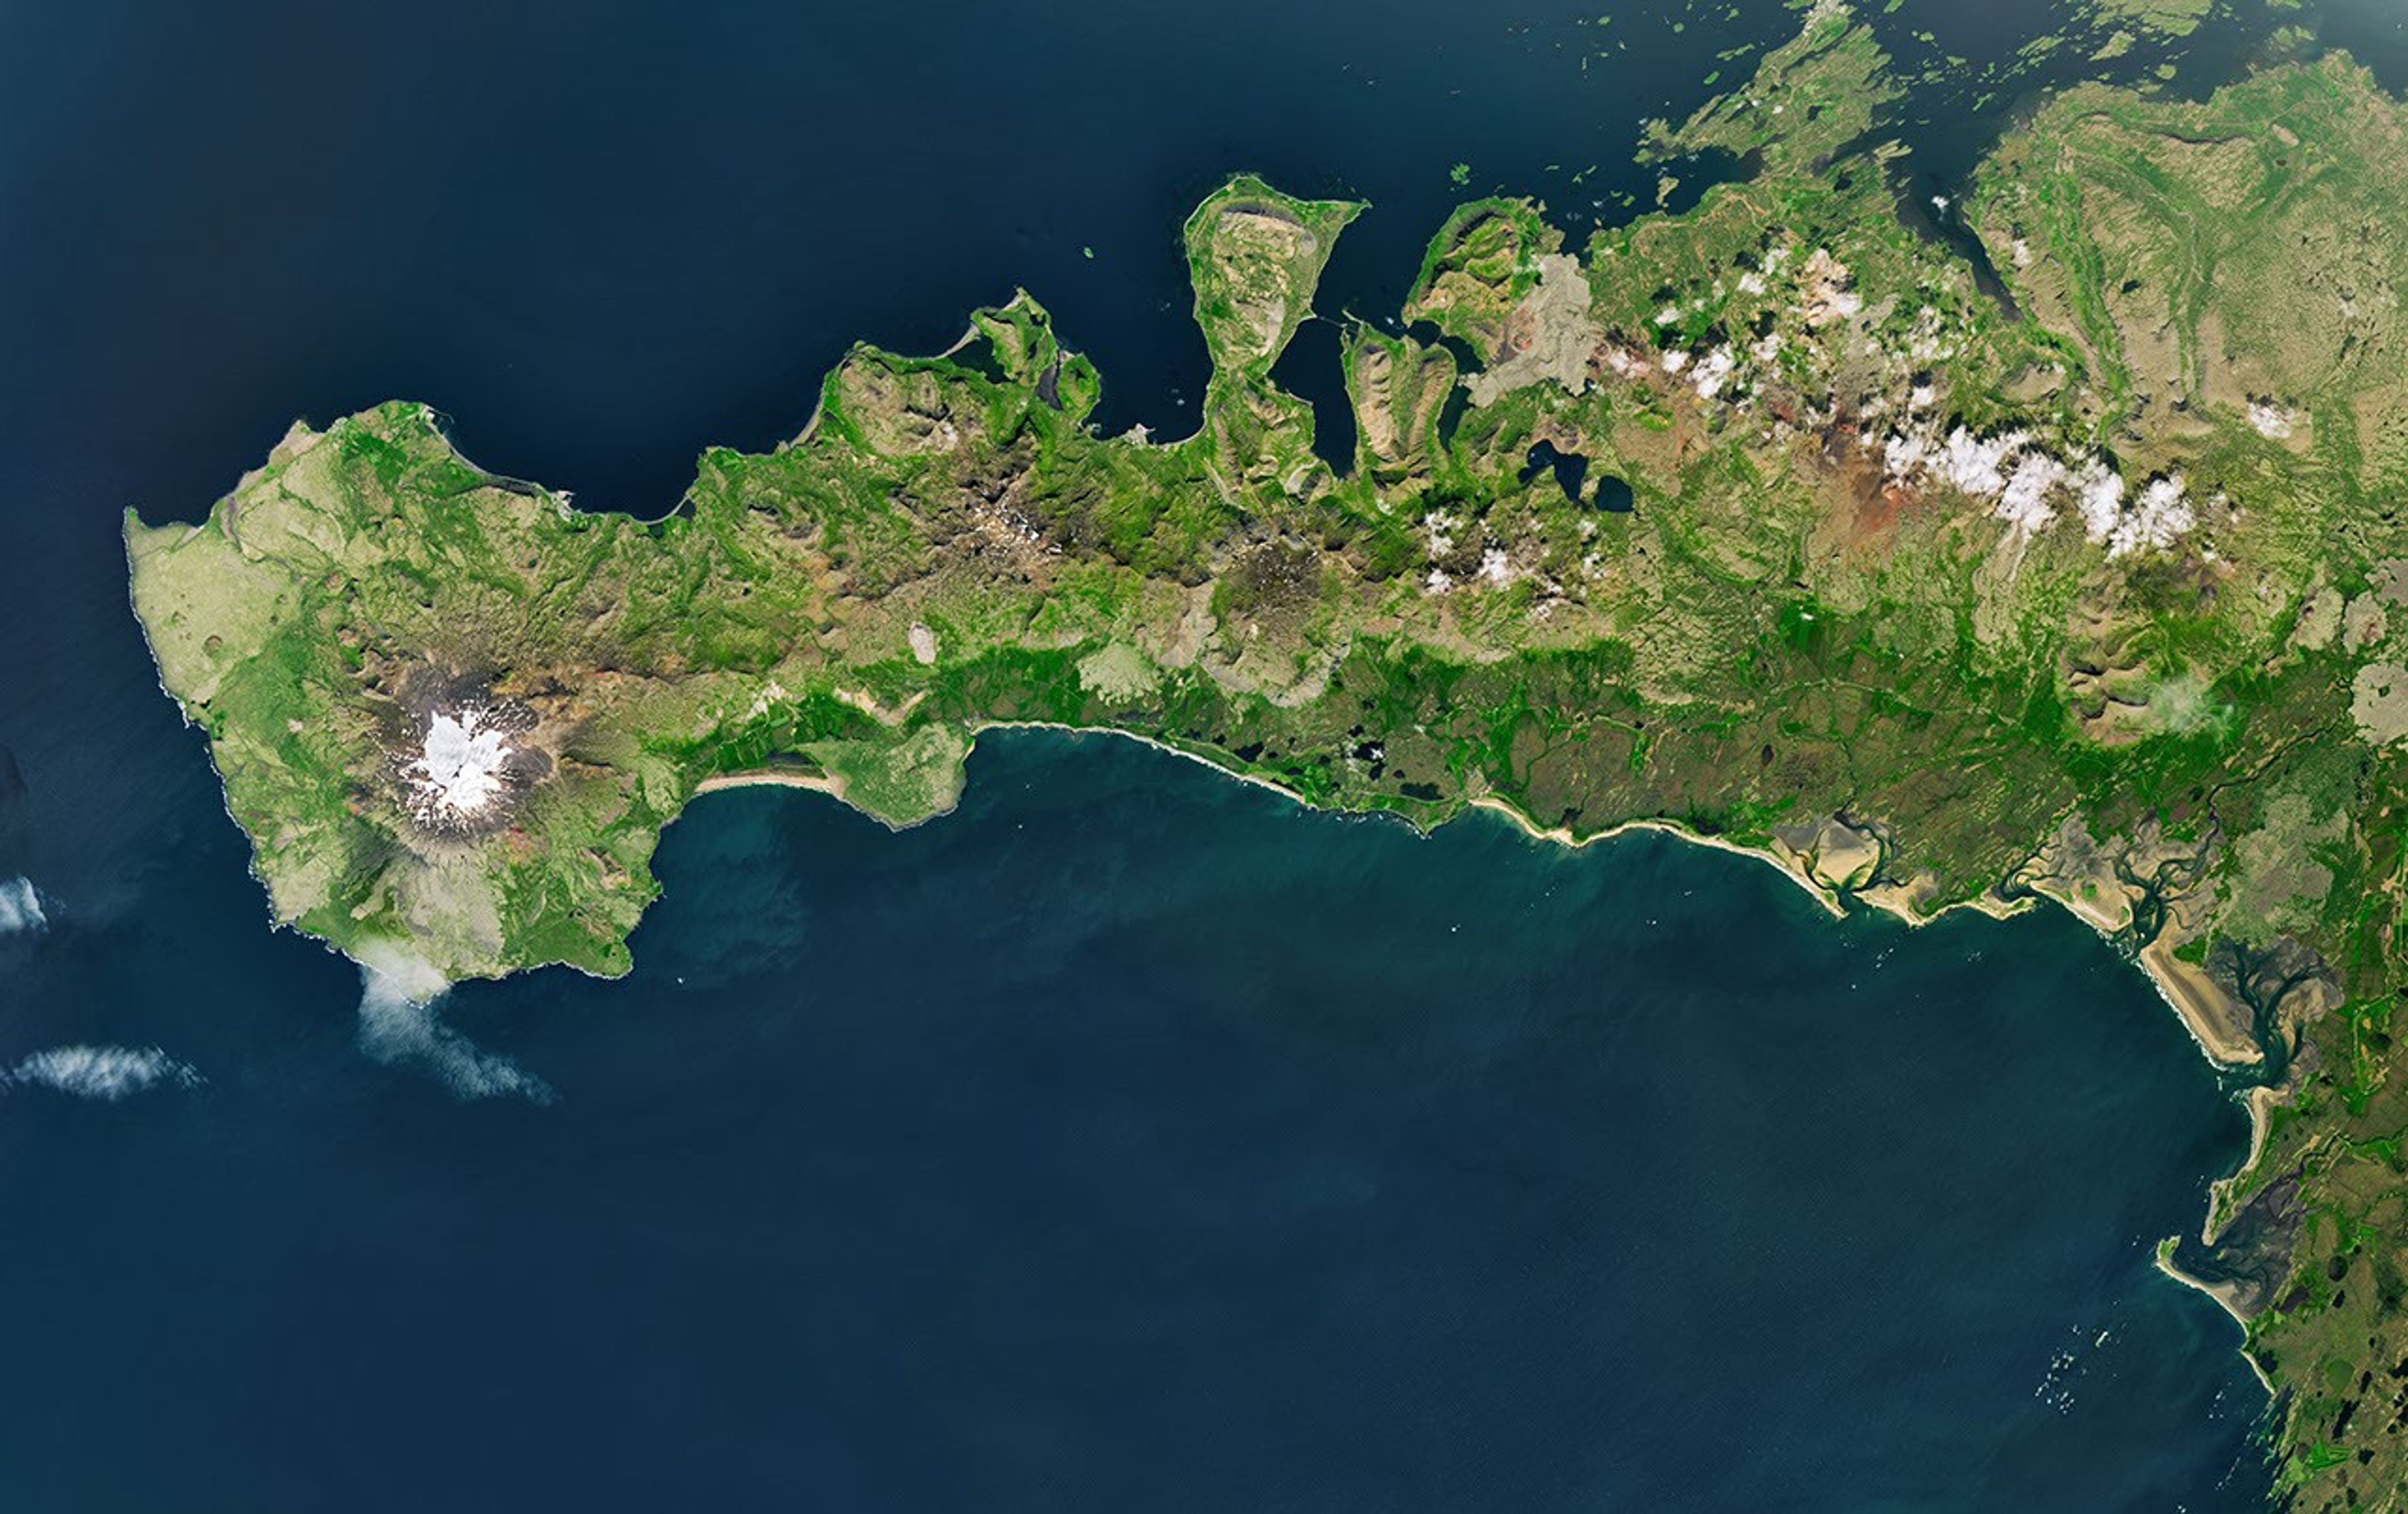
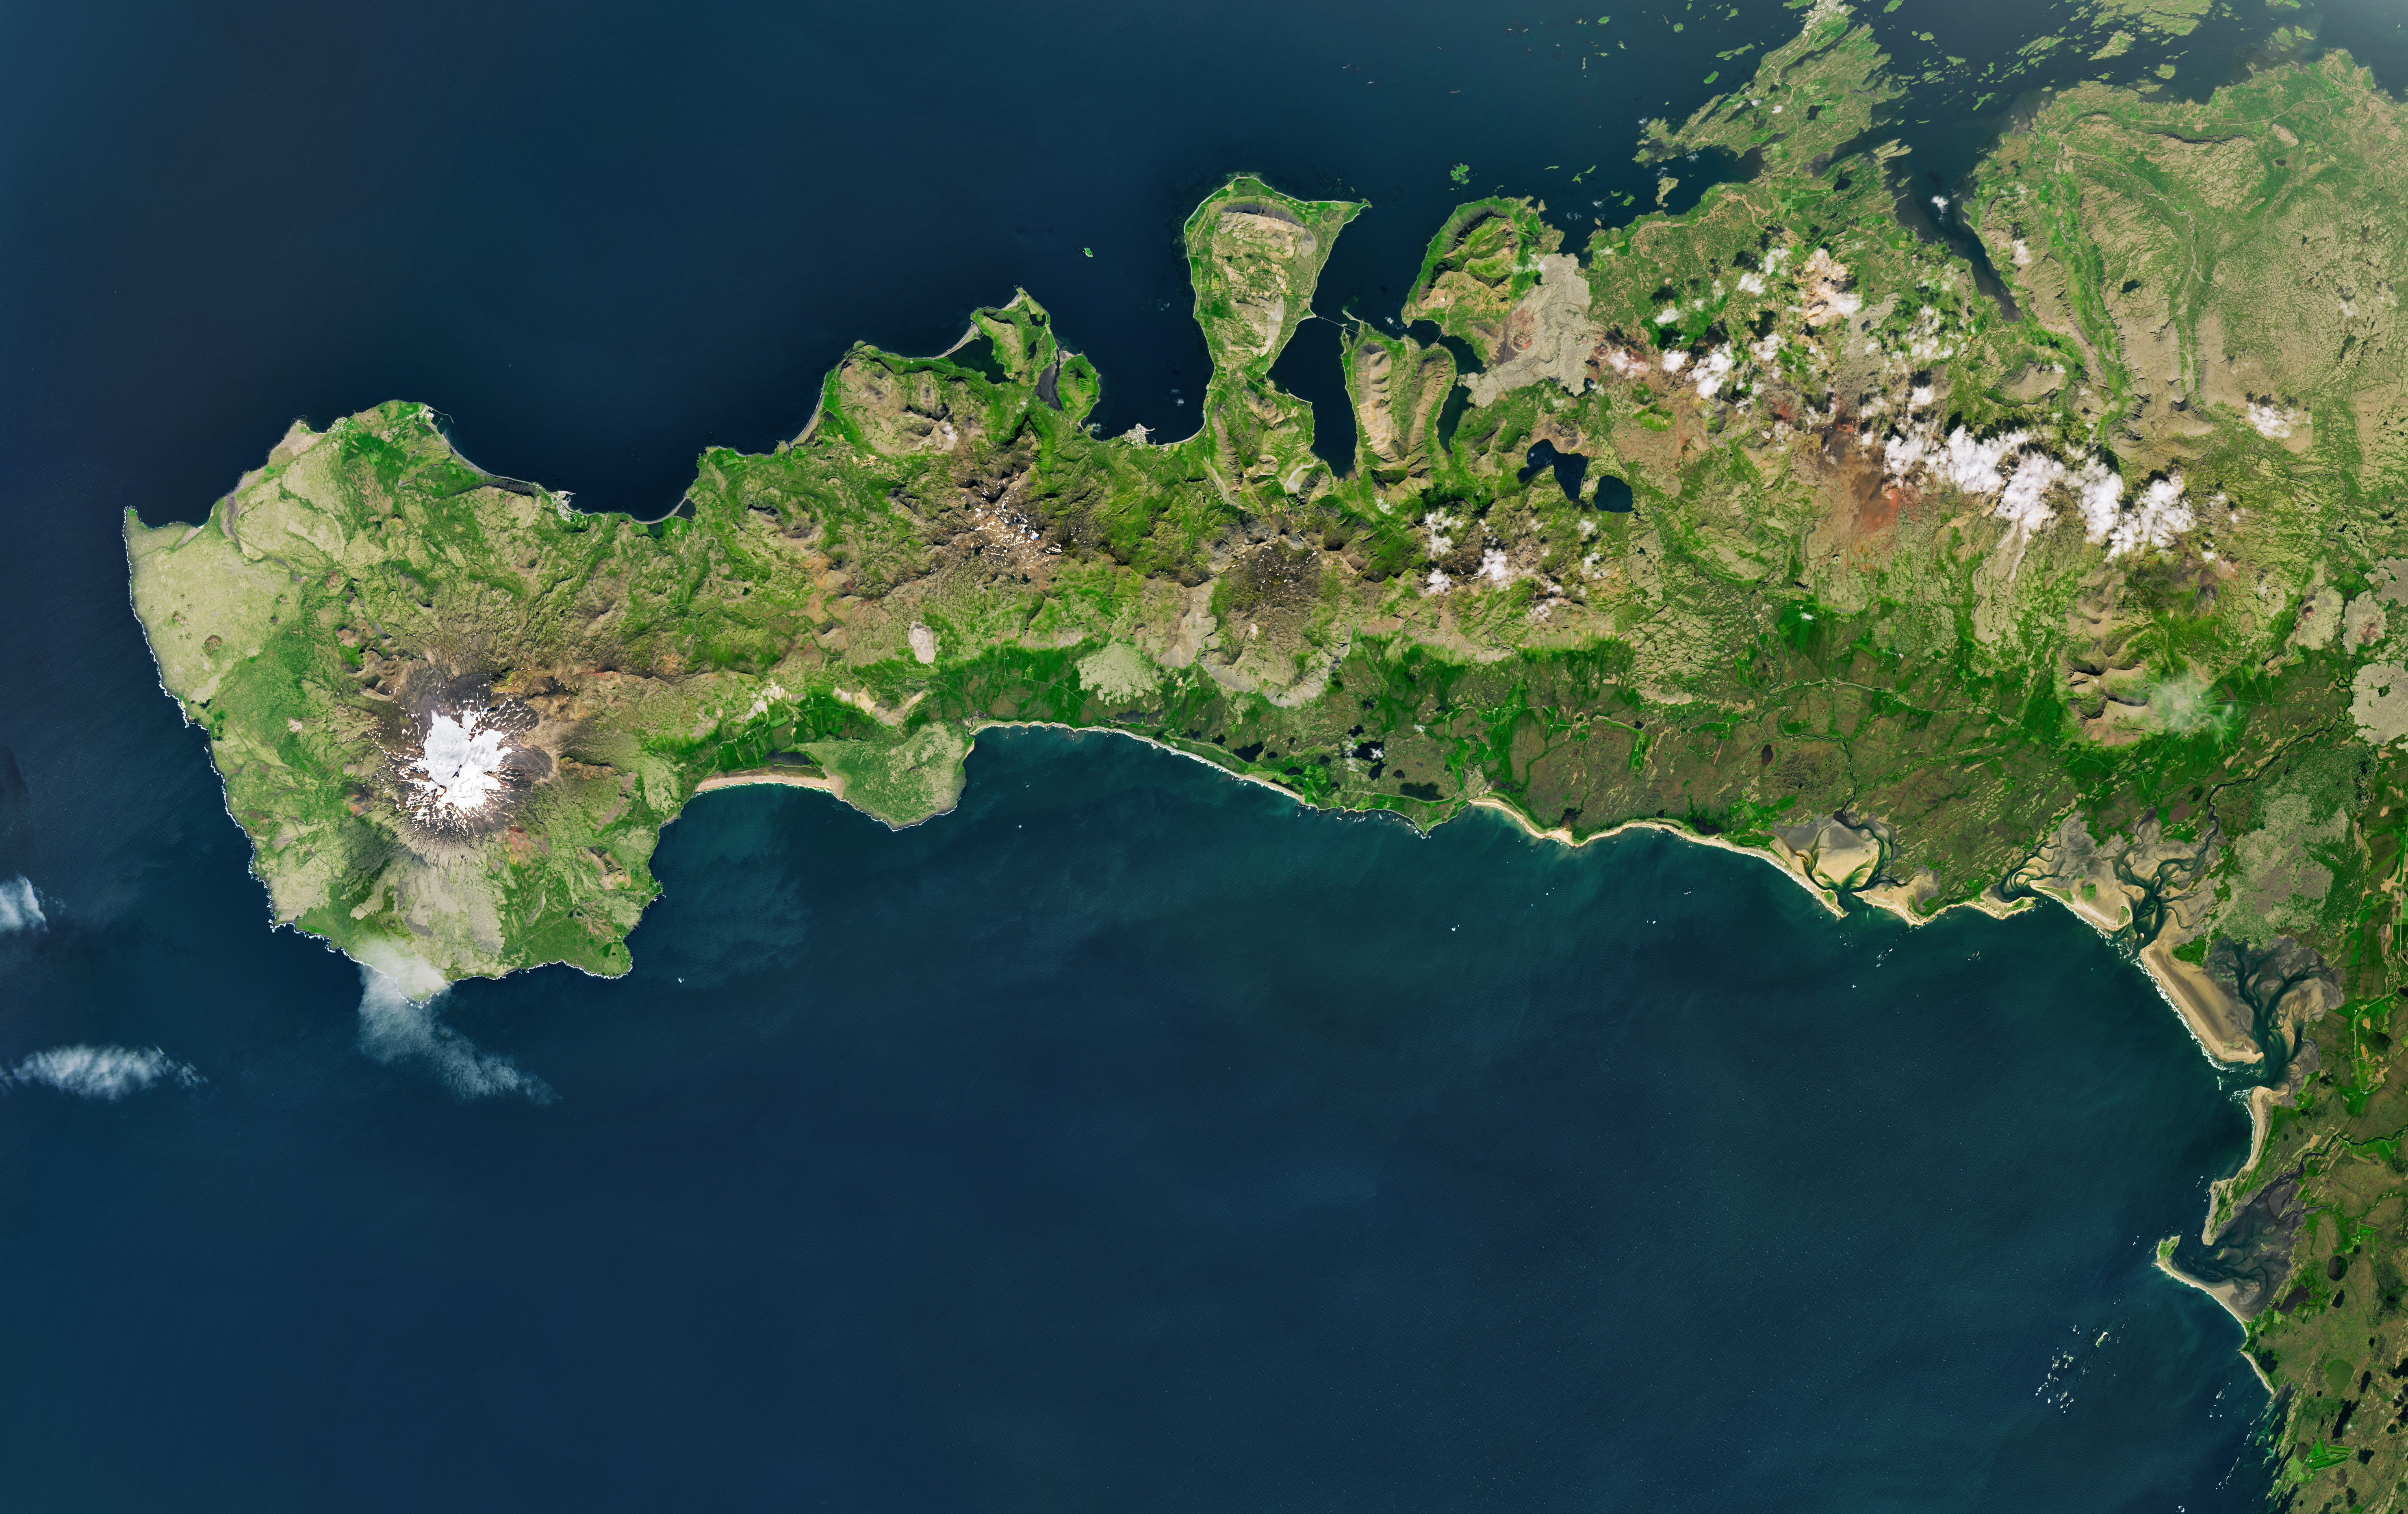
A peninsula in Iceland stretches across the image to the left. A prominent glacier-capped volcano sits near its western end.
The glacier-capped Snæfellsjökull volcano is the defining feature of Iceland’s Snæfellsnes peninsula, shown in this image acquired with the OLI (Operational Land Imager) on Landsat 9 on July 25, 2026.
NASA Earth Observatory/Michala Garrison

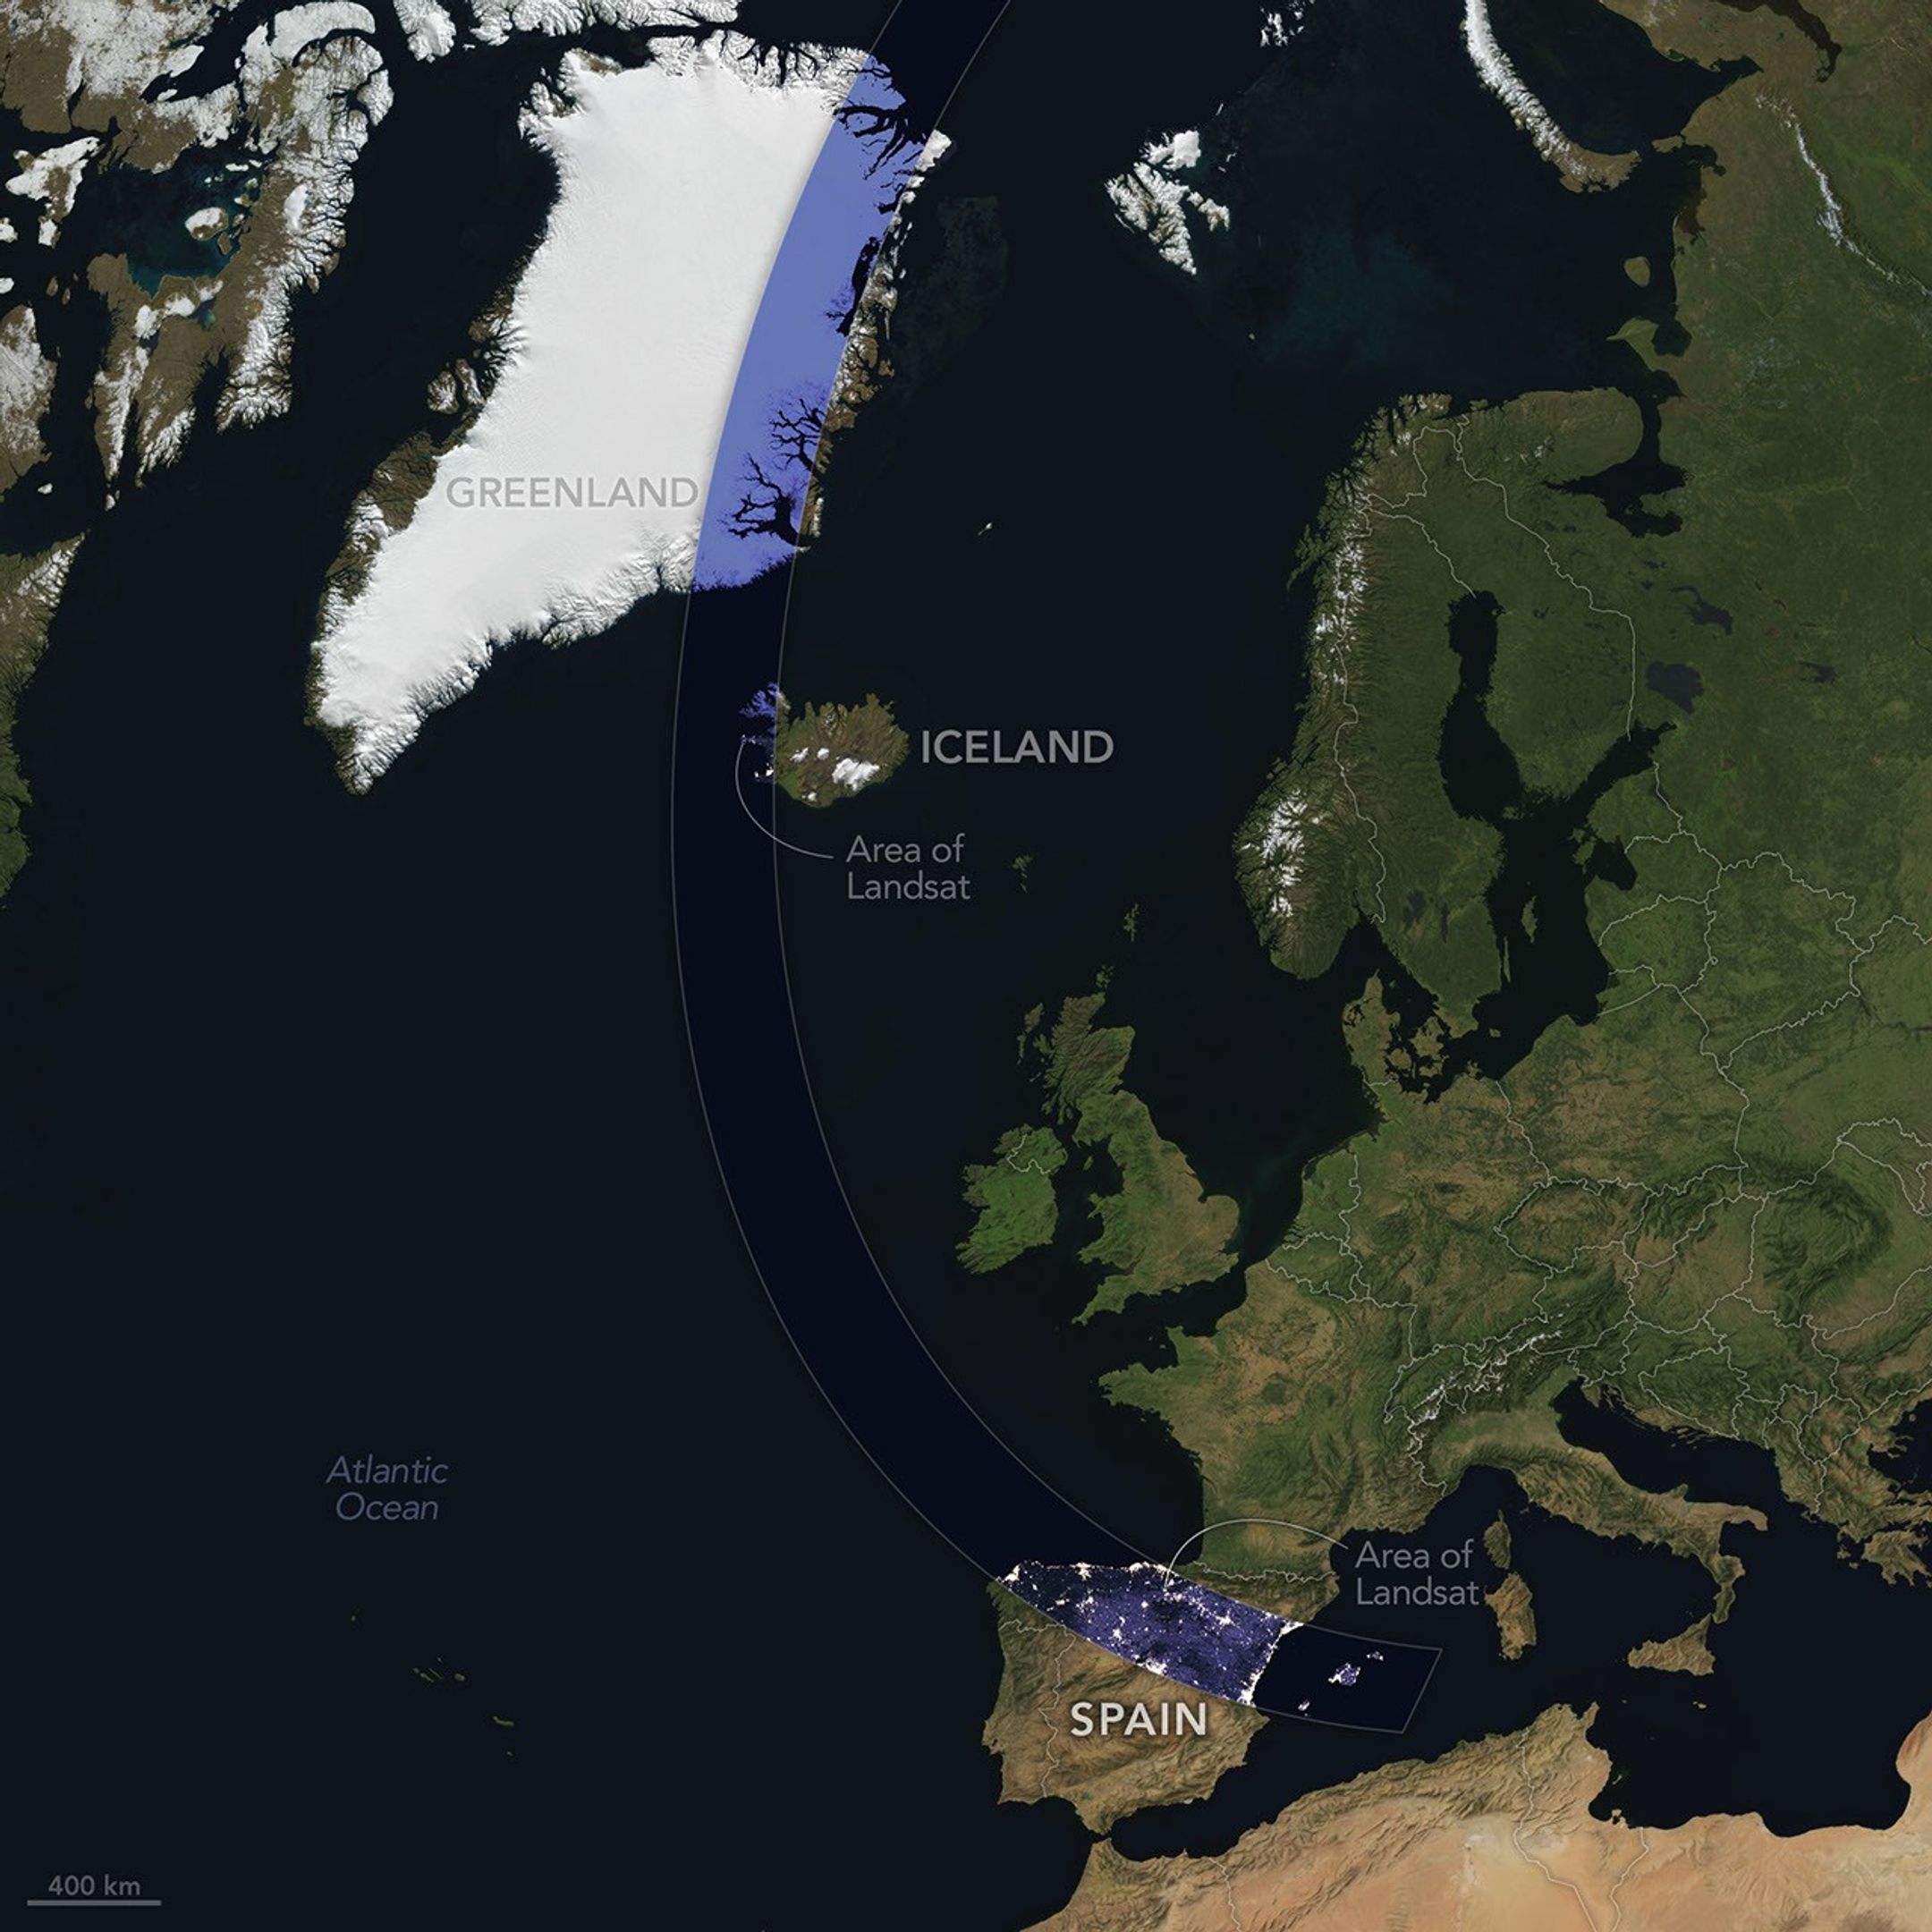
The Sun, Moon, and Earth align on August 12, 2026, to produce a total solar eclipse. When this celestial event last occurred, on April 8, 2024, the path of totality stretched across North America, giving millions the chance to glimpse the Sun’s corona. In 2026, the viewing locales are more limited; only a handful of land areas in the Northern Hemisphere, including parts of Iceland and Spain, fall within the path of totality.

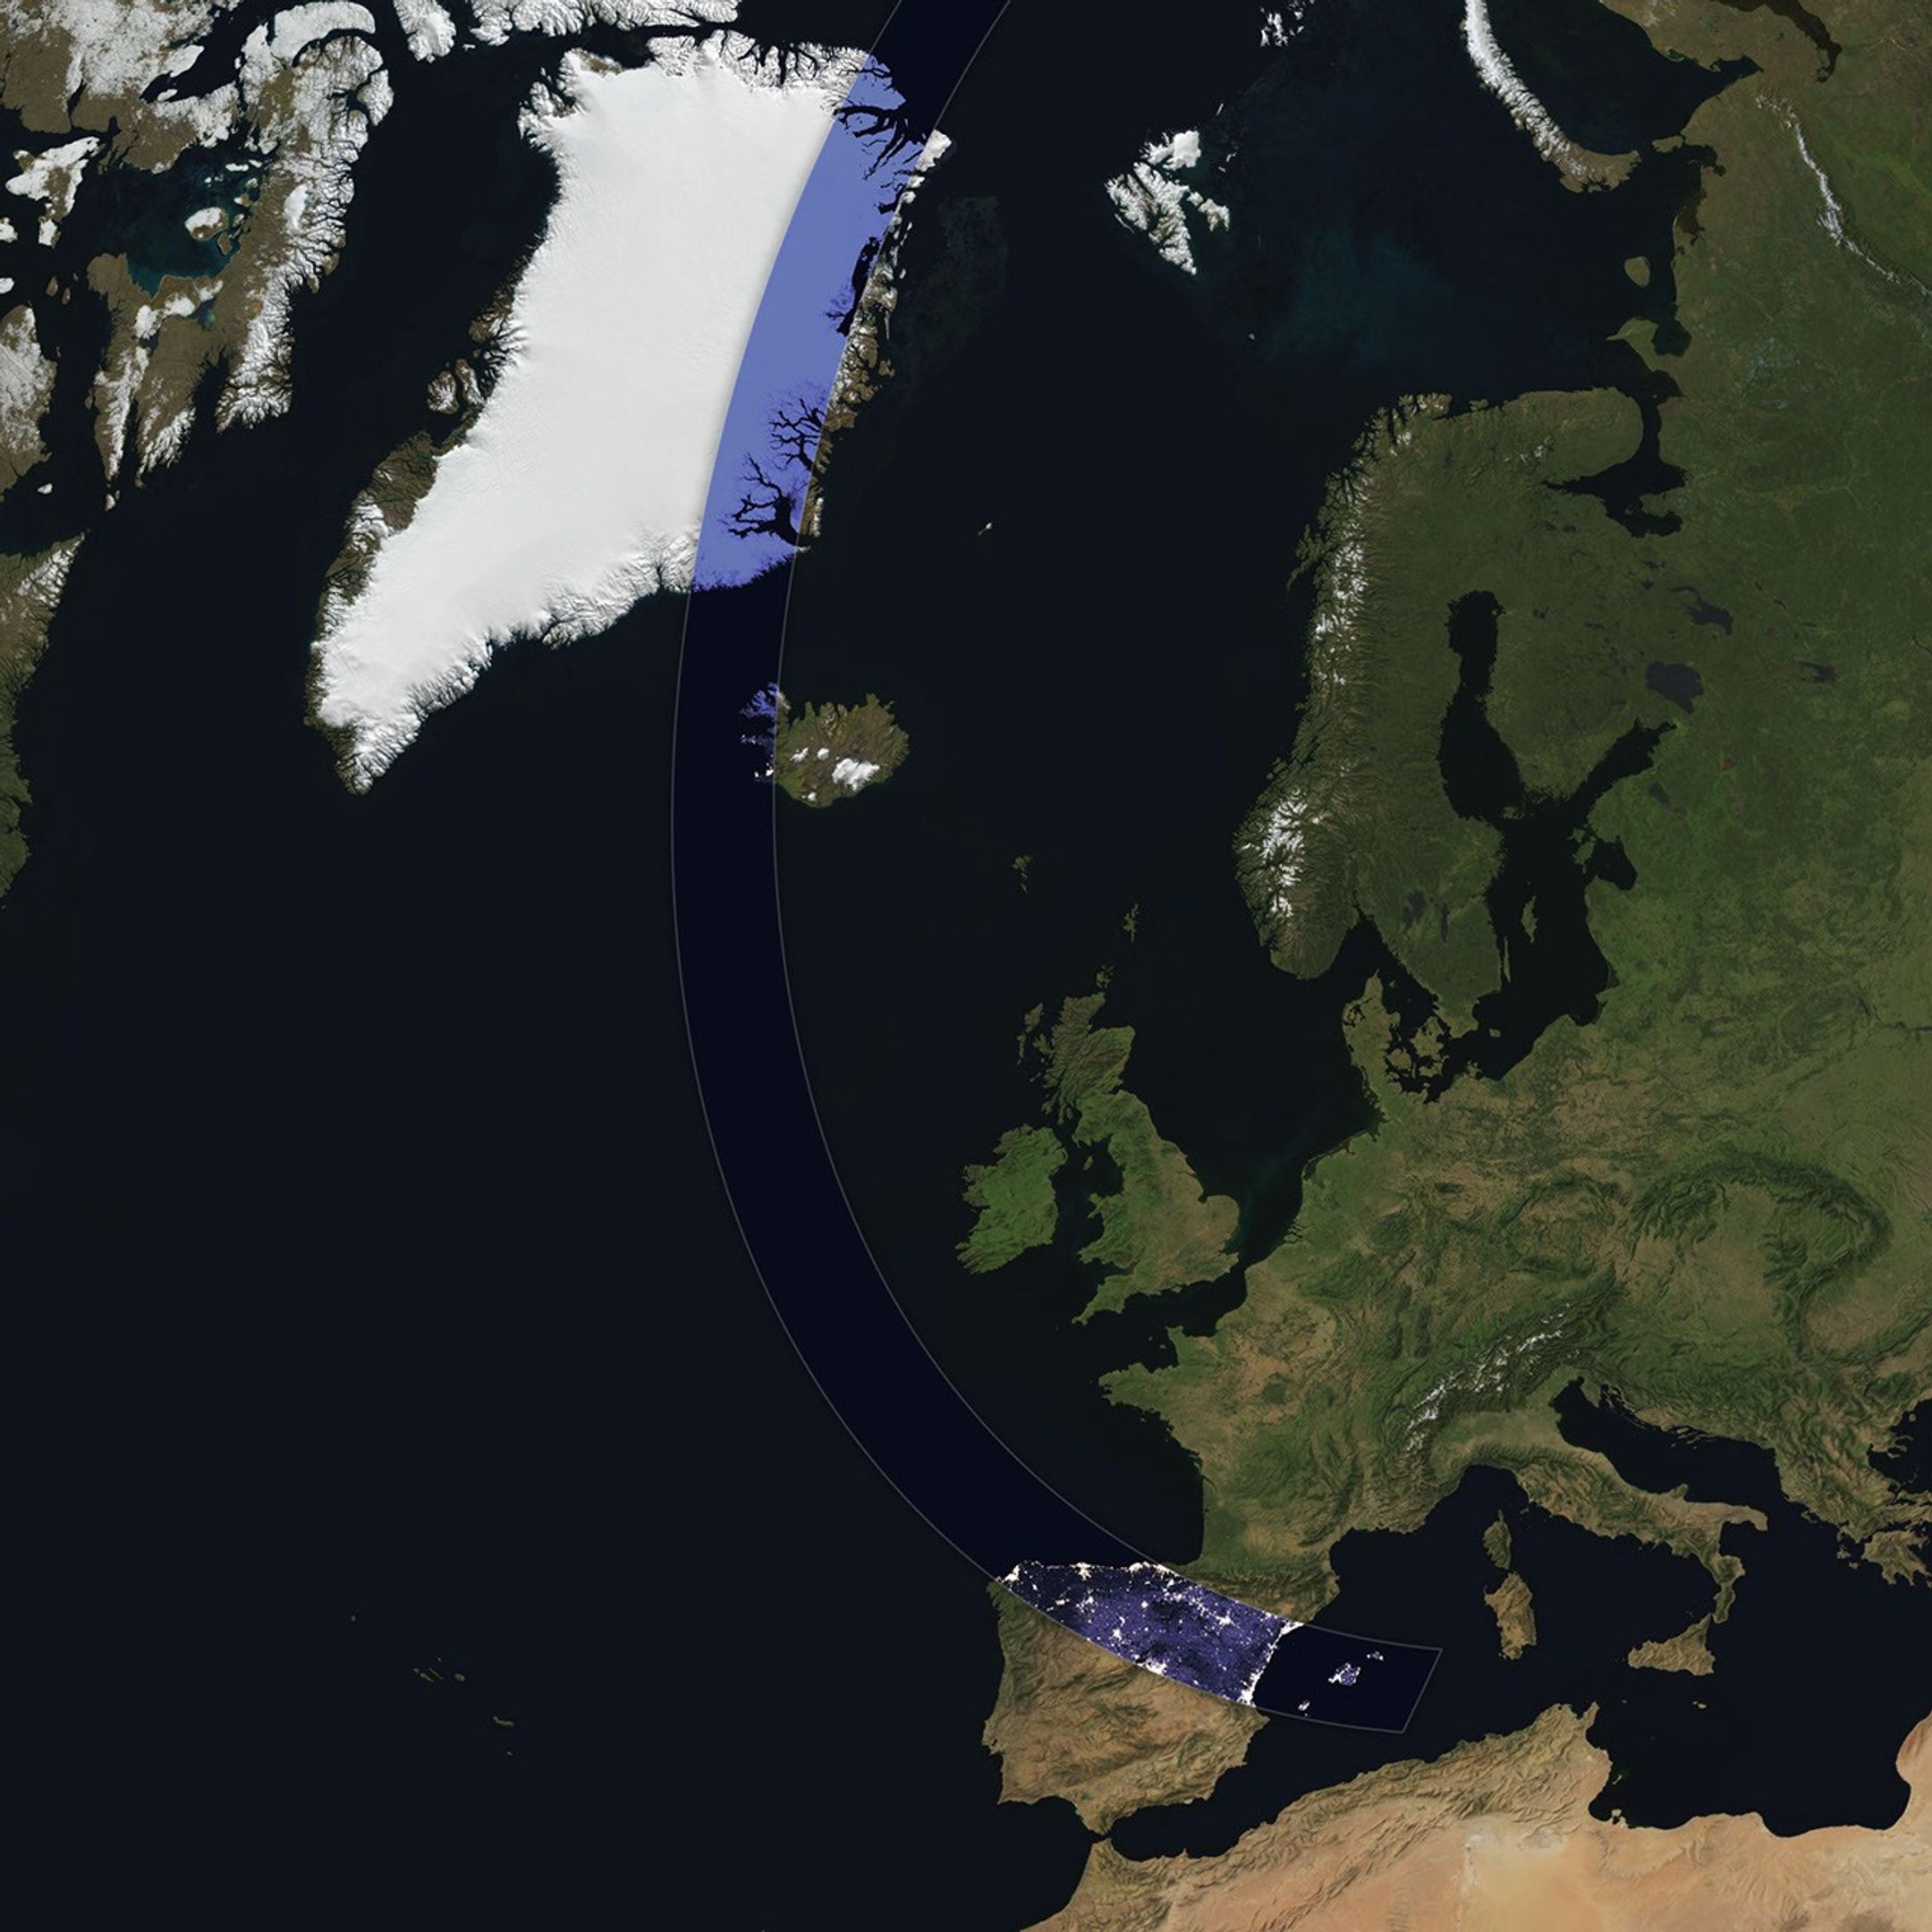
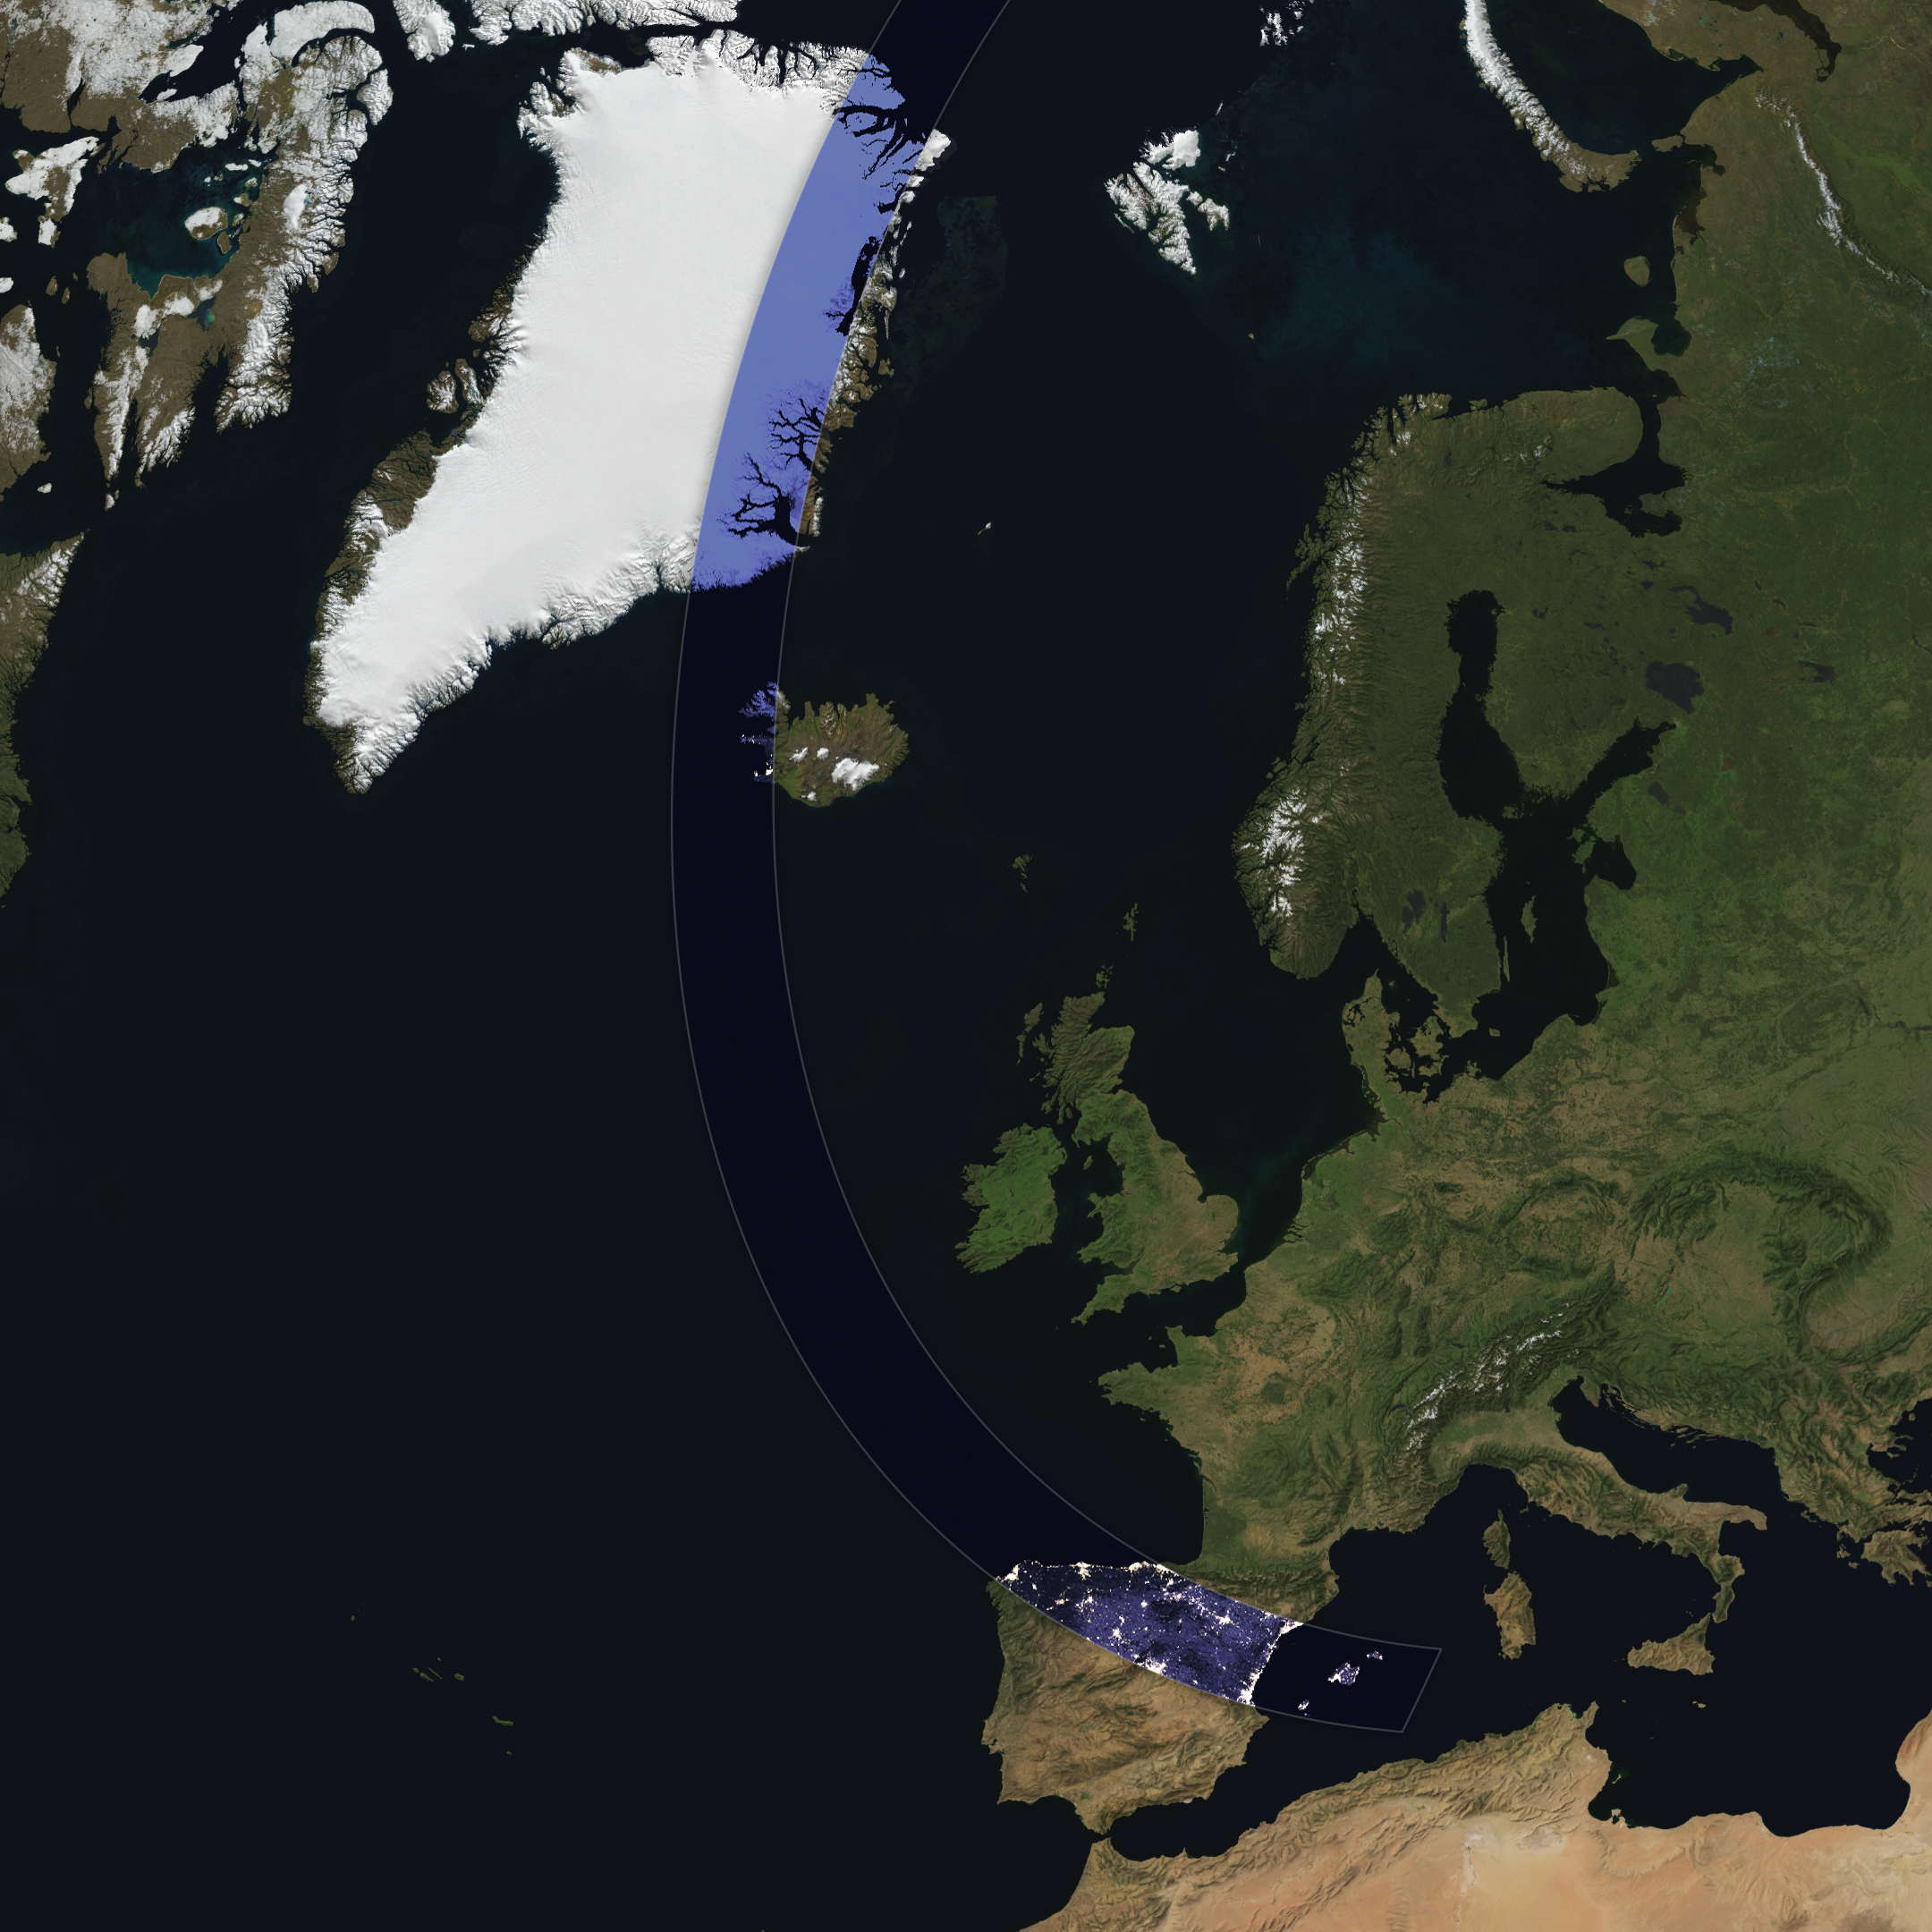
On August 12, the Moon’s shadow will first cross over the Arctic Circle from northern Russia and then track along the eastern side of Greenland. At about 5:45 p.m. local time in Iceland (17:45 Universal Time), the country’s western fringes—including the Snæfellsnes peninsula, shown in the Landsat image above—will begin to experience totality. The greatest eclipse will occur near this sparsely populated peninsula when the Moon appears the largest and covers more of the Sun.

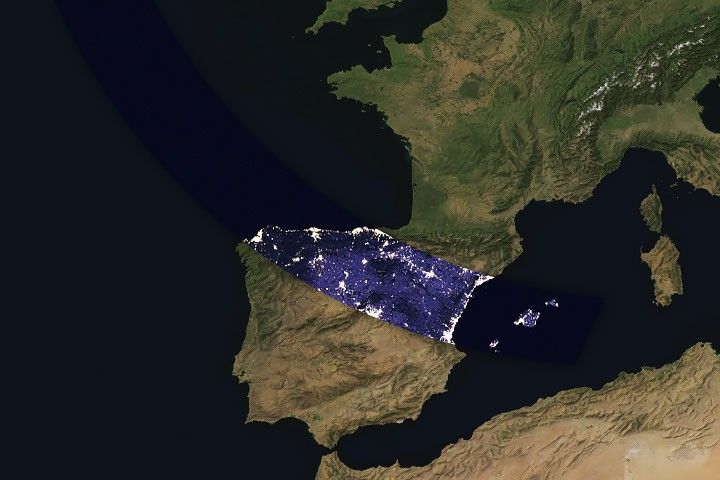
A map shows the path of totality of the solar eclipse on August 12, 2026, arcing across Greenland, Iceland, the North Atlantic, and Spain.
The path of totality of the solar eclipse on August 12, 2026, spans Greenland, Iceland, and Spain. The base imagery for the map comes from Blue Marble: Next Generation, with data from Black Marble shown in the path of totality. Blue Marble is built from scenes captured by MODIS (Moderate Resolution Imaging Spectroradiometer), while Black Marble is based on observations by the VIIRS (Visible Infrared Imaging Radiometer Suite) day-night band.
NASA Earth Observatory/Michala Garrison

The Snæfellsjökull volcano on the western end of the peninsula is covered in ice and last erupted about 1,800 years ago. It is the highlight of a national park of the same name, where people are expected to visit to view the eclipse. The stratovolcano even has a literary claim to fame: in Jules Verne’s A Journey to the Center of the Earth, characters venture underground through its crater, later emerging in an eruption of Stromboli, in Italy. In 2025, a broader area of the peninsula was designated a UNESCO biosphere reserve, containing over 70 percent of Iceland’s flora and an agglomeration of volcanic landscapes, wetlands, and grasslands.

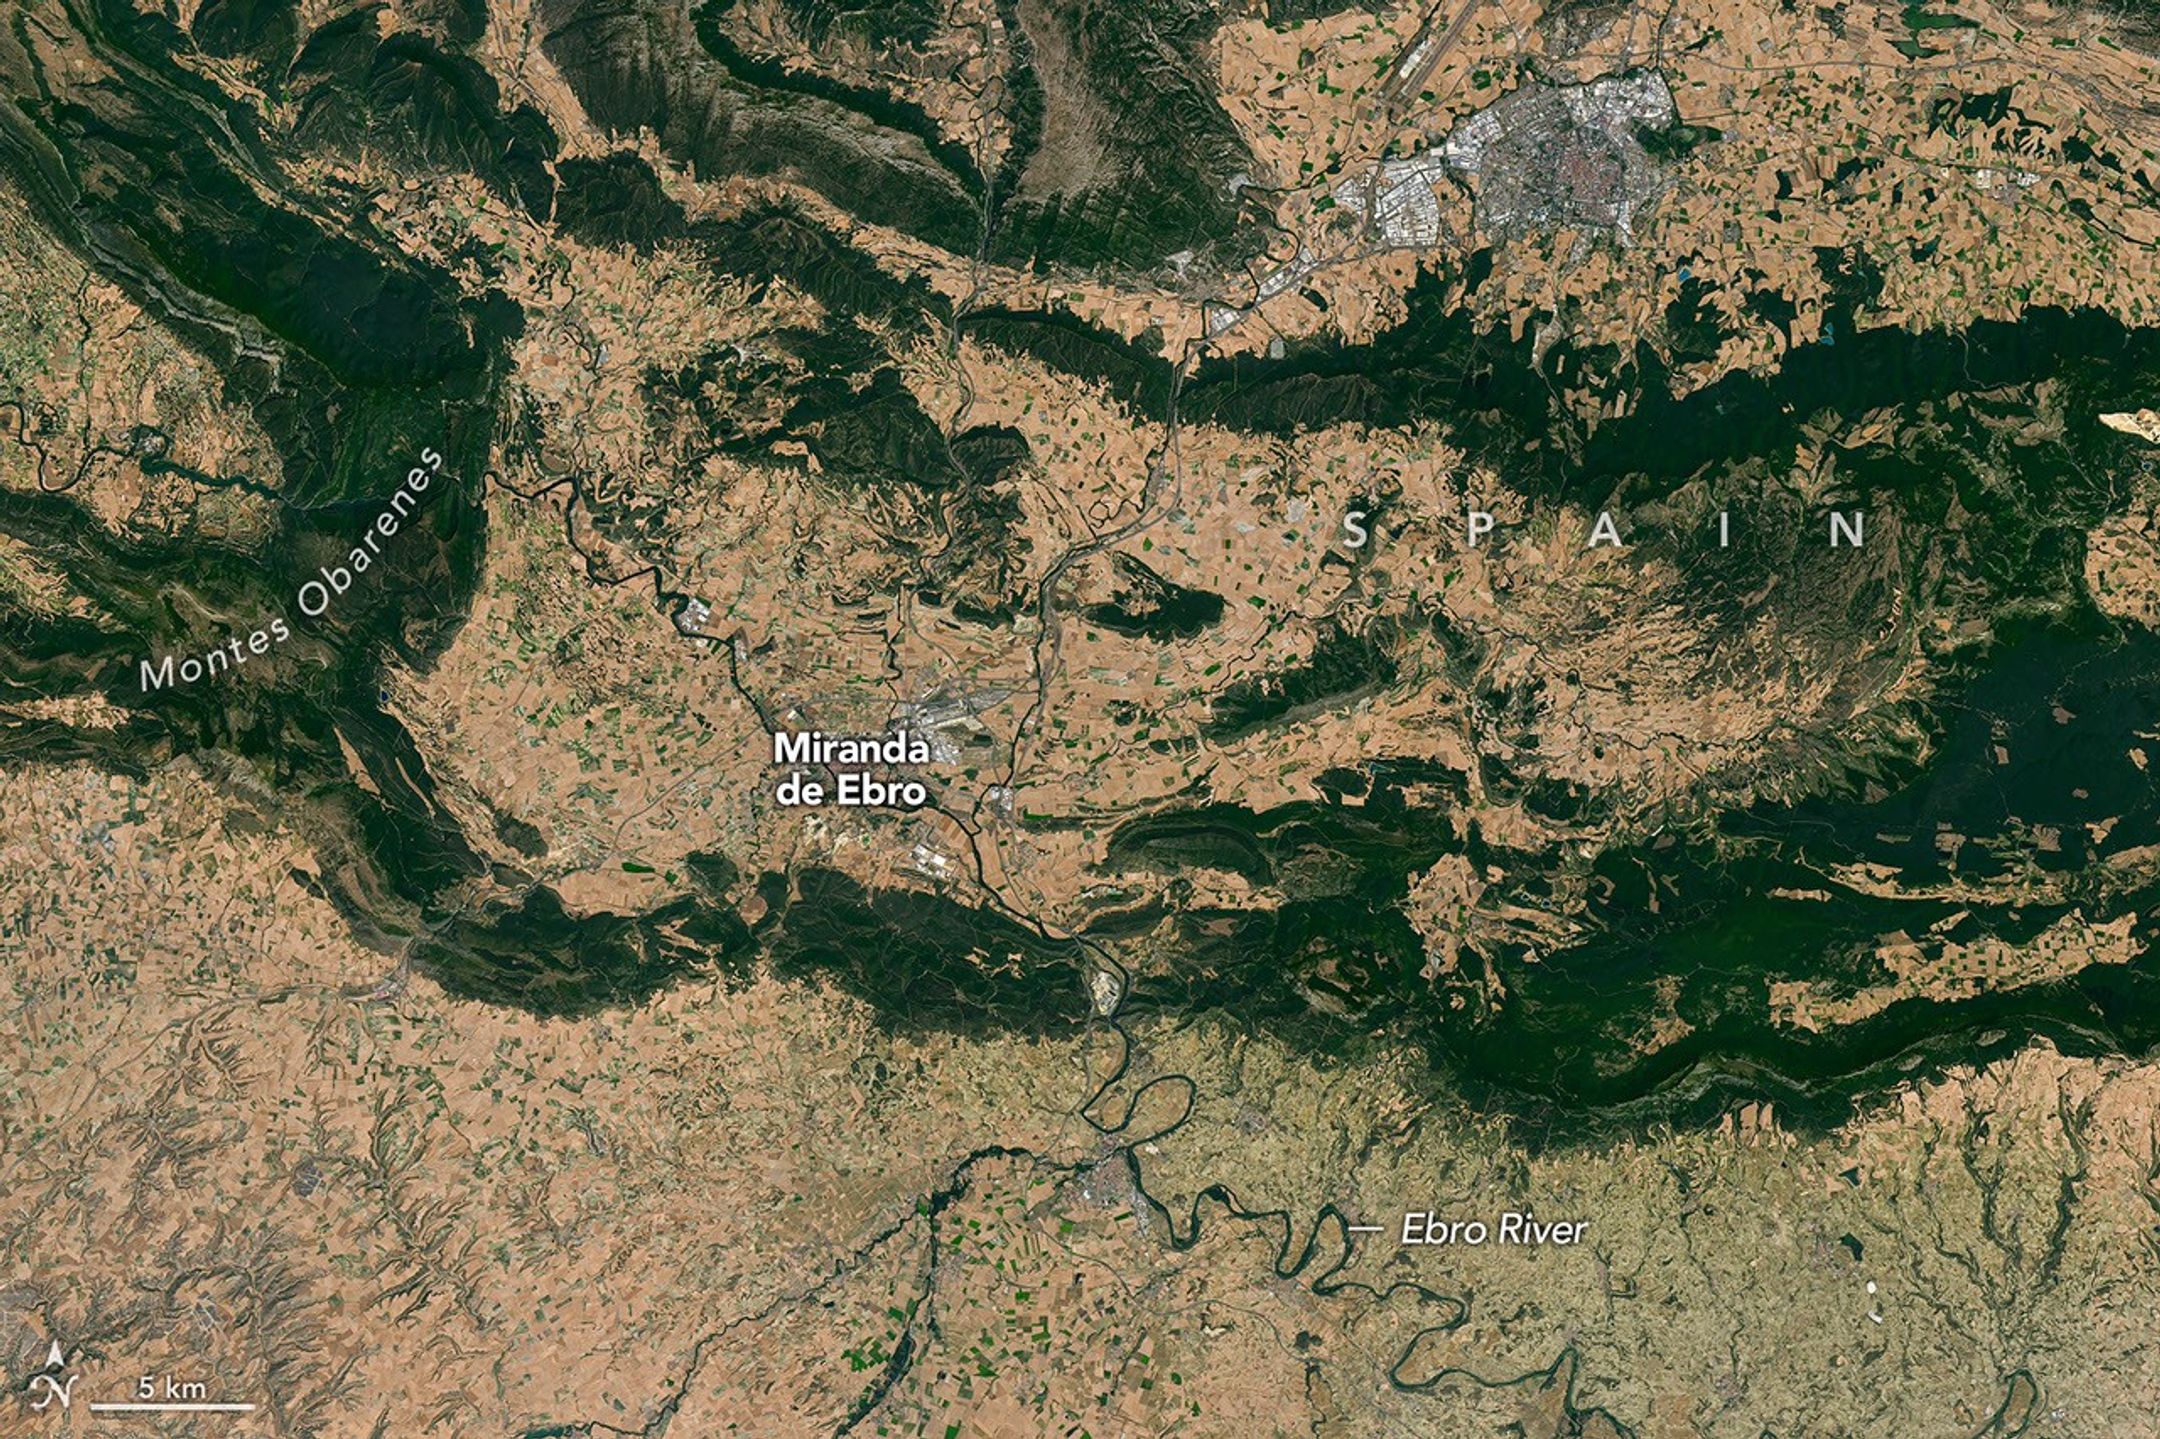
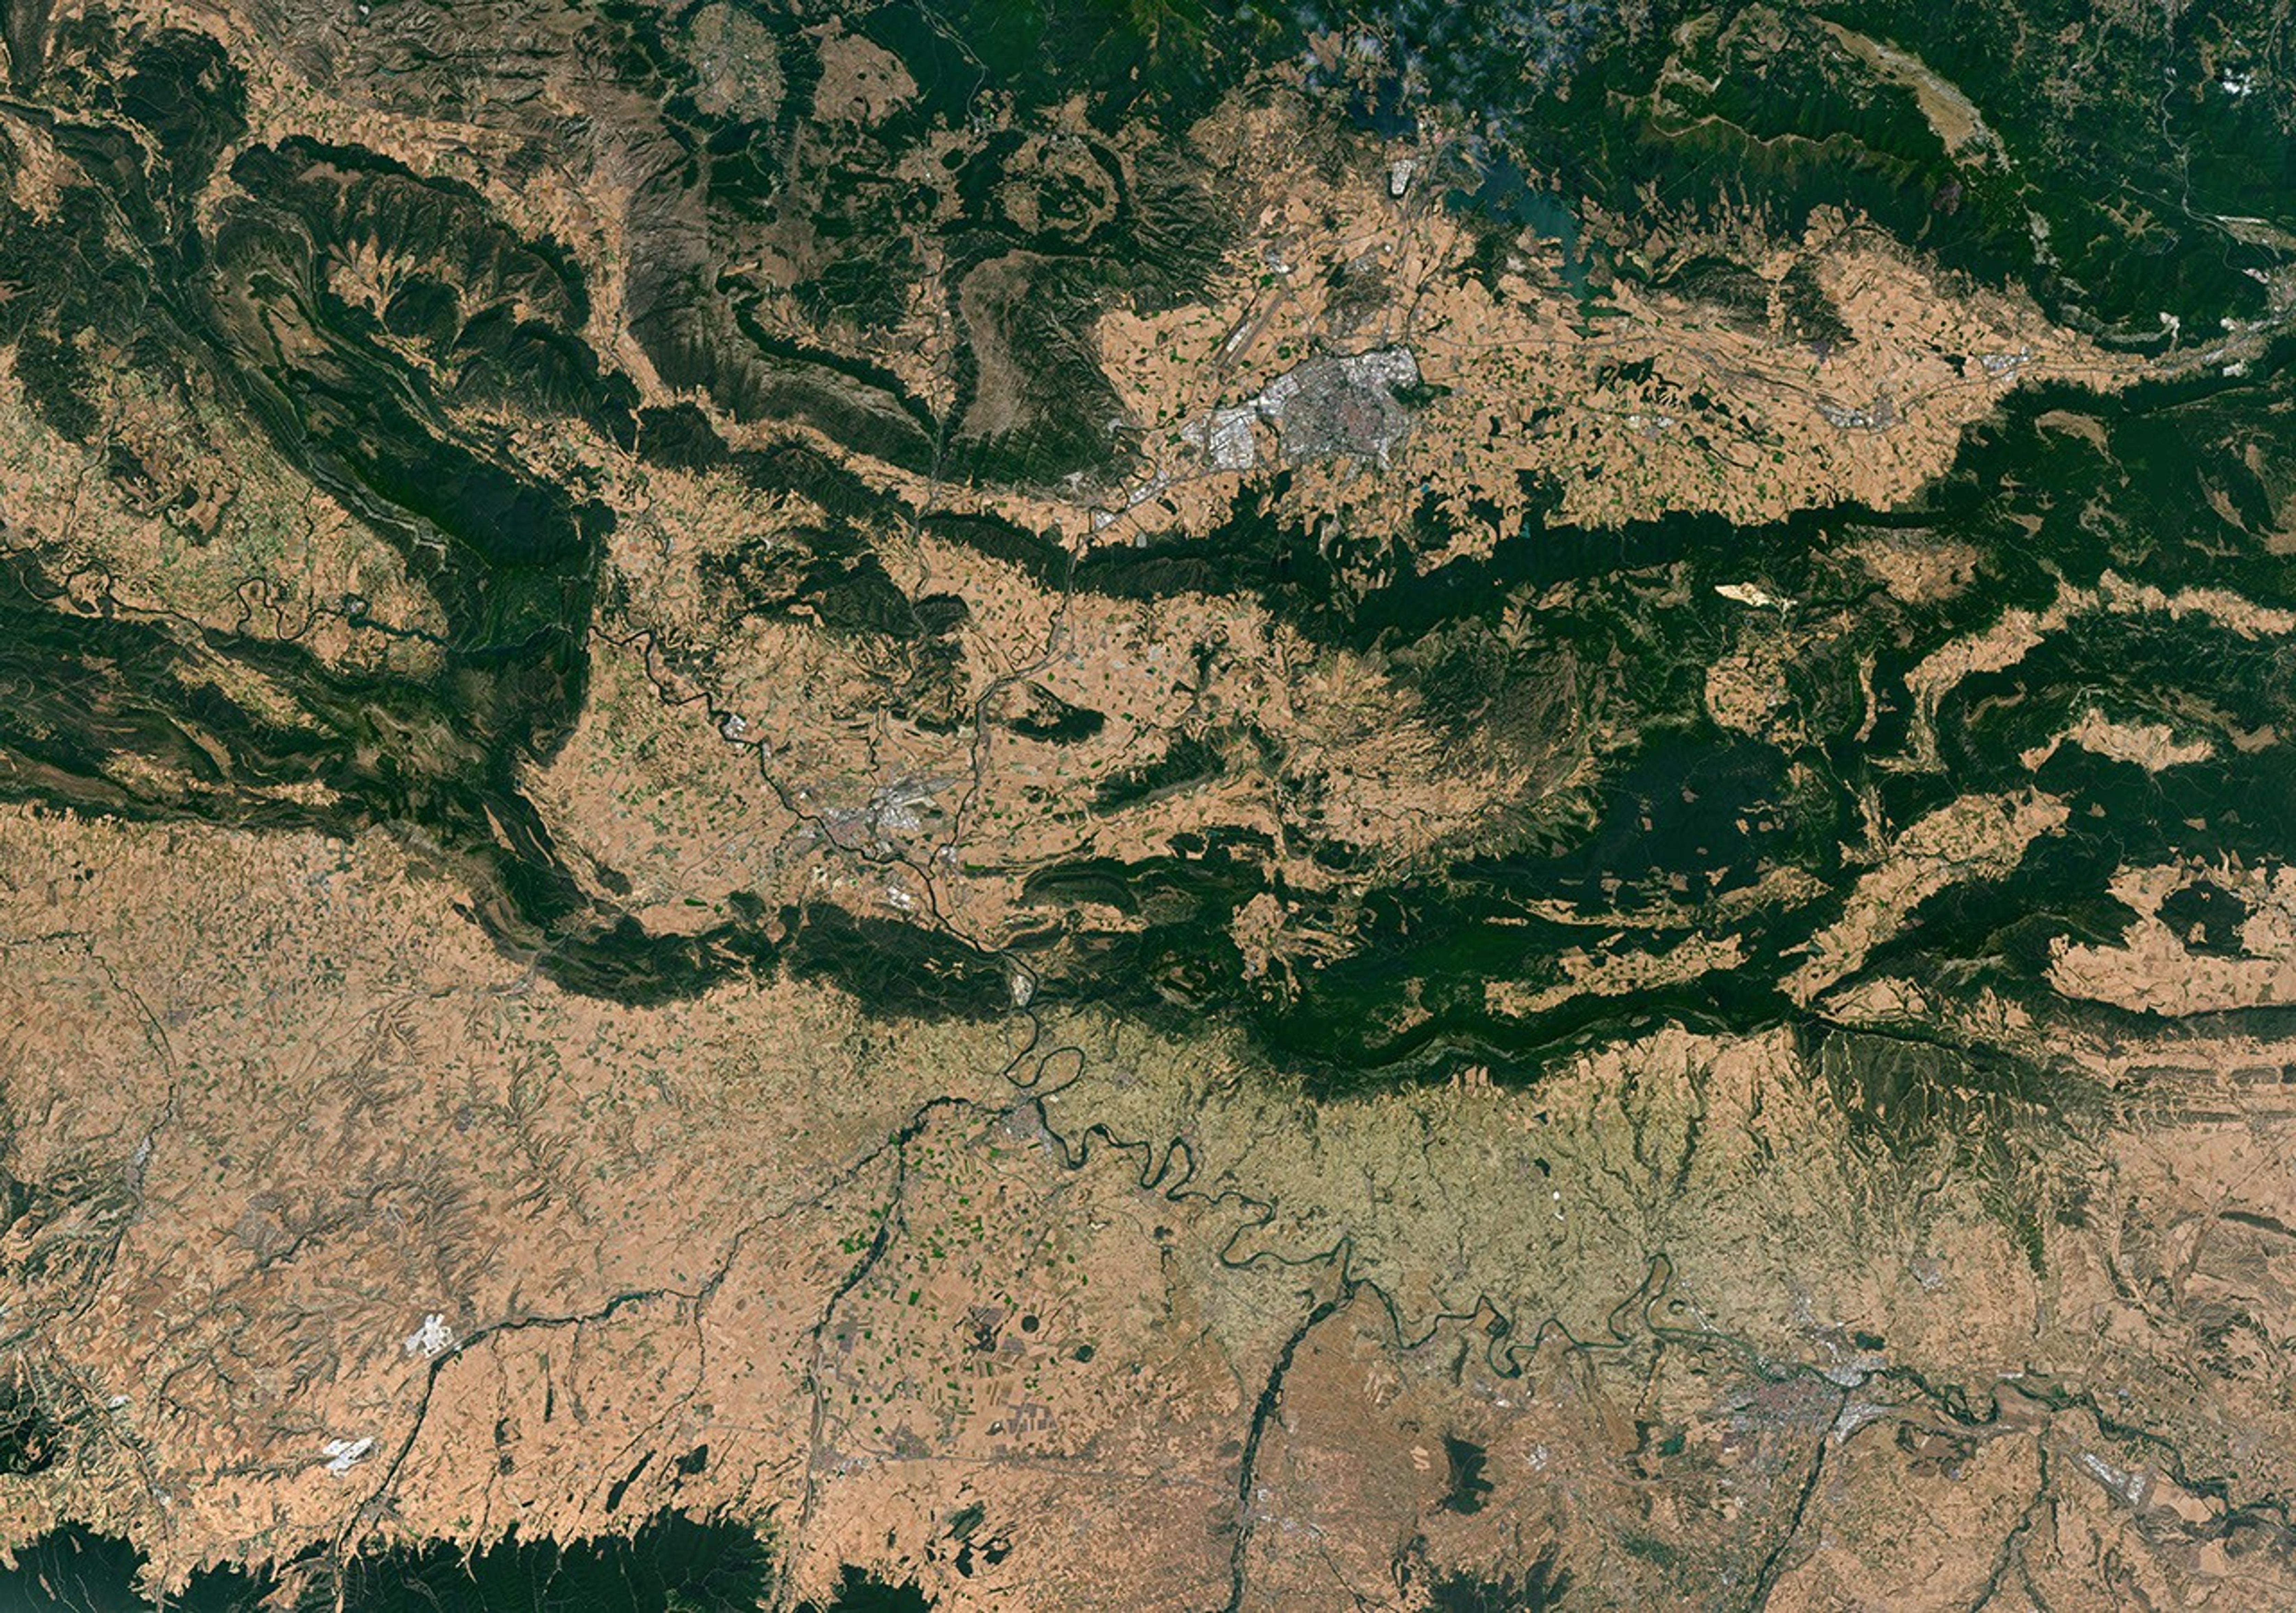
From Iceland, the eclipse shadow, or umbra, progresses across the North Atlantic and reaches northern Spain shortly before sunset. It runs east-southeast across the country, much like the Ebro River (Río Ebro), seen in the Landsat image below.

Meandering rivers cut through dark green mountain ridges, across agricultural land, and near several developed areas in northern Spain.

The Ebro River, meandering across northern Spain in this image acquired with the OLI (Operational Land Imager) on Landsat 8 on July 21, 2026, is in the path of totality of the August 2026 solar eclipse.
NASA Earth Observatory/Michala Garrison

The upper Ebro emerges from rugged terrain in Parque Natural de Montes Obarenes-San Zadornil, where it carves canyons and gorges through the eastern foothills of the Cantabrian Mountains. It then meanders through La Rioja, a region known for its vineyards. About 400 kilometers (250 miles) away, the river reaches a delta on the Mediterranean coast between Barcelona and Valencia.

Based on satellite measurements of cloud cover in August over several decades, viewers in Spain have a higher likelihood than those in Iceland of getting a clear look at the eclipse. And despite limited viewing opportunities in the path of totality, the rest of Europe, parts of Africa, Canada, and the northern and northeastern U.S. will experience a partial eclipse.

NASA Earth Observatory images and map by Michala Garrison, using Landsat data from the U.S. Geological Survey, base imagery from Blue Marble: Next Generation and Black Marble, and eclipse path data from Xavier Jubier. Story by Lindsey Doermann.

Downloads

A peninsula in Iceland stretches across the image to the left. A prominent glacier-capped volcano sits near its western end.

July 25, 2026

JPEG (14.69 MB)

A map shows the path of totality of the solar eclipse on August 12, 2026, arcing across Greenland, Iceland, the North Atlantic, and Spain.

August 12, 2026

JPEG (1.92 MB)

Meandering rivers cut through dark green mountain ridges, across agricultural land, and near several developed areas in northern Spain.


July 21, 2026

JPEG (34.46 MB)

References & Resources

You may also be interested in:

Stay up-to-date with the latest content from NASA as we explore the universe and discover more about our home planet.

Colonial National Historical Park

2 min read

The colonial communities of “America’s historic triangle” played defining roles in the road to American independence.

Article

Minute Man National Historical Park

3 min read

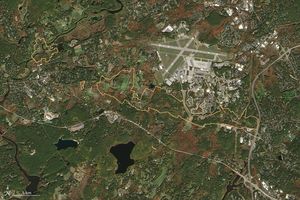
Sites relevant to the start of the American Revolutionary War are interspersed throughout the modern-day Boston metropolitan region.

Article

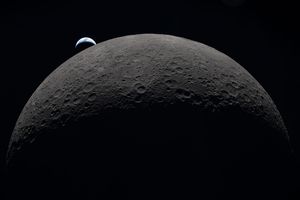
Earthset From the Lunar Far Side

2 min read

The crew of NASA’s Artemis II mission captured extraordinary images of our home planet during their journey around the far…

Article
  •  

NASA Completes Astronaut-Deployed Science Instrument for Lunar Surface

Rectangular box-shaped device resting on a metal table. The front face is covered with a grid of many small black rectangular panels bordered in white. Metal components, brackets, and small box units are mounted along the top. The background shows a large windowed wall with a blurred American flag and an Artemis flag visible behind the device.
The fully-integrated LEMS (Lunar Environment Monitoring Station) ready for environmental testing. A small suitcase-size instrument suite built at NASA Goddard, LEMS is designed to carry out continuous, long-term monitoring of the seismic environment at the Moon, including surface motion caused by moonquakes and meteorite impacts in the lunar south polar region.
NASA Goddard/Mike Guinto

NASA has declared “wrenches down” on the first completed payload designed for Artemis astronauts to deploy on the Moon’s surface. Engineers working on NASA’s Lunar Environment Monitoring Station, or LEMS, have completed hardware development and testing and the payload is ready for its permanent home near the lunar South Pole. With the hardware complete, LEMS is ready to support one of the Artemis program’s core goals: enabling sustained lunar science and exploration.

The LEMS instrument package contains two highly sensitive seismometers that will monitor ground vibrations from moonquakes and meteorite impacts, providing scientists with insights into the Moon’s interior and the seismic hazards astronauts might encounter at the surface. Its modular design allows the system to be adapted or expanded to host new instruments in the future, creating a reusable platform that can evolve as scientific priorities grow.

The payload will remain in a clean room at NASA’s Goddard Space Flight Center in Greenbelt, Maryland, where it was built, until it is assigned to an Artemis mission for deployment to the lunar surface.

“The completion of the LEMS scientific instrument is a major step in a new era of lunar surface science. Innovative science experiments will uncover, measure, and reveal the Moon’s secrets while astronauts open new frontiers for discovery,” said Joel Kearns, deputy associate administrator for exploration, Science Mission Directorate, NASA Headquarters in Washington. “And, behind the scenes, countless teams across NASA and our partners are pushing the boundaries of what surface instruments can do, building the tools that will make future exploration possible and safer.”

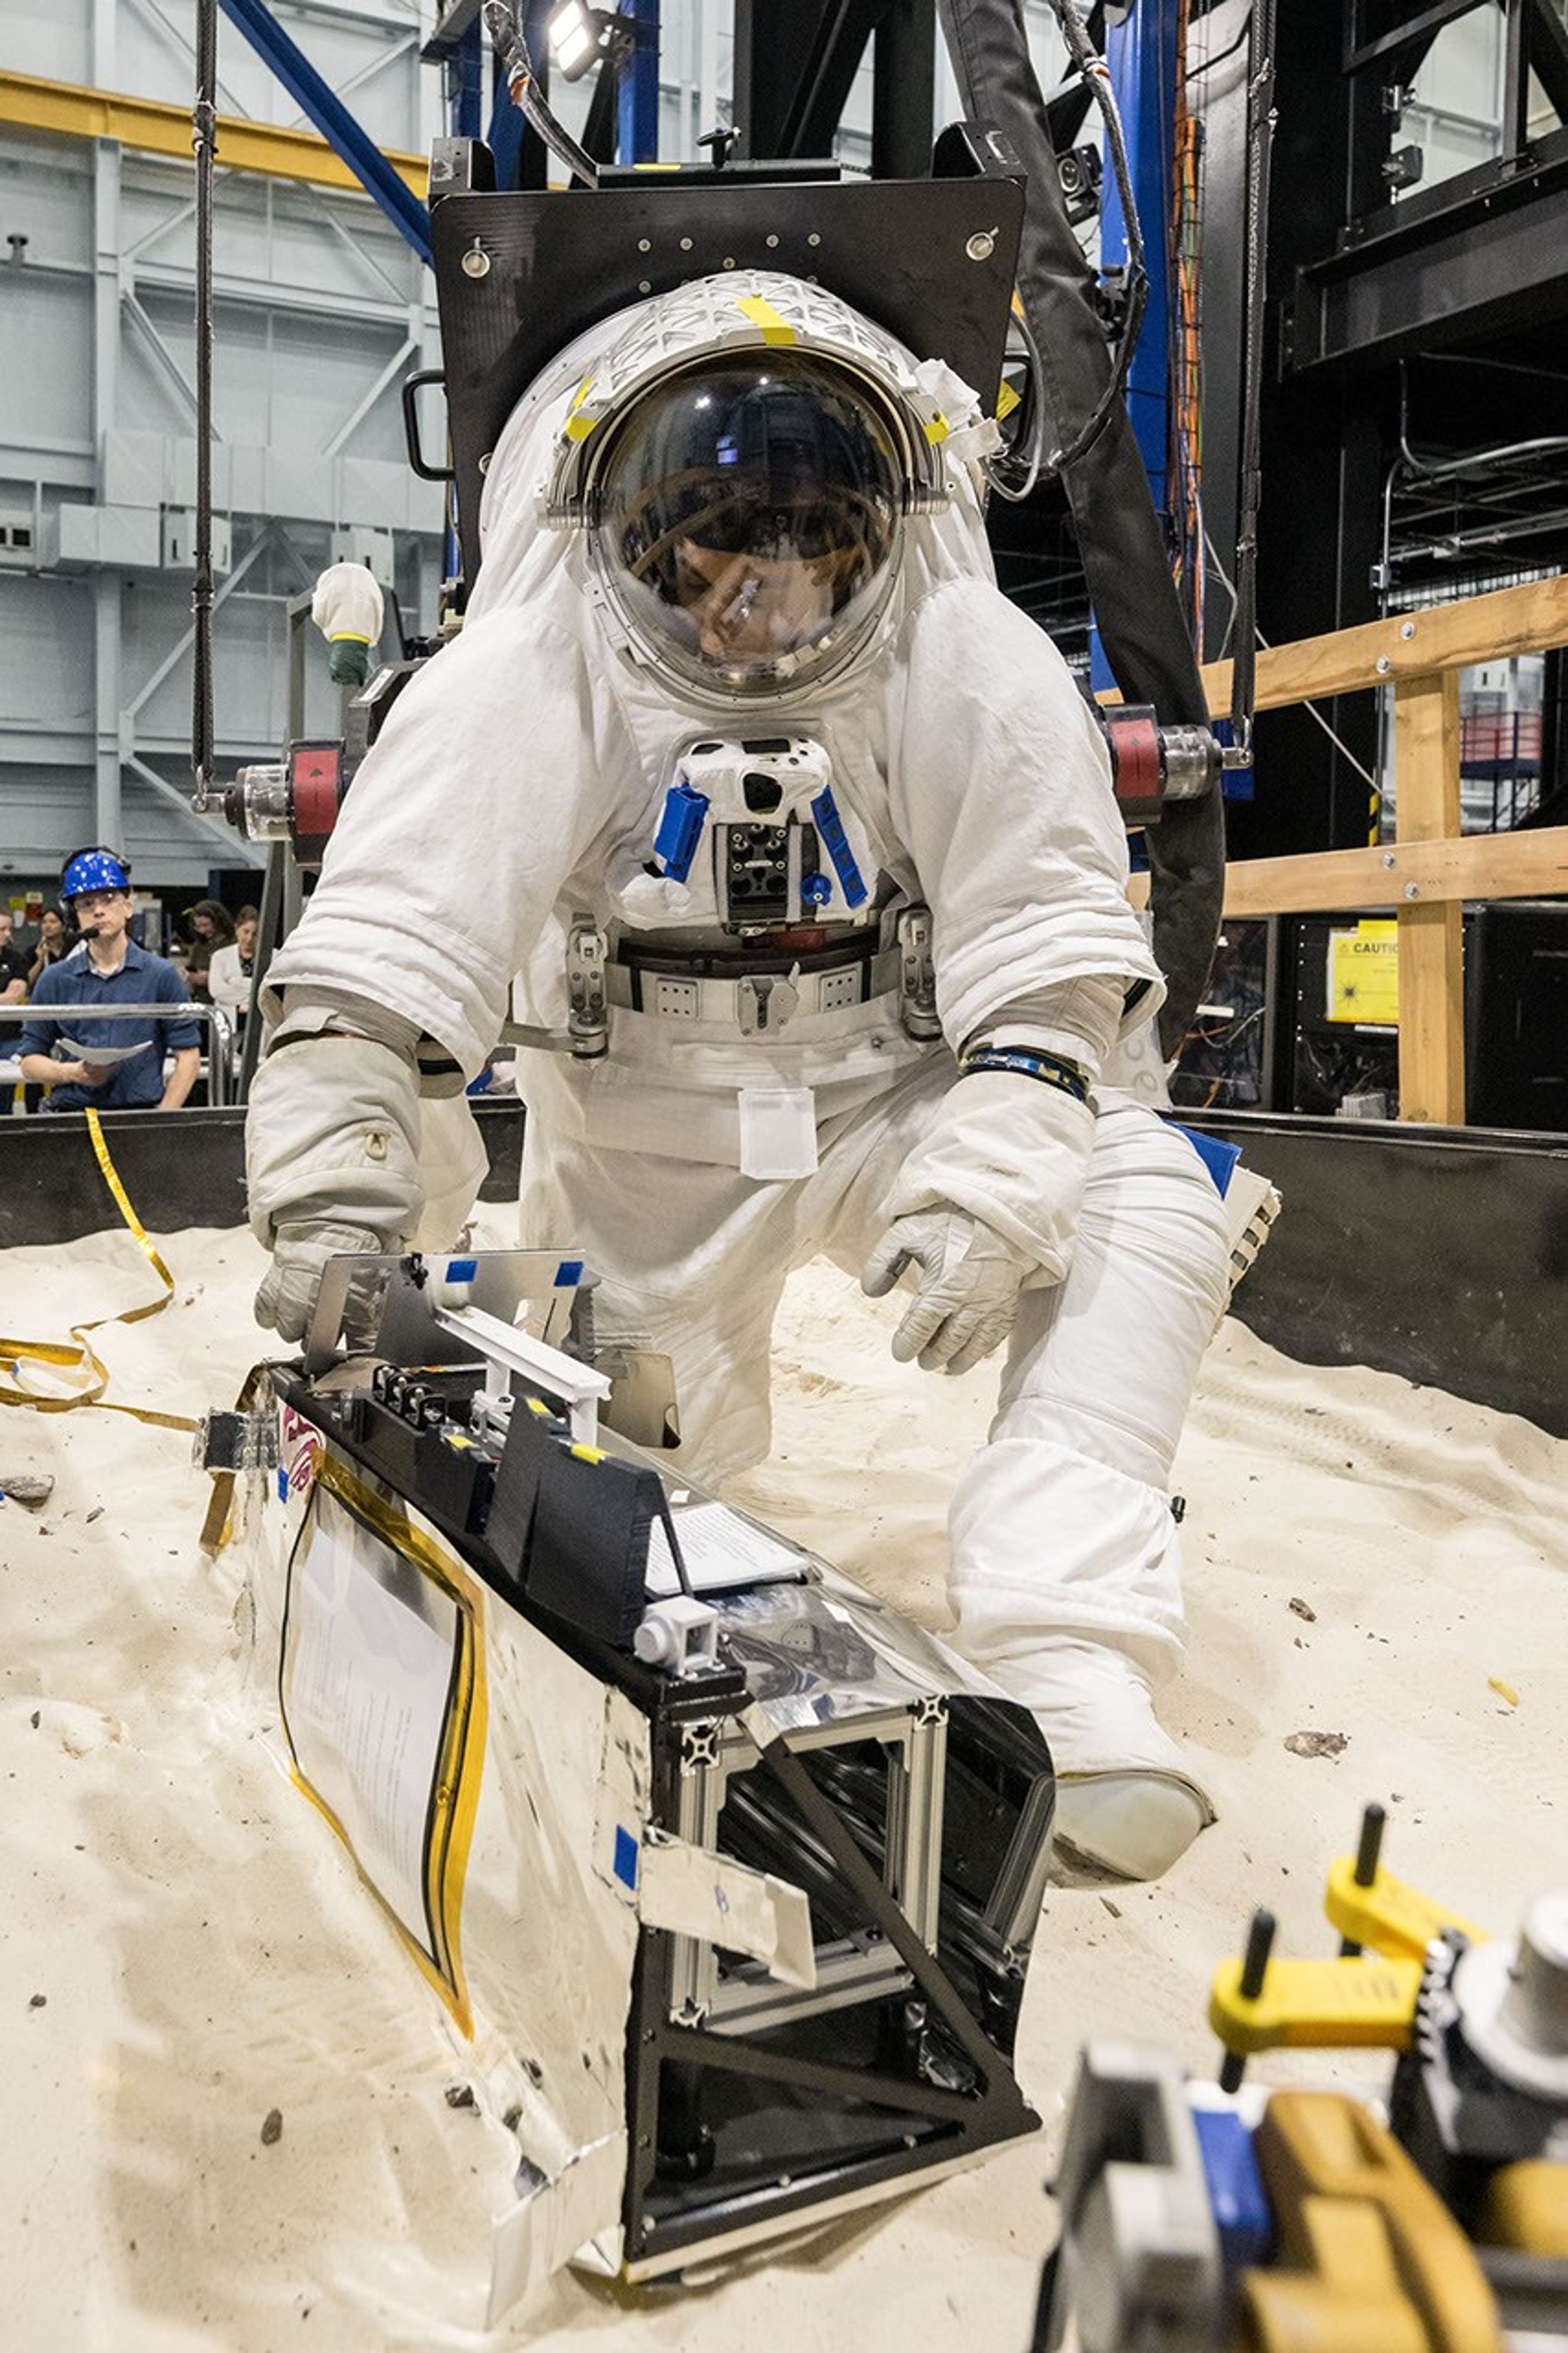
An astronaut in a white spacesuit kneels in simulated lunar soil while working with scientific equipment in a large testing facility. Staff members and support structures are visible in the background.
A scientist wearing NASA’s xEMU prototype space suit is testing the handling of a mockup version of NASA’s Lunar Environment Monitoring Station, or LEMS. The testing took place at the Active Response Gravity Offload System, a simulated reduced gravity environment at NASA’s Johnson Space Center in Houston.
NASA Johnson

The LEMS payload builds on a legacy of lunar seismic tracking. Apollo astronauts deployed a network of seismometers on the Moon’s nearside equatorial region between 1969 and 1972. Those instruments operated until 1977, recording about 13,000 moonquakes and other ground vibrations that helped scientists begin to understand the composition of the Moon’s interior. For decades, researchers have hoped to spread more seismometers, updated with new technologies, across the lunar surface.

Now, LEMS will carry the first seismometers to be deployed by future astronauts to listen for faint ground vibrations, collecting new clues to the Moon’s internal structure and ongoing seismic activity. The sensors will be the most compact, sensitive, and energy-efficient seismometers ever built for planetary exploration.

LEMS itself is about the size of a small suitcase, weighing 11 pounds in the Moon’s low-gravity environment. It will carry not just these seismic sensors, but everything it needs to function independently of humans after deployment. LEMS is built to manage its own power production via a lightweight, flexible solar array that conforms to the shape of the LEMS unit. It also will manage its operational activities to ensure continuous data collection based on a preset plan, and monthly data transmission to Earth. The payload will do all this while maintaining a stable internal temperature throughout the massive day-to-night temperature swings of the South Pole region.

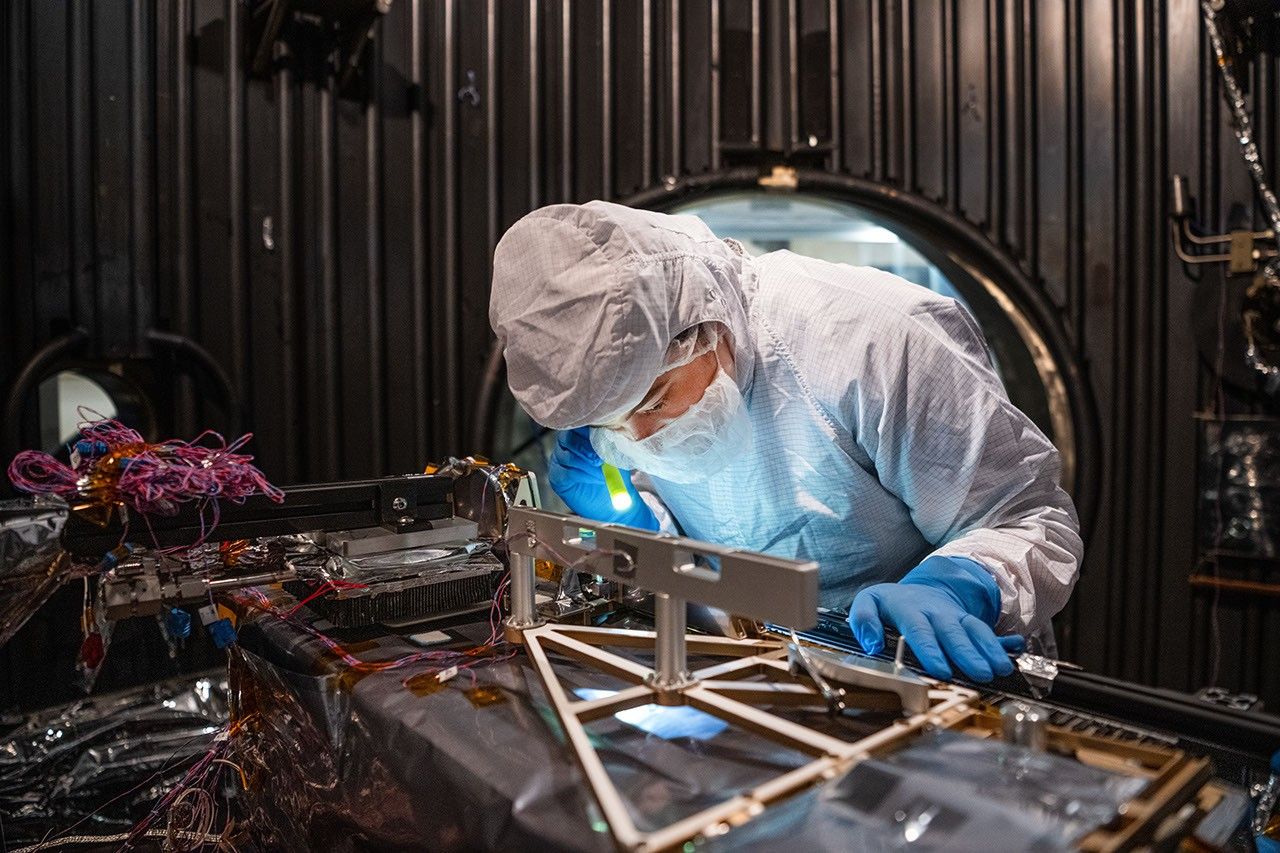
A technician in a white clean-room suit and blue gloves uses a small flashlight to inspect a spacecraft instrument inside a dark testing chamber. Colorful wires and metallic components surround the instrument.
Mechanical Engineer Brie Ludwig inspects the Lunar Environment Monitoring Station (LEMS) in preparation for testing in a thermal vacuum chamber at Goddard Space Flight Center in Greenbelt, Maryland, on March 31, 2026. LEMS is a compact, autonomous, and self-sustaining seismometer suite designed to carry out continuous, long-term monitoring of the lunar seismic environment at the South Polar region.
NASA/Denny Henry

“When we conceived of LEMS, we weren’t just thinking about the next mission, we were thinking about the next generation of lunar exploration,” said Mehdi Benna, a University of Maryland Baltimore County scientist who leads LEMS from NASA Goddard. “Our vision was to create a scientific buoy for the Moon. Like an ocean buoy on Earth, LEMS is designed to be easy to build, adaptable to different scientific objectives, and capable of operating independently for years.”

Before any surface science could happen, Benna and his team had to ensure that LEMS could survive the trip to the Moon and the harsh environment of its surface. Over the past five months, LEMS and its components have been subjected to a demanding series of environmental and operational tests. Engineers verified LEMS can endure the violent shaking of launch, the journey to the lunar surface, and the Moon’s temperature and radiation environment. The team also showed that the instrument package’s mechanical and electrical design is safe for astronaut handling.

The LEMS payload was built to operate through the lunar night, which lasts two Earth weeks, without external power assistance or a heat source. Past lunar surface instruments relied on radioisotope heaters for warmth and power. But LEMS instead will withstand temperatures that dip to minus 400 degrees Fahrenheit in some areas by using advanced insulation materials, low-thermal-conductivity cables that minimize heat loss, and a thermal regulator that conducts heat away during the day to prevent overheating and helps retain heat at night.

These innovations reduce mass and power needs, setting the stage for lighter, energy-efficient instruments that can operate continuously at future Artemis landing sites and the NASA-led Moon Base.

The LEMS payload is led by University of Maryland Baltimore County and University of Maryland College Park. Technical implementation is led by NASA Goddard. The University of Arizona, in partnership with Silicon Audio, Inc., supplied LEMS’ two state-of-the-art seismometers. Morehead State University in Kentucky provided LEMS’ telecommunication system and will operate the instrument on the surface. Washington University in St. Louis will manage the instrument’s data processing and dissemination to the larger scientific community.

  •  

Arkansas researchers map genetic neighborhoods to identify disease-causing bacteria

Scientists in Arkansas have developed a machine-learning approach that can identify potentially disease-causing strains of a poultry bacterium by analyzing not only which genes are present, but also how those genes are arranged across the genome. The method focuses on the “genetic neighborhoods” surrounding genes, offering a new way to distinguish harmful strains of Enterococcus cecorum from closely related strains that do not cause disease.

E. cecorum is commonly found in poultry environments, and many of its strains are harmless. However, pathogenic strains can cause arthritis, bone infections and lameness, creating serious animal-welfare problems and economic losses for poultry producers. Because pathogenic and nonpathogenic strains can share many of the same genes, identifying the genetic features associated with disease has been challenging.

The research team, led by Aranyak Goswami of the Arkansas Agricultural Experiment Station’s Center for Agricultural Data Analytics, examined the organization of genes within genomic islands. These are segments of DNA that bacteria often acquire from other microorganisms through horizontal gene transfer. Genomic islands can carry genes involved in antibiotic resistance, bacterial survival, movement of DNA and virulence, making them important regions for understanding how pathogens emerge.

Rather than treating the bacterial genome as a simple list of genetic components, the researchers analyzed it as a structured map. They investigated which genes occurred near one another, the order in which they appeared and the way groups of neighboring genes formed recurring units known as genomic-island cassettes. This architecture provided information that could be missed when genes are examined individually.

“The machine-learning model recognizes patterns in gene order much like it recognizes patterns in language,” Goswami said. In the same way that a language model can learn that certain words frequently appear together, the computational system learned that particular combinations and arrangements of bacterial genes were associated with pathogenic strains. The approach therefore captures relationships among genes rather than relying only on the presence or absence of individual DNA sequences.

For the proof-of-concept study, the researchers analyzed the genomes of 145 E. cecorum strains isolated from poultry. The dataset included 95 nonpathogenic strains and 50 pathogenic strains capable of causing illness. The analysis found that disease-associated strains were more likely to contain genomic islands enriched in genes linked to antimicrobial resistance and the transfer of genetic material between bacteria.

Those findings do not mean that every bacterium carrying such genes will necessarily cause disease. Instead, the researchers describe the system as an exploratory classification and research tool. It identifies patterns that may help scientists investigate why some bacterial lineages become harmful, while also providing clues about how resistance and virulence traits move through bacterial populations.

Current monitoring methods for E. cecorum often depend on culturing the bacterium or screening for specific genes. Such techniques remain valuable, but they may overlook broader genomic relationships. The new pipeline could complement these approaches by evaluating the wider context in which genes occur. Additional testing with larger and more geographically diverse datasets will be necessary before the method can be used for routine flock surveillance or diagnostic decision-making.

The researchers believe the strategy could eventually be adapted to other bacterial species affecting animals, humans, wildlife and plants. Goswami’s team is beginning to examine Enterococcus faecalis, a close relative of E. cecorum and a frequent cause of hospital-acquired infections in humans. They also plan to apply the pipeline to Escherichia coli and other bacteria to study how nonpathogenic lineages acquire the genomic configurations associated with disease. The study, published in Frontiers in Microbiology, demonstrates how machine learning and comparative genomics can reveal hidden signals in bacterial DNA and may help researchers track the evolution of emerging pathogens.

Subject of Research: Animals

Article Title: Genomic-island cassette architecture provides interpretable signal for exploratory classification of poultry-associated Enterococcus cecorum lineages

News Publication Date: 7-Jul-2026

Web References: https://doi.org/10.3389/fmicb.2026.1882753

References: Frontiers in Microbiology, DOI: 10.3389/fmicb.2026.1882753

Image Credits: UA University Relations photo by Chieko Hara

Keywords: artificial intelligence, machine learning, deep learning, computational biology, bacterial pathogens, Enterococcus cecorum, genomic islands, genomic architecture, antibiotic resistance, poultry disease, pathogen surveillance, comparative genomics

  •  

Ancient Warming Event Reveals Possible Climate Tipping Point

A climate shock that unfolded about 304 million years ago is offering scientists a dramatic warning about how quickly Earth’s climate system can amplify an initial temperature rise. During the Late Paleozoic Ice Age, a relatively modest increase in global temperatures appears to have triggered a much larger episode of warming, as methane released from thawing permafrost intensified the greenhouse effect. Researchers say the ancient event provides a powerful geological parallel for the climate changes occurring today.

The study, led by Le Yao of the Nanjing Institute of Geology and Paleontology with contributions from University of Cincinnati geosciences professor Thomas Algeo and international colleagues, examined a short-lived warming episode during Earth’s penultimate ice age. Their findings suggest that global sea surface temperatures eventually increased by more than 7 degrees Celsius, or approximately 12 degrees Fahrenheit. The rise was not necessarily caused by one enormous initial pulse of carbon. Instead, it may have developed through a chain reaction in which warming activated additional natural sources of greenhouse gases.

The Late Paleozoic Ice Age extended across a vast span of geological time, when large ice sheets covered parts of the supercontinent Gondwana. Although the planet was in an “icehouse” state, atmospheric carbon dioxide and methane still had the power to destabilize the climate. The newly analyzed warming event is particularly significant because it occurred under ice-age conditions rather than during an already warm greenhouse world. That makes it a valuable analog for the modern Earth, which still contains continent-scale ice masses in Greenland and Antarctica.

According to the researchers, the initial climate disturbance may have been linked to volcanic activity. Volcanic emissions can inject carbon dioxide and other gases into the atmosphere, where they absorb outgoing infrared radiation and prevent some heat from escaping into space. The warming may also have been assisted by changes in Earth’s orbit. Over long cycles, variations in orbital shape alter the distribution of sunlight across the planet, influencing the growth and retreat of ice sheets and changing the seasonal balance of solar energy.

At first, the additional carbon may have produced only a limited temperature increase. But once warming crossed a critical threshold, frozen ground in high-latitude regions began to thaw. Permafrost contains large quantities of organic carbon preserved in frozen soils. When that material becomes available to microbes, decomposition can release carbon dioxide and methane. Methane is especially powerful over shorter atmospheric timescales because, molecule for molecule, it absorbs considerably more infrared radiation than carbon dioxide, even though it remains in the atmosphere for less time.

This process can create a positive climate feedback. An initial warming causes permafrost to thaw, thawing releases greenhouse gases, and the additional gases produce further warming. That extra heat can accelerate more thawing, allowing the cycle to reinforce itself. The researchers describe the ancient event as a transient global warming episode in which a comparatively modest carbon release appears to have crossed a climatic tipping point and initiated much more extensive carbon emissions from natural reservoirs.

The geological timescale of the ancient warming is also central to the study’s relevance. Algeo said the temperature change unfolded over tens of thousands of years, with warming occurring at an average rate of roughly one-tenth of a degree Celsius per 1,000 years. Modern warming is progressing far more rapidly. Researchers have observed an increase of nearly 1 degree Celsius in global sea surface temperature over approximately the past century, a rate many times faster than the average change reconstructed for the ancient event.

The comparison does not mean that Earth is destined to repeat the precise conditions of 304 million years ago. Continents, ecosystems, atmospheric composition and ice-sheet geometry were all different in the Late Paleozoic. However, the physics of greenhouse warming and the existence of carbon feedbacks remain relevant. Ancient climate records reveal how a system that appears stable can respond nonlinearly when warming activates processes capable of releasing additional greenhouse gases.

The findings also place human history in a broader planetary context. All recorded human civilization has developed during the most recent ice age, despite the fact that the term can sound incompatible with today’s climate. In scientific usage, Earth remains in an ice age because substantial permanent ice sheets still exist in Greenland and Antarctica. The ancient warming episode matters precisely because it demonstrates that an ice age does not guarantee a permanently cold or stable climate. Even within an icehouse world, a small disturbance can trigger rapid and substantial changes when reinforcing feedbacks are engaged.

The research, published in the Proceedings of the National Academy of Sciences, underscores why scientists closely monitor permafrost, polar ice and other climate-sensitive carbon stores. The ancient record cannot provide an exact forecast of future warming, but it shows that Earth’s climate has repeatedly responded to carbon disturbances with amplifying feedbacks. As modern emissions continue to raise temperatures at an exceptional rate, the geological evidence offers a clear message: the danger lies not only in the carbon released directly by human activity, but also in the natural carbon sources that warming can unlock.

Subject of Research: Ancient global warming, permafrost methane feedbacks, and climate tipping points during the Late Paleozoic Ice Age

Article Title: A transient global warming event during Earth’s penultimate icehouse

Web References: https://doi.org/10.1073/pnas.2601643123

References: Proceedings of the National Academy of Sciences, DOI: 10.1073/pnas.2601643123

Image Credits: Andrew Higley, University of Cincinnati

Keywords: climate change, global warming, ice age, Late Paleozoic Ice Age, permafrost, methane, climate feedback, tipping point, paleoclimate, geology, volcanic activity, Earth’s climate history

  •  

Which Families Pay Most for Neonatal Intensive Care? Analyzing NICU Out-of-Pocket Costs

The price of saving a newborn’s life can extend far beyond the hospital walls. A new analysis published in the Journal of Perinatology is drawing attention to a largely invisible consequence of neonatal intensive care: the direct medical out-of-pocket costs paid by families. The study, led by researchers Gorka, Profit and Phibbs, examines who carries the greatest financial burden during a neonatal intensive care unit admission and investigates how structural conditions may shape those costs.

Neonatal intensive care is among the most technologically advanced forms of medicine. Infants in NICUs may require mechanical ventilation, incubators that regulate temperature and humidity, continuous heart and oxygen monitoring, intravenous nutrition, specialized medications and repeated laboratory testing. These interventions can be lifesaving, particularly for babies born extremely prematurely or with serious medical complications. Yet the financial consequences of receiving this care are not experienced equally by every household, even when families receive treatment in the same health-care system.

The researchers’ focus is direct medical out-of-pocket spending: the money families must pay themselves for medical services connected to a NICU admission. This can include deductibles, copayments, coinsurance and other forms of cost sharing that remain after insurance has paid its portion. Unlike the total hospital charge or the amount reimbursed by an insurer, out-of-pocket cost reflects the portion that reaches a family’s own budget. For households already coping with an unexpected high-risk birth, even relatively small individual charges can accumulate rapidly.

The study is designed not only to document these expenses, but also to explore the structural forces behind differences in cost burden. In health economics, structural contributions refer to the way institutions and systems distribute risk and resources. Insurance design, employment-linked coverage, household income, geographic location, hospital characteristics and access to public assistance can all affect how much a family ultimately pays. Two infants with similar clinical needs may therefore generate very different financial experiences for their parents, depending on the architecture of coverage surrounding them.

That distinction matters because the effects of a NICU admission are not limited to the newborn’s medical condition. Parents may need to travel long distances to reach a specialized hospital, arrange accommodation near the facility, pay for transportation or meals, and take unpaid leave from work. These expenses may not always appear in estimates of direct medical out-of-pocket costs, but they can intensify the economic shock associated with a prolonged admission. The medical bill is only one component of the broader financial strain that can accompany neonatal illness.

A central question raised by the analysis is whether the families with the fewest financial resources are also the ones most exposed to high cost sharing. A payment that is manageable for a high-income household may consume a substantial share of a lower-income family’s monthly budget. Economists often describe this pattern as a disproportionate cost burden: the absolute amount paid may not be the highest, yet the payment represents a greater fraction of household resources. This distinction can reveal inequities that remain hidden when researchers look only at average dollar amounts.

The findings are expected to be relevant to health-policy debates about medical debt, insurance protection and the financial consequences of premature birth. If structural factors account for meaningful differences in family payments, reducing inequality may require more than improving clinical care. Potential responses could include limits on neonatal cost sharing, stronger protections against unexpected bills, expanded eligibility for public coverage and assistance with transportation or family support services. The analysis may also help hospitals and policymakers identify families at risk of financial hardship while an infant is still receiving care.

The issue has significance beyond individual hospitalizations because NICU care can influence a family’s financial stability long after discharge. Parents may face follow-up appointments, medications, developmental assessments and specialist care for children who experienced complications of prematurity or serious illness. Medical expenses can overlap with reduced work hours, job loss or the need for one parent to become a full-time caregiver. A short period of intensive treatment can therefore produce a long economic aftershock, particularly when families lack savings or paid leave.

By placing family payments at the center of neonatal research, Gorka, Profit and Phibbs emphasize a dimension of NICU care that is often absent from clinical success measures. Survival, complications and length of stay remain essential indicators, but they do not fully describe the experience of families navigating intensive care. Understanding who pays the most, why they pay it and how those payments relate to broader social structures could help redefine quality in neonatal medicine. The study’s message is potentially viral because it connects cutting-edge life-saving technology with a simple but consequential question: when medicine saves a baby, how much of the cost is left for the family to survive?

Subject of Research: Direct medical out-of-pocket costs of neonatal intensive care admissions and structural factors contributing to differences in financial burden among NICU families.

Article Title: Who pays the most for neonatal intensive care? An analysis of the out-of-pocket cost burden borne by NICU families

Article References: Gorka, N., Profit, J. & Phibbs, C.S. “Who pays the most for neonatal intensive care? An analysis of the out-of-pocket cost burden borne by NICU families.” Journal of Perinatology (2026). https://doi.org/10.1038/s41372-026-02869-6

Image Credits: AI Generated

DOI: 10.1038/s41372-026-02869-6

Keywords: neonatal intensive care, NICU, out-of-pocket costs, medical expenses, health-care inequality, premature birth, financial burden, insurance, neonatal health, health policy

  •  

Transit-based exoplanet survey finds its first microlensing exoplanet

NASA’s Transiting Exoplanet Survey Satellite (TESS) mission has notched up its first discovery of an exoplanet via a method known as microlensing. The planet is a “super Jupiter” known as Gaia23bra b, and TESS observed it when the planet and its host star acted as a gravitational lens, magnifying the light from a second, more distant background star.

Astronomers have several ways of finding planets beyond our solar system. The most successful of these by far – and the one that TESS was designed for – is the transit method, which is responsible for roughly 75% of all exoplanet detections to date. This approach relies on observing the periodic dimming of a star’s light as a planet passes between the star and an observer here on Earth.

The transit method does have limitations, however. The main limitation is that we can see transits for only a small number of planets, namely those with orbital planes that are almost exactly edge-on to Earth. An alternative approach known as photometric microlensing is somewhat more flexible in this respect, as it relies on the star-planet system magnifying the light from a background star, which is known as the source. This magnification occurs because the gravitational pull of the planet-star system warps space, bending and magnifying the source’s light (as Albert Einstein predicted as part of his general theory of relativity) like a lens and producing characteristic spikes in its brightness.

A second bite at the exoplanetary cherry

Astronomers initially identified a planet in the Gaia23bra system using observations made in 2023 by the European Space Agency’s now-retired Gaia space telescope. However, while Gaia picked up the unexpected brightening of a background star, it did not identify this event as coming from a binary-star system, and it could not pick out the planet itself because its observations were too sparse, explains Mallory Harris, an astronomer at the University of New Mexico, US who led the TESS study.

In the new work, Harris and colleagues scoured TESS data from the same period. Because TESS’ observations were much denser – it observed the region every 200 seconds for nearly 60 days – they were able to identify extra features in the brightness of the light curve that indicated the presence of a planet in the system. Subsequent analyses revealed that this planet is about 1.63 times the size of Jupiter, and it orbits its host – an orange dwarf star 20% smaller than our Sun – at a distance similar to that of Jupiter from our Sun.

Complementary techniques

The transit technique is particularly sensitive to planets that orbit close to their star because these planets are the most likely to transit and block out most of their host stars’ light as they pass in front of them. In contrast, Harris explains that microlensing is most sensitive to planets orbiting at Earth-like distances or further from their stars, making it better for studying planetary systems more like our own solar system. “With microlensing, we can find smaller planets with greater orbital distances, including worlds in the habitable zone of their star and even farther away,” she says.

The transit technique and microlensing are therefore complementary because each reveals a category of planet that the other may not be able to detect, adds team member Diana Dragomir. The only problem, Harris notes, is that microlensing observations are limited-time opportunities. “Microlensing events happen once and they’re gone – they don’t repeat,” Harris says. “I like to joke that we’ll probably find the first Earth analogue with microlensing and then wave at it as it goes by because we’ll never see it again.”

That said, Harris says that Gaia23bra will be an important observing target for the Nancy Grace Roman Space Telescope. “Microlensing is currently the only method capable of detecting Earth‑mass planets at Earth‑like orbital distances,” she explains. “We already knew that this technique could find planets, because it has done so in the past using ground-based observatories.

“What we demonstrated in this work is that high-cadence observations (even with low spatial precision) and high-precision long-baseline observations can work together to find a microlensing planet. And that it is possible to specifically do this by pairing TESS observations with those from another instrument.”

This synergy between long-time-scale surveys and high cadence observations could be therefore applied towards future searches for potentially habitable worlds, she tells Physics World. Although Gaia was retired last January, making it unlikely that astronomers will find many additional events via a Gaia–TESS combination, Harris adds that there could nevertheless be other microlensing planets in the past eight years of archived TESS observations. “I’m excited to see whether there are other events like this already hiding in the TESS data and whether future surveys can work together with TESS to find more microlensing planets in different parts of the galaxy,” she says.

The post Transit-based exoplanet survey finds its first microlensing exoplanet appeared first on Physics World.

  •  

Aug. 11, 1877: Asaph Hall discovers Deimos

After spending the 1850s at Harvard Observatory calculating orbits, Asaph Hall became an assistant at the U.S. Naval Observatory at Washington, D.C., in 1862. He was quickly promoted, and by 1873 had not only held several scientific discussions with Abraham Lincoln during the president’s visits to the observatory, but had also been put in chargeContinue reading "Aug. 11, 1877: Asaph Hall discovers Deimos"

The post Aug. 11, 1877: Asaph Hall discovers Deimos appeared first on Astronomy Magazine.

  •  
❌