❌

Reading view

Cosmic “galaxy-killing wind” may explain why some galaxies died so young

Astronomers have discovered a powerful “galaxy-killing wind” in the early universe that may help solve one of the biggest mysteries in modern astronomy: why so many massive galaxies stopped forming stars much earlier than scientists expected. The discovery suggests that some young galaxies grew rapidly and then died just as quickly, not because of exotic […]

The post Cosmic “galaxy-killing wind” may explain why some galaxies died so young appeared first on Knowridge Science Report.

  •  

NASA’s James Webb Space Telescope Spots a Hidden ‘Galaxy Killer’ Lurking in the Early Universe


The James Webb Space Telescope (JWST) has revealed a cosmic catastrophe, as winds extinguished a star-forming galaxy in the early universe, offering new insight into earlier strange observations.

Cosmic winds may destroy entire galaxies, according to new JWST research exploring the lingering mystery of why certain parts of the universe are unexpectedly devoid of growth.

The findings were published in a recent paper in the Monthly Notices of the Royal Astronomical Society, revealing galactic-scale death in a universe just one billion years old, and potentially answering questions about previous troubling JWST observations.

James Webb Space Telescope Observation

Observations made by the JWST revealed cold gas, an essential star-forming material, blowing out of the CRISTAL-2 galaxy in a massive plume, severely degrading its ability to produce new stars. According to the researchers, it would take less than 50 million years for the galaxy to be completely dead if this activity keeps up, a mere blink in the scheme of a 13.8 billion-year-old universe.

Astronomers consider galaxies to be “dead” if they are no longer capable of producing fresh stars. Traditionally, astronomers expected that it would take billions of years for an old galaxy to slowly run out of fuel and burn out. However, JWST observations have continually captured events in the early universe that were not expected to occur until much later.

One of these was finding a host of dead galaxies in the early universe shortly after it first became operational in 2022. How galaxies could die so close to the beginning of the universe, without sufficient time to burn through their cold gas supplies, has long perplexed scientists.

Explaining Galaxy Death

As researchers began considering various explanations for the phenomenon, they initially settled on dark energy, essentially explaining one unknown with another. Dark energy is a theoretical substance that scientists believe drives the expansion of the universe and was once a stronger force than it is now. While the Dark Energy Spectroscopic Instrument survey revealed last year that dark energy appears to be weakening over time, an exotic galaxy-killer is not required, according to this latest research.

Instead, researchers offer a much simpler explanation of powerful cosmic winds in the remote past. Conventional thinking has it that such powerful winds could only be generated by a supermassive black hole, yet these new observations challenge that assumption.

JWST Reveals the Culprit

CRISTAL-02 is a galaxy still in the making, composed of several smaller galaxies in the final stages of merging into a single system. Because the early universe was far denser than it is today, such collisions were much more common. During these mergers, gravitational forces funnel vast amounts of gas toward the galactic centers, triggering intense bursts of star formation.

Observations of CRISTAL-02 by the James Webb Space Telescope and the Atacama Large Millimeter/submillimeter Array (ALMA) revealed a star formation rate roughly twice that of similar galaxies. Ironically, this extraordinary burst of stellar activity is also generating a powerful cosmic wind that is stripping away the very gas needed to form new stars.

Compounding the effect, many of the newly formed stars rapidly exhaust their fuel and end their lives as supernovae, producing additional outflows that further deplete the galaxy’s star-forming material.

Together, these processes appear capable of shutting down star formation far more quickly than astronomers previously believed possible. Going forward, ongoing JWST observations are likely to continue challenging astronomers’ assumptions, as more evidence indicates that nearly half of the early universe’s massive galaxies were interacting—a finding which also suggests early “galactic deaths” like these may not be all that rare, after all.

The paper, “Multiphase Images of a Powerful Supernova-Driven Wind in the Early Universe,” appeared in Monthly Notices of the Royal Astronomical Society on June 10, 2026.

Ryan Whalen covers science and technology for The Debrief. He holds an MA in History and a Master of Library and Information Science with a certificate in Data Science. He can be contacted at ryan@thedebrief.org, and follow him on Twitter @mdntwvlf.

  •  

Astronomers Finally Find Milky Way’s Missing Black Hole Wind

This image shows the evidence for the wind blowing away from Sagittarius A*: the white dot in the center of the image shows the supermassive black hole; in orange is data from ALMA, mapping the location of cold gas composed of carbon monoxide in the image; in blue is X-ray data from Chandra; a large cone-shaped cavity, visible as an absence of cold gas in the ALMA data, is filled by hot X-ray-emitting gas in the Chandra data. Image credit: NASA / CXC / UMass / Wang et al. / ALMA / ESO / NAOJ / NRAO / Longmore et al. / Minniti et al.

After a 50-year search, astronomers have uncovered evidence that Sagittarius A* -- the 4.3-million-solar-mass black hole that resides at the center of our Milky Way Galaxy -- is blowing a hot cosmic wind into its surroundings, carving out a giant cavity near the Galaxy’s heart.

The post Astronomers Finally Find Milky Way’s Missing Black Hole Wind appeared first on Sci.News: Breaking Science News.

  •  

When Winds Collide: Predicting the Effects of Stream Interaction Regions

Illustration of the solar wind interacting with Earth's magnetic field

What happens when pileups of solar wind plasma collide with Earth’s protective magnetosphere? New work uses machine learning to examine how strongly these events affect our planet’s magnetic field.

Plasma Pileups

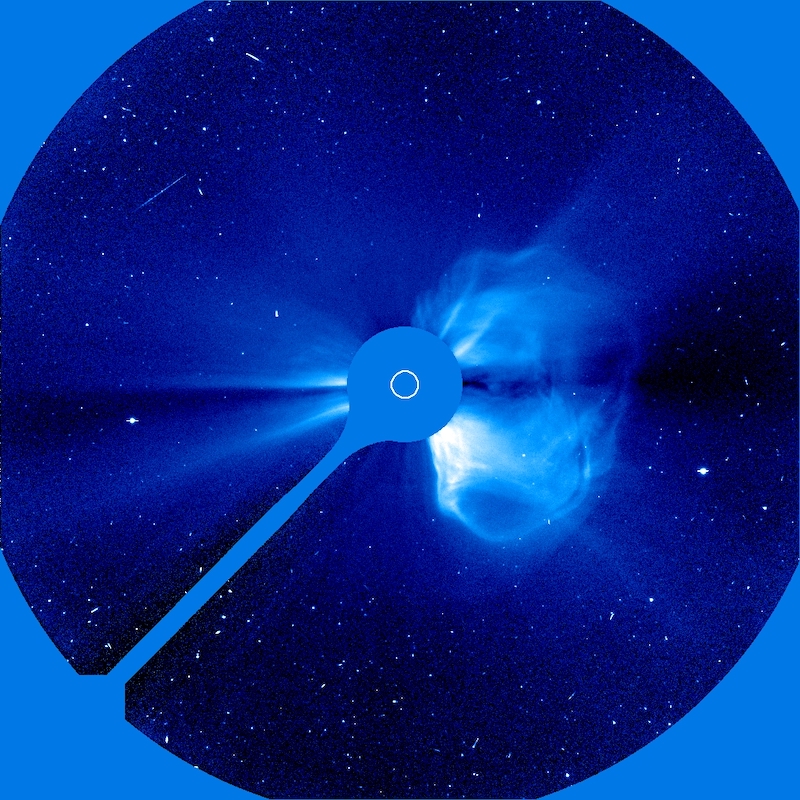
photograph of a coronal mass ejection

The Solar & Heliospheric Observatory (SOHO) took this coronagraphic image of a coronal mass ejection on 20 April 1998. [SOHO (ESA & NASA)]

Geomagnetic storms driven by solar activity paint night skies with glowing aurorae, but they also threaten spacecraft electronics with showers of high-energy particles. While immense eruptions of solar plasma and magnetic fields called coronal mass ejections are the most infamous example of solar activity, a team led by Yudong Ye (Sun Yat-Sen University) recently focused on another, less destructive form of activity: stream interaction regions.

Stream interaction regions arise when slow-moving solar wind is struck from behind by faster-moving solar wind emitted later. The collision of the two solar wind streams creates a tangle of compressed plasma and strong magnetic fields capable of peeling back Earth’s protective magnetosphere and dumping in high-energy charged particles, with beautiful yet harmful results.

Machine Learning Method

Though stream interaction regions are less disruptive than coronal mass ejections, they’re far more common; they frequently needle Earth’s magnetosphere, especially during the calmer years of the Sun’s activity cycle. Predicting how strongly a stream interaction region will influence Earth’s magnetosphere — in other words, how geoeffective it is — is challenging, however. When two streams of solar wind collide, their properties combine in complex and nonlinear ways that traditional statistical investigations have struggled to pin down.

Now, Ye and collaborators have used machine learning to study the properties and impact of stream interaction regions in a physically meaningful way. They performed their study on a sample of 879 stream interaction events for which there is abundant information, such as temperature, magnetic field strength and direction, and solar wind conditions before and after the event.

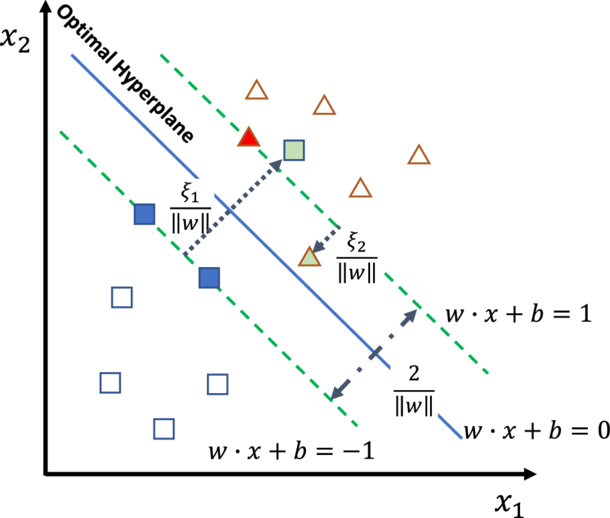
illustration of the support vector machine framework

Illustration of the authors’ support vector machine framework. The optimal hyperplane is the boundary that best divides the data by maximizing the distance between the boundary and the data points nearest to it; these points are called support vectors. Square and triangle symbols represent two classes of data. Click to enlarge. [Ye et al. 2025]

Ye’s team based their framework on a support vector machine classifier: a classical machine learning algorithm that draws a mathematical boundary between groups of data while maximizing the distance between the boundary and the data points nearest to the dividing line. The support vector machine algorithm is well-suited to the task of modeling the geoeffectiveness of stream interaction regions because it doesn’t require a particularly vast dataset, can tolerate misclassified events, and allows for a physical interpretation of the results.

A Physical Interpretation

The team first reined in the model’s complexity by identifying the most important features in the dataset. They then determined which features or combination of features had the largest contribution to the output — in other words, which physical parameters most strongly determined the geoeffectiveness of the event.

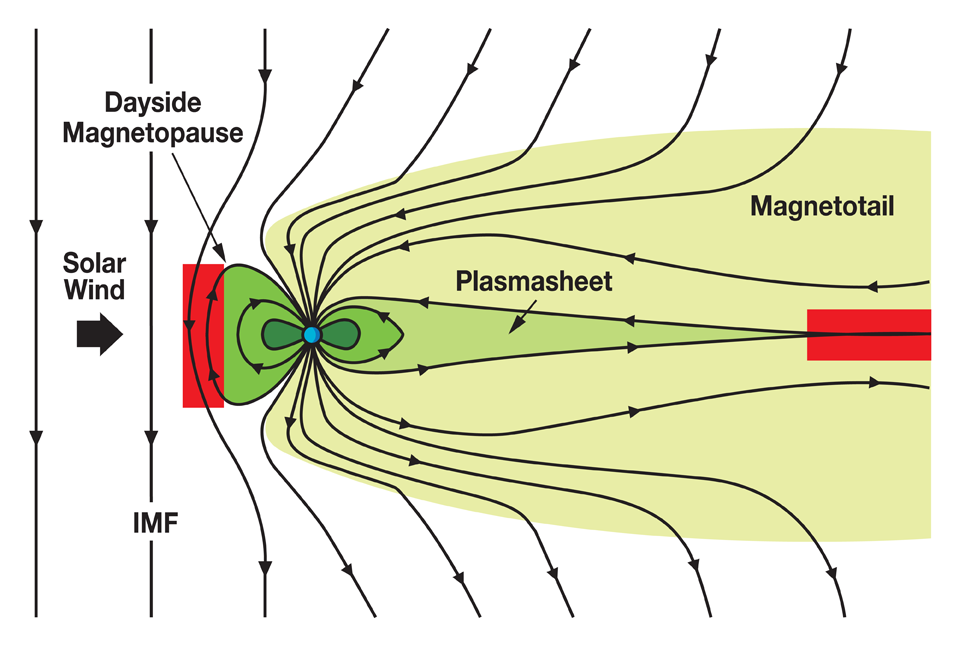
illustration of magnetic reconnection in Earth's magnetosphere

Illustration of how the interplanetary magnetic field (IMF) interacts with Earth’s magnetosphere. When the IMF points southward, as it does in this diagram, the impact on Earth’s magnetosphere is increased, with magnetic reconnection occurring in the red areas. Click to enlarge. [NASA]

Ye and collaborators found that the strongest determinants of an event’s geoeffectiveness were how long the solar wind was directed southward, the strength of the solar wind electric field, and the average and minimum strengths of the southward-pointing solar wind magnetic field. These results align with the current understanding of how energy is transferred from the solar wind to Earth’s magnetosphere through magnetic reconnection, a release of magnetic energy driven by rearrangement of magnetic fields. This shows how classical machine learning methods can enhance our ability to predict the outcome of oncoming space weather while simultaneously examining the physical drivers of the event.

Citation

“Assessing the Geoeffectiveness of Stream Interaction Regions Through Physically Interpretable Machine Learning,” Yudong Ye et al 2025 ApJ 993 10. doi:10.3847/1538-4357/ae0454

The post When Winds Collide: Predicting the Effects of Stream Interaction Regions appeared first on AAS Nova.

  •  

Minding the Gaps in Solar Wind Data

solar wind

Spacecraft scattered throughout the solar system keep tabs on the solar wind, but the measurements are dotted with data gaps. How can scientists prevent these gaps from biasing their studies of the solar wind?

Sampling the Solar Wind

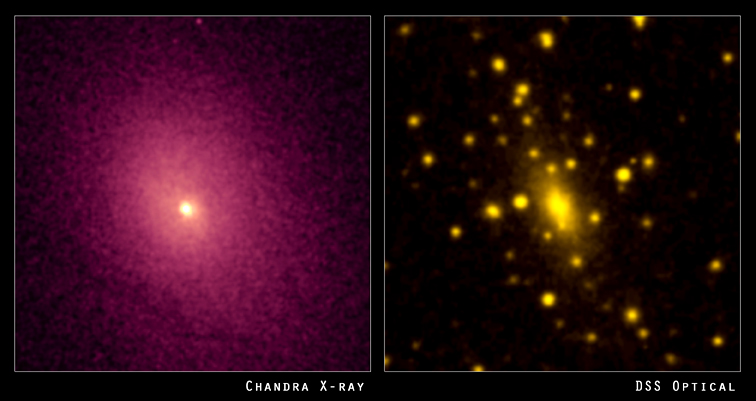
intracluster medium

Left: the distribution of hot gas between the galaxies in the cluster Abell 2029. Right: the visible light from the galaxies in the cluster. [X-ray: NASA/CXC/UCI/A.Lewis et al. Optical: Pal.Obs. DSS]

The solar wind is a tenuous, fast-moving, turbulent plasma that constantly streams out from the Sun. Studying the solar wind is important for understanding how potentially damaging space weather events like coronal mass ejections travel through the solar system. Solar wind studies also have far-reaching implications, since solar-wind-like plasmas exist throughout the universe, such as in the sparse medium between galaxies in a cluster.

Luckily, there are many spacecraft that sample the solar wind from various locations within our solar system. Unluckily, many of these spacecraft do not continuously monitor the solar wind. For example, when a spacecraft orbiting a planet dips into the planet’s atmosphere, this detour creates an hours-long gap in solar wind monitoring.

The Impact of Data Gaps

How do these data gaps affect studies of the solar wind? In a recent research article, Daniel Wrench and Tulasi Parashar (Victoria University of Wellington) approached this question in terms of how gaps affect the structure function: a mathematical description of how the solar wind fluctuates over different length or time scales.

Wrench and Parashar introduced random artificial gaps into data from the Parker Solar Probe, which monitors the solar wind continuously, and compared the structure functions calculated from the continuous and interrupted data sets. They used the difference between the true structure function — calculated from the continuous data set — and the structure functions from the artificially gapped data sets to develop a correction factor.

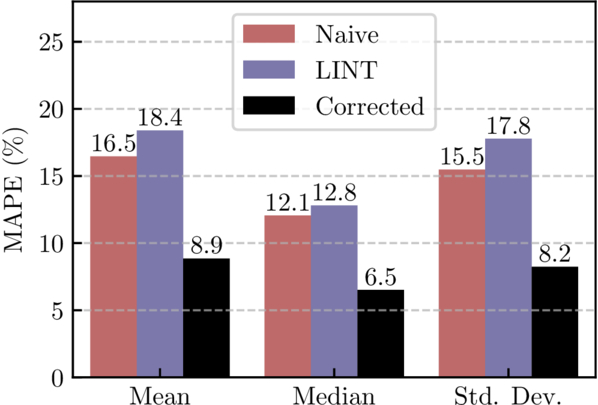
bar plot of correction method performance

Performance of the correction factor method (black) compared to the uncorrected, gapped data (red) or gaps filled using linear interpolation (blue). MAPE is the mean absolute percentage error. [Wrench & Parashar 2025]

The team then tested their correction factor using data from the Wind spacecraft, which continuously monitors the solar wind from the L1 Lagrange point. The team calculated the structure function from 1) the continuous data set, 2) the artificially gapped data, 3) the gapped data with linear interpolation used to fill the gaps, and 4) the gapped data with the correction factor applied. This test showed that the correction factor performs better than other commonly used gap-handling methods, such as linear interpolation, which can systematically underestimate the structure function. Using the correction factor, the error in the structure function remained below 50% even when 95% of the data were missing.
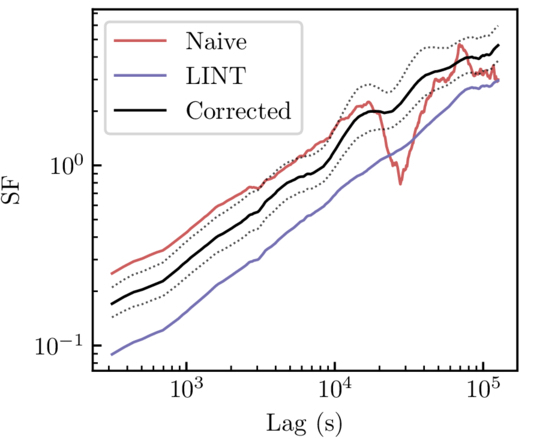
plot of structure function from Voyager 1 data

Structure function calculated from uncorrected Voyager 1 data (red), linearly interpolated data (blue), and corrected data (black). Both the linear interpolation method and the correction factor method remove the artifact around a lag of 3×10⁴ seconds, but the correction factor method does not suppress the signal like the linear interpolation method does. [Adapted from Wrench & Parashar 2025]

Correcting Voyager 1

Finally, the authors applied their validated method to data from Voyager 1. Data from the two Voyager spacecraft are extremely scientifically valuable — no other spacecraft have ventured as far from the Sun and can measure the solar wind at such large distances. The data are also extremely sparse; one segment used in this work was missing 85% of the data. This means that an effective method of correcting these data has potentially huge scientific significance.

Wrench and Parashar applied their correction factor to the Voyager 1 data, showing that this method handily removes artifacts while avoiding the underestimation introduced by linear interpolation. While the authors saved the interpretation of the newly corrected Voyager 1 data for future research, this study makes it clear that even large data gaps needn’t hinder studies of the solar wind.

Citation

“Debiasing Structure Function Estimates from Sparse Time Series of the Solar Wind: A Data-Driven Approach,” Daniel Wrench and Tulasi N. Parashar 2025 ApJ 987 28. doi:10.3847/1538-4357/addc6a

The post Minding the Gaps in Solar Wind Data appeared first on AAS Nova.

  •  

Jupiter Accelerates Electrons to Near-Light Speed, Offering Clues to Cosmic Ray Origins

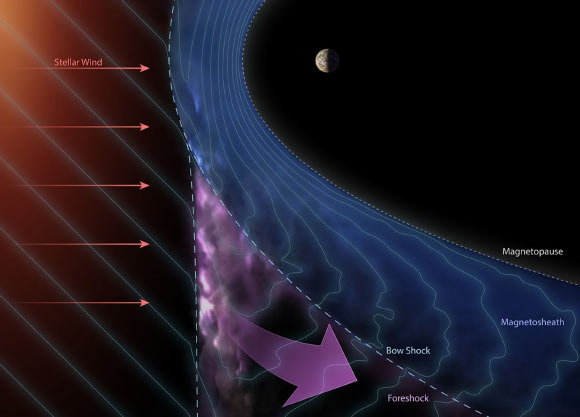
As planets and stars travel through the streams of charged particles flowing across space, their magnetic fields act like obstacles; incoming particles are slowed and deflected, forming a boundary called the bow shock; just ahead of this boundary lies the foreshock, a variable region where magnetic conditions can accelerate some particles to nearly the speed of light. Image credit: Ben C. Smith, Johns Hopkins Applied Physics Laboratory.

The giant planet’s bow shock isn’t just deflecting the solar wind, it’s acting as a powerful particle accelerator, firing electrons to relativistic energies of at least 1 MeV, according to a new analysis of data from NASA’s Juno spacecraft.

The post Jupiter Accelerates Electrons to Near-Light Speed, Offering Clues to Cosmic Ray Origins appeared first on Sci.News: Breaking Science News.

  •  

Astronomers Detect Clearest Signs Yet of Magnetic Fields on Extrasolar Planets

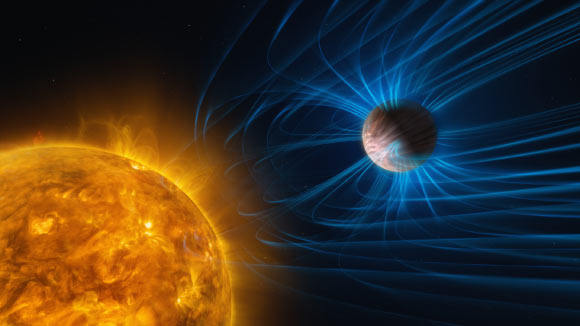
This illustration shows magnetic activity in an ultra-hot Jupiter. Image credit: ESO / M. Kornmesser / L. Calçada.

By tracking fierce winds racing through the atmospheres of seven ultra-hot Jupiters, astronomers have uncovered the strongest evidence yet that magnetic fields shape weather on worlds beyond our Solar System.

The post Astronomers Detect Clearest Signs Yet of Magnetic Fields on Extrasolar Planets appeared first on Sci.News: Breaking Science News.

  •  

Soaring solar and a surge in hydro push more coal off the US grid

Last year, the first few months of data from the US grid suggested that fears of a data-center-driven surge in demand were becoming a reality. Demand had risen by about 3 percent, triggering a surge in coal, interrupting what had been a long downward trend. But over the course of the year, both trends slowed considerably.

A year later, all of that seems to be in the past, as the US has returned to its normal pattern: slow growth, with renewables pushing coal off the grid. The one oddity is that hydroelectric production has surged without a corresponding increase in capacity, likely due to unusually warm weather in the western US causing the snowpack to melt early. That may have consequences later in the year.

Pushing fossil fuels out

Overall demand in the US grew by only 1.5 percent in the first quarter of 2026 compared to the same period the year before. Often, changes in demand during this part of the year are driven by weather-related heating demand. But the US had an unusual combination set of weather conditions to start 2026, with the western half baking in unseasonal warm temperatures, while the eastern half suffered a deep freeze. So we'll probably need data from more of the year before we read too much into the small rise in demand we've seen so far.

Read full article

Comments

© Getty Images

  •  
❌