Japan launches a ground-breaking mission to the Mars moon Phobos today, and you can watch live.
The JAXA (Japan Aerospace Exploration Agency) MMX (Martian Moons eXploration) mission aims to collect samples from Phobos, the larger of Mars’ two moons, and deliver it back to Earth for analysis. If successful, the samples could help solve long-standing mysteries about Mars’ moons, including their origin.
In 1877, US astronomer Asaph Hall discovered Phobos and its smaller sibling, Deimos. The moons have arguably the most bad-ass names in our solar system: Phobos comes from the ancient Greek word φόβος (phobos), meaning “fear,” and Deimos originates with the ancient Greek word Δεῖμος, which translates to “dread.”
Despite increased attention on Mars in recent decades, astronomers don’t know exactly how the celestial bodies formed. Theories include asteroids or debris leftovers from way back when the solar system formed about 4.5 billion years ago.
“The samples from MMX will bring forth paradigm-shifting science on the Mars system for generations to come, especially as NASA prepares to send the first humans to Mars,” said Nicky Fox, associate administrator and Science Mission Directorate at NASA, said in a statement. While a JAXA mission, NASA worked with the agency to provide instruments and technologies to assist.
The MMX spacecraft launches on top of an H3 rocket at Japan’s Tanegashima Space Center today at 3:41 p.m. EDT (4:41 a.m. Japan Standard Time on October 20). You can watch it live on JAXA’s YouTube page. The mission will get to Phobos in August 2027 and spend at least 16 months surveying the surface before collecting samples. The samples will not return to Earth until at least 2031.
Despite the name, the universe’s white dwarfs can glow in a wide range of colors—even green. For the first time, astronomers have spotted a star that appears green to the human eye, and the reddest ever recorded. These outlier stars help explain how certain white dwarf stars would shine in green, pink, cyan, yellow, and purple if we actually saw them up close in space. These colorful findings are described in a study recently published in the journal RAS Techniques and Instruments.
Looking for the ‘perfect radiator’
White dwarf stars are the dense remnants left behind after stars like our sun reach the end of their lifespan. For most stars, their color gives a hint to their temperature. Cooler stars appear orange, warm stars like our sun look white. The hottest glow pale blue, similar to how a blacksmith’s iron will go from red to orange to white hot. Astronomers believed that white dwarfs followed this same rule. They even earned their name after the earliest examples were surprisingly hot and glowed in a white/pale blue.
“Most stars, including most white dwarfs, behave like ‘perfect radiators,’ so their colour is set almost entirely by temperature. But nobody had really looked into what else might be possible for white dwarfs,” Mark Hollands, a study co-author and astronomer at the University of Warwick in England, said in a statement. “It turns out these incredibly dense stars can produce colours nobody expected, and some of them genuinely surprised me.”
According to the team, the key to these colors is density. The atmospheres surrounding the coolest white dwarfs can reach about the same density as water (roughly 1 gram per cubic centimeter). They are also millions of times denser than the sun’s photosphere, the lowest layer of its atmosphere. Under these higher density conditions, any trace elements present (carbon, calcium, sodium, etc.) interact with the surrounding dense helium plasma. As they interact with the plasma, they can absorb light across a wider spectrum of colors than they would at lower densities. This then shifts the star’s color away from the more typical orange, white, and blue.
Unfortunately, no white dwarf sky is close enough for its color to be seen directly. Instead, the team calculated their color from data astronomers routinely collect—a star’s spectrum. The spectrum is a “fingerprint” that’s produced when starlight splits apart by wavelength, similar to how a prism splits sunlight into a rainbow. Astronomers ran these spectra through a computer model of what colors human vision can see to check what color a star’s light would appear to our eyes.
Color-accurate simulated images of white dwarfs. Top Left panels: Sirius B is the nearest white dwarf to the Solar System, with a hot hydrogen atmosphere, resulting in a pale blue colour. WDJ1147-7449 is instead among the coolest nearby white dwarfs, giving it a featureless spectrum and an orange appearance. Top Right panels: Convective envelopes in these cool white dwarfs have dredged up carbon from their cores into their dense helium-dominated atmospheres, forming diatomic carbon molecules that lead to various pink hues. Bottom panels: Accretion of rocky debris from the white dwarf planetary systems enriches their cool helium atmospheres with elements such as calcium, magnesium, and sodium. The varying amounts/compositions of accreted material and white dwarf temperatures allow for a diverse array of colours, including green. In reality all stars would be many millions of times brighter than what can be shown on-screen. Image: Mark Hollands/University of Warwick
The first green and the reddest red
The team applied this method to several white dwarfs across the cosmos. They found that their colors fall into distinct groups linked to what makes up a star’s atmosphere. Carbon-rich white dwarfs generally appear pink or purple. Stars enriched with debris from busted asteroids and comets, the remains of old planetary systems, tend to be more yellow. Cooler white dwarfs with atmospheres of mixed hydrogen and helium show a more cyan or pale blue tinge. This cyan-pale blue is caused by hydrogen molecules colliding with helium atoms inside their ultra-dense atmospheres.
The most striking example is WD J1330+6435. This star is about 7,232 degrees Fahrenheit (4,000 degrees Celsius) and around 284 light-years away from Earth. Over time, it has gathered rocky material from its planetary system. All of this extra material enriched its atmosphere with calcium, lithium, and sodium. The result—a chartreuse green appearance in the team’s models. As far as the researchers are aware, no other star (living or dead) has ever been credibly reported as green.
Enriched from above: The cool white dwarf WDJ1330+6435 has accreted sodium-rich rocky material from its planetary system into its atmosphere. The immense atmospheric density causes the sodium to absorb light over broad range of yellow, orange, and red wavelengths, giving the WDJ1330+6435 a ghostly green appearance. Image: Mark A Garlick/University of Warwick.
“The traces of sodium in the atmosphere of this white dwarf absorb the orange part of the spectrum, leaving behind a ghostly green glow,” added Hollands. “Imagine standing on a planet and looking up at a green star. It feels like something out of science fiction.”
On the opposite end of the spectrum, the team identified what could be the reddest star ever recorded—WD J1011+2845. This white dwarf is only 48 light-years away from Earth, and has a deep convection zone. This zone is full of carbon that’s been lifted up from the star’s core to its surface. The carbon molecules then distort the star’s light so much that almost all of it is squeezed into wavelengths beyond 600 nanometres. This wavelength produces an unusual deep salmon-pink glow.
Enriched from below: The cool white dwarf WDJ0902+2010 has a deep convection zone within its helium dominated outer envelope. The convection zone has reached the white dwarf core, lifting interior carbon to the surface, and forming carbon molecules. These C2 molecules strongly absorb light across the optical range, including blue, green, and yellow wavelengths, resulting in WDJ0902+2010 appearing pink to the human eye. Image: Mark A. Garlick/University of Warwick.
What are the odds?
The team also studied 151 white dwarfs located within about 65 light-years (20 parsecs) from Earth. Only five of these showed unusual colors, two yellow and three pink. This suggests that about 1 in 30 of the universe’s white dwarfs shine with an unusually colored light.
The team then measured the color temperature of the remaining 146 white dwarfs. Color temperature is commonly used to describe light bulbs using degrees Kelvin—warm white at 3,000K, cool white at 6,000 K, etc. The median color temperature of the sample was approximately 6,800K, which our eyes perceive as white. This measurement corrects a common misconception that white dwarfs are typically blue. The hotter and bluer white dwarfs are mostly brighter, so they can be seen from further away and are over-represented in surveys that only look at a star’s brightness.
“One in thirty might not sound like a huge fraction, but across the entire population of white dwarfs in the Universe, that is still a lot of oddly coloured stars out there,” added study co-author and University of Warwick astronomer Boris Gänsicke. “Yet if we take the median across a representative population of white dwarfs, we found that the average white dwarf really is white.”
It’s true, the moon is shrinking. And astronomers now know how fast it’s contracting. While only satellite observations and the most delicate instruments can detect these shifts, the consequences of this shrinkage means moonquakes can occur anywhere on the lunar surface at a moment’s notice.
A team led by Smithsonian National Air and Space Museum planetary geologist Thomas Watters detailed their findings in a study recently published in The Planetary Science Journal. Researchers used data from NASA’s Lunar Reconnaissance Orbiter Camera (LROC), which has spent over 17 years generating millions of images of the moon’s surface. A shriveling lunar landscape may sound dramatic, but it’s occurring at a glacial pace. Based on these new calculations, the moon’s overall radius has decreased nearly 148 feet over the last 400–800 million years as it continues to cool. That’s about 2.4 to 4.3 inches per million years, or just 0.1 micrometer annually.
Although slow, the incremental activity’s effects are visible everywhere. On Earth, about 90 percent of all seismic activity occurs near the boundaries between lithospheric plates. But unlike its host planet, our moon is encased by a single, shell-like plate. This means interior cooling can generate slips and faults anywhere at any given time. After reviewing images taken by the LROC, the study’s authors tallied over 10,000 visible lunar faults.
“The number of these young faults revealed in LROC images is much greater than I ever imagined,” said Watters. “As the interior of the moon continues to cool and contract, it is expected that the growth of existing faults and formation of new faults continues today.”
While the faults can happen anywhere, some lunar regions are more likely than others to feature them. Areas with the thickest crust have fewer faults, which indicates they may be more stable than other, thinner sections. In addition to better understanding lunar history, the distribution and frequency of moonquakes may also help NASA better plan for a long-term human presence on the moon.
NASA’s Perseverance Mars rover has officially traveled 28.10 miles—farther across another planet’s surface than any other vehicle in history. Not only that, but the six-wheeled science lab accomplished this impressive feat almost entirely autonomously and in barely a third the time it took the previous recordholder.
“The original mission called for no more than 12.4 miles of driving. We’ve blown well past that,” Steven Lee, Perseverance and Curiosity project manager at NASA’s Jet Propulsion Laboratory, said in a statement.
Perseverance began operations on Mars on February 18, 2021, after landing in an ancient river delta selected for potential past microbial life called Jezero Crater. Since then, the rover has slowly but steadily made its way across the region, while conducting multiple sediment drilling surveys. These samples are then chemically analyzed using onboard laboratory equipment before the results are sent back to mission specialists at NASA.
Perseverance surpassed the previous travel record of 28.06 miles set by NASA’s Opportunity rover, before its communications with NASA ended on June 10, 2018. However, it took Opportunity nearly 15 years to accrue its distance while Perseverance exceeded the same mileage in less than six years, and on the 2,006th Martian day (sol) of its mission. Perseverance is currently traveling towards an area named Idubi through an expanse nicknamed “Lac de Charmes.” The region near Jezero Crater’s western rim hosts what may be the oldest landscape ever investigated in the solar system. Mars does not feature tectonic plates like Earth, which means its terrain is never eroded and subsumed into the planet’s substrates.
Mission engineers have not spent the last six years remotely steering Perseverance, either. The rover arrived on Mars equipped with a self-piloting system called AutoNav, which constructs 3D maps of the immediate surroundings to flag any potential hazards. AutoNav then charts a route between specific waypoints chosen by NASA specialists back home. Perseverance has completed 90 percent of its total excursion with AutoNav. Opportunity and its sibling rover, Spirit, only relied on a first version of the piloting system about five percent of the time.
Perseverance has a long road ahead of it, if all goes according to plan. In October, NASA approved the first mission extension that will continue the rover’s operations through about the end of 2028.
“With all mobility systems fully operational and favorable extended-ground-life test results, we expect Perseverance to keep adding to this record for many years to come,” added Lee.
Successfully sending Artemis II astronauts on their historic lunar flyby earlier this year required some of the latest and most precise technologies, but not everything in this mission needed the same intense equipment. As crewmates gazed through Orion’s capsule window at the moon’s eclipse of the sun on April 6, 2026, three of the travelers needed a way to easily sketch some of their preliminary observations. They took turns writing their notes on a shared tablet PC—and NASA has recently highlighted their work with a screenshot of their efforts.
Astronauts Reid Wiseman, Victor Glover, Christina Koch, and Jeremy Hansen had a lengthy list of tasks during their 10-day, 700,000-mile roundtrip. One of the most visually dramatic jobs involved carefully assessing lunar activity while passing across the moon’s dark side from a distance of about 46,000 miles away. The roughly hour-long observation period provided astronauts with an unprecedented opportunity to record meteorite activity.
A visualization of a dark Moon eclipsing the Sun is marked with handwritten notes in this April 6, 2026, screenshot from an Artemis II crew member’s tablet. Credit: NASA
The tablet screenshot includes notes taken by Wisemen (in blue), Hansen (in red), and Glover (in green) during the moon’s eclipse of the sun. The crew collectively spotted at least five faint flashes of light caused by impacts. According to Wiseman, the first three impacts occurred within about 10 minutes into their observations, while another two happened later during the flyby. Impacts two and four were likely also corroborated by Hansen and Glover.
Since the moon does not have an atmosphere like Earth’s, the lunar surface is regularly bombarded by space rocks. Most of them are comparatively small, but they will still pose a problem for future crewed trips to the surface,especially those stationed in a planned permanent lunar base. The data gathered by Artemis II on April 6 will help NASA better understand these dynamics, and plan for the safest environments possible for their astronauts.
Artemis II’s astronauts safely returned to Earth during a splashdown off the coast of San Diego at 8:07 p.m. EDT on April 11. If all goes as planned, Artemis III’s crew will launch on their mission no earlier than June 2027.
If a train leaves the station in Exeter, England, headed south toward Newton Abbot five years before the railway line opens, how long until anyone figures out that it didn’t happen? Well, evidently about 155 years. A report on magnetic storms, published in Nature in 1871, described an incident thought to be the earliest recordedContinue reading "Case closed on long-standing space weather mystery"
Oracle's Wisconsin AI datacenter could miss its planned 2027 start date because the transmission infrastructure needed to power it is awaiting regulatory approval. Research company Aterio warns that Project Lighthouse, being developed by Vantage in Port Washington with Oracle as tenant, faces a real risk of slipping beyond Big Red's target of delivering capacity to customers in the second half of next year. Separately, Oracle reportedly sent a force majeure notice to a Blue Owl Capital subsidiary developing Project Jupiter in New Mexico. Bloomberg reported that Oracle was seeking to defer payments if the campus failed to come online as planned, rather than withdraw from the project. Oracle says the development remains on schedule. Aterio said of this and the Wisconsin facility: "The regulatory record points to the potential for dates later than company guidance, and Oracle's stretched finances, together with its force majeure notice on Project Jupiter in New Mexico this week, raise the potential for slippage on its largest campuses." Oracle has been offered the opportunity to comment. The Register has already reported that Oracle could face more than $100 million a year in financing costs to guarantee the power commitments behind the Wisconsin datacenter campus, which is rated at 902 MW of computing load and 1.3 GW of total electricity demand. The immediate obstacle is American Transmission Company's (ATC) application to the Public Service Commission of Wisconsin (PSC) for approval to build the campus's grid connection. ATC is planning more than $2 billion in transmission infrastructure projects tied to datacenter developments across Wisconsin, ranging from high-voltage power lines and substations to upgrades to existing facilities. Construction of the transmission infrastructure requires PSC approval. "The problem is power. The campus cannot run until ATC connects it to the grid, and ATC cannot start building until the PSC approves its application," Aterio said. The PSC closed the original case after withdrawing its finding that ATC's application was complete. ATC refiled in September, restarting the approval process. Aterio's earliest scenario puts partial power in October 2027 and full supply in August 2028, although it considers that timetable highly unlikely. Its base case puts partial power in December 2027 and full supply in October 2028. An extended regulatory review could push those dates to June 2028 and April 2029. Even December 2027 power delivery would leave little room for testing and commissioning before Oracle's deadline. "In practice, a datacenter does not enter service as soon as first grid power arrives. Each building's electrical and cooling systems have to be energized, tested and commissioned before it can carry customer load. That will take time. We therefore expect the campus's load to ramp up mainly from the first quarter of 2028," Aterio said. Meanwhile, the Financial Times reported that Tencent had signed a $7 billion deal to lease around 100,000 AI processors from Oracle. For context, Oracle reported $55.7 billion in total capital expenditures for its fiscal 2026, which closed at the end of May. Its total revenue was $67.4 billion. Capex guidance for the 2027 financial year is up to $95 billion. ®
Amazon Web Services has debuted an agent that it says will evaluate your cloudy environment “as an experienced cloud architect would” and recommend useful changes. The cloud colossus named its bot the “AWS Well-Architected Agent,” a nod to the Well-Architected Framework that outlines best practices for using the Amazonian cloud. Amazon’s announcement says the agentic incarnation of the Framework analyzes AWS environments “against Well-Architected best practices across 65+ AWS services” and then delivers “targeted, contextual recommendations for improving your applications’ cost, security, performance, and resilience.” “It generates recommendations aligned to your declared business goals, delivers implementation packages with every finding, and surfaces cross-pillar trade-offs making it simpler to remediate the findings,” we’re told. The agent also delivers “ready-to-implement fixes” and “provides individual resource findings with specific dollar impact (where applicable) and step-by-step remediation, consolidated findings across multiple resources scoped to your application, and broad architectural patterns and designs with Infrastructure as Code (IaC) code changes needed to align with Well-Architected best practices.” AWS offers myriad services — some of them with overlapping features and functions. Customers often find themselves using more services than they intended, or using services that aren’t quite right for their intended use. AWS is generally happy if customers change to more appropriate services, even when that sees them spend less, and offers assistance from its own staff or channel partners to make it happen. This agent may make some of that human assistance less necessary. AWS is far from alone in suggesting agents should take on some of the chores that human IT professionals perform today - an approach that’s come to be known as AIOps. When your correspondent chats to IT pros about AIOps, they express distrust on grounds that they cannot be sure agents make valid suggestions and feel following bad advice offered by a machine would indefensible if things go pear-shaped. Vendors I’ve spoken to believe IT pros will first cautiously verify recommendations from AIOps systems, and if they see good results allow agents to take more actions without human oversight - but always with the ability to quickly roll back changes. AWS seems to recognize that users won’t go all-in immediately and therefore offers several manual means to apply recommendations the agent suggests, including the command line interface. For now, the agent is available in the US East (N. Virginia), US East (Ohio), and US West (Oregon) regions, but can handle workloads from any AWS commercial Region. It’s only available for users with an AWS support plan. ®
Microsoft has advised users of its ExpressRoute Gateway, VPN Gateway, and Azure VMware service that they may experience degraded or interrupted network connectivity, and struggle to perform some network management operations. This looks like a self-inflicted wound because Microsoft’s status page says it has “paused the infrastructure servicing activity associated with the onset of this event.” The event started at 20:30 UTC on 30 September 2026. ExpressRoute Gateway is a service that connects on-prem networks to virtual networks in Azure, making it an important element of a hybrid cloud. Azure VPN Gateway creates a secure tunnel between on-prem infrastructure and Azure. Microsoft pitches its Azure VMware Service as an ideal way to build a hybrid cloud on VMware. This incident is therefore likely to make life hard for Microsoft’s hybrid cloud customers. At the time of writing, the incident impacts 18 Azure regions: West US, West US 3, North Europe, West Europe, France Central, UK West, UK South, Switzerland North, Southeast Asia, East Asia, Japan West, Korea Central, South Africa North, UAE North, Mexico Central, Germany North, South India, and Jio India Central. The Azure VMware service isn’t impacted in the last four of those regions. As of 23:13 UTC, Microsoft says it is “seeing continued recovery across impacted ExpressRoute gateways and are monitoring this recovery to confirm that it remains durable.” The company also advised that some affected VPN Gateways have experienced reduced redundancy rather than a complete loss of connectivity. “Some supporting network management components have not recovered automatically and are contributing to management operation failures in a subset of affected regions,” the update adds. “Engineering teams are actively restoring these components using alternate healthy instances where available.” Microsoft doesn’t know what happened, or why, but says its investigation “continues to show a correlation between this event and infrastructure operating system servicing activity.” The Register will update this story as Microsoft releases more information. ® UPDATED AT O3:30 UTC, OCTOBER 1 To add that Microsoft says it has mitigatged the incident, in a status update which also mentions more products – the Azure Firewall, Application Gateways, and Web Application Firewall – as being impacted. Redmond has promised to release more info, too.
The continuation of AI chatbots arriving in CarPlay, Apple’s opt-in approach to using customer data for AI training, and turmoil surrounding WordPress leadership are the topics for this MacVoices Live! discussion. The conversation also examines Bending Spoons’ latest billion-dollar acquisition, Apple’s international iCloud+ bundles, the potential for services to expand Apple’s global ecosystem, and Michael Dell’s support for new youth investment accounts.
Detective work by a team of space-weather experts has discovered the truth about a historical event that had been thought to be the first-ever case of technological disruption by geomagnetic activity from the sun, but has now been shown to have taken place seven years later.
From it being too hot or too wet to leaves on the track or cows on the line, there's a fine tradition of what the British public consider to be flimsy excuses for delays on the trains. Yet an 1871 edition of the journal Nature describes a very different event that caused a train departing Exeter, in Devon on the south-west coast of the U.K., to be delayed by 16 minutes: a solar storm that flooded the railway signals' electrical telegraph network with current.
"The Exeter train delay is a fascinating story because it sits right at the point where emerging technologies first began to encounter the realities of the space environment," said Jim Wild, who is a professor of space physics at Lancaster University and also the President of the Royal Astronomical Society, in a statement.
The event has frequently been cited as the first example of a solar storm disrupting technology on Earth, but when a team led by Wild went back through historical records to investigate further, they found that things didn't add up.
The original report in Nature stated that the electrical disturbance occurred at 10:05pm local time on Oct. 18, 1841. However, Wild's team found that particular train line didn't open until 1846.
So, they delved deeper into the history books to figure out the truth.
"Our research has a hint of a detective story — piecing together a wide range of archived records to better understand a historically severe space-weather event," said team-member Mike Hapgood, a space weather expert at RAL Space, which is the UK's National Space Laboratory, in Oxfordshire.
Combining data from railway timetables, old newspapers, plus historic reports of solar observations and the northern lights and digitized geomagnetic data, Wild and Hapgood's team were able to conclude that the most likely date for the train delay was Oct. 18, 1848, which coincided with a strong solar storm that hit Earth.
This revised date knocks it off top spot in the chronological list of such events. The first recorded disruption to electrical technologies is now a disturbance on the Midland railway network, which had lines covering much of the U.K., in March 1847.
"Although this means it is not the earliest recorded space weather impact, it remains one of the first clear examples of solar activity disrupting critical infrastructure," Wild said. "It also demonstrates the value of combining scientific records with contemporary newspaper reports and archival documents when reconstructing historic space weather events."
Solar storms have been playing havoc with electrical technology on Earth since the 1840s. (Image credit: NASA/SDO)
The case reminds us that space weather has been a hazard to technology and modern systems for a long time, and isn't just a recent problem.
"Society has been experiencing the effects of space weather on technology for almost as long as electrical technologies have existed," said Wild.
The most dramatic example is the aforementioned Carrington event of 1859, representing the most significant solar storm on record as it caused telegraph poles to spark and battery power supplies to be disrupted. By this point, telegraph operators had grown used to electrical disturbances associated with auroral activity, but even the Carrington storm shocked them — quite literally in some cases, as extra current ran down the telegraph lines — with its ferocity. Should a similar event occur today, it would cause huge black outs, knock out power grids, disrupt communications and fry satellites.
"While today's space weather [monitoring] capabilities are far more advanced than anything available in the 1800s, the modern technologies we depend on are also much more vulnerable to solar storms," said Hapgood.
The current solar cycle 25 peaked in Oct. 2024 and we are just beginning to come out of an extended period of maximum activity. However, it remains to be seen how the rest of this cycle will play out before reaching solar minimum in about 2030. We've already seen severe geomagnetic storms caused by space weather in May 2024 — will we experience another powerful storm before the decade is out?
Although the famous Carrington Event of 1859 is often described as the first major space weather event to affect technology, earlier incidents did occur. Historical records show that telegraph systems were disrupted by geomagnetic storms as early as the late 1840s.
iPhone 18 Pro is at the center of What Holds Us, a new photography exhibition built around three very different approaches to image-making. Alex Prager, Jack Davison, and Jimmy Chin shot the entire project on Apple’s latest Pro iPhone, using the device in environments ranging from a Los Angeles soundstage to a London warehouse and the high-altitude terrain of British Columbia.
Curated by Kathy Ryan, the former longtime director of photography for The New York Times Magazine, the exhibition examines connection through touch, shared experience, physical environments, and human relationships.
It also gives Apple a more ambitious showcase for the iPhone 18 Pro camera than a conventional product demonstration. Rather than presenting standardized comparisons or individual sample images. What Holds Us asks three established photographers to work within their own visual languages while using the phone as their sole camera.
The exhibition opens in New York City on September 18 and runs through September 20 before traveling to London and Shanghai in the coming months.
Image Credit: Apple Inc.
iPhone 18 Pro takes three very different photographic approaches
The project works partly because the three photographers have little stylistically in common.
Jimmy Chin took iPhone 18 Pro into the Bugaboo Mountains of southeastern British Columbia, working around snow, ice, steep climbing terrain, and winds reaching as high as 70 miles per hour.
His series focuses on trust and connection within climbing, with veteran mountaineer Conrad Anker appearing throughout the photographs. Some images place Anker as a small figure against vast mountain landscapes, while others move much closer to rock, snow, and glacial textures.
Chin used both the 48MP Fusion Ultra Wide and Telephoto cameras to shift between those extremes. The practical appeal was also straightforward: carrying a phone instead of a full conventional camera setup reduced the equipment required in an environment where weight and mobility affect every decision.
Jack Davison took almost the opposite approach. Shooting inside a former sugar warehouse in London, he created intimate portraits built around people interacting with clay and chalk.
Davison is known for high-contrast black-and-white imagery, and his contribution emphasizes texture, shadows, highlights, skin, and physical contact with the material. Some subjects appear partly covered in clay, while others manipulate it directly, leaving fingerprints and marks across the compositions.
For Davison, the smaller camera changed the relationship between photographer and subject. Without a large camera constantly positioned in front of his face, he could maintain more eye contact and work at closer range.
His use of slower shutter speeds, RAW capture, and multiple lenses also illustrates how Apple increasingly wants the Pro iPhone camera to function as a configurable photographic tool rather than simply a computational point-and-shoot system.
Alex Prager pushes the phone into large-scale production
Alex Prager’s section places iPhone 18 Pro inside a much more elaborate production environment.
Working on a Los Angeles soundstage, Prager created color-heavy scenes filled with crowds, confetti, staged city elements, costumes, and loosely choreographed movement. Some images use high viewpoints to turn groups of people into a continuous visual pattern, while tighter photographs isolate individual figures within the same constructed world.
The visual approach resembles film production more than spontaneous mobile photography, which gives the project another test for the phone. The camera has to preserve detail across numerous faces, costumes, props, highlights, and areas of movement while operating within scenes deliberately designed for large-format presentation.
Prager also treated the camera’s immediacy as part of the creative process rather than simply a convenience. The ease of moving between perspectives and capturing repeated moments allowed the scenes to evolve through improvisation instead of being locked into a single carefully prepared frame.
That approach aligns with a recurring theme across the exhibition: the phone becomes less intrusive without requiring the photographers to abandon their existing visual standards.
For Apple, it is a useful distinction. Professional photography campaigns built around smartphones can easily become exercises in technical proof, where the central question is whether a phone can imitate equipment already available to photographers. What Holds Us is more interested in how a smaller camera changes the way an artist works.
Image Credit: Apple Inc.
Variable aperture gives the project a new technical foundation
The exhibition arrives alongside one of Apple’s most significant physical camera changes in years.
iPhone 18 Pro introduces variable aperture on its 48MP Fusion Main camera. The lens can operate at ƒ/1.48, ƒ/1.8, ƒ/2.8, or ƒ/4.0, changing both light intake and depth of field.
A wider ƒ/1.48 aperture is designed for stronger low-light performance, while narrower settings can retain more detail across different planes of an image. Apple also lets photographers select aperture settings manually through new Pro controls in the Camera app.
Those controls extend to shutter speed and white balance, with a histogram available for monitoring exposure. ProRAW remains available for photographers who want greater flexibility during post-production.
The rear camera system also includes 48MP Fusion Ultra Wide and 48MP Fusion Telephoto cameras, providing focal lengths from 13mm at the wide end through an optical-quality 8x option.
What Holds Us does not reduce the exhibition to those specifications, but the technical changes help explain why Apple chose photography, rather than video, for this particular campaign. Variable aperture affects choices that photographers traditionally make during capture, especially around available light and how much of a scene remains in focus.
What Holds Us extends the Shot on iPhone idea
Apple has spent years using Shot on iPhone campaigns to demonstrate camera quality through finished work rather than charts and controlled tests. What Holds Us pushes that format closer to a conventional curated exhibition.
Ryan connects the three bodies of work through the idea of human presence, but each artist interprets it differently. Chin finds it through dependence between climbers in hostile landscapes. Davison uses physical contact between people and clay. Prager builds populated fictional environments in which individual expressions emerge from larger crowds.
The images therefore function as an exhibition first and a hardware showcase second, even though the production is closely tied to the launch of iPhone 18 Pro.
That balance may be the most effective part of the campaign. Apple does not need to demonstrate that a modern iPhone can produce a technically competent photograph. The more interesting challenge is showing where its smaller size, computational processing, lens flexibility, RAW workflow, and new manual controls can alter the photographer’s decisions.
New York visitors will get the first opportunity to see how those images hold up away from a phone or computer display when What Holds Us opens September 18. After its three-day New York run, Apple says the exhibition will continue to London and Shanghai, giving the iPhone 18 Pro photography project a physical life beyond the launch campaign.
A zoomed-in view of the Moon made from images from NASA’s Lunar Reconnaissance Orbiter Camera. (More information at the bottom of article.)
Credits: NASA Goddard/Intuitive Machines/Robert Wagner
It started as a routine data-quality check. But as Robert Wagner, a scientist with NASA’s Lunar Reconnaissance Orbiter (LRO), scanned a giant Moon map on his computer screen, an unusually large bright spot circled by a dark halo caught his eye, as it implied that surface material in that area had been shaken up.
“I just stopped, dropped everything, and started looking into what that spot was,” said Wagner, an image-processing specialist from Intuitive Machines who works with data from the Lunar Reconnaissance Orbiter Camera (LROC) system.
By comparing before and after images of the Moon, Wagner realized he had discovered the largest, newly formed crater ever found in the solar system, as scientists reported Wednesday in Science Advances. This discovery highlights the value of NASA’s Moon orbiter data in studying a dynamic landscape as the agency advances a sustained human presence and expanded scientific and commercial activity on the Moon.
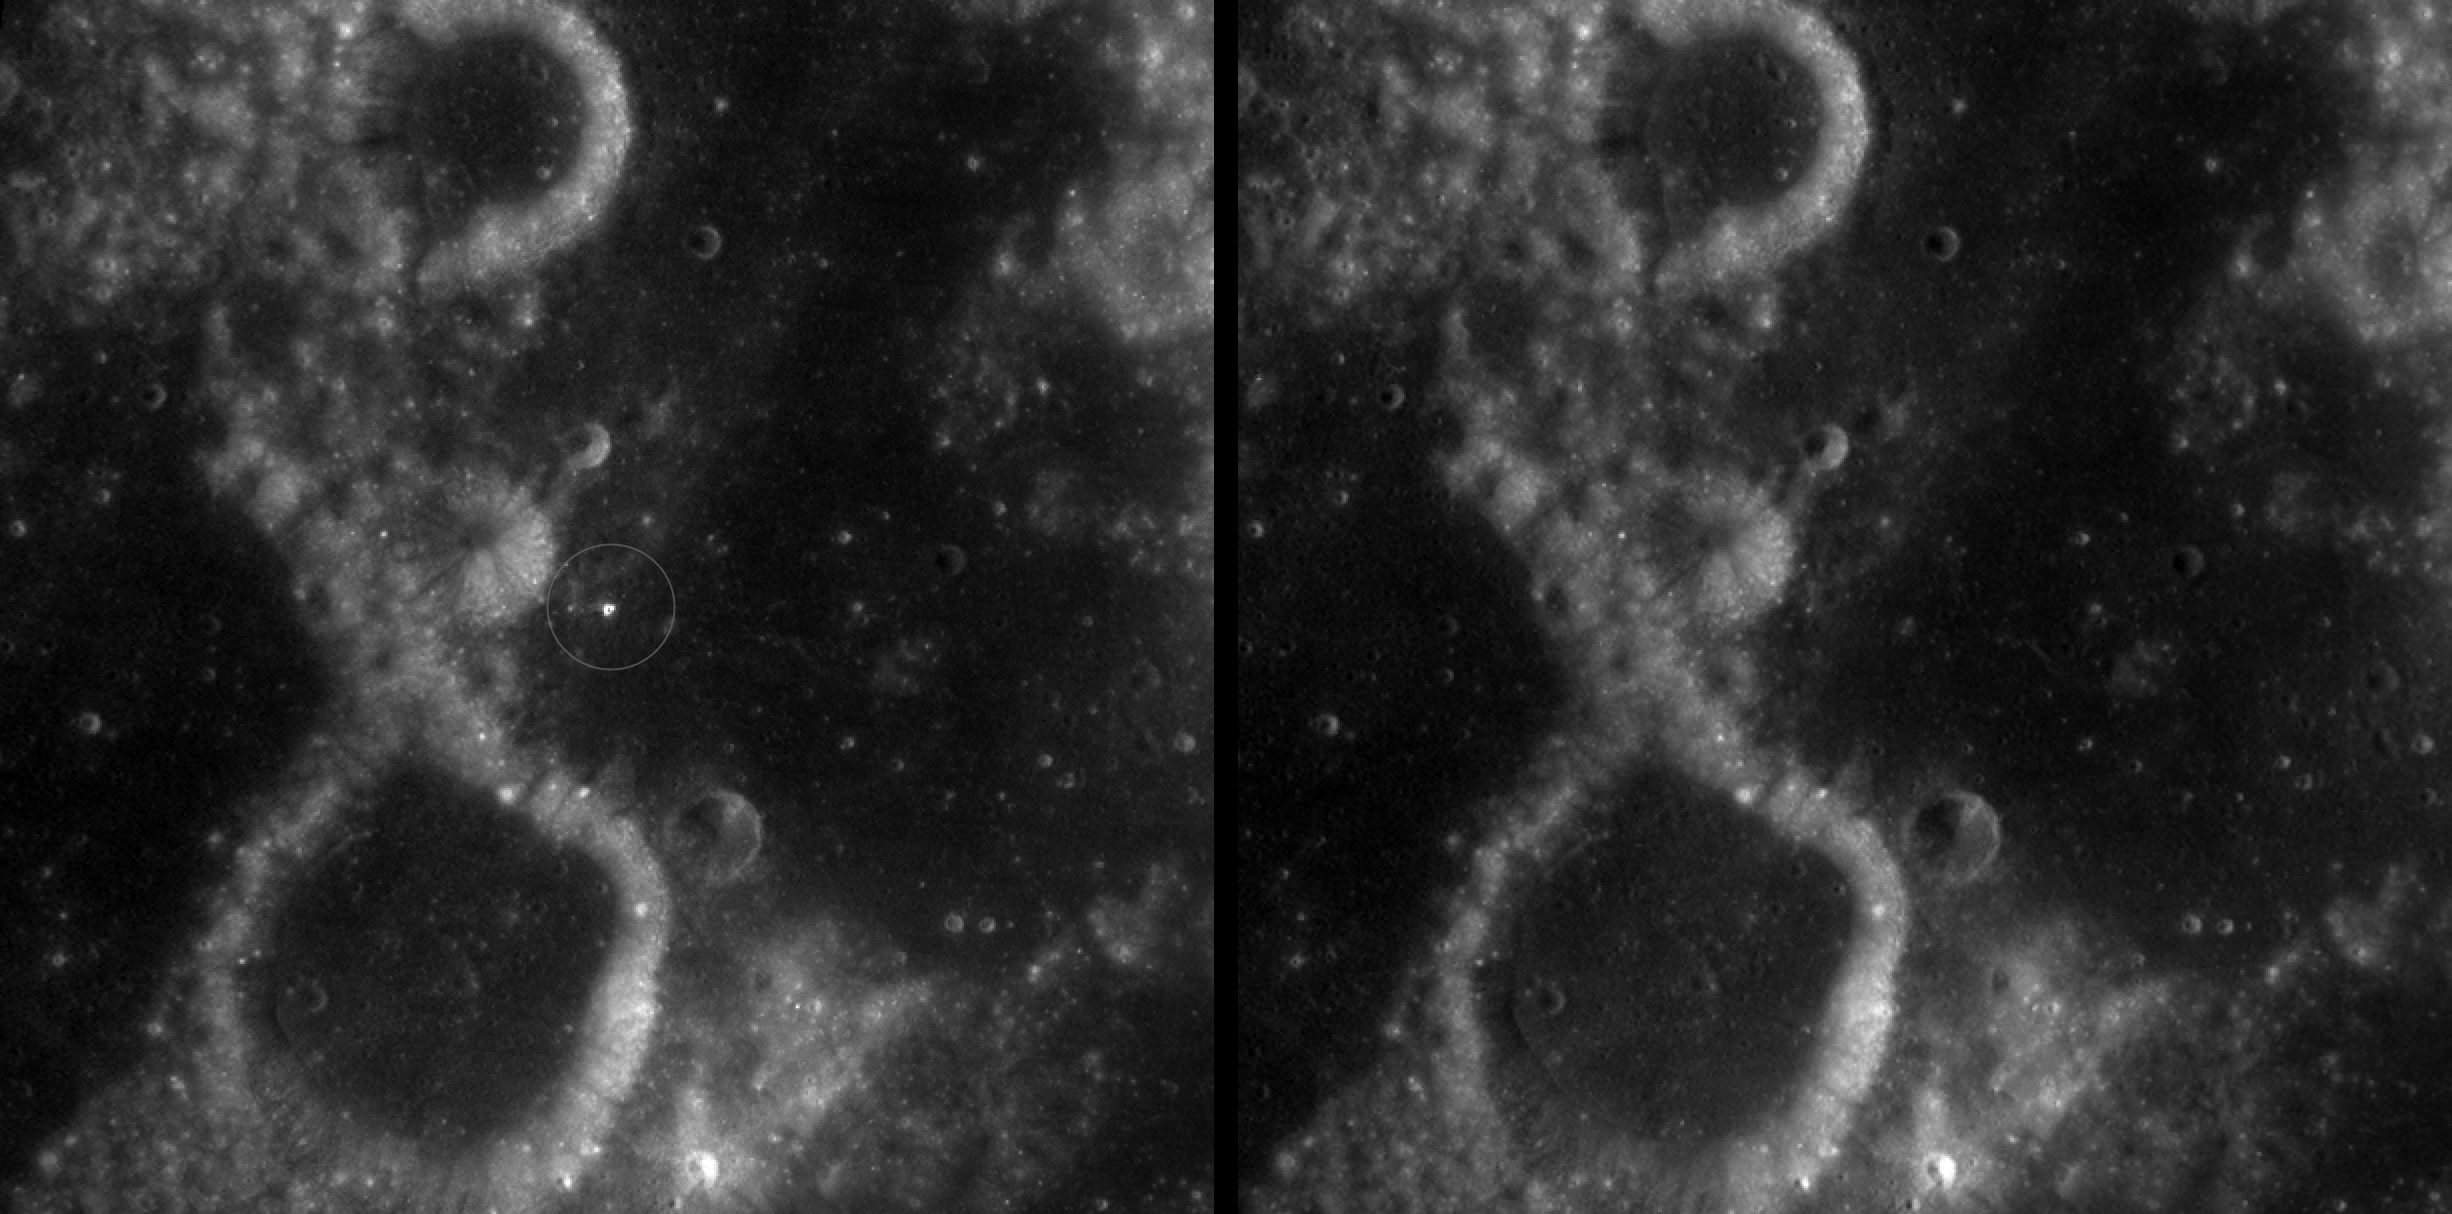
A zoomed-in view of McGetchin crater, circled on the left, next to a “before” image on the right. The panel on the left is made from images captured by NASA’s Lunar Reconnaissance Orbiter Wide-Angle Camera in summer 2025; the right panel was made from images taken in spring 2011. The white spot is not the crater itself, but rather material flung out of the crater, which formed when a rock, possibly this size of a three- to six‑story building, crashed into the Moon between April 11 and May 22, 2024 – a once-in-a-century event, as scientists reported on Sept. 15, 2026, in a pair of papers in Science Advances. The area shown in the images is 38 miles wide.
NASA Goddard/Intuitive Machines/Robert Wagner
Officially named McGetchin after pioneering lunar scientist Tom McGetchin, the crater formed on the Moon’s eastern edge sometime between April 11 and May 22, 2024, after a comet or asteroid the size of a three- to six-story building hit the surface.
The crash left a crater, 728 feet wide, that spans the length of two football fields. And at 141 feet deep, the crater could fit three vertically stacked yellow school buses.
Scientists estimate that an impact of this magnitude happens on the Moon about once in a century or even longer.
Moon takes some hits
For more than 17 years, LRO has been circling the Moon and using its seven instruments to map the topography, surface composition, temperature, and radiation environment there. The spacecraft’s team has identified at least 1,000 new impact craters throughout the mission and flagged 100,000 more surface changes from an object smashing into the Moon or from the debris that flung out after.
With no atmosphere to slow them or burn them up, space rocks and other objects easily reach the lunar surface. Most are much smaller compared to the object that carved out McGetchin crater. The smallest craters scientists can distinguish from LRO images are about 30 feet wide, the length of a three-story building laid on its side, made by rocks about 43 inches wide, the size of a monster-truck tire. Scientists estimate that impacts of this scale produce about 140 new craters across the Moon each year. But most new ones are made by microscopic projectiles that leave holes too small to identify in orbital images.
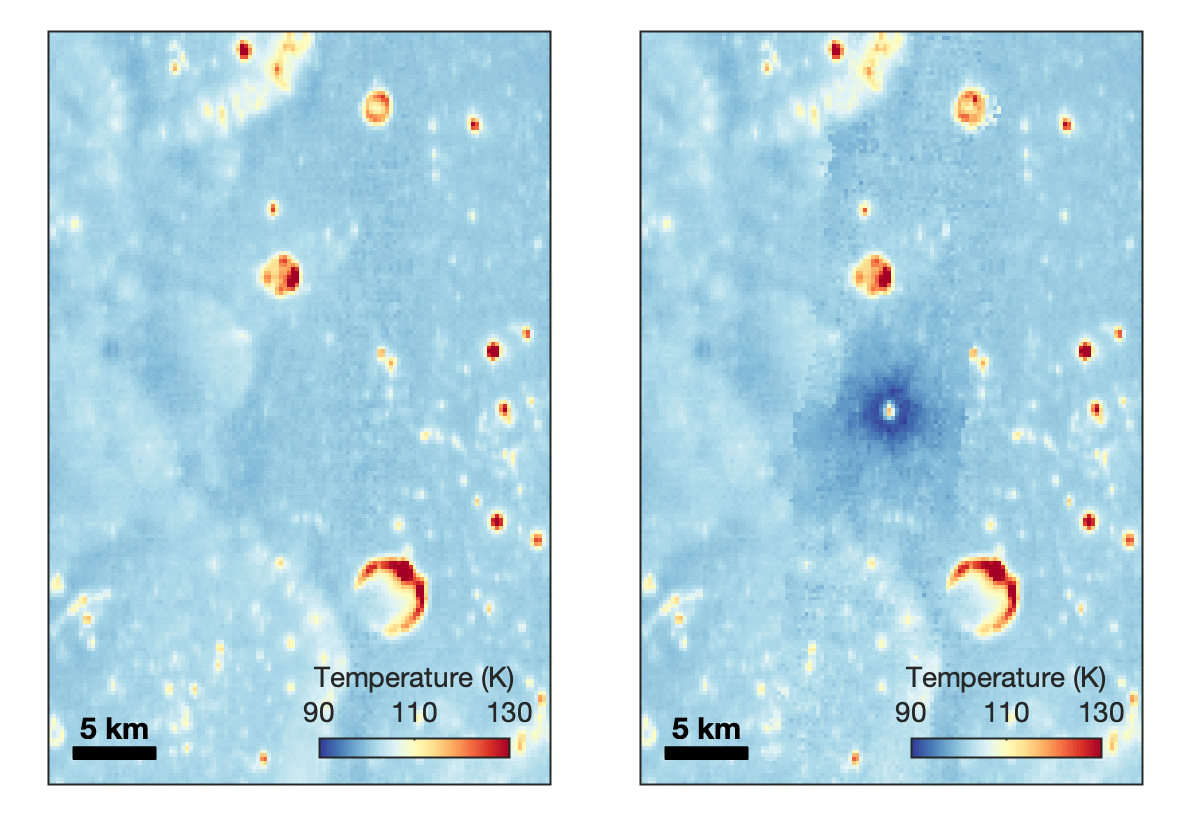
With its numerous instruments, the spacecraft can observe changes to the lunar surface that aren’t apparent in the LROC images alone. After the crater was discovered, scientists working with LRO’s thermal instrument, Diviner, made follow-up observations of the site. They found a 4-mile-wide area around the crater that is about 16 degrees Fahrenheit cooler at night than its surroundings.
This animated image set shows an area on the eastern limb of the Moon before and after McGetchin crater formed there sometime between April 11 and May 22, 2024. The post-impact image was constructed using data taken by NASA’s Lunar Reconnaissance Orbiter (LRO) thermal instrument, Diviner, between Nov. 15, 2025, and Feb. 18, 2026, after scientists discovered the crater in visible-light images taken by LRO’s Wide-Angle Camera. Pre-impact temperatures are from the Diviner Global High-Resolution Mosaics (GHRM). The crater formed on the Moon after a comet or asteroid, possibly the size of a six-story building, hit the surface in a rare, once-in-a-century collision. The dark blue strip that flashes into view reveals a 4-mile-wide “cold spot” around the crater that is about 16 degrees Fahrenheit cooler at night than its surroundings. This cooling happens because an impact fluffs up regolith around a crater, making it less dense and therefore less able to retain heat. Scientists on the Diviner team reported this finding in a paper published on Sept. 16, 2026, in Science Advances. The red and yellow spots indicate areas typically associated with rocks excavated by long-ago impacts which, though still at cryogenic temperatures like their surroundings, remain slightly warmer at night.
NASA Goddard/UCLA/JHU APL
Reporting in a second paper Wednesday in the same journal, researchers say that the cooling happens because the impact fluffs up the regolith around the crater, making it less dense and therefore less able to retain heat.
The large extent of this “cold spot” is striking, scientists say, because it shows that impacts can modify the Moon’s surface far beyond the crater itself. These physical changes could affect how rover wheels interact with the surface, for instance.
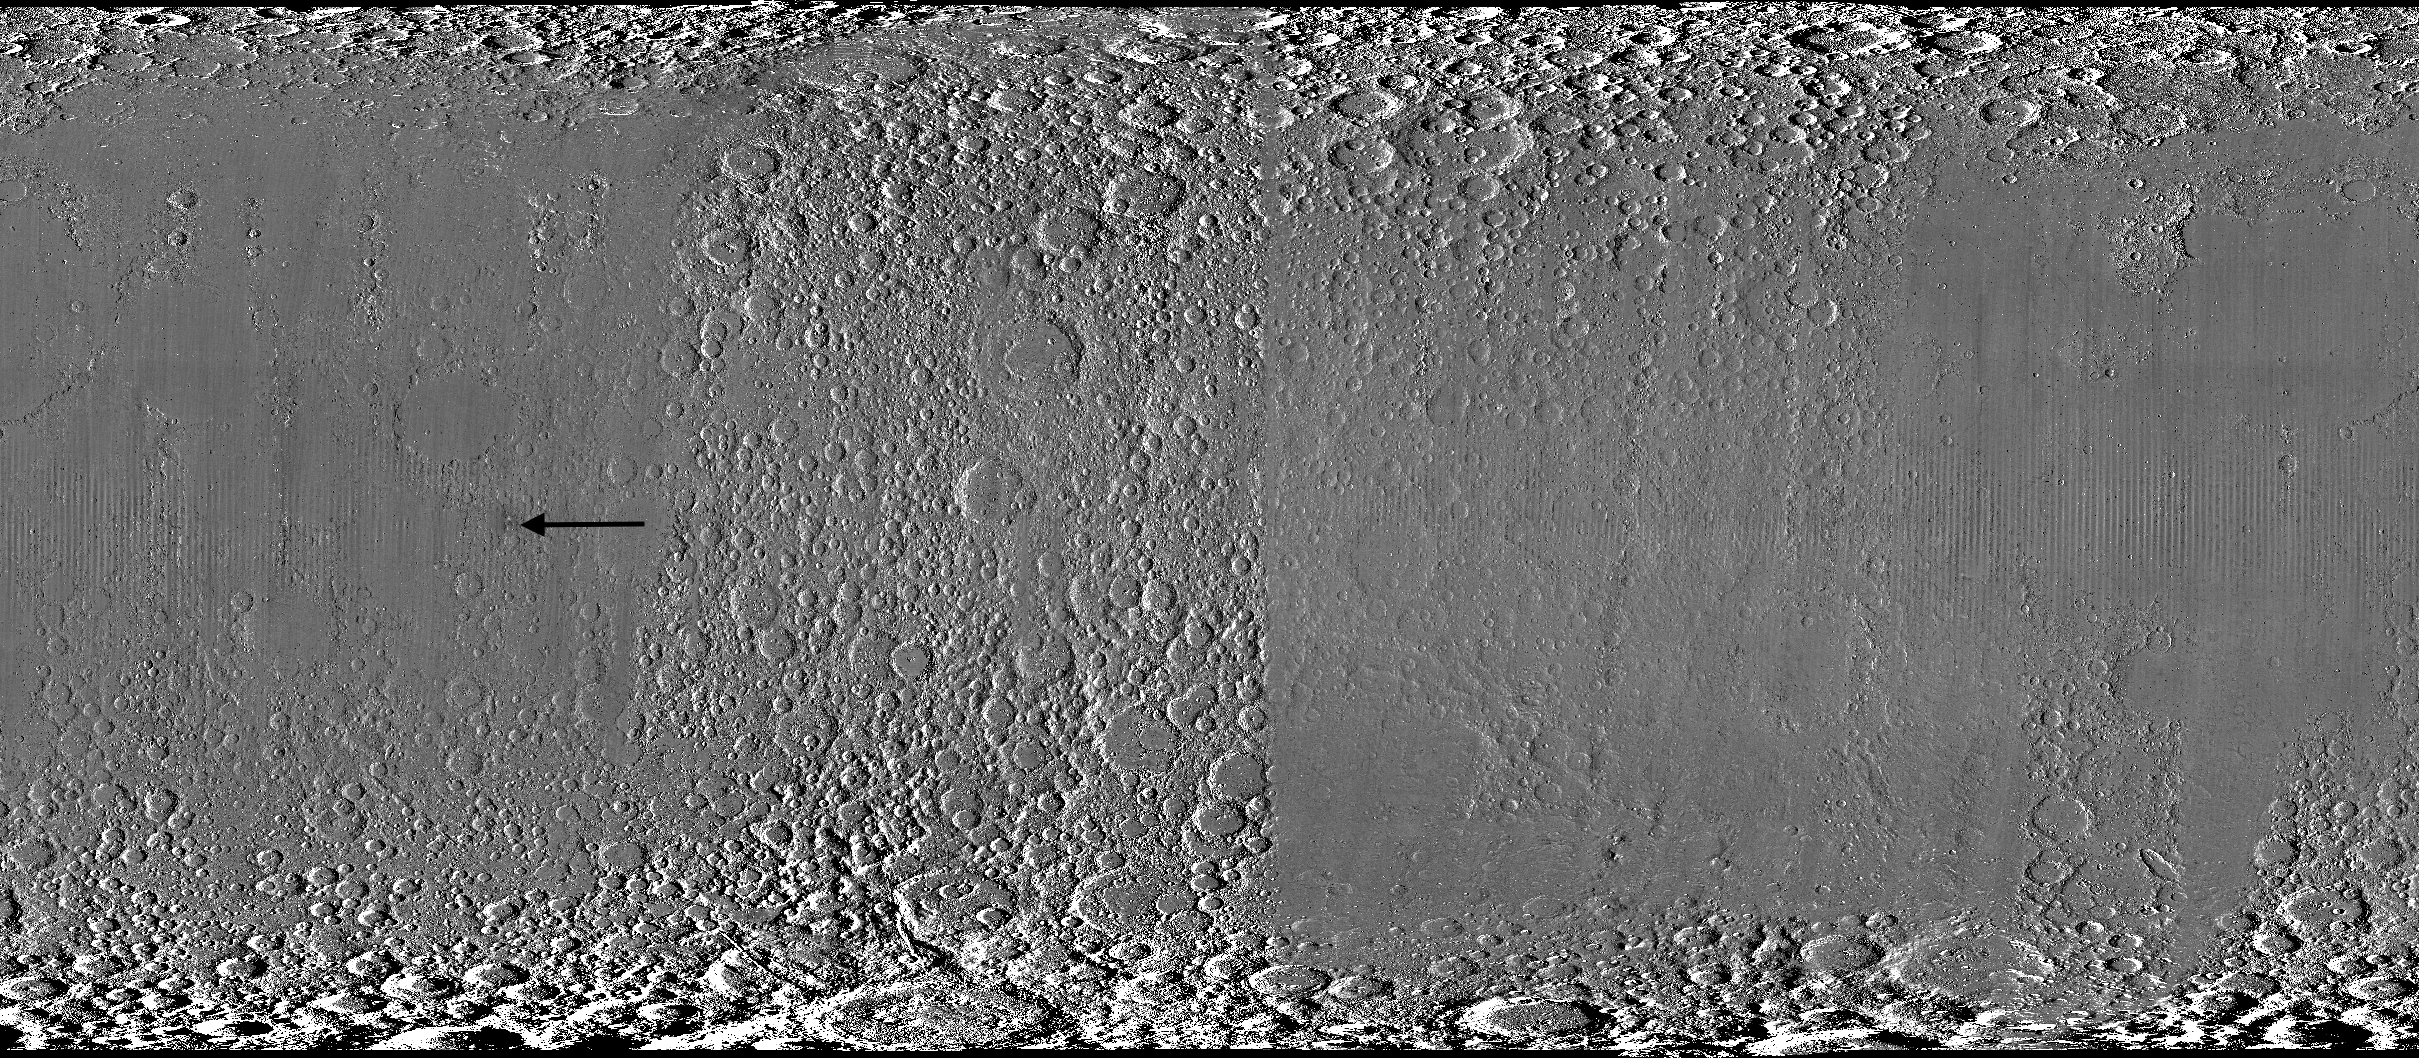
A global view of the Moon made by stitching together hundreds of images from the Wide-Angle Camera aboard NASA’s Lunar Reconnaissance Orbiter (LRO). Robert Wagner, image processing specialist for LRO, made this map using two sets of mages taken several years apart. He used a software designed to highlight any changes between the two sets. Anything that stayed the same turned gray; anything different showed up as bright or dark patches. A black arrow just left of center points to McGetchin crater.
NASA Goddard/Intuitive Machines/Robert Wagner
Road to discovery
The LROC system collects images from about 60 miles above the Moon as LRO loops from pole to pole. The system includes two cameras that capture high‑resolution black‑and‑white images and one camera for moderate‑resolution multispectral images. Over the years and thousands of passes, scientists have built maps detailed enough to spot not only new craters, but also landslides, landers, seismic faults, and even hints of lava tubes.
LROC scientists regularly analyze close-up images of small portions of the Moon’s surface taken by the Narrow-Angle Camera. Using these images, they look for changes that are typically less than 30 feet across. But every few years the team searches for large (wider than 150 feet) features by creating global Moon maps and comparing them to older versions.
An overhead, close-up view of McGetchin crater that was taken on Dec. 5, 2025, by NASA’s Lunar Reconnaissance Orbiter (LRO) Narrow-Angle Camera (NAC). After the crater was discovered on Oct. 24, 2025, in global images from LRO’s Wide-Angle Camera, which captures broad views with pixels the size of American football fields, scientists turned to the NAC, which takes much sharper views at about 3 feet per pixel. The NAC images, taken as LRO flew over the impact site again, revealed the crater size, shape, and how the surrounding terrain was affected by the impact that carved McGetchin. The image covers an area that’s ¾ mile wide.
NASA Goddard/Intuitive Machines
This view from the side (55° away from straight down) towards the east, covers an area of the Moon that’s about 1.5 miles wide. It was taken by NASA’s Lunar Reconnaissance Orbiter Narrow-Angle Camera on March 3, 2026.
NASA Goddard/Intuitive Machines
That’s what Wagner was doing on Oct. 24, 2025, when he came across McGetchin. Using images from LROC’s Wide-Angle Camera, which captures broad views with pixels the size of football fields, he stacked hundreds of “before” and “after” frames with software designed to highlight change. Anything that stayed the same turned gray while anything different showed up as bright or dark patches.
While the process sounds straightforward, spotting real craters requires a lot of manual work. The software flags every tiny shift in lighting or shadow, generating hundreds of false alarms. For this reason, Wagner typically verifies the software, looking for small fuzzy halos around pixel‑wide bright points, which indicate splashes of regolith around a new crater.
Spanning hundreds of pixels, McGetchin stood out immediately. “It was by far the most obvious impact debris pattern I’ve ever seen in one of these images,” Wagner said.
After his discovery, scientists turned to the Narrow-Angle Camera, which takes much sharper views at about 3 feet per pixel. This camera’s close-up images, taken as LRO flew over the impact site again, revealed the crater size, shape, and how the surrounding terrain was affected. These images also helped researchers estimate the size and force of the rock fragment that formed the new crater, details that are expected to appear in a future paper.
Banner image caption: A zoomed-in view of the Moon, with debris around McGetchin crater visible as a white spot circled by a dark halo just right of center of the image (marked with black arrows). This is the view that Robert Wagner saw on Oct. 24, 2025, during a routine data-quality check. Wagner is an image processing specialist for NASA’s Lunar Reconnaissance Orbiter Camera, a system of three cameras. Using images from the Wide-Angle Camera (WAC), which captures broad views with pixels the size of American football fields, he stacked hundreds of images captured by WAC over the last several years with software designed to highlight change. Anything that stayed the same is gray; anything that changed showed up as bright or dark patches. The stripes in the image are due to slight changes in lighting between the older and newer images. This image composite shows an area of the Moon approximately 900 miles across.
About the Author
Lonnie Shekhtman
Senior Science Writer
Shekhtman helps communicate NASA planetary science to the world through news and feature stories on NASA.gov, videos for NASA+ and YouTube, and by working with the media. She reports on lunar and Mars science and exploration; NASA's search for life; missions to Venus, Titan, and Jupiter's Trojan asteroids; and many other topics related to NASA's exploration of our solar system and beyond.
Scientists discovered a crater on the Moon that formed sometime between April 11 and May 22, 2024, after a comet or asteroid the size of a three- to six-story building hit the surface.
The crash left a crater, 728 feet wide, that spans the length of two football fields. And at 141 feet deep, the crater could fit three vertically stacked yellow school buses.
A zoomed-in view of the Moon made from images from NASA’s Lunar Reconnaissance Orbiter Camera. (More information at the bottom of article.)
Credits: NASA Goddard/Intuitive Machines/Robert Wagner
It started as a routine data-quality check. But as Robert Wagner, a scientist with NASA’s Lunar Reconnaissance Orbiter (LRO), scanned a giant Moon map on his computer screen, an unusually large bright spot circled by a dark halo caught his eye, as it implied that surface material in that area had been shaken up.
“I just stopped, dropped everything, and started looking into what that spot was,” said Wagner, an image-processing specialist from Intuitive Machines who works with data from the Lunar Reconnaissance Orbiter Camera (LROC) system.
By comparing before and after images of the Moon, Wagner realized he had discovered the largest, newly formed crater ever found in the solar system, as scientists reported Wednesday in Science Advances. This discovery highlights the value of NASA’s Moon orbiter data in studying a dynamic landscape as the agency advances a sustained human presence and expanded scientific and commercial activity on the Moon.
A zoomed-in view of McGetchin crater, circled on the left, next to a “before” image on the right. The panel on the left is made from images captured by NASA’s Lunar Reconnaissance Orbiter Wide-Angle Camera in summer 2025; the right panel was made from images taken in spring 2011. The white spot is not the crater itself, but rather material flung out of the crater, which formed when a rock, possibly this size of a three- to six‑story building, crashed into the Moon between April 11 and May 22, 2024 – a once-in-a-century event, as scientists reported on Sept. 15, 2026, in a pair of papers in Science Advances. The area shown in the images is 38 miles wide.
NASA Goddard/Intuitive Machines/Robert Wagner
Officially named McGetchin after pioneering lunar scientist Tom McGetchin, the crater formed on the Moon’s eastern edge sometime between April 11 and May 22, 2024, after a comet or asteroid the size of a three- to six-story building hit the surface.
The crash left a crater, 728 feet wide, that spans the length of two football fields. And at 141 feet deep, the crater could fit three vertically stacked yellow school buses.
Scientists estimate that an impact of this magnitude happens on the Moon about once in a century or even longer.
Moon takes some hits
For more than 17 years, LRO has been circling the Moon and using its seven instruments to map the topography, surface composition, temperature, and radiation environment there. The spacecraft’s team has identified at least 1,000 new impact craters throughout the mission and flagged 100,000 more surface changes from an object smashing into the Moon or from the debris that flung out after.
With no atmosphere to slow them or burn them up, space rocks and other objects easily reach the lunar surface. Most are much smaller compared to the object that carved out McGetchin crater. The smallest craters scientists can distinguish from LRO images are about 30 feet wide, the length of a three-story building laid on its side, made by rocks about 43 inches wide, the size of a monster-truck tire. Scientists estimate that impacts of this scale produce about 140 new craters across the Moon each year. But most new ones are made by microscopic projectiles that leave holes too small to identify in orbital images.
With its numerous instruments, the spacecraft can observe changes to the lunar surface that aren’t apparent in the LROC images alone. After the crater was discovered, scientists working with LRO’s thermal instrument, Diviner, made follow-up observations of the site. They found a 4-mile-wide area around the crater that is about 16 degrees Fahrenheit cooler at night than its surroundings.
This animated image set shows an area on the eastern limb of the Moon before and after McGetchin crater formed there sometime between April 11 and May 22, 2024. The post-impact image was constructed using data taken by NASA’s Lunar Reconnaissance Orbiter (LRO) thermal instrument, Diviner, between Nov. 15, 2025, and Feb. 18, 2026, after scientists discovered the crater in visible-light images taken by LRO’s Wide-Angle Camera. Pre-impact temperatures are from the Diviner Global High-Resolution Mosaics (GHRM). The crater formed on the Moon after a comet or asteroid, possibly the size of a six-story building, hit the surface in a rare, once-in-a-century collision. The dark blue strip that flashes into view reveals a 4-mile-wide “cold spot” around the crater that is about 16 degrees Fahrenheit cooler at night than its surroundings. This cooling happens because an impact fluffs up regolith around a crater, making it less dense and therefore less able to retain heat. Scientists on the Diviner team reported this finding in a paper published on Sept. 16, 2026, in Science Advances. The red and yellow spots indicate areas typically associated with rocks excavated by long-ago impacts which, though still at cryogenic temperatures like their surroundings, remain slightly warmer at night.
NASA Goddard/UCLA/JHU APL
Reporting in a second paper Wednesday in the same journal, researchers say that the cooling happens because the impact fluffs up the regolith around the crater, making it less dense and therefore less able to retain heat.
The large extent of this “cold spot” is striking, scientists say, because it shows that impacts can modify the Moon’s surface far beyond the crater itself. These physical changes could affect how rover wheels interact with the surface, for instance.
A global view of the Moon made by stitching together hundreds of images from the Wide-Angle Camera aboard NASA’s Lunar Reconnaissance Orbiter (LRO). Robert Wagner, image processing specialist for LRO, made this map using two sets of mages taken several years apart. He used a software designed to highlight any changes between the two sets. Anything that stayed the same turned gray; anything different showed up as bright or dark patches. A black arrow just left of center points to McGetchin crater.
NASA Goddard/Intuitive Machines/Robert Wagner
Road to discovery
The LROC system collects images from about 60 miles above the Moon as LRO loops from pole to pole. The system includes two cameras that capture high‑resolution black‑and‑white images and one camera for moderate‑resolution multispectral images. Over the years and thousands of passes, scientists have built maps detailed enough to spot not only new craters, but also landslides, landers, seismic faults, and even hints of lava tubes.
LROC scientists regularly analyze close-up images of small portions of the Moon’s surface taken by the Narrow-Angle Camera. Using these images, they look for changes that are typically less than 30 feet across. But every few years the team searches for large (wider than 150 feet) features by creating global Moon maps and comparing them to older versions.
An overhead, close-up view of McGetchin crater that was taken on Dec. 5, 2025, by NASA’s Lunar Reconnaissance Orbiter (LRO) Narrow-Angle Camera (NAC). After the crater was discovered on Oct. 24, 2025, in global images from LRO’s Wide-Angle Camera, which captures broad views with pixels the size of American football fields, scientists turned to the NAC, which takes much sharper views at about 3 feet per pixel. The NAC images, taken as LRO flew over the impact site again, revealed the crater size, shape, and how the surrounding terrain was affected by the impact that carved McGetchin. The image covers an area that’s ¾ mile wide.
NASA Goddard/Intuitive Machines
This view from the side (55° away from straight down) towards the east, covers an area of the Moon that’s about 1.5 miles wide. It was taken by NASA’s Lunar Reconnaissance Orbiter Narrow-Angle Camera on March 3, 2026.
NASA Goddard/Intuitive Machines
That’s what Wagner was doing on Oct. 24, 2025, when he came across McGetchin. Using images from LROC’s Wide-Angle Camera, which captures broad views with pixels the size of football fields, he stacked hundreds of “before” and “after” frames with software designed to highlight change. Anything that stayed the same turned gray while anything different showed up as bright or dark patches.
While the process sounds straightforward, spotting real craters requires a lot of manual work. The software flags every tiny shift in lighting or shadow, generating hundreds of false alarms. For this reason, Wagner typically verifies the software, looking for small fuzzy halos around pixel‑wide bright points, which indicate splashes of regolith around a new crater.
Spanning hundreds of pixels, McGetchin stood out immediately. “It was by far the most obvious impact debris pattern I’ve ever seen in one of these images,” Wagner said.
After his discovery, scientists turned to the Narrow-Angle Camera, which takes much sharper views at about 3 feet per pixel. This camera’s close-up images, taken as LRO flew over the impact site again, revealed the crater size, shape, and how the surrounding terrain was affected. These images also helped researchers estimate the size and force of the rock fragment that formed the new crater, details that are expected to appear in a future paper.
Banner image caption: A zoomed-in view of the Moon, with debris around McGetchin crater visible as a white spot circled by a dark halo just right of center of the image (marked with black arrows). This is the view that Robert Wagner saw on Oct. 24, 2025, during a routine data-quality check. Wagner is an image processing specialist for NASA’s Lunar Reconnaissance Orbiter Camera, a system of three cameras. Using images from the Wide-Angle Camera (WAC), which captures broad views with pixels the size of American football fields, he stacked hundreds of images captured by WAC over the last several years with software designed to highlight change. Anything that stayed the same is gray; anything that changed showed up as bright or dark patches. The stripes in the image are due to slight changes in lighting between the older and newer images. This image composite shows an area of the Moon approximately 900 miles across.
About the Author
Lonnie Shekhtman
Senior Science Writer
Shekhtman helps communicate NASA planetary science to the world through news and feature stories on NASA.gov, videos for NASA+ and YouTube, and by working with the media. She reports on lunar and Mars science and exploration; NASA’s search for life; missions to Venus, Titan, and Jupiter’s Trojan asteroids; and many other topics related to NASA’s exploration of our solar system and beyond.
Scientists discovered a crater on the Moon that formed sometime between April 11 and May 22, 2024, after a comet or asteroid the size of a three- to six-story building hit the surface.
The crash left a crater, 728 feet wide, that spans the length of two football fields. And at 141 feet deep, the crater could fit three vertically stacked yellow school buses.
upgraded to Golden gate. getting this message to login to facetime with an email i’ve not used in years. it’s not the emai for my current apple account.
the window keeps appearing and wont go away. any ideas how to fix this? thanks.
Well, it's different in a number of ways, I've hardly scratched the surface especially in regard to display options, mostly because my display was fine before and it still is.
What I can say is it seems "snappier" on my M1 14" MBP. I'm sure windows and desktops are opening and closing quicker than before.
My menu bar has changed, I have had to turn off Bartender 6 which used to show hidden menu bar items when "clicked" it no longer works as it did and seems to conflict with something new...
Amazon Web Services (AWS) says it is unable to restore access to resources and data in some of its Availability Zones in the Middle East after datacenters were damaged during the US war with Iran. In an update to its AWS Health Dashboard, the cloud giant confirmed that anything hosted exclusively in its Bahrain Region (me-south-1) remains inaccessible. "The damage to our infrastructure spanned multiple Availability Zones and exceeded what our regional and multi-AZ services are designed to withstand," the update says. "After a thorough assessment, we have determined that we are unable to restore access to the resources and data hosted exclusively in this Region." After the first Bahrain Availability Zone was damaged in March, AWS advised customers to migrate their workloads to other Regions. The company said most did so before further attacks disrupted a second Availability Zone in April and rendered the entire Region unavailable. AWS has reached a similar conclusion about one Availability Zone in the United Arab Emirates (UAE), saying it cannot re-establish access to the resources and data hosted there. The affected Zone, mec1-az2, is one of three in AWS's UAE Region. Two AWS facilities in the country were hit by drones back in March as Iran retaliated against US-Israeli strikes on its territory. AWS says it continues to work on recovering resources in the Region, including some hosted in the other affected Availability Zones (mec1-az1 and mec1-az3). It adds that "most customers" have been able to restart operations in other AWS Regions by restoring from backups or copying any data that remained accessible. The company says its support teams remain available to help customers move their applications to alternate Regions. The Register asked AWS to comment, but the company declined to add to the information on its Health Dashboard. In AWS terminology, a Region is a geographic area containing multiple isolated Availability Zones. Each Zone consists of one or more discrete datacenters with independent power, cooling, and network connectivity. AWS recommends distributing applications and resources across multiple Availability Zones to withstand the loss of a single location. That approach cannot protect against a Region-wide failure, however. Workloads that must survive such an event require a disaster recovery plan involving another Region. AWS and several other tech companies advised customers after the first strikes to recover whatever resources they could and replicate them in alternate Regions, ideally in Europe, rather than wait for services in the Middle East to return. That advice appears to have been well-founded. AWS said at the time: "Customers should enact their disaster recovery plans, recover from remote backups stored in other Regions, and update their applications to direct traffic away from the affected Regions." ®

 Login