The Defense Department issued a legal waiver authorizing current and former personnel to share unidentified anomalous phenomena–related classified information, but it doesn’t extend to other agencies.
The Defense Department issued a legal waiver authorizing current and former personnel to share unidentified anomalous phenomena–related classified information, but it doesn’t extend to other agencies.
In 2021, the average transaction recorded on the Bitcoin blockchain carried an estimated water footprint of roughly 16,000 litres, once the water used to generate the electricity behind the mining process and to cool the machines doing the work is added up. That figure, drawn from a peer-reviewed study published in the Cell Press journal Cell Reports Sustainability, works out to roughly 6.2 million times the water footprint of a single credit-card swipe, based on de Vries’ own estimate — discussed in a later interview with Greenpeace rather than the paper itself — that one card transaction carries a footprint of around 2.6 millilitres.
The research, titled “Bitcoin’s growing water footprint,” was published online in late November 2023 by Alex de Vries, a data scientist with a background in financial economics who tracks the industry’s resource use. De Vries built his estimate around two components. The larger of the two, accounting for roughly 80 to 90 percent of the total, is indirect water use: the water consumed at power plants to generate the electricity that miners buy, whether through evaporative cooling at thermoelectric plants, hydropower reservoir evaporation, or other generation methods. The paper calculates this by combining data on where Bitcoin’s computing power is located with regional water-intensity figures, expressed in litres of water per kilowatt-hour of electricity produced on that grid.
The remaining share, direct water use, covers cooling and humidification equipment on-site at mining facilities, measured using an industry metric called water usage effectiveness, or WUE. For large-scale US mining operations, the study estimated a weighted-average WUE of between 0.25 and 1.03 litres per kilowatt-hour, depending on climate and facility design. Location matters enormously to the total: the study estimated Kazakhstan accounted for 63 percent of Bitcoin’s 2021 water footprint while hosting only around 14 percent of its computing power. Average water intensity across Bitcoin’s power mix rose from 8.63 litres per kilowatt-hour in 2020 to 15.0 litres per kilowatt-hour in 2021, the paper found.
What the comparisons mean
News coverage of the study, including reporting by ScienceDaily and Fast Company, popularized the comparison that a single Bitcoin transaction’s water footprint is roughly equivalent to filling a backyard swimming pool. The 6.2-million-times-a-credit-card-swipe comparison, cited in de Vries’ own commentary and repeated across outlets covering the paper, follows from dividing the 16,000-plus-litre figure by that credit-card baseline, and it moves with Bitcoin’s price. When the market fell during the 2022 downturn, mining activity and its associated electricity and water use fell with it, only to climb back toward record levels as the price recovered in 2023. Because a higher Bitcoin price makes mining more profitable and draws more computing power onto the network, the water footprint tracks the price cycle instead of holding steady. De Vries projected the network’s total 2023 water footprint at roughly 2,237 gigaliters, an increase over 2021 despite the intervening price crash.
Extrapolated to the United States, which absorbed a large share of mining capacity after China’s ban, de Vries estimated domestic mining operations consume water at a scale comparable to roughly 300,000 US households, or a city on the order of Washington, DC, a comparison he discussed in an interview with Greenpeace.
Where the estimate is contested
The methodology has drawn pushback. Critics covered in a DL News investigation note that per-transaction water figures are largely independent of transaction count — a block can bundle thousands of individual payments, so dividing total resource use by the number of on-chain transactions can make the per-transaction number swing based on how the network happens to be used that day — a shift in usage patterns, not a genuine efficiency change.
Bitcoin advocate Daniel Batten has gone further, arguing in commentary covered by the same report that the swimming-pool framing overstates the case by counting indirect water use from power generation that would occur with or without Bitcoin mining, and that applying the same accounting method to other electricity-intensive industries — banking, AI, search engines, construction, or media — would produce similarly large-sounding numbers. Separately, a UN-affiliated water researcher, Kaveh Madani, flagged in the same report that “water footprint” and “water consumption” are technical terms with distinct meanings in hydrology, and that using them interchangeably in public communication risks overstating the case. The Register’s coverage of the dispute frames it as a live disagreement between the paper’s author and its critics — not a settled question.
Why it matters beyond the headline number
The debate sits inside a larger and less disputed trend: much of Bitcoin mining has moved into regions and grids with high water intensity, including coal-heavy and drought-prone areas, since China’s 2021 mining ban scattered the industry’s computing power across new jurisdictions. That shift, documented in mining-location data tracked separately by the University of Cambridge, means Bitcoin’s water footprint is now heavily influenced by decisions about where mining farms are sited and what power sources they draw on, in addition to how much Bitcoin is worth on any given day. For a network whose environmental accounting has focused almost entirely on carbon and electricity for over a decade, the 2023 paper marked one of the first attempts to put a number on the water side of the ledger as well.
A new report by the International Bar Association (IBA) has found a significant gap between the importance legal professionals attach to fundamental rule of law principles and their assessment of how effectively those principles are implemented in practice.
The International Meteor Organization, the nonprofit that coordinates and publishes amateur and professional observations of meteor phenomena, said its infrastructure has suffered a “critical blow” from a cyberattack.
“We recently suffered a cyberattack that dealt a critical blow to aging infrastructure, taking much of our site offline," a static page on its website on Wednesday said. “We expect several weeks of partial downtime as we transition to new infrastructure and services.”
“I am very sad to see the site down”
In the meantime, the IMO said it’s prioritizing the reporting of fireball observations, which can be reported here. The organization is also providing some information on its Facebook page.
E-waste from the AI boom has been vastly underestimated, a new report warns. By 2050, it could become enough trash to fill 23 million shipping containers - roughly enough 40-foot containers to circle the world six times if lined up in a row.
It's a significantly higher estimate of AI's e-waste than previous studies have found because the authors of the new report factor in all the infrastructure needed to support servers in data centers. The broader scope provides a clearer picture of junk AI leaves behind, according to the nonprofit Basel Action Network (BAN), which published the paper today.
Although the famous Carrington Event of 1859 is often described as the first major space weather event to affect technology, earlier incidents did occur. Historical records show that telegraph systems were disrupted by geomagnetic storms as early as the late 1840s.
Through ROSES-25 A.14 Atmosphere NASA is soliciting proposals for data analysis and modeling of NASA supported airborne campaign data. NASA’s Earth Science Division has supported numerous airborne campaigns during the last few years, see Section 2 of the program element text.
A.14 Atmosphere required a mandatory Notice of Intent (NOI) to propose. Proposers who have not already submitted a compliant NOI are not eligible to submit a proposal.
ROSES-2025 Amendment 74 delays the due date for A.14 Atmosphere to December 2, 2026. Also, Section 4.3.3 “Use of Generative AI” now mentions a related NSPIRES cover page question on the use of AI. An updated FAQ has been posted under “Other Documents” on the NSPIRES page for this program element.
In recent years, there has been a lot of excitement about the potential for studying human diseases in what are called "organoids." These small patches of tissue, formed using stem cells, appear to produce many of the same cell types and at least some of the structures normally formed in actual organs, and thus can provide a better model for diseases that rely on the sometimes complex interactions among multiple specialized cell types that are a feature of the human body.
But even the most sophisticated organoids lack a lot of the features of a real human body. This is especially true for brain organoids, which don't form any of the connections with specialized brain structures needed to behave "normally." On Wednesday, a research group at Stanford University described a possible way to study brain organoids in a somewhat more natural context: They genetically wiped out a large portion of the mouse brain and replaced it with human brain organoid cells.
The replacements
Organoids, because they adopt a three-dimensional tissue structure and consist of various specialized cells, provide a much better model for an intact tissue than simply having a bunch of disassociated cells lying flat on a culture dish. But they still have a lot of limitations—they're not hooked up to a circulatory system that allows the liver to process chemicals the organoid produces and don't have immune cells moving through them, to give just a couple of examples.
The Vesuvius Challenge is an ongoing project that combines "digital unwrapping" with crowdsourced machine learning to decipher the so-called Herculaneum scrolls, badly charred 2,000-year-old papyri too fragile to be physically unrolled. The effort just got an additional boost. A team of researchers created their own contemporary model papyrus scrolls—charring them just like the originals—to validate a screening method to determine which of the Herculaneum scrolls were written in lead-based ink and hence are the most promising candidates for further analysis. They described the process in a new paper published in the journal PLoS ONE.
As previously reported, the ancient Roman resort town of Pompeii wasn’t the only city destroyed in the catastrophic 79 AD eruption of Mount Vesuvius. Several other cities in the area, including the wealthy enclave of Herculaneum, were fried by clouds of hot gas, called pyroclastic pulses and flows. But still, some remnants of Roman wealth survived. One palatial residence in Herculaneum—believed to have once belonged to a man named Piso—contained hundreds of priceless written scrolls made from papyrus, singed into carbon by volcanic gas.
The scrolls stayed buried under volcanic mud until they were excavated in the 1700s from a single room that archaeologists believe held the personal working library of an Epicurean philosopher named Philodemus. The few opened fragments helped scholars identify various Greek philosophical texts, including On Nature by Epicurus and several by Philodemus himself, as well as a handful of Latin works. But the more than 600 rolled-up scrolls were so fragile that it was long believed they would never be readable, since even touching them could cause them to crumble.
Near the base of the Dallol hydrothermal field in Ethiopia’s Afar region sits a pond barely 60 meters long, its water tinted pale yellow by dissolved iron. Chemists who sampled it found a total dissolved solids concentration of 433 grams per kilogram — 43.3 percent by weight — making it, by current measurement, the record for saltiest lake documented anywhere on Earth. The pond is known locally as Gaet’ale, and the figure comes from a 2017 study by Pérez and Chebude of Addis Ababa University’s Department of Chemistry, published in the journal Aquatic Geochemistry.
For context, the world’s oceans average about 35 grams of dissolved salt per liter, according to NOAA ocean salinity data and the USGS salinity reference — putting Gaet’ale at roughly twelve times ocean salinity. That figure is also higher than the Dead Sea, whose salinity is commonly cited around 340 grams per liter in recent measurements, though older or differently calculated figures put it lower — Guinness’s own comparison table, for instance, lists it at 23.1 percent by weight.
Ordinary seawater’s salt is mostly sodium chloride, or ordinary table salt. Gaet’ale’s brine is instead built around calcium chloride and magnesium chloride, at concentrations of roughly 2.72 moles per kilogram and 1.43 moles per kilogram respectively, according to Pérez and Chebude’s analysis, with trace sodium, potassium, nitrate and iron(III) complexes responsible for the water’s yellow cast. The researchers noted the pond’s chemistry closely resembles that of Don Juan Pond in Antarctica’s Dry Valleys, another calcium-chloride-dominated hypersaline pool long studied as one of Earth’s most extreme aquatic environments, though Gaet’ale’s higher temperature allows it to hold even more dissolved salt before reaching saturation.
The pond itself is shallow and crescent-shaped, sitting at around 50 to 55 degrees Celsius, with no inflowing or outflowing stream. According to the Gaet’ale Pond entry, local accounts attribute the pond’s formation to a January 2005 earthquake that reactivated a dormant thermal spring. The broader depression sits more than 100 meters below sea level in places, part of a tectonically stretched landscape laced with active volcanoes, sulfur vents and salt flats left behind by an ancient sea that repeatedly flooded and evaporated over geological time. The nearby Dallol hydrothermal field, roughly four kilometers northwest of the pond, is famous for acid ponds in shades of green, orange and yellow, produced when magma-heated groundwater dissolves the buried salt and mineral layers and pushes the resulting brine back to the surface.
A natural laboratory for other worlds
The combination of heat, acidity and salinity has made the region a working laboratory for scientists who study the outer edges of habitability. A multinational research effort coordinated through the Europlanet research infrastructure has sent microbiologists, geologists and planetary scientists to the depression in recent years. Karen Olsson-Francis and Vincent Rennie of the Open University sampled acidic, saline channels there for signs of microbial survival; Hugo Moors and Mieke De Craen of Belgium’s SCK CEN nuclear research center used the site to test methods relevant to how microbes might behave around deep nuclear waste repositories; and planetary geologists Daniel Mège of the Polish Academy of Sciences and Ernst Hauber of the German Aerospace Center studied Danakil’s salt-and-magma hydrothermal structures as an analog for Martian rift systems, work feeding into ongoing observations from the ExoMars Trace Gas Orbiter.
Jani Radebaugh of Brigham Young University and Ralph Lorenz of Johns Hopkins University’s Applied Physics Laboratory have separately used terrain models from the depression to interpret surface roughness data relevant to Saturn’s moon Titan.
Where even extremophiles give up
The scientific interest in the region’s brine pools goes beyond geology. A 2019 study led by Purificación López-García of the French National Centre for Scientific Research (CNRS), working with researchers from Spain’s Geological and Mining Institute and the Autonomous University of Madrid, searched the most extreme pools in the Dallol field — hyperacidic, near-boiling and saturated with salt simultaneously — for any trace of microbial life. Using genetic sequencing, culturing attempts, flow cytometry and electron microscopy, the team reported finding none, a result summarized by Phys.org as evidence that liquid water alone does not guarantee habitability. The researchers concluded that the pools’ combination of high magnesium and calcium concentrations, extreme acidity and heat produces a “chaotropic” chemical environment that actively breaks down biological molecules instead of simply placing them under stress.
That finding matters for astrobiology because it complicates a common assumption: that any environment with liquid water, however extreme, should host at least some microbial life. A separate 2021 study of nearby, slightly less extreme hypersaline lakes in the Danakil Depression, published in Environmental Microbiology by researchers including members of the same French-Spanish collaboration, found the opposite — diverse communities of salt-loving archaea thriving right up to the edge of what those less punishing pools could support. Gaet’ale itself is hot and dominated by chaotropic calcium and magnesium salts, not the sodium chloride of ordinary seawater. Pérez and Chebude’s 2017 paper focused on the pond’s chemistry rather than a dedicated search for microbial life, but a separate 2021 metagenomic study of Gaet’ale specifically found it dominated by bacteria — unlike the sterile conditions found in Dallol’s most extreme pools.
Together, the pond’s chemistry and its surrounding hydrothermal field illustrate why the Danakil Depression continues to draw researchers from chemistry, microbiology and planetary science alike. A 60-meter pool of scalding, mineral-saturated brine is, on its own, a curiosity of extreme terrestrial chemistry. Set inside a landscape already used to model early Earth, present-day Mars and the hydrocarbon lakes of Titan, it becomes a reference point for a broader question: how much stress a chemical system can absorb before it stops being able to host life at all.
A zoomed-in view of the Moon made from images from NASA’s Lunar Reconnaissance Orbiter Camera. (More information at the bottom of article.)
Credits: NASA Goddard/Intuitive Machines/Robert Wagner
It started as a routine data-quality check. But as Robert Wagner, a scientist with NASA’s Lunar Reconnaissance Orbiter (LRO), scanned a giant Moon map on his computer screen, an unusually large bright spot circled by a dark halo caught his eye, as it implied that surface material in that area had been shaken up.
“I just stopped, dropped everything, and started looking into what that spot was,” said Wagner, an image-processing specialist from Intuitive Machines who works with data from the Lunar Reconnaissance Orbiter Camera (LROC) system.
By comparing before and after images of the Moon, Wagner realized he had discovered the largest, newly formed crater ever found in the solar system, as scientists reported Wednesday in Science Advances. This discovery highlights the value of NASA’s Moon orbiter data in studying a dynamic landscape as the agency advances a sustained human presence and expanded scientific and commercial activity on the Moon.
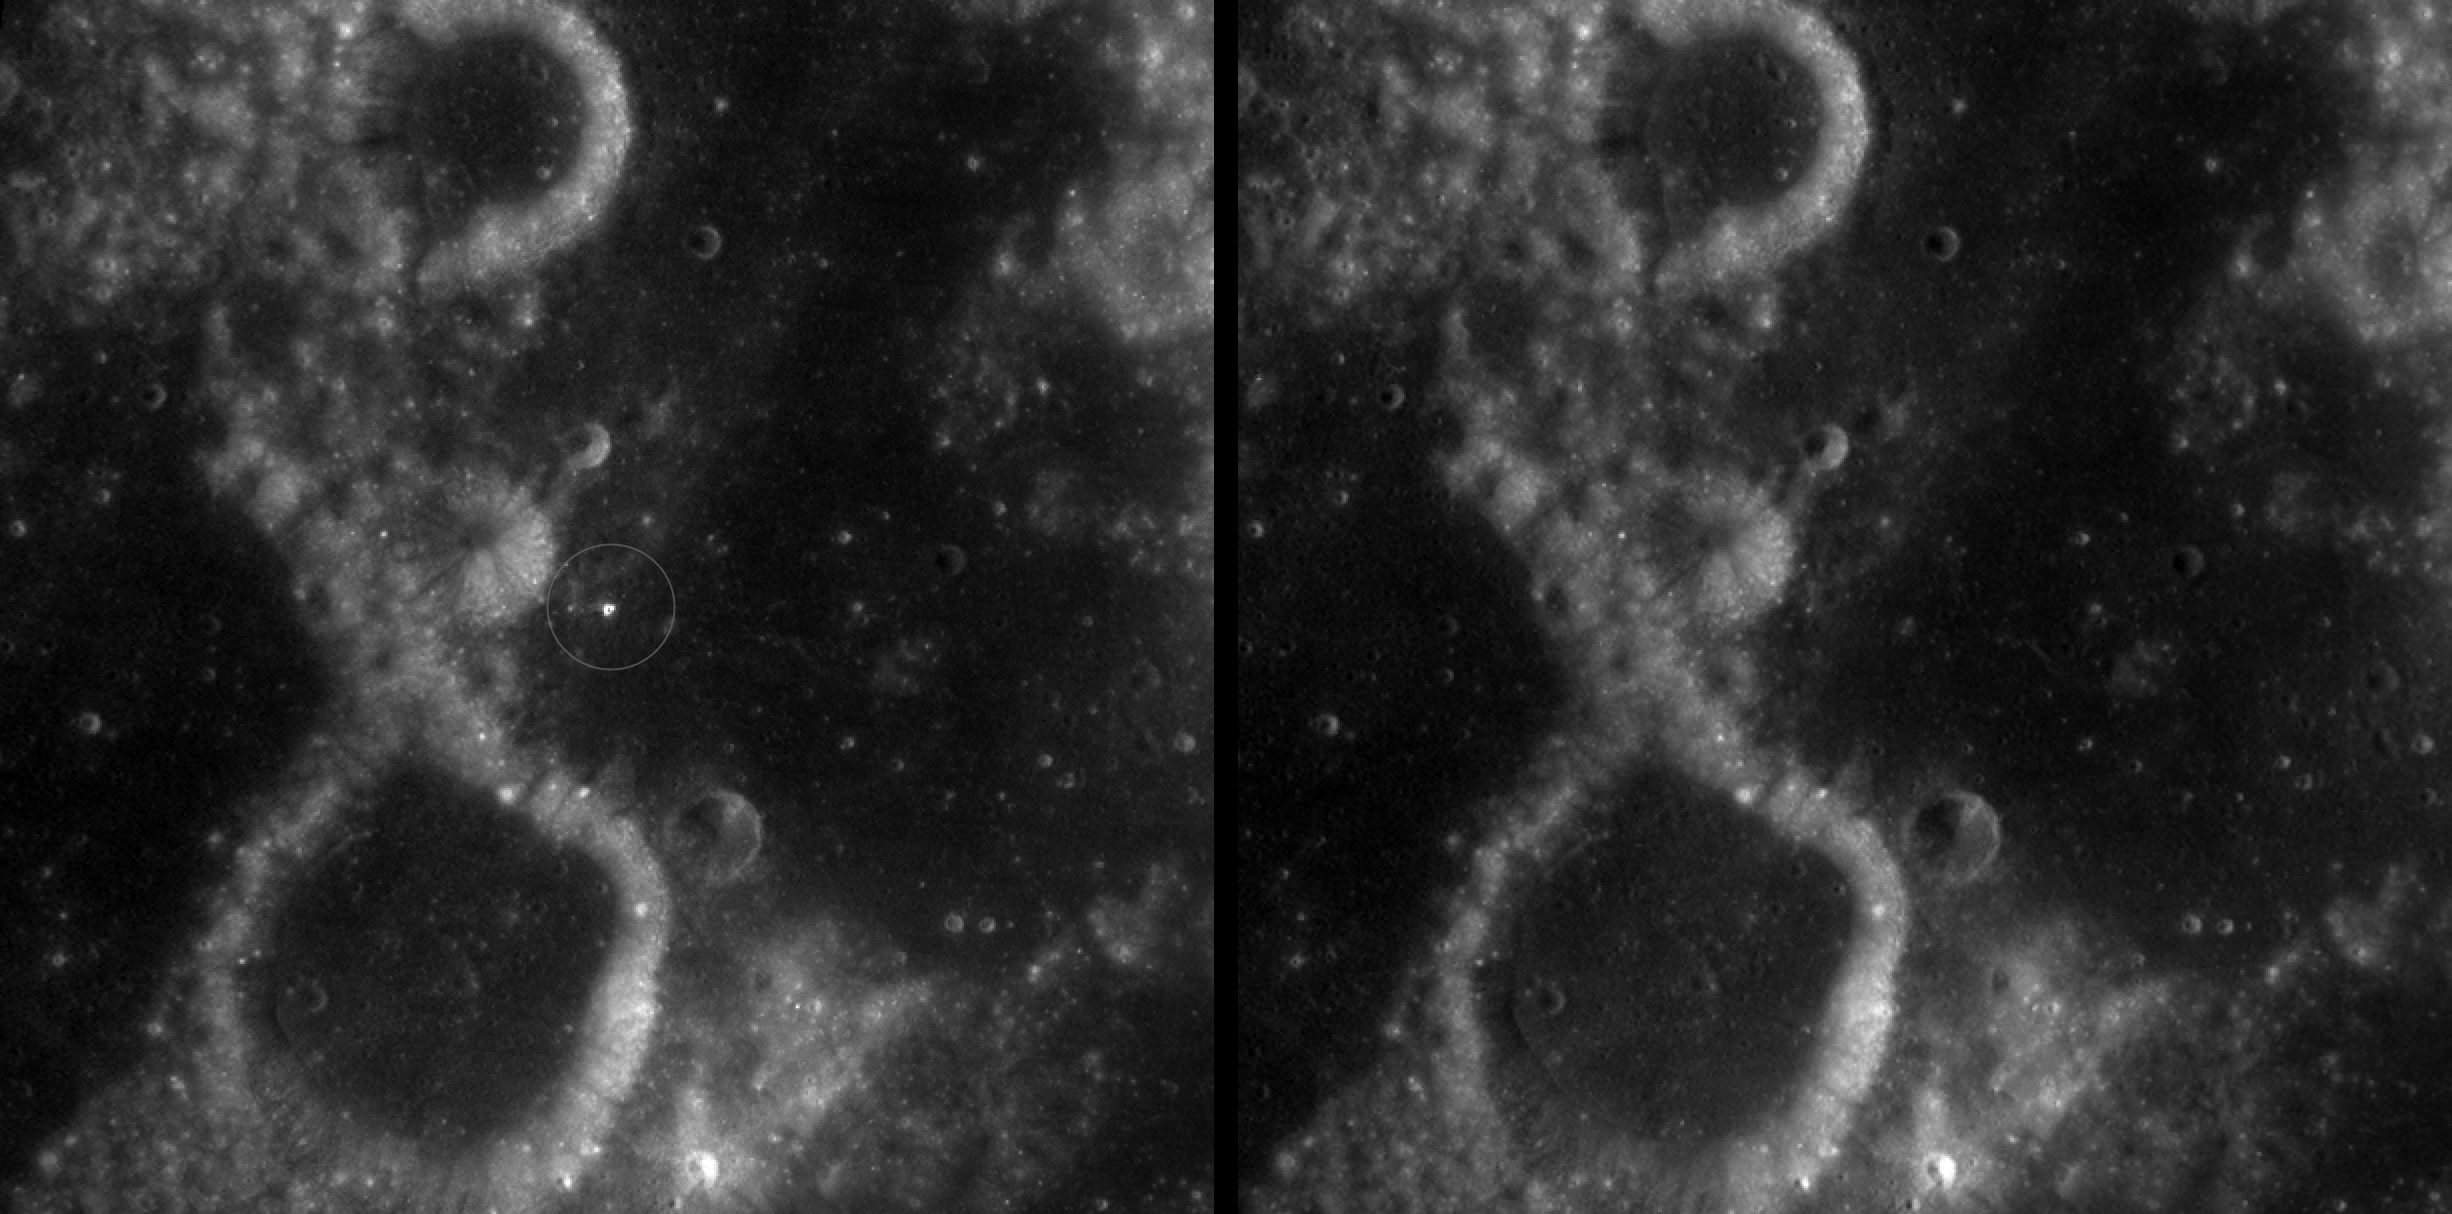
A zoomed-in view of McGetchin crater, circled on the left, next to a “before” image on the right. The panel on the left is made from images captured by NASA’s Lunar Reconnaissance Orbiter Wide-Angle Camera in summer 2025; the right panel was made from images taken in spring 2011. The white spot is not the crater itself, but rather material flung out of the crater, which formed when a rock, possibly this size of a three- to six‑story building, crashed into the Moon between April 11 and May 22, 2024 – a once-in-a-century event, as scientists reported on Sept. 15, 2026, in a pair of papers in Science Advances. The area shown in the images is 38 miles wide.
NASA Goddard/Intuitive Machines/Robert Wagner
Officially named McGetchin after pioneering lunar scientist Tom McGetchin, the crater formed on the Moon’s eastern edge sometime between April 11 and May 22, 2024, after a comet or asteroid the size of a three- to six-story building hit the surface.
The crash left a crater, 728 feet wide, that spans the length of two football fields. And at 141 feet deep, the crater could fit three vertically stacked yellow school buses.
Scientists estimate that an impact of this magnitude happens on the Moon about once in a century or even longer.
Moon takes some hits
For more than 17 years, LRO has been circling the Moon and using its seven instruments to map the topography, surface composition, temperature, and radiation environment there. The spacecraft’s team has identified at least 1,000 new impact craters throughout the mission and flagged 100,000 more surface changes from an object smashing into the Moon or from the debris that flung out after.
With no atmosphere to slow them or burn them up, space rocks and other objects easily reach the lunar surface. Most are much smaller compared to the object that carved out McGetchin crater. The smallest craters scientists can distinguish from LRO images are about 30 feet wide, the length of a three-story building laid on its side, made by rocks about 43 inches wide, the size of a monster-truck tire. Scientists estimate that impacts of this scale produce about 140 new craters across the Moon each year. But most new ones are made by microscopic projectiles that leave holes too small to identify in orbital images.
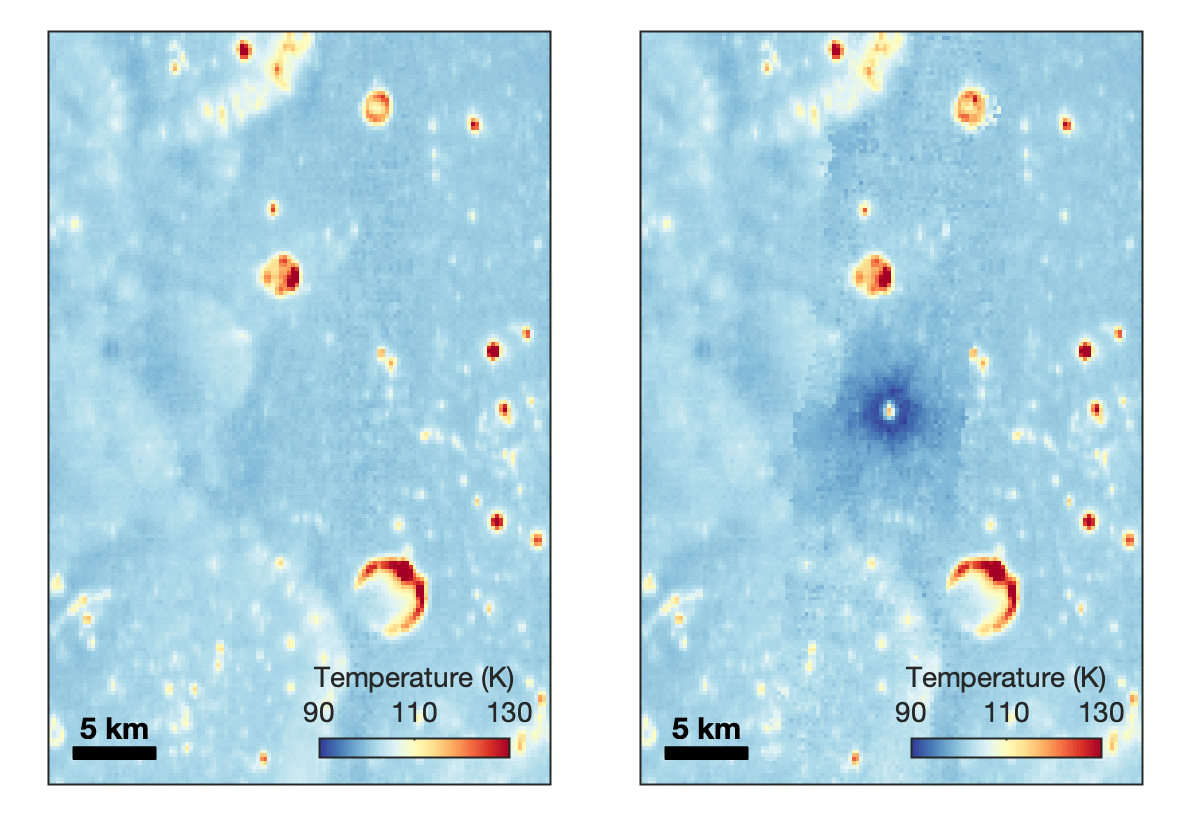
With its numerous instruments, the spacecraft can observe changes to the lunar surface that aren’t apparent in the LROC images alone. After the crater was discovered, scientists working with LRO’s thermal instrument, Diviner, made follow-up observations of the site. They found a 4-mile-wide area around the crater that is about 16 degrees Fahrenheit cooler at night than its surroundings.
This animated image set shows an area on the eastern limb of the Moon before and after McGetchin crater formed there sometime between April 11 and May 22, 2024. The post-impact image was constructed using data taken by NASA’s Lunar Reconnaissance Orbiter (LRO) thermal instrument, Diviner, between Nov. 15, 2025, and Feb. 18, 2026, after scientists discovered the crater in visible-light images taken by LRO’s Wide-Angle Camera. Pre-impact temperatures are from the Diviner Global High-Resolution Mosaics (GHRM). The crater formed on the Moon after a comet or asteroid, possibly the size of a six-story building, hit the surface in a rare, once-in-a-century collision. The dark blue strip that flashes into view reveals a 4-mile-wide “cold spot” around the crater that is about 16 degrees Fahrenheit cooler at night than its surroundings. This cooling happens because an impact fluffs up regolith around a crater, making it less dense and therefore less able to retain heat. Scientists on the Diviner team reported this finding in a paper published on Sept. 16, 2026, in Science Advances. The red and yellow spots indicate areas typically associated with rocks excavated by long-ago impacts which, though still at cryogenic temperatures like their surroundings, remain slightly warmer at night.
NASA Goddard/UCLA/JHU APL
Reporting in a second paper Wednesday in the same journal, researchers say that the cooling happens because the impact fluffs up the regolith around the crater, making it less dense and therefore less able to retain heat.
The large extent of this “cold spot” is striking, scientists say, because it shows that impacts can modify the Moon’s surface far beyond the crater itself. These physical changes could affect how rover wheels interact with the surface, for instance.
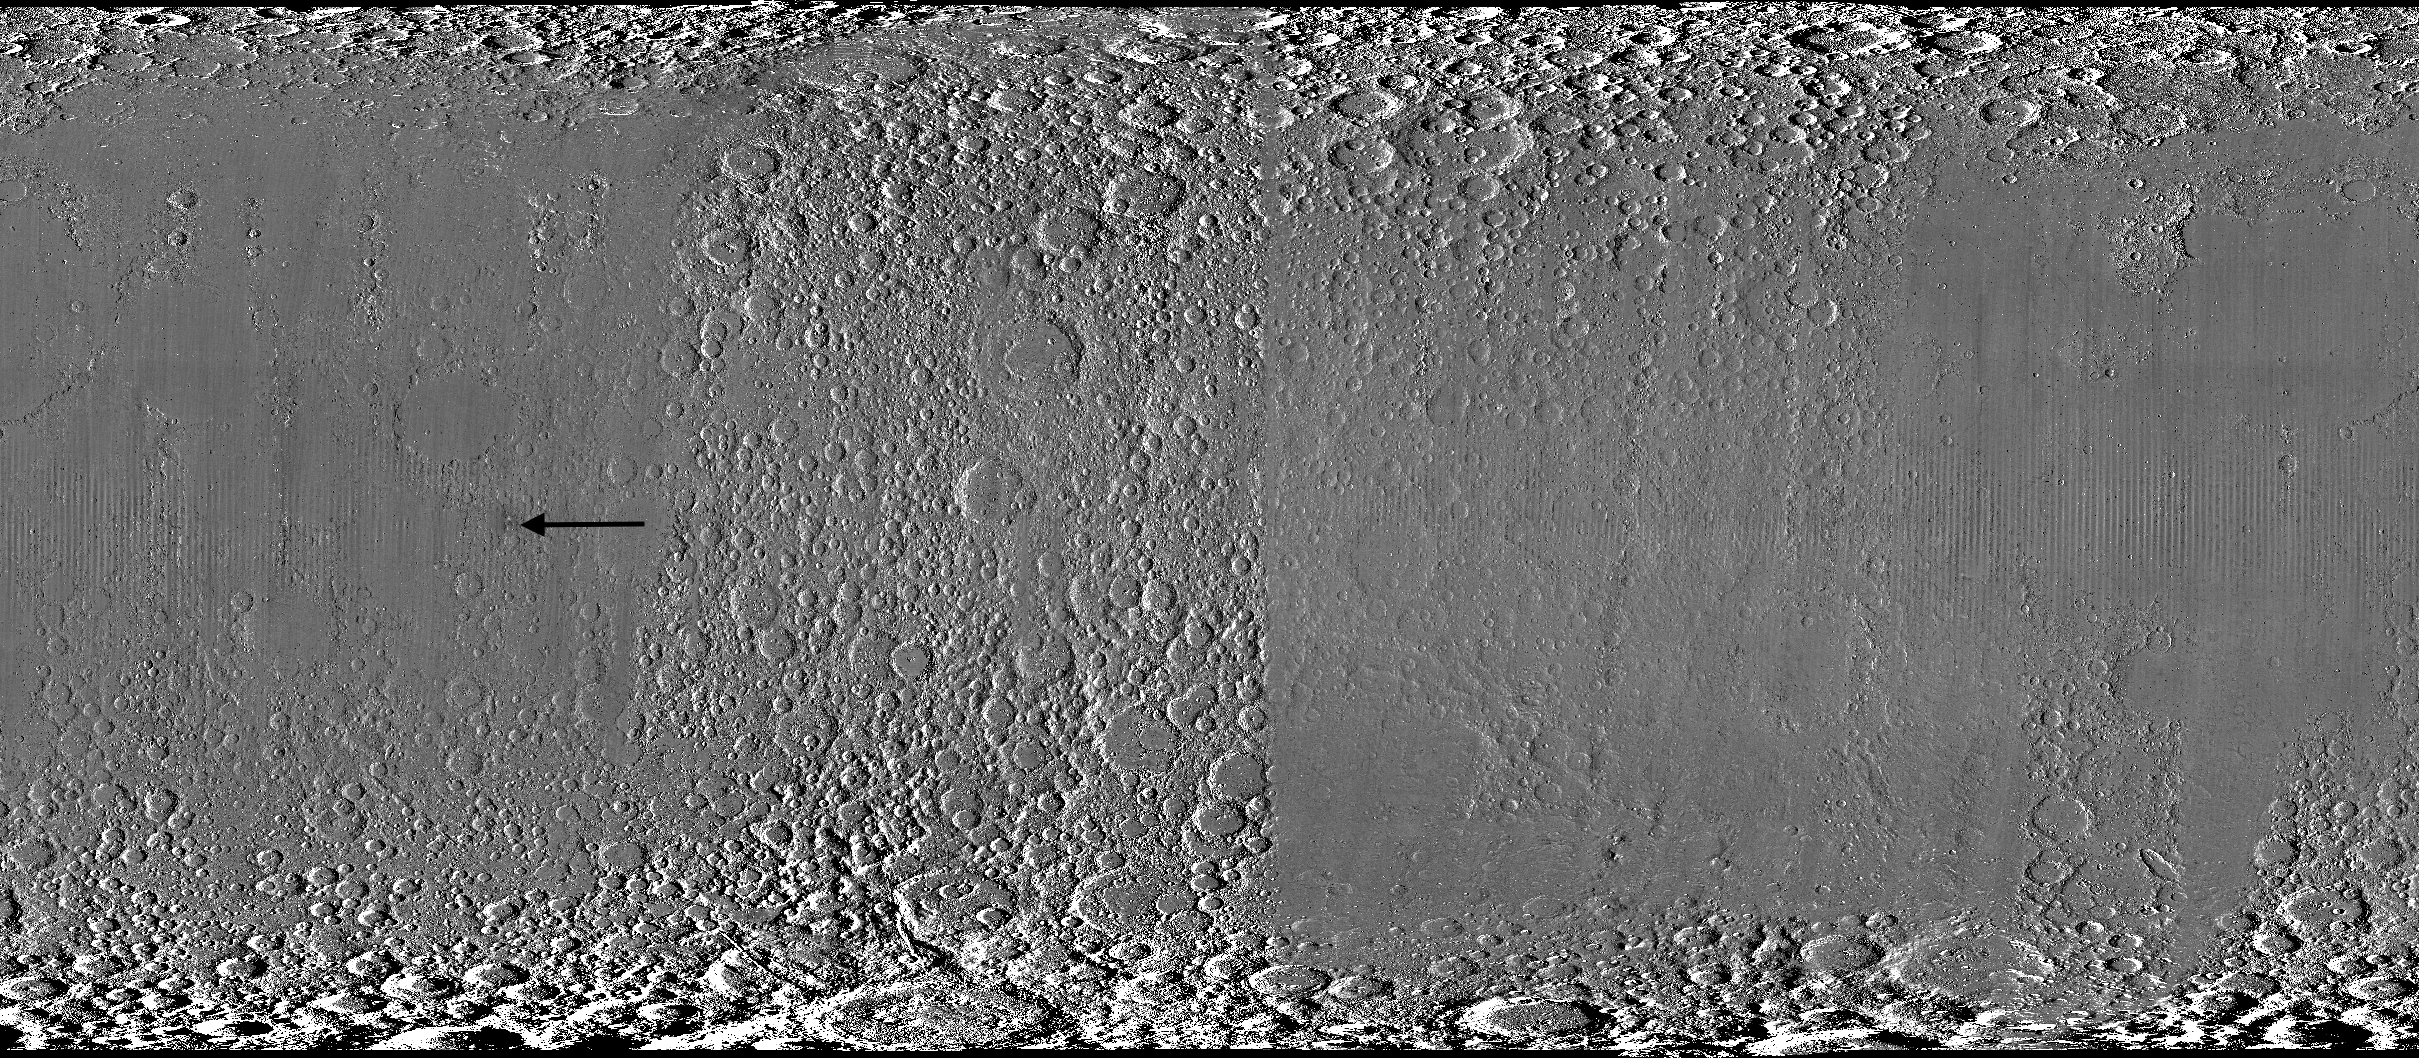
A global view of the Moon made by stitching together hundreds of images from the Wide-Angle Camera aboard NASA’s Lunar Reconnaissance Orbiter (LRO). Robert Wagner, image processing specialist for LRO, made this map using two sets of mages taken several years apart. He used a software designed to highlight any changes between the two sets. Anything that stayed the same turned gray; anything different showed up as bright or dark patches. A black arrow just left of center points to McGetchin crater.
NASA Goddard/Intuitive Machines/Robert Wagner
Road to discovery
The LROC system collects images from about 60 miles above the Moon as LRO loops from pole to pole. The system includes two cameras that capture high‑resolution black‑and‑white images and one camera for moderate‑resolution multispectral images. Over the years and thousands of passes, scientists have built maps detailed enough to spot not only new craters, but also landslides, landers, seismic faults, and even hints of lava tubes.
LROC scientists regularly analyze close-up images of small portions of the Moon’s surface taken by the Narrow-Angle Camera. Using these images, they look for changes that are typically less than 30 feet across. But every few years the team searches for large (wider than 150 feet) features by creating global Moon maps and comparing them to older versions.
An overhead, close-up view of McGetchin crater that was taken on Dec. 5, 2025, by NASA’s Lunar Reconnaissance Orbiter (LRO) Narrow-Angle Camera (NAC). After the crater was discovered on Oct. 24, 2025, in global images from LRO’s Wide-Angle Camera, which captures broad views with pixels the size of American football fields, scientists turned to the NAC, which takes much sharper views at about 3 feet per pixel. The NAC images, taken as LRO flew over the impact site again, revealed the crater size, shape, and how the surrounding terrain was affected by the impact that carved McGetchin. The image covers an area that’s ¾ mile wide.
NASA Goddard/Intuitive Machines
This view from the side (55° away from straight down) towards the east, covers an area of the Moon that’s about 1.5 miles wide. It was taken by NASA’s Lunar Reconnaissance Orbiter Narrow-Angle Camera on March 3, 2026.
NASA Goddard/Intuitive Machines
That’s what Wagner was doing on Oct. 24, 2025, when he came across McGetchin. Using images from LROC’s Wide-Angle Camera, which captures broad views with pixels the size of football fields, he stacked hundreds of “before” and “after” frames with software designed to highlight change. Anything that stayed the same turned gray while anything different showed up as bright or dark patches.
While the process sounds straightforward, spotting real craters requires a lot of manual work. The software flags every tiny shift in lighting or shadow, generating hundreds of false alarms. For this reason, Wagner typically verifies the software, looking for small fuzzy halos around pixel‑wide bright points, which indicate splashes of regolith around a new crater.
Spanning hundreds of pixels, McGetchin stood out immediately. “It was by far the most obvious impact debris pattern I’ve ever seen in one of these images,” Wagner said.
After his discovery, scientists turned to the Narrow-Angle Camera, which takes much sharper views at about 3 feet per pixel. This camera’s close-up images, taken as LRO flew over the impact site again, revealed the crater size, shape, and how the surrounding terrain was affected. These images also helped researchers estimate the size and force of the rock fragment that formed the new crater, details that are expected to appear in a future paper.
Banner image caption: A zoomed-in view of the Moon, with debris around McGetchin crater visible as a white spot circled by a dark halo just right of center of the image (marked with black arrows). This is the view that Robert Wagner saw on Oct. 24, 2025, during a routine data-quality check. Wagner is an image processing specialist for NASA’s Lunar Reconnaissance Orbiter Camera, a system of three cameras. Using images from the Wide-Angle Camera (WAC), which captures broad views with pixels the size of American football fields, he stacked hundreds of images captured by WAC over the last several years with software designed to highlight change. Anything that stayed the same is gray; anything that changed showed up as bright or dark patches. The stripes in the image are due to slight changes in lighting between the older and newer images. This image composite shows an area of the Moon approximately 900 miles across.
About the Author
Lonnie Shekhtman
Senior Science Writer
Shekhtman helps communicate NASA planetary science to the world through news and feature stories on NASA.gov, videos for NASA+ and YouTube, and by working with the media. She reports on lunar and Mars science and exploration; NASA's search for life; missions to Venus, Titan, and Jupiter's Trojan asteroids; and many other topics related to NASA's exploration of our solar system and beyond.
Scientists discovered a crater on the Moon that formed sometime between April 11 and May 22, 2024, after a comet or asteroid the size of a three- to six-story building hit the surface.
The crash left a crater, 728 feet wide, that spans the length of two football fields. And at 141 feet deep, the crater could fit three vertically stacked yellow school buses.
A zoomed-in view of the Moon made from images from NASA’s Lunar Reconnaissance Orbiter Camera. (More information at the bottom of article.)
Credits: NASA Goddard/Intuitive Machines/Robert Wagner
It started as a routine data-quality check. But as Robert Wagner, a scientist with NASA’s Lunar Reconnaissance Orbiter (LRO), scanned a giant Moon map on his computer screen, an unusually large bright spot circled by a dark halo caught his eye, as it implied that surface material in that area had been shaken up.
“I just stopped, dropped everything, and started looking into what that spot was,” said Wagner, an image-processing specialist from Intuitive Machines who works with data from the Lunar Reconnaissance Orbiter Camera (LROC) system.
By comparing before and after images of the Moon, Wagner realized he had discovered the largest, newly formed crater ever found in the solar system, as scientists reported Wednesday in Science Advances. This discovery highlights the value of NASA’s Moon orbiter data in studying a dynamic landscape as the agency advances a sustained human presence and expanded scientific and commercial activity on the Moon.
A zoomed-in view of McGetchin crater, circled on the left, next to a “before” image on the right. The panel on the left is made from images captured by NASA’s Lunar Reconnaissance Orbiter Wide-Angle Camera in summer 2025; the right panel was made from images taken in spring 2011. The white spot is not the crater itself, but rather material flung out of the crater, which formed when a rock, possibly this size of a three- to six‑story building, crashed into the Moon between April 11 and May 22, 2024 – a once-in-a-century event, as scientists reported on Sept. 15, 2026, in a pair of papers in Science Advances. The area shown in the images is 38 miles wide.
NASA Goddard/Intuitive Machines/Robert Wagner
Officially named McGetchin after pioneering lunar scientist Tom McGetchin, the crater formed on the Moon’s eastern edge sometime between April 11 and May 22, 2024, after a comet or asteroid the size of a three- to six-story building hit the surface.
The crash left a crater, 728 feet wide, that spans the length of two football fields. And at 141 feet deep, the crater could fit three vertically stacked yellow school buses.
Scientists estimate that an impact of this magnitude happens on the Moon about once in a century or even longer.
Moon takes some hits
For more than 17 years, LRO has been circling the Moon and using its seven instruments to map the topography, surface composition, temperature, and radiation environment there. The spacecraft’s team has identified at least 1,000 new impact craters throughout the mission and flagged 100,000 more surface changes from an object smashing into the Moon or from the debris that flung out after.
With no atmosphere to slow them or burn them up, space rocks and other objects easily reach the lunar surface. Most are much smaller compared to the object that carved out McGetchin crater. The smallest craters scientists can distinguish from LRO images are about 30 feet wide, the length of a three-story building laid on its side, made by rocks about 43 inches wide, the size of a monster-truck tire. Scientists estimate that impacts of this scale produce about 140 new craters across the Moon each year. But most new ones are made by microscopic projectiles that leave holes too small to identify in orbital images.
With its numerous instruments, the spacecraft can observe changes to the lunar surface that aren’t apparent in the LROC images alone. After the crater was discovered, scientists working with LRO’s thermal instrument, Diviner, made follow-up observations of the site. They found a 4-mile-wide area around the crater that is about 16 degrees Fahrenheit cooler at night than its surroundings.
This animated image set shows an area on the eastern limb of the Moon before and after McGetchin crater formed there sometime between April 11 and May 22, 2024. The post-impact image was constructed using data taken by NASA’s Lunar Reconnaissance Orbiter (LRO) thermal instrument, Diviner, between Nov. 15, 2025, and Feb. 18, 2026, after scientists discovered the crater in visible-light images taken by LRO’s Wide-Angle Camera. Pre-impact temperatures are from the Diviner Global High-Resolution Mosaics (GHRM). The crater formed on the Moon after a comet or asteroid, possibly the size of a six-story building, hit the surface in a rare, once-in-a-century collision. The dark blue strip that flashes into view reveals a 4-mile-wide “cold spot” around the crater that is about 16 degrees Fahrenheit cooler at night than its surroundings. This cooling happens because an impact fluffs up regolith around a crater, making it less dense and therefore less able to retain heat. Scientists on the Diviner team reported this finding in a paper published on Sept. 16, 2026, in Science Advances. The red and yellow spots indicate areas typically associated with rocks excavated by long-ago impacts which, though still at cryogenic temperatures like their surroundings, remain slightly warmer at night.
NASA Goddard/UCLA/JHU APL
Reporting in a second paper Wednesday in the same journal, researchers say that the cooling happens because the impact fluffs up the regolith around the crater, making it less dense and therefore less able to retain heat.
The large extent of this “cold spot” is striking, scientists say, because it shows that impacts can modify the Moon’s surface far beyond the crater itself. These physical changes could affect how rover wheels interact with the surface, for instance.
A global view of the Moon made by stitching together hundreds of images from the Wide-Angle Camera aboard NASA’s Lunar Reconnaissance Orbiter (LRO). Robert Wagner, image processing specialist for LRO, made this map using two sets of mages taken several years apart. He used a software designed to highlight any changes between the two sets. Anything that stayed the same turned gray; anything different showed up as bright or dark patches. A black arrow just left of center points to McGetchin crater.
NASA Goddard/Intuitive Machines/Robert Wagner
Road to discovery
The LROC system collects images from about 60 miles above the Moon as LRO loops from pole to pole. The system includes two cameras that capture high‑resolution black‑and‑white images and one camera for moderate‑resolution multispectral images. Over the years and thousands of passes, scientists have built maps detailed enough to spot not only new craters, but also landslides, landers, seismic faults, and even hints of lava tubes.
LROC scientists regularly analyze close-up images of small portions of the Moon’s surface taken by the Narrow-Angle Camera. Using these images, they look for changes that are typically less than 30 feet across. But every few years the team searches for large (wider than 150 feet) features by creating global Moon maps and comparing them to older versions.
An overhead, close-up view of McGetchin crater that was taken on Dec. 5, 2025, by NASA’s Lunar Reconnaissance Orbiter (LRO) Narrow-Angle Camera (NAC). After the crater was discovered on Oct. 24, 2025, in global images from LRO’s Wide-Angle Camera, which captures broad views with pixels the size of American football fields, scientists turned to the NAC, which takes much sharper views at about 3 feet per pixel. The NAC images, taken as LRO flew over the impact site again, revealed the crater size, shape, and how the surrounding terrain was affected by the impact that carved McGetchin. The image covers an area that’s ¾ mile wide.
NASA Goddard/Intuitive Machines
This view from the side (55° away from straight down) towards the east, covers an area of the Moon that’s about 1.5 miles wide. It was taken by NASA’s Lunar Reconnaissance Orbiter Narrow-Angle Camera on March 3, 2026.
NASA Goddard/Intuitive Machines
That’s what Wagner was doing on Oct. 24, 2025, when he came across McGetchin. Using images from LROC’s Wide-Angle Camera, which captures broad views with pixels the size of football fields, he stacked hundreds of “before” and “after” frames with software designed to highlight change. Anything that stayed the same turned gray while anything different showed up as bright or dark patches.
While the process sounds straightforward, spotting real craters requires a lot of manual work. The software flags every tiny shift in lighting or shadow, generating hundreds of false alarms. For this reason, Wagner typically verifies the software, looking for small fuzzy halos around pixel‑wide bright points, which indicate splashes of regolith around a new crater.
Spanning hundreds of pixels, McGetchin stood out immediately. “It was by far the most obvious impact debris pattern I’ve ever seen in one of these images,” Wagner said.
After his discovery, scientists turned to the Narrow-Angle Camera, which takes much sharper views at about 3 feet per pixel. This camera’s close-up images, taken as LRO flew over the impact site again, revealed the crater size, shape, and how the surrounding terrain was affected. These images also helped researchers estimate the size and force of the rock fragment that formed the new crater, details that are expected to appear in a future paper.
Banner image caption: A zoomed-in view of the Moon, with debris around McGetchin crater visible as a white spot circled by a dark halo just right of center of the image (marked with black arrows). This is the view that Robert Wagner saw on Oct. 24, 2025, during a routine data-quality check. Wagner is an image processing specialist for NASA’s Lunar Reconnaissance Orbiter Camera, a system of three cameras. Using images from the Wide-Angle Camera (WAC), which captures broad views with pixels the size of American football fields, he stacked hundreds of images captured by WAC over the last several years with software designed to highlight change. Anything that stayed the same is gray; anything that changed showed up as bright or dark patches. The stripes in the image are due to slight changes in lighting between the older and newer images. This image composite shows an area of the Moon approximately 900 miles across.
About the Author
Lonnie Shekhtman
Senior Science Writer
Shekhtman helps communicate NASA planetary science to the world through news and feature stories on NASA.gov, videos for NASA+ and YouTube, and by working with the media. She reports on lunar and Mars science and exploration; NASA’s search for life; missions to Venus, Titan, and Jupiter’s Trojan asteroids; and many other topics related to NASA’s exploration of our solar system and beyond.
Scientists discovered a crater on the Moon that formed sometime between April 11 and May 22, 2024, after a comet or asteroid the size of a three- to six-story building hit the surface.
The crash left a crater, 728 feet wide, that spans the length of two football fields. And at 141 feet deep, the crater could fit three vertically stacked yellow school buses.
My villain origin story is my Whoop age. How do you age at 0.9 times your age and end up four to five years older than you are? | Photo by Amelia Holowaty Krales / The Verge
This is Optimizer, a weekly newsletter sent from Verge senior reviewerVictoria Song that dissects and discusses the latest gizmos and potions that swear they're going to change your life. Opt in for Optimizer here.
During last week's Apple Watch announcement, I let out a distinct "Noooo!" in the Steve Jobs Theater. Along with a new readiness metric and a redesigned Health app, Apple had just announced that later this year, it'd be introducing a new longevity feature called Health Age.
This is a familiar concept in the wearable and health tech world. The idea is that if you put effort into your health and fitness, your physiological age c …

 Login