During early calibration tests, the MOTHRA telescope’s array of lenses, which will soon number 1,140, captured stellar debris dissolving into space around the Helix Nebula.
Thanks to the Hubble Space Telescope, astronomers have shed light on a recent chapter in the history of our Milky Way's neighboring galaxy, Andromeda.
Using Hubble Space Telescope observations of Andromeda's stars, a research team showed that the spiral galaxy's rate of making new stars has dramatically slowed down in the last 40 million years. And they've found more evidence that one of Andromeda's own neighbors — a smaller galaxy called M32 — may be to blame.
"We can't explicitly say that we are seeing a decrease in star formation because of M32. But it's right there, and it's definitely the most likely suspect," said Tobin Wainer, a graduate student at the University of Washington and one of the astronomers, in a statement.
Astronomers like Wainer knew from prior research that Andromeda saw a burst of star formation about 2 billion years ago (possibly as a result of a collision with an unknown galaxy). They also knew that star formation had slowed down since then. What they did not know was how quickly that deceleration had been. If they could find out, they could fill in some of the gaps in Andromeda's history.
At 2.5 million light-years' distance, Andromeda is near enough to Earth that Hubble can measure its stars. In the past several years, Hubble has conducted twosurveys of Andromeda. While Hubble can only make out stars in Andromeda that are brighter than our sun, these two surveys still gave Wainer and colleagues a compendium of 200 million stars, covering two-thirds of Andromeda's disk.
Wainer and colleagues parceled out this vast space into a grid of squares, 300 light-years to a side. They reconstructed the history of each square by examining the colors of its stars.
A square with many bright blue stars, for example, probably saw a lot of star formation recently, since blue stars tend to be younger. On the other hand, if a square only contains smaller, redder stars, we know those stars are longer-lived and older, and that square probably hasn't seen a lot of newborn stars.
The astronomers mapped out a story of slowing star formation. Around 500 million years ago, on average, Andromeda turned the equivalent of our sun's mass in gas and dust into newborn stars each year. As millions of years passed, that rate declined. About 40 million years ago, it was about one-half the sun's mass each year. Then, it tilted into a dramatic deceleration. Today, it stands at about one-fifth the sun's mass each year.
The Andromeda galaxy, M31, with satellite galaxies M32 (center left) and M110 (lower right). (Image credit: S. Ozime)
Curiously, they found that Andromeda's starmaking slowdown is especially pronounced on one particular side of the galaxy, starting about 60 million years ago. Astronomers know this side of Andromeda is closest to another galaxy: M32.
Astronomers have eyed M32 with suspicion for some time now. M32 is only located about 16,000 light-years from Andromeda (Andromeda is formally called M31) and it looks like the rump core of a spiral galaxy that lost its arms. It's possible that this is actually the aftermath of a collision between M32 and its larger neighbor. It's possible, though not confirmed, that Andromeda's slowing bears the fingerprints of this collision.
We may not need to wait long for more answers. Just as Hubble can see Andromeda's stars, so too will the Nancy Grace Roman Space Telescope, set to launch in late August. In the coming years, Roman will be able to measure even more of Andromeda than Hubble has.
Editor’s Note:Astrobites is a graduate-student-run organization that digests astrophysical literature for undergraduate students. As part of the partnership between the AAS and astrobites, we occasionally repost astrobites content here at AAS Nova. We hope you enjoy this post from astrobites; the original can be viewed at astrobites.org.
Galaxies emit light not only in the visible band, but also across other wavelengths via different physical mechanisms. Finding correlations between emissions at different wavelengths is a powerful tool for astrophysicists to explore the underlying mechanisms of galaxy formation. One of the most famous examples is the infrared–radio continuum correlation, which holds across several orders of magnitude in luminosity.
The typical explanation for this correlation is that both infrared light and radio synchrotron emission share the same energetic origin: star formation. Young stars emit ultraviolet radiation, which is absorbed by interstellar dust and re-radiated in the infrared. When these stars end their lives in core-collapse supernovae, the resulting shock waves accelerate cosmic-ray electrons, which then interact with the magnetic field to produce synchrotron emission.
For this correlation to hold, cosmic-ray electrons must radiate away all their energy within the galaxy, unable to escape and carry away some of their energy. Otherwise, the amount of radio emission would depend on how quickly cosmic rays escape and would no longer correlate with the infrared emission. This assumption is called the “electron calorimeter” model, which assumes that electrons lose all their energy due to radiation without escaping the galaxy. However, observations show that the infrared–radio correlation persists even in low-density galaxies where cosmic rays can easily escape, suggesting that the calorimeter model may not be the full story. To reconcile this, previous studies proposed “conspiracy-like” scenarios in which cosmic-ray injection, transport, magnetic-field amplification, and gas density are all coupled in a finely self-regulating way to maintain the correlation across diverse galactic environments — a somewhat awkward explanation that requires multiple unrelated physical processes to conveniently work together.
With the increased sensitivity of the Fermi Large Area Telescope, high-energy gamma-ray (or γ-ray) detections add new information to this picture. A galaxy’s γ-ray emission is produced by two different sources: cosmic-ray protons interacting with the interstellar medium gas, and cosmic-ray electrons inverse-Compton scattering off of nearby starlight or photons from the cosmic microwave background. Since both processes involve cosmic rays, the total γ-ray emission should also reflect the amount of star formation and therefore correlate with infrared and radio emission.
Because all three wavelengths trace different pieces of the same cosmic-ray population, studying them together reveals how the galaxy’s total cosmic-ray energy budget is distributed across its multi-wavelength emission.
The infrared–radio correlation has been established not only at the scale of entire galaxies, but also locally, down to patches roughly 100 parsecs across. Think of it like the relationship between a city’s electricity consumption and its population: we have long known they track each other city-wide, but it turns out the same relationship holds block by block. The infrared–radio correlation works the same way: zoom into any 100-pc region within a galaxy, and the correlation is still there. Unfortunately, the resolution of γ-ray observations is still stuck at around the kiloparsec scale. It is therefore unclear whether the local infrared–radio correlation reflects a genuine local physical coupling, one that would extend to γ-rays if we had sufficient resolution, or whether it is simply a spatial average of the emission, smoothed out by insufficient resolution. The answer determines whether radio and γ-ray emission can be used as reliable tracers of star formation, or whether they are just smeared out by cosmic-ray propagation over kiloparsec scales.
In this study, the authors numerically model galactic cosmic-ray transport, building a suite of physically motivated three-dimensional models of the Milky Way. They consider two variants for each of the four key inputs: 1) the cosmic-ray source distribution, 2) the interstellar gas, 3) the amount of starlight within the galaxy (the interstellar radiation field), and 4) the galactic magnetic field. Crucially, every model is normalized to reproduce the locally observed cosmic-ray data to within 5%, so that any differences in the predicted emission come purely from the large-scale geometry of each input, rather than from variations in the total cosmic-ray budget.
After evolving cosmic-ray transport for these realistic models, the authors then compute synthetic observations at radio, infrared, and γ-ray bands from various viewing inclinations to investigate how the underlying galactic model and the viewing angle affect the correlations between these emissions.
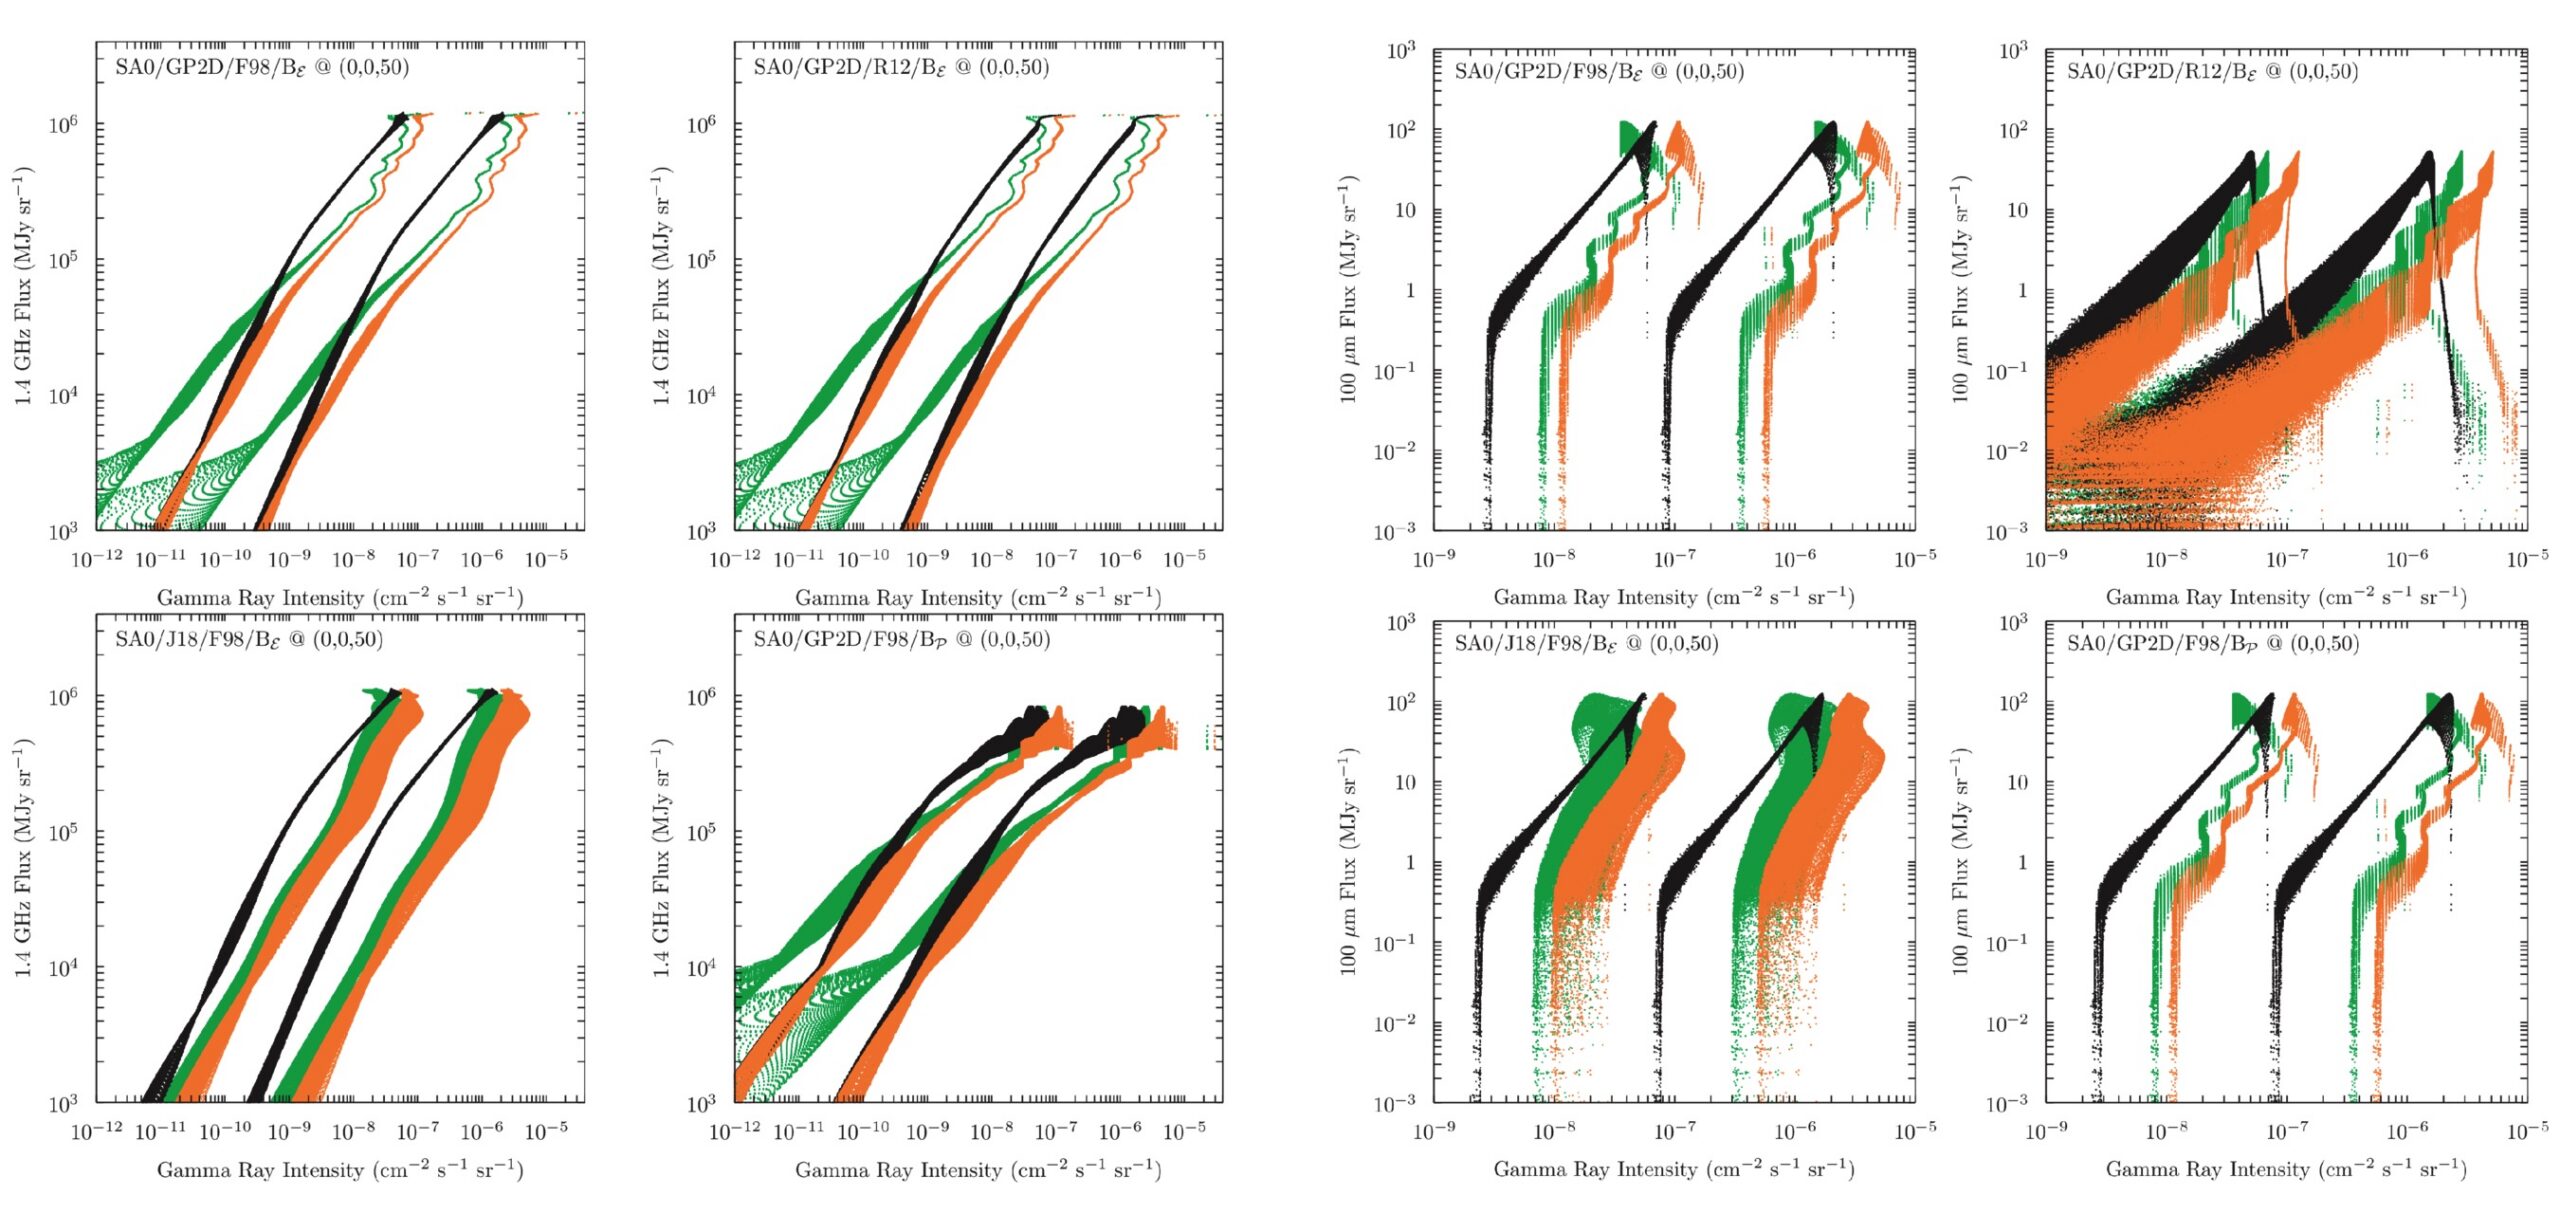
Surprisingly, inclination plays the most important role — more so than the cosmic-ray source distribution, the radiation field, or the magnetic field. Figure 1 shows the correlation plots between the radio and γ-ray emission (left two columns) and between infrared and γ-ray emission (right two columns) when viewing the galaxy face-on (i.e., viewing the galaxy from directly above the disk). Different colors represent γ-ray emission components from different physical mechanisms, with orange showing the total γ-ray emission. For both sets of correlation plots, starting from the upper-left panel, each panel modifies one physical input and recomputes the emission. Although there is some variation, one can see that the γ-ray emission correlates with both the radio and the infrared emission over several orders of magnitude, regardless of the underlying input model.
Figure 1: Radio (left two columns) and infrared (right two columns) vs. γ-ray correlation plots for a galaxy viewed face-on from 50 kpc. Each panel modifies one input — the cosmic-ray source distribution, gas, radiation field within the galaxy, or magnetic field — relative to a baseline model. Colors indicate γ-ray production mechanisms (green: proton–gas; black: inverse-Compton; orange: total). Across all variations, both the radio–γ-ray and infrared–γ-ray correlations remain quasi-linear over several orders of magnitude, showing that the correlations are robust to the choice of underlying galactic model. [Adapted from Porter et al. 2026]
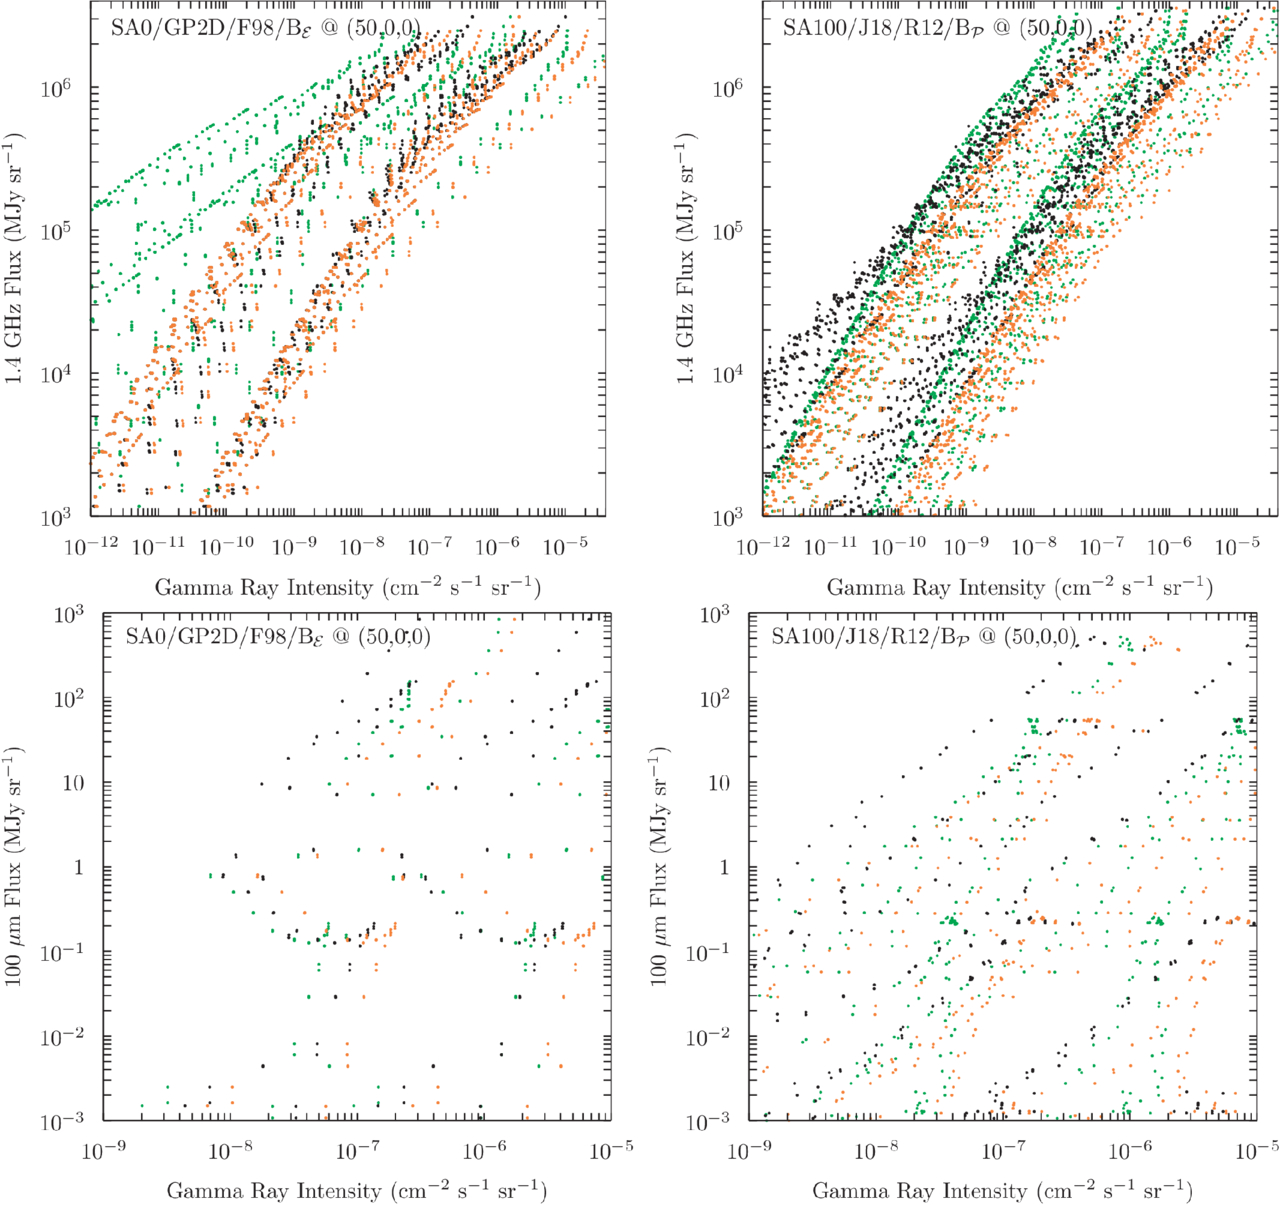
In contrast, Figure 2 shows the correlation plot between radio and γ-ray emission (upper panels) and between infrared and γ-ray emission (lower panels) when viewing the galaxy edge-on (viewing the disk from the side). The radio–γ-ray correlation is preserved, while the infrared–γ-ray correlation is no longer observed. This is because, at this inclination, geometric projection separates the emission components. Infrared-emitting dust and γ-ray emission from cosmic ray–interstellar medium interactions are confined to the disk, while synchrotron radio emission and γ-ray emission from inverse-Compton scattering extend to larger distances above and below the disk. As a result, in an edge-on view, a sight line passing through the disk sees strong infrared emission, while a sight line that misses the disk sees zero infrared but still some γ-ray emission, breaking the infrared–γ-ray correlation. On the other hand, because radio emission is more extended than infrared emission, sight lines that miss the disk can still see both radio and γ-ray emission together, preserving the radio–γ-ray correlation.
Figure 2: Correlation plots for two galaxy models viewed edge-on from 50 kpc — simple axisymmetric (left) and complex with spiral arms (right). Top: radio vs. γ-ray; bottom: infrared vs. γ-ray. Colors indicate γ-ray production mechanisms (green: proton–gas; black: inverse-Compton; orange: total). The infrared–γ-ray correlation breaks down, while the radio–γ-ray correlation is broadened but partially preserved. [Porter et al. 2026]
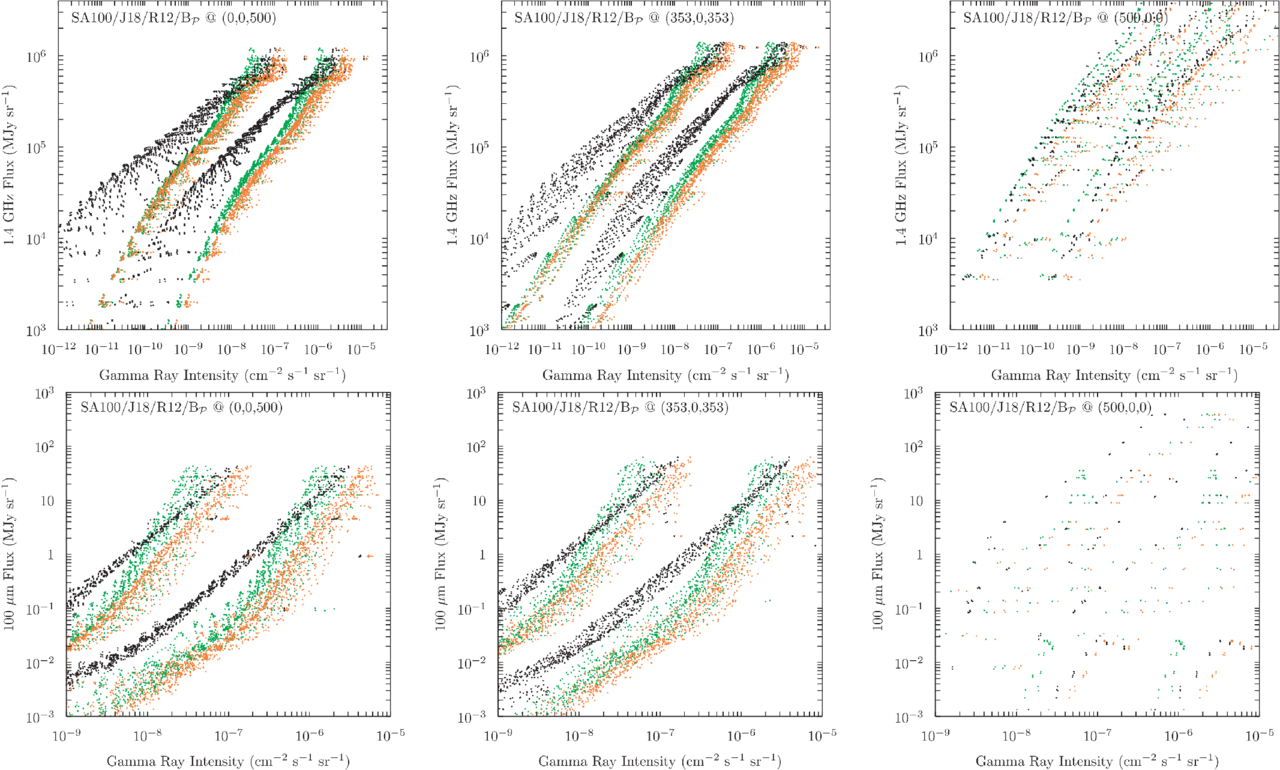
However, there is one situation where the edge-on correlation comes back: when the observer is far enough away that the image becomes too blurry to resolve the galaxy’s internal structure. Figure 3 shows the same galaxy model viewed from 500 kpc, roughly the distance to Messier 31, our nearest large neighbor. At this distance, a single pixel in the image covers about 1 kpc, large enough for everything along the line of sight. The messy, broken-up pattern seen in the closer 50 kpc edge-on view (lower-right panel of Fig. 2) disappears, and a tight, nearly linear correlation comes back. This explains why nearly all distant, unresolved galaxies show tight radio–infrared–γ-ray correlations: the tightness is simply what you get when you blur everything together, not evidence that cosmic rays are actually losing all their energy locally inside those galaxies.
Figure 3: Correlation plots from a complex galaxy model viewed from 500 kpc, at three different inclinations (face-on, 45°, edge-on). Top row: radio vs. γ-ray; bottom row: infrared vs. γ-ray. Colors indicate different γ-ray production mechanisms (green: proton–gas; black: inverse-Compton; orange: total). At this distance, the blurring effect of large pixels restores a tight correlation even in the edge-on view. [Porter et al. 2026]
Now we have a consistent picture of the radio–infrared–γ-ray correlation: the authors conclude that this correlation is not a direct signature of cosmic-ray calorimetry, but a geometric projection effect. In face-on systems, a single sight line integrates emission from both the disk and off-disk regions, naturally producing a linear correlation, even when cosmic rays do not lose all their energy locally to radiation (i.e., local calorimetry is absent). In edge-on systems, the correlation breaks down because geometric stratification separates the different emission components. The practical implication is significant: for unresolved galaxies, the tightness of the global correlation alone cannot be used as evidence for cosmic-ray calorimetry, and the physically meaningful information about cosmic-ray transport and escape efficiency is encoded in the scatter around the mean trend, not in the correlation itself.
Original astrobite edited by Kelsie Taylor.
About the author, Sandy Chiu:
I’m a PhD candidate at the University of Michigan, Ann Arbor. I’m interested in numerical simulations of cosmic rays feedback in galaxies and their comparison with observation.
Editor’s Note:Astrobites is a graduate-student-run organization that digests astrophysical literature for undergraduate students. As part of the partnership between the AAS and astrobites, we occasionally repost astrobites content here at AAS Nova. We hope you enjoy this post from astrobites; the original can be viewed at astrobites.org.
Look at an image of the sky taken with a sufficiently sensitive telescope, and you’ll quickly notice that galaxies tend to cluster into two main types: blue spiral galaxies, which have flat disk shapes with a central bulge, and red elliptical galaxies, which look like spherical or elliptical balls of red stars. Blue spiral galaxies can form tens to hundreds of stars every year, while elliptical galaxies have completely stopped forming stars, meaning that some process has to transform star-forming spirals into non-star-forming, or “quiescent,” elliptical galaxies. To form the current population of massive elliptical galaxies, this process had to be common about 2–3 billion years after the Big Bang at “cosmic noon,” the period when star formation in the universe peaked. The processes that “quench” star formation in massive galaxies are still being studied, and one of the best ways to study them is to find galaxies that recently quenched and look for clues about the processes that quenched them.
Post-starburst galaxies are galaxies that have rapidly quenched after a short burst of star formation. Because these galaxies quenched so quickly and so recently, it’s often possible to find signs of whatever quenched them, like the signatures of past galaxy mergers, feedback from supermassive black hole accretion, or the shutoff of gas flowing into the galaxy. Rapid quenching is pretty uncommon now, but it was a much more common way for galaxies to quench at cosmic noon. Understanding post-starburst galaxies at cosmic noon is therefore critical for understanding the formation of massive elliptical galaxies in the local universe.
The Quest for Quenched Galaxies
Today’s article uses data from the JWST Early eXtragalactic Continuum and Emission Line Survey (EXCELS) to identify post-starburst galaxies at cosmic noon and try to determine why they quenched. EXCELS is a spectroscopic survey, so the authors get a spectrum for every galaxy. The spectrum encodes information about the galaxy’s stellar population, including the mass of stars in the galaxy, the number of stars forming every year, and the history of star formation throughout the galaxy’s life.
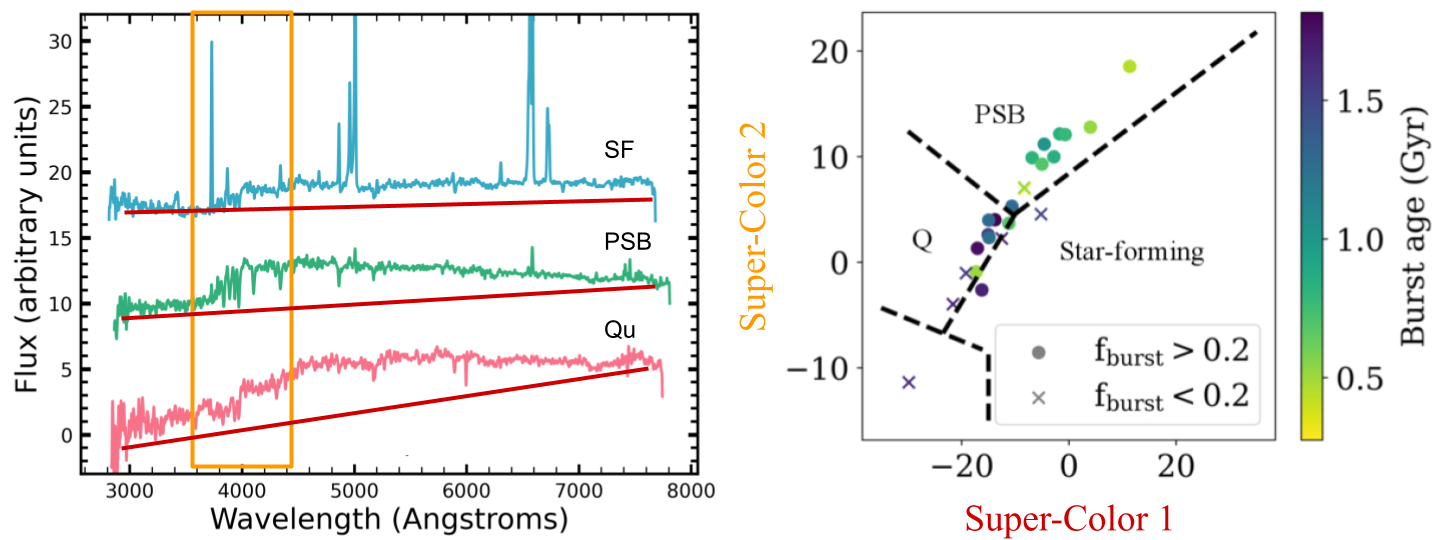
The authors use a technique called principal component analysis to further divide the sample into young and old post-starbursts. Principal component analysis is a machine-learning technique that learns the most important features of a data set. This technique is used for “dimension reduction,” or reducing the number of data points needed to learn something about the object. A typical spectrum has hundreds or even thousands of data points, which means performing data analysis on a spectrum can be very computationally expensive. Principal component analysis takes these thousands of data points and learns broad patterns that correlate with each other. These patterns are called “supercolors” in the context of spectral data, and they encode things like the overall shape and color of the spectrum as well as the spectral shape around key features (see Figure 1 for a visualization). Since the overall shape, color, and emission/absorption line features of a spectrum come from the galaxy’s stellar population, this method can be used to identify galaxies with lots of star formation a billion years ago but very little star formation today — in other words, post-starburst galaxies.
Figure 1: An example of principal component analysis for sample star-forming (SF), quiescent (Qu), and post-starburst (PSB) galaxy spectra (left-hand side). Principal component analysis simplifies a many-dimensional data set (for example, spectra) into fewer dimensions. In this case, Super-Color 1 measures the overall color of the spectrum (shown on the left-hand side as the slope of the spectra, marked with red lines), while Super-Color 2 measures the shape of the spectrum around 4,000 angstroms (orange box). The authors use principal component analysis to identify post-starburst galaxies for further analysis (right-hand side). [Adapted from Skarbinski et al. 2026]
The authors apply principal component analysis to the galaxies in their sample and find that 11 of the galaxies in their sample are classified as post-starburst, 9 are quiescent, and 4 still have some star formation. To further analyze the stellar populations of the post-starbursts in their sample, the authors use a program called Bagpipes to fit the galaxies’ spectra. Bagpipes is a spectral energy distribution fitting software, which means that it takes the observed spectrum of a real galaxy and tries to match it to a library of different stellar spectra. By measuring the relative contribution of different kinds of stars (which all have different lifetimes), Bagpipes can compute the likely history of star formation in the galaxy (e.g., when the star formation rate peaked) as well as the present-day properties of the galaxy (things like the mass in stars versus dust and the current star formation rate). The authors use the galaxies’ star formation histories to try to find clues as to how they quenched.
How Quickly Do Post-Starbursts Quench?
First, the authors measure something called a “quenching timescale,” which they define as the length of time between when the galaxy’s star formation rate peaked and when it fell low enough that the galaxy was quenched. The quenching timescale depends on which process shut down star formation in the galaxy — feedback from black hole accretion or star formation should cause fast quenching, while galaxies that are starved of gas from the intergalactic medium should quench more slowly. The authors find that 15 of their galaxies quenched in under 500 million years, 6 took between 500 million and 1 billion years, and 3 took longer than 1 billion years to quench. The galaxies that had the highest peak star formation rates quenched the fastest, suggesting that feedback from star formation could have played a role in quenching these galaxies.
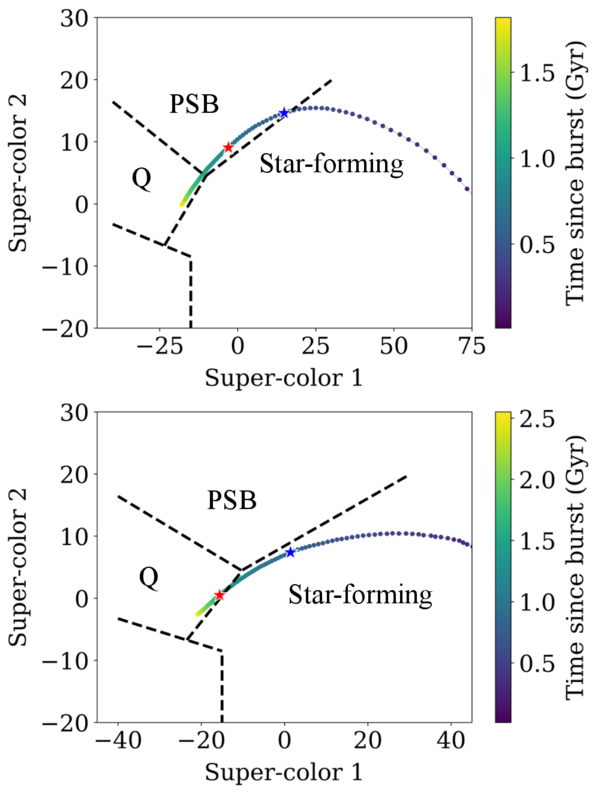
Figure 2: Possible evolutionary tracks in supercolor for two example galaxies as they quench. The galaxy in the top panel quenches quickly and has post-starburst supercolors for about a billion years, while the galaxy in the bottom panel quenches without ever going through the post-starburst phase. The authors use these tracks to determine how important the post-starburst phase is for quenching massive galaxies. [Skarbinski et al. 2026]
Next, the authors measure how important the post-starburst phase is to form massive quiescent galaxies. Not all galaxies that quench go through a post-starburst phase; some objects, especially those that quench slowly, will transition directly from star forming to quiescent. The authors use the star formation histories from their spectral energy distribution fits to predict how the galaxies’ supercolors changed after their star formation peaked (Figure 2) and find that six of the nine quiescent galaxies went through a post-starburst phase in the past, while the other three did not. For the objects that went through a post-starburst phase, the median time spent as a post-starburst was around 600 million years.The authors can use this measured “visibility timescale” to constrain whether the post-starburst phase is important for forming massive quiescent galaxies. If the fraction of post-starburst galaxies in a sample is high, that can be for two reasons: either a larger fraction of galaxies will eventually go through a post-starburst phase, or the post-starburst phase is very long, making it easy to find post-starburst galaxies. Using the measured timescale of 600 million years and combining with results from another article, the authors find that 40% of quiescent galaxies likely went through a post-starburst phase; for the more massive end of the sample, this fraction increases to around 73% due to the shorter visibility timescale. This suggests that the post-starburst phase is very important for forming the kind of massive quiescent galaxies we see in the local universe.
While the post-starburst phase is important, the different quenching timescales present across the sample suggest that multiple pathways existed to quench galaxies at cosmic noon, similar to what has been found in less-distant galaxies and at cosmic noon in othersamples. This is also supported by the fact that four of the five galaxies with sufficient data show evidence of an actively accreting supermassive black hole that may help shut down star formation in many (but perhaps not all) massive galaxies. While the precise processes that quench massive galaxies are still uncertain, one thing is clear: JWST EXCELS at solving the mystery!
Original astrobite edited by Anavi Uppal.
About the author, Margaret Verrico:
I am a fourth-year graduate student at the University of Illinois Urbana-Champaign. I study the connection between supermassive black hole transients and their host galaxies. I am also an avid knitter and reader, and I am passionate about opening up STEM opportunities for people of all backgrounds.
Star formation in the nearby Andromeda Galaxy (M31) has been slowing down over the last 500 million years, according to a new study using Hubble Space Telescope data. The study was published July 27, 2026, in The Astrophysical Journal. Lead author Tobin Wainer, an astronomer at the University of Washington, and his team used dataContinue reading "Andromeda’s star formation is slowing down"
Les trous noirs supermassifs qui font évoluer les galaxies nous réservent sans aucun doute des surprises. La dernière en date concerne maintenant les amas de galaxies et leurs interactions avec ces astres compacts géants.
The Milky Way's spiral disk may have flipped over by 90 degrees, in turn altering the solar system's orbit around the center of the galaxy.
Spiral galaxies such as the Milky Way have two main, visible, structural components: a disk that encapsulates most of its stars, gas and the central black hole, and a more diffuse halo of older stars that encapsulates the disk.
However, the Milky Way's stellar halo has always been a bit of an oddity. The European Space Agency's Gaia mission measured the motion of the halo's stars to find they rotate slowly compared to other material within the spiral disk. Now, supercomputer models led by Kirill Batrakov of the University of Durham have found what triggers this: galactic mergers and spiral disks becoming flipped over.
In their simulations, Batrakov and colleagues tracked the evolution of 25 Milky-Way-like galaxies across billions of years. They found that those which had slowly spinning haloes also experienced head-on mergers with other galaxies and had their disk flipped at some point.
"We already know that the Milky Way had a massive head-on collision in the past with a galaxy known as Gaia-Sausage-Enceladus," Batrakov said in a statement. "So, we think that the Milky Way disk likely flipped in the past."
Gaia-Sausage-Enceladus was a dwarf galaxy with more than 10 billion times the mass of our sun that slammed into the Milky Way between 8 billion and 11 billion years ago. The evidence for this collision was also found in Gaia's measurements of the motions of stars. The colliding galaxy's strange name comes in part because as it was ripped to pieces by the Milky Way's gravity, its stars were channeled onto highly elongated, sausage-shaped streams that our galaxy incorporated into its halo.
This collision was the last major impact that our Milky Way galaxy experienced, but maybe not the last major event that it experienced. At some point, the Milky Way's disk seems to have also flipped, but what caused this is uncertain. Also of note: The simulations showed that galaxies whose disks flipped hadn't always experienced a merger.
"We think that there might possibly be different mechanisms driving the disk flips," Batrakov told Space.com. "At this point, we are not sure which scenario applies to the Milky Way specifically and a further investigation is needed on the precise mechanics of disk flips."
These two mechanisms — the merger and the flip — would both contribute to the slower spinning halo. The head-on merger sees lots of stars from the Gaia-Sausage-Enceladus galaxy get thrown into the halo but on trajectories strongly misaligned with the disk. So, relative to the disk, they collectively rotate more slowly.
An example of the history of a simulated galaxy that has experienced a head-on merger and a disk flip (seen between redshifts – denoted by z – 1.4 and 0). (Image credit: Auriga Project)
The disk flip leads to a similar situation. In the simulations, the flip is measured with respect to the space around the galaxy, but as the orientation of the disk changes relative to the halo, the halo doesn't immediately reorient with it and takes its time to synchronize its rotation with the disk. Hence, this misalignment results in the halo having less coherent rotation relative to the new orientation of the disk.
If the disk flip occurred during the solar system's lifetime, then it could have impacted our own orbit around the galactic center.
"A disk flip means that most of the Milky Way's stars once moved on very different trajectories than they do today, possibly even our sun, meaning our 'stable' spot in the galaxy might not have been so stable for the solar system's whole lifetime," said Batrakov.
Much of what we understand about other galaxies comes from our knowledge of the Milky Way and its story.
"Finding that its disk flipped adds a new chapter to that story, one we must account for when placing the Milky Way in a broader context of other galaxies," said Batrakov, who recognizes just how incredible it is that we can infer this story through careful observations billions of years after the fact.
"What excites me most is that this complex history can be reconstructed just from present-day observations," he said.
Batrakov presented his work at the Royal Astronomical Society's National Astronomy Meeting, being held at the University of Birmingham between July 20 and July 24.
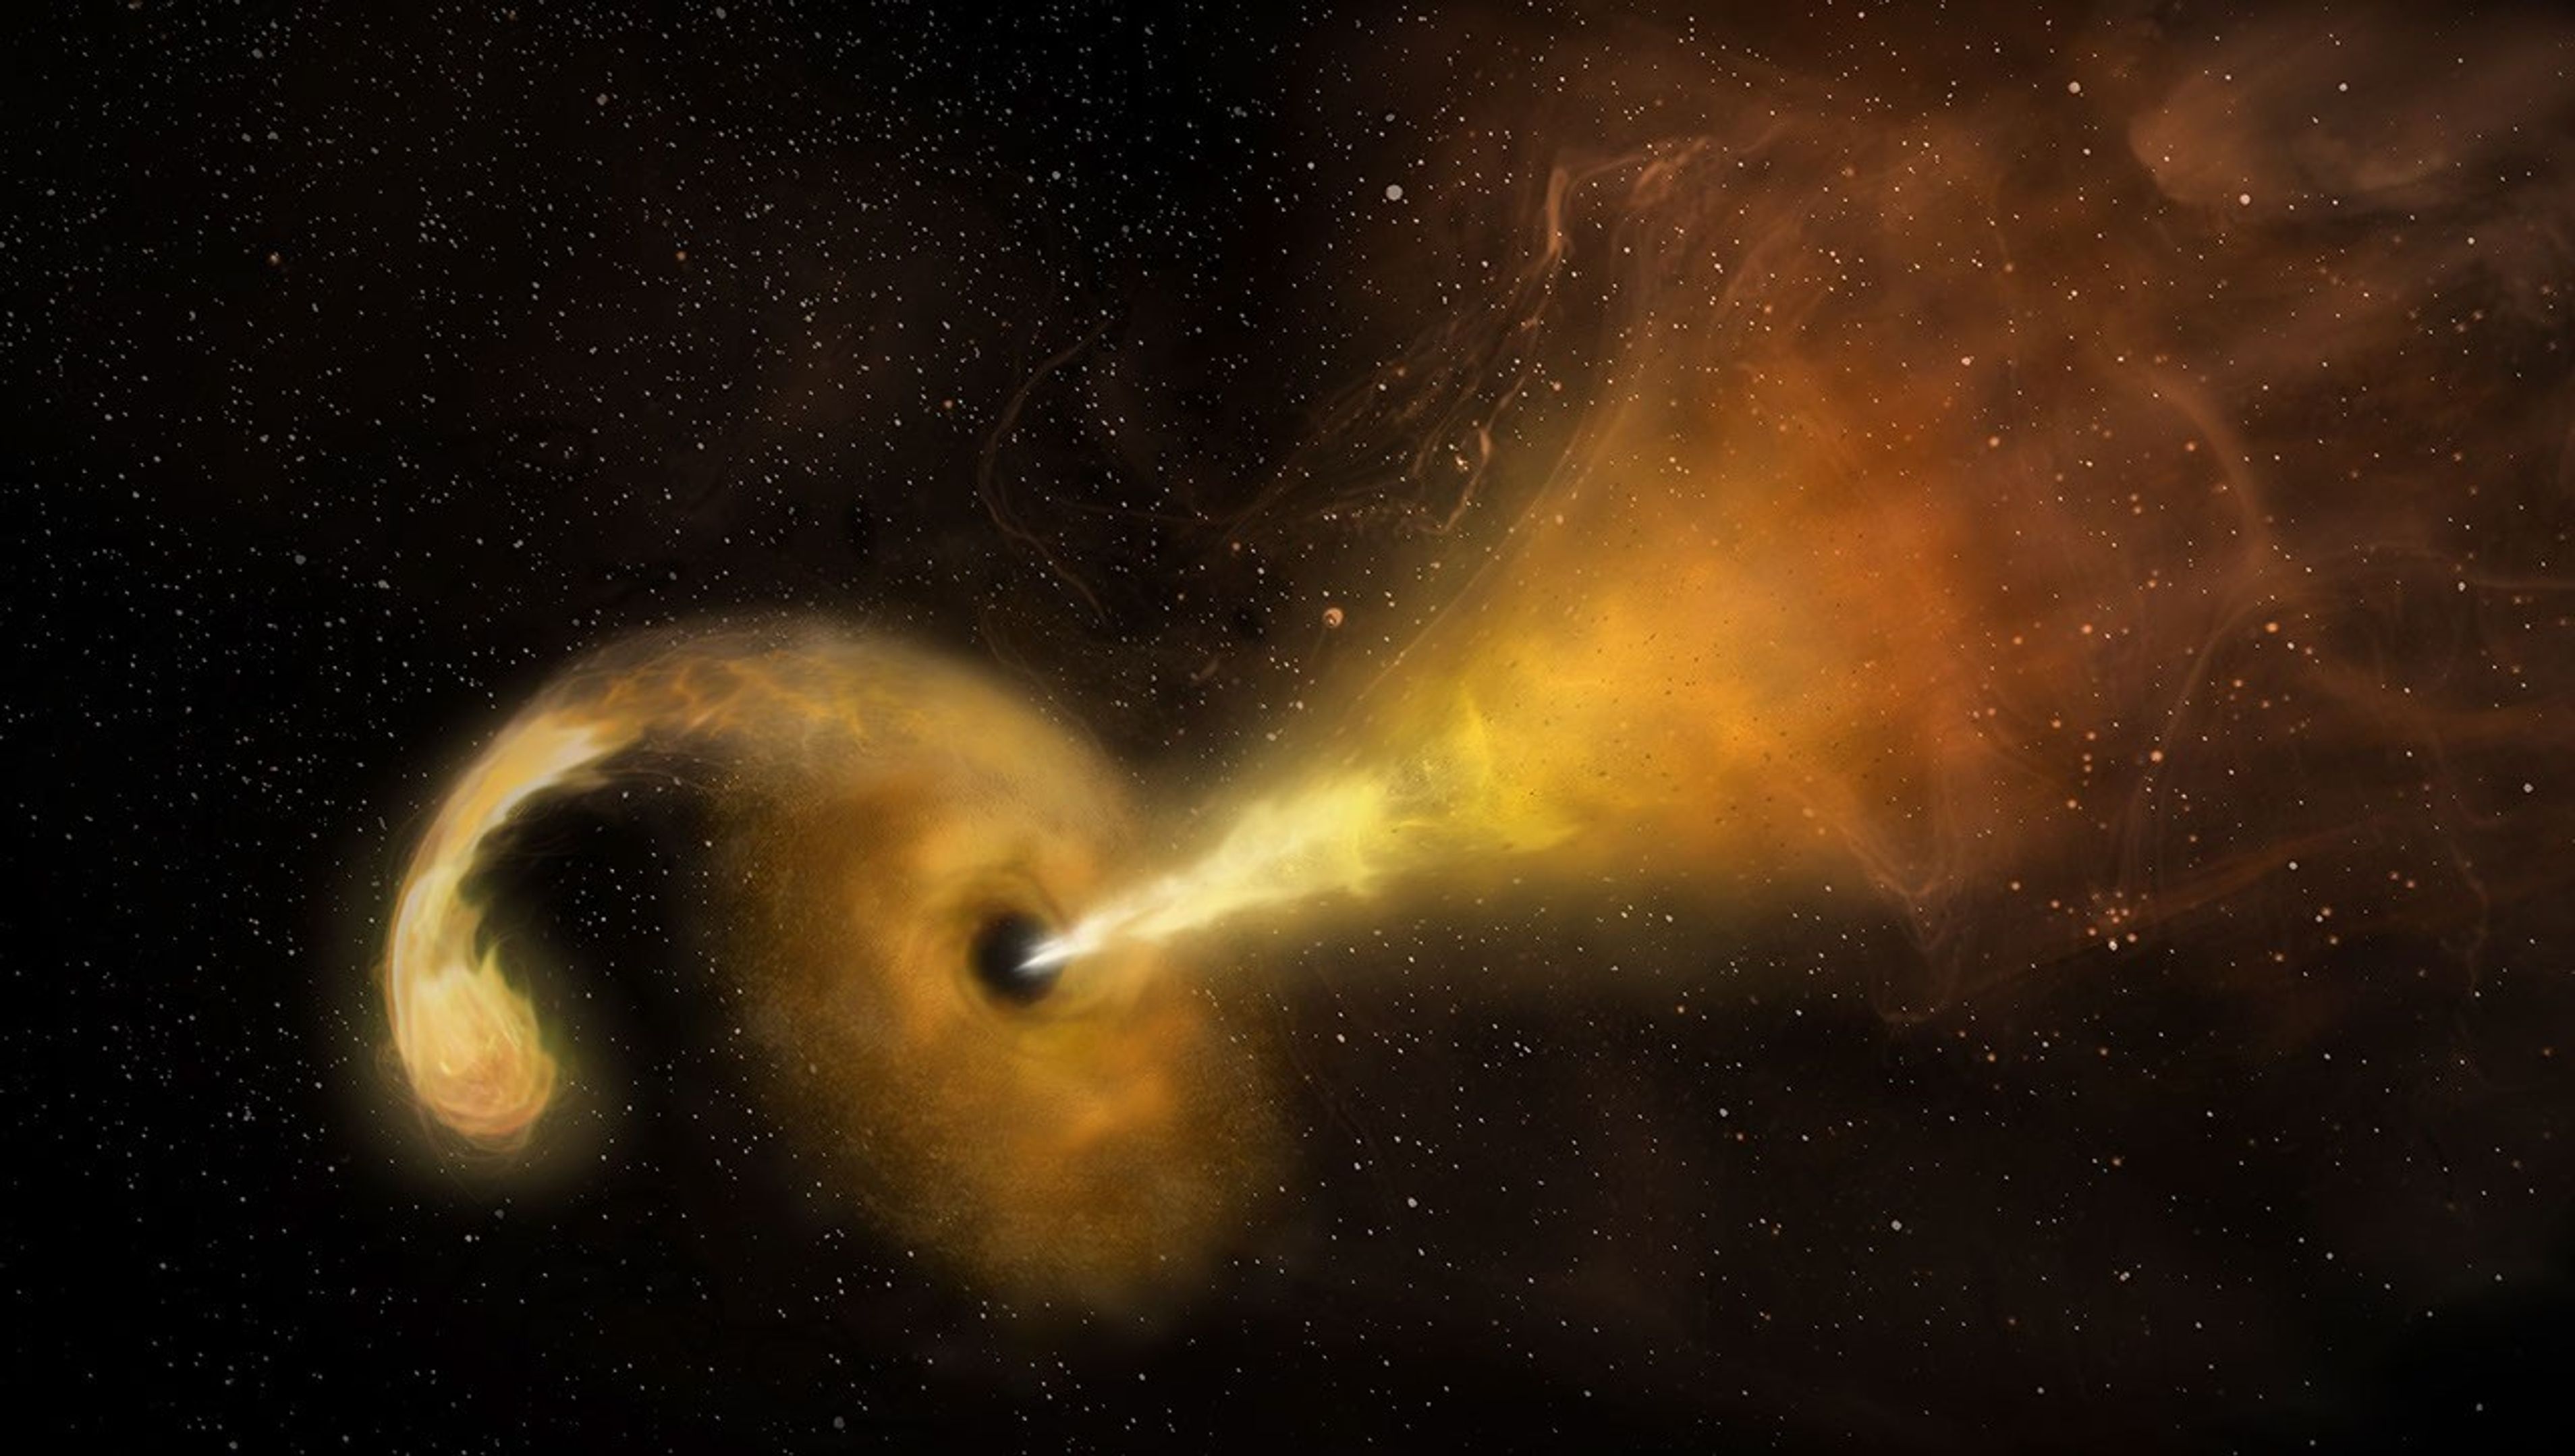
This artist’s concept depicts a tidal disruption event, which occurs when a star passes fatally close to a supermassive black hole. Crumbs of the splintering star heat up as they swirl around the black hole, creating a glow astronomers can see from far across the cosmos, and the black hole launches a relativistic jet into space.
NRAO/AUI/NSF/NASA
NASA’s Neil Gehrels Swift Observatory captured an “orphan” black hole lighting up as it devoured a star on the outskirts of a faraway galaxy. These phenomena are rare to begin with, and none had ever before been seen so far outside of a galaxy’s core.
“We were looking for these star-shredding events as a way to find otherwise invisible supermassive black holes wandering away from the galactic cores where they usually reside,” said Robert Stein, a research fellow at The University of Maryland, College Park and NASA’s Goddard Space Flight Center in Greenbelt, Maryland. “With this discovery, which is one of just a couple that have been confirmed so far, we’ve validated a new technique and can use it to hunt for more.”
A paper describing the results, led by Stein, was published Monday in The Astrophysical Journal Letters.
Researchers saw an ultrabright flare unleashed by a star being torn apart by extreme gravitational forces after drifting too close to a monster black hole — a phenomenon called a tidal disruption event. The black hole behind the blast weighs in at about a million times the Sun’s mass. Its existence was first flagged in November 2025 as an unusual brightening in a galaxy about 750 million light-years away by ZTF (Zwicky Transient Facility), a survey conducted by the Palomar Observatory in Southern California.
“Out of the half million flashes ZTF detects each night, our new artificial intelligence algorithm automatically recognized a flare that looked a lot like a tidal disruption event, despite its unusual location in the outskirts of a galaxy,” Stein said. For a few months, the tidal disruption event outshone its entire host galaxy in ultraviolet wavelengths, temporarily radiating with the light of about 10 billion suns.
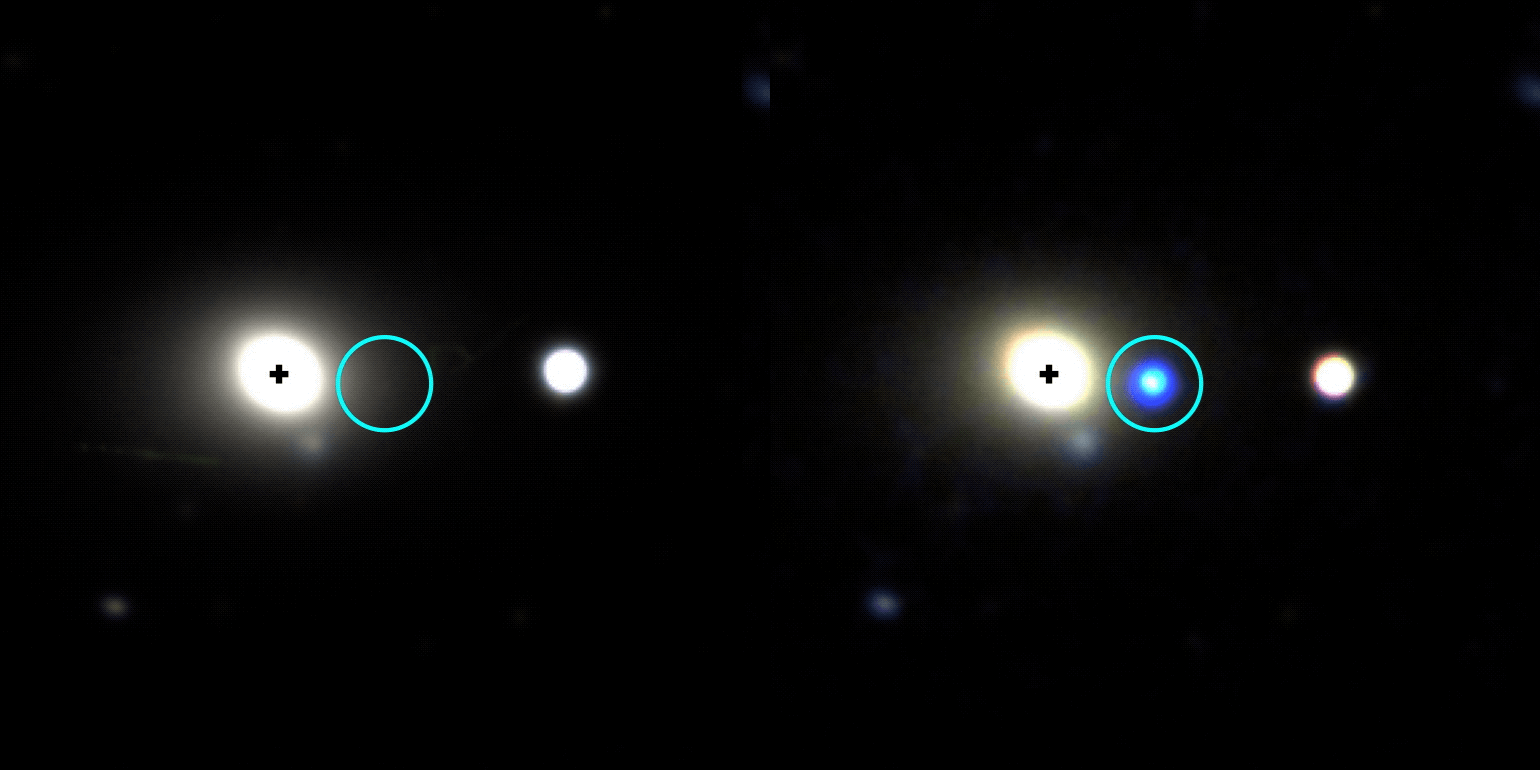
This gif shows the galaxy WISEA J014656.04-152214.7, located about 750 million light-years away in the constellation Cetus, before and after a tidal disruption event was spotted on its outer edge in November 2025. The image at left was taken by the DESI (Dark Energy Spectroscopic Instrument) Legacy Survey and the one at right is from the Lowell Discovery Telescope.
Other telescopes, including the SOAR (Southern Astrophysical Research) telescope in Chile, followed up on the ZTF source to look at the event’s spectrum, which revealed features supporting that it was likely a tidal disruption event. Astronomers then used NASA’s Swift to look at wavelengths they can’t detect with ground-based telescopes to uncover new information. For example, Swift’s UVOT (Ultraviolet/Optical Telescope) took the blip’s temperature and found that it had quite a fever at about 54,000 degrees Fahrenheit (30,000 degrees Celsius).
“The combination of all this data helped us rule out other explanations and confidently say it’s a tidal disruption event, despite its strange location,” said Jonathan Carney, a doctoral student at the University of North Carolina at Chapel Hill, who took the first spectra that supported the flare’s interpretation as a tidal disruption event.
Hidden heavyweights
Nearly every galaxy in the universe is anchored by a supermassive black hole sitting right in the center. About once every 100,000 years, a star will drift too close to this invisible heavyweight and trigger a tidal disruption event.
While they’re rather rare in any given galaxy, scientists scour millions of galaxies for them. Each year, astronomical surveys typically spot about 30 tidal disruption events occurring somewhere in the universe.
Prior to 2024, they’d only been seen in galaxy cores. That’s partly because astronomers mainly looked for them there; after all, it’s where all the known supermassive black holes were, and you can’t get a tidal disruption event without one (the gravitational pull of lighter black holes isn’t strong enough).
Then scientists saw the telltale signs of a star being shredded 2,600 light-years from the center of its host galaxy. That inspired more astronomers to look beyond galaxy cores for similar events, and now a team has identified one more than 30,000 light-years away from a galaxy’s center.
This video visualizes a star approaching a supermassive black hole so closely that it’s stretched to a breaking point by the black hole’s strong gravity. Intense tidal forces crack the star open and hurl its gaseous guts outward. Stellar debris forms a spinning accretion disk as it continues to spiral into the black hole.
NASA, ESA, STScI, Ralf Crawford (STScI)
Oddball origin story
So how did the newfound black hole become so off-kilter?
“It must have originated in a galaxy’s center, but not the one it’s in the outskirts of now,” Stein said. “We think the host galaxy’s supermassive black hole is still at its core, but the one eating the star could have started off in a small galaxy that merged with the big one we see today.”
The researchers have outlined two possibilities. Three or more galaxies may have merged together, and the gravitational tug-of-war between their central supermassive black holes may have flung the lightest black hole out to the galaxy’s edge.
Or a dwarf galaxy could be midway through a merger. As the dwarf’s stars fell into the larger galaxy, one may have passed too close to the dwarf’s supermassive black hole.
“Further discoveries could reveal the origin of this apparent ‘orphan’ black hole,” Stein said. “The key science question we want to answer is: How common are wandering black holes?”
The answer may soon be within reach. “Pointed science observations with Swift’s UVOT and XRT (X-Ray Telescope) instruments are temporarily suspended as the mission awaits an orbit boost, which is planned for this summer,” said co-author S. Bradley Cenko, Swift’s principal investigator at NASA Goddard. The spacecraft, whose primary mission ran from 2004 to 2006, is slowly sinking toward Earth due to atmospheric drag after more than 20 years of observations of the changing universe. Nudging it to a higher orbit could extend its lifetime even longer. “Once it resumes normal operations, Swift could continue searching for more examples of out-of-place black holes.”
In the coming years, scientists will use the new technique to search for disintegrating stars in observations from the newly operational Vera C. Rubin Observatory, jointly funded by the U.S. Department of Energy and National Science Foundation, in Chile and NASA’s upcoming Nancy Grace Roman Space Telescope.
“Rubin’s wide, deep surveys will reveal a much larger sample of tidal disruption events than current observatories are capable of collecting, including ones that are off-center,” Carney said. “And Roman’s space-based surveys will extend the current search zone by seeing ones that are farther away, looking back through 9 billion years of cosmic history.” Adding their observations to Swift’s and those from ground-based observatories will bring astronomers closer than ever before to completing a census of the universe’s behemoth black holes.
NASA’s Hubble Shows Star Formation in Andromeda Galaxy Winding Down
NASA Hubble’s view of part of the Andromeda galaxy.
Credits: Image: NASA, ESA, Benjamin Williams (UWashington), Zhuo Chen (UWashington), L. Clifton Johnson (Northwestern); Image Processing: Joseph DePasquale (STScI)
A new study using data from NASA’s Hubble Space Telescope finds that star formation in the nearby Andromeda galaxy has undergone a 500-million-year decline, with an even steeper drop in the last 40 million years. Andromeda, a spiral galaxy comparable in size to our Milky Way, is close enough to be seen with the unaided eye from areas with dark skies. Located about 2.5 million light-years from Earth, practically our cosmic backyard, Andromeda offers an opportunity for astronomers to examine its stellar populations in detail, leading to better understanding of the past of galaxies like our own.
To reach this conclusion, the researchers combined data from two Hubble surveys: the Panchromatic Hubble Andromeda Treasury and the Panchromatic Hubble Andromeda Southern Treasury. Together, these two surveys mapped two-thirds of the disk of Andromeda in ultra-sharp detail. In total, the team measured about 200 million individual stars across the galaxy, giving them a detailed picture of Andromeda’s past activity.
“We need to measure the individual stars because they are the fossil record of the galaxy’s formation. Hubble is the only telescope that can give you high enough spatial resolution over a large enough area to be able to do that in Andromeda,” said Ben Williams, astronomer at the University of Washington and a co-author on the study.
Massive stars are bluer and short-lived, while less massive stars are redder and longer-lived. As a result, areas that have experienced recent star formation tend to have a larger fraction of blue stars, while areas with less recent star formation typically have a redder population. The team divided the Andromeda images into thousands of squares, spanning 300 light-years on each side of the square, and determined the history of star formation within each parcel to gain a comprehensive view of the galaxy’s past.
NASA’s Hubble Space Telescope has provided a detailed view of millions of stars in the Andromeda galaxy. Regions that have experienced recent star formation (1) appear significantly bluer than regions with less recent star formation (2).
NASA, ESA, Benjamin Williams (UWashington), Zhuo Chen (UWashington), L. Clifton Johnson (Northwestern); Image Processing: Joseph DePasquale (STScI)
Steady decline
Previous research showed the Andromeda galaxy experienced a dramatic burst of star formation about 2 billion years ago, likely due to a past interaction or merger with another galaxy. Since that time, star formation has been steadily declining.
Astronomers measure the rate of star formation in terms of the mass, or amount of gas and dust, converted into stars per year. The researchers calculated that, 500 million years ago, Andromeda formed stars at a rate of about one solar mass per year. However, the formation rate dropped to about half that by 40 million years ago. The current rate has plummeted even farther, to about one-fifth the mass of our Sun per year.
The team also examined whether that decline was consistent across the galaxy or concentrated in certain areas. They found that much of the recent star formation has occurred in a star-forming ring located about 32,000 light-years from the galaxy’s center. As a result, much of the decline they measure is driven by decreasing activity within that ring.
Rather than being the result of reduced material from which new stars can form, the decline is more likely to be a natural winding down from its previous, more active state.
“It’s just like after running a marathon, sometimes you’ve got to take a bit of a breather,” said Tobin Wainer, lead author, University of Washington.
Likely suspect
The team also investigated whether there was any connection between the decrease of activity in Andromeda and its proximity to satellite galaxy M32 (Messier 32). The M32 galaxy is separated from Andromeda by about 16,000 light-years in the plane of the sky; however, its 3D location in space is uncertain. As a result, astronomers are unsure if or when it might have interacted with Andromeda in the past.
“One of the major motivations for this program was to probe potential interactions between M32 and Andromeda’s disk,” said Zhuo Chen, co-author, University of Washington.
Survey data from the Panchromatic Hubble Andromeda Southern Treasury allowed the team to study the history of star formation in Andromeda near M32. They found that this area showed signs of decreased star formation compared with other regions. The timing of this decrease, which this study finds began roughly 60 million years ago, could help constrain when the M32 galaxy interacted with Andromeda’s disk.
“We can’t explicitly say that we are seeing a decrease in star formation because of M32. But it’s right there, and it’s definitely the most likely suspect,” said Wainer.
This movie, created from an analysis of data from NASA’s Hubble Space Telescope, demonstrates how the rate of star formation in the Andromeda galaxy has declined over the past 500 million years. Brighter colors indicate where star formation was highest during a given time.
Visualization: Tobin Wainer (UWashington); Image Processing: Joseph DePasquale (STScI); Video: NASA, ESA, STScI, Gregory Bacon (STScI)
The team plans to continue analyzing the Hubble data and combine it with data from ground-based observatories to gain additional insights into the history of Andromeda.
“There’s a strong scientific value to this archival data. Andromeda is important because it’s a neighbor that is close enough that we can see it in great detail while also getting a global perspective,” said Raja GuhaThakurta, co-author, University of California Santa Cruz.
An even greater global perspective is likely to come from NASA’s Nancy Grace Roman Space Telescope after it launches as early as Sunday, Aug. 30. Roman’s gigantic field of view can cover at least 100 times as much area as Hubble at near-infrared wavelengths in a single observation. A newly approved Roman observing program will image the entirety of Andromeda’s disk and areas of its surrounding halo, allowing astronomers to measure hundreds of millions of stars and enabling groundbreaking new science.
The Hubble Space Telescope has been operating for more than three decades and continues to make ground-breaking discoveries that shape our fundamental understanding of the universe. Hubble is a project of international cooperation between NASA and ESA (European Space Agency). NASA’s Goddard Space Flight Center in Greenbelt, Maryland, manages the telescope and mission operations. Lockheed Martin Space also supports mission operations at Goddard. The Space Telescope Science Institute in Baltimore, which is operated by the Association of Universities for Research in Astronomy, conducts Hubble science operations for NASA.
NASA’s Hubble Space Telescope has provided a detailed view of millions of stars in the Andromeda galaxy.
Star Formation Rate in Andromeda Over Time
This movie, created from an analysis of data from NASA’s Hubble Space Telescope, demonstrates how the rate of star formation in the Andromeda galaxy has declined over the past 500 million years.
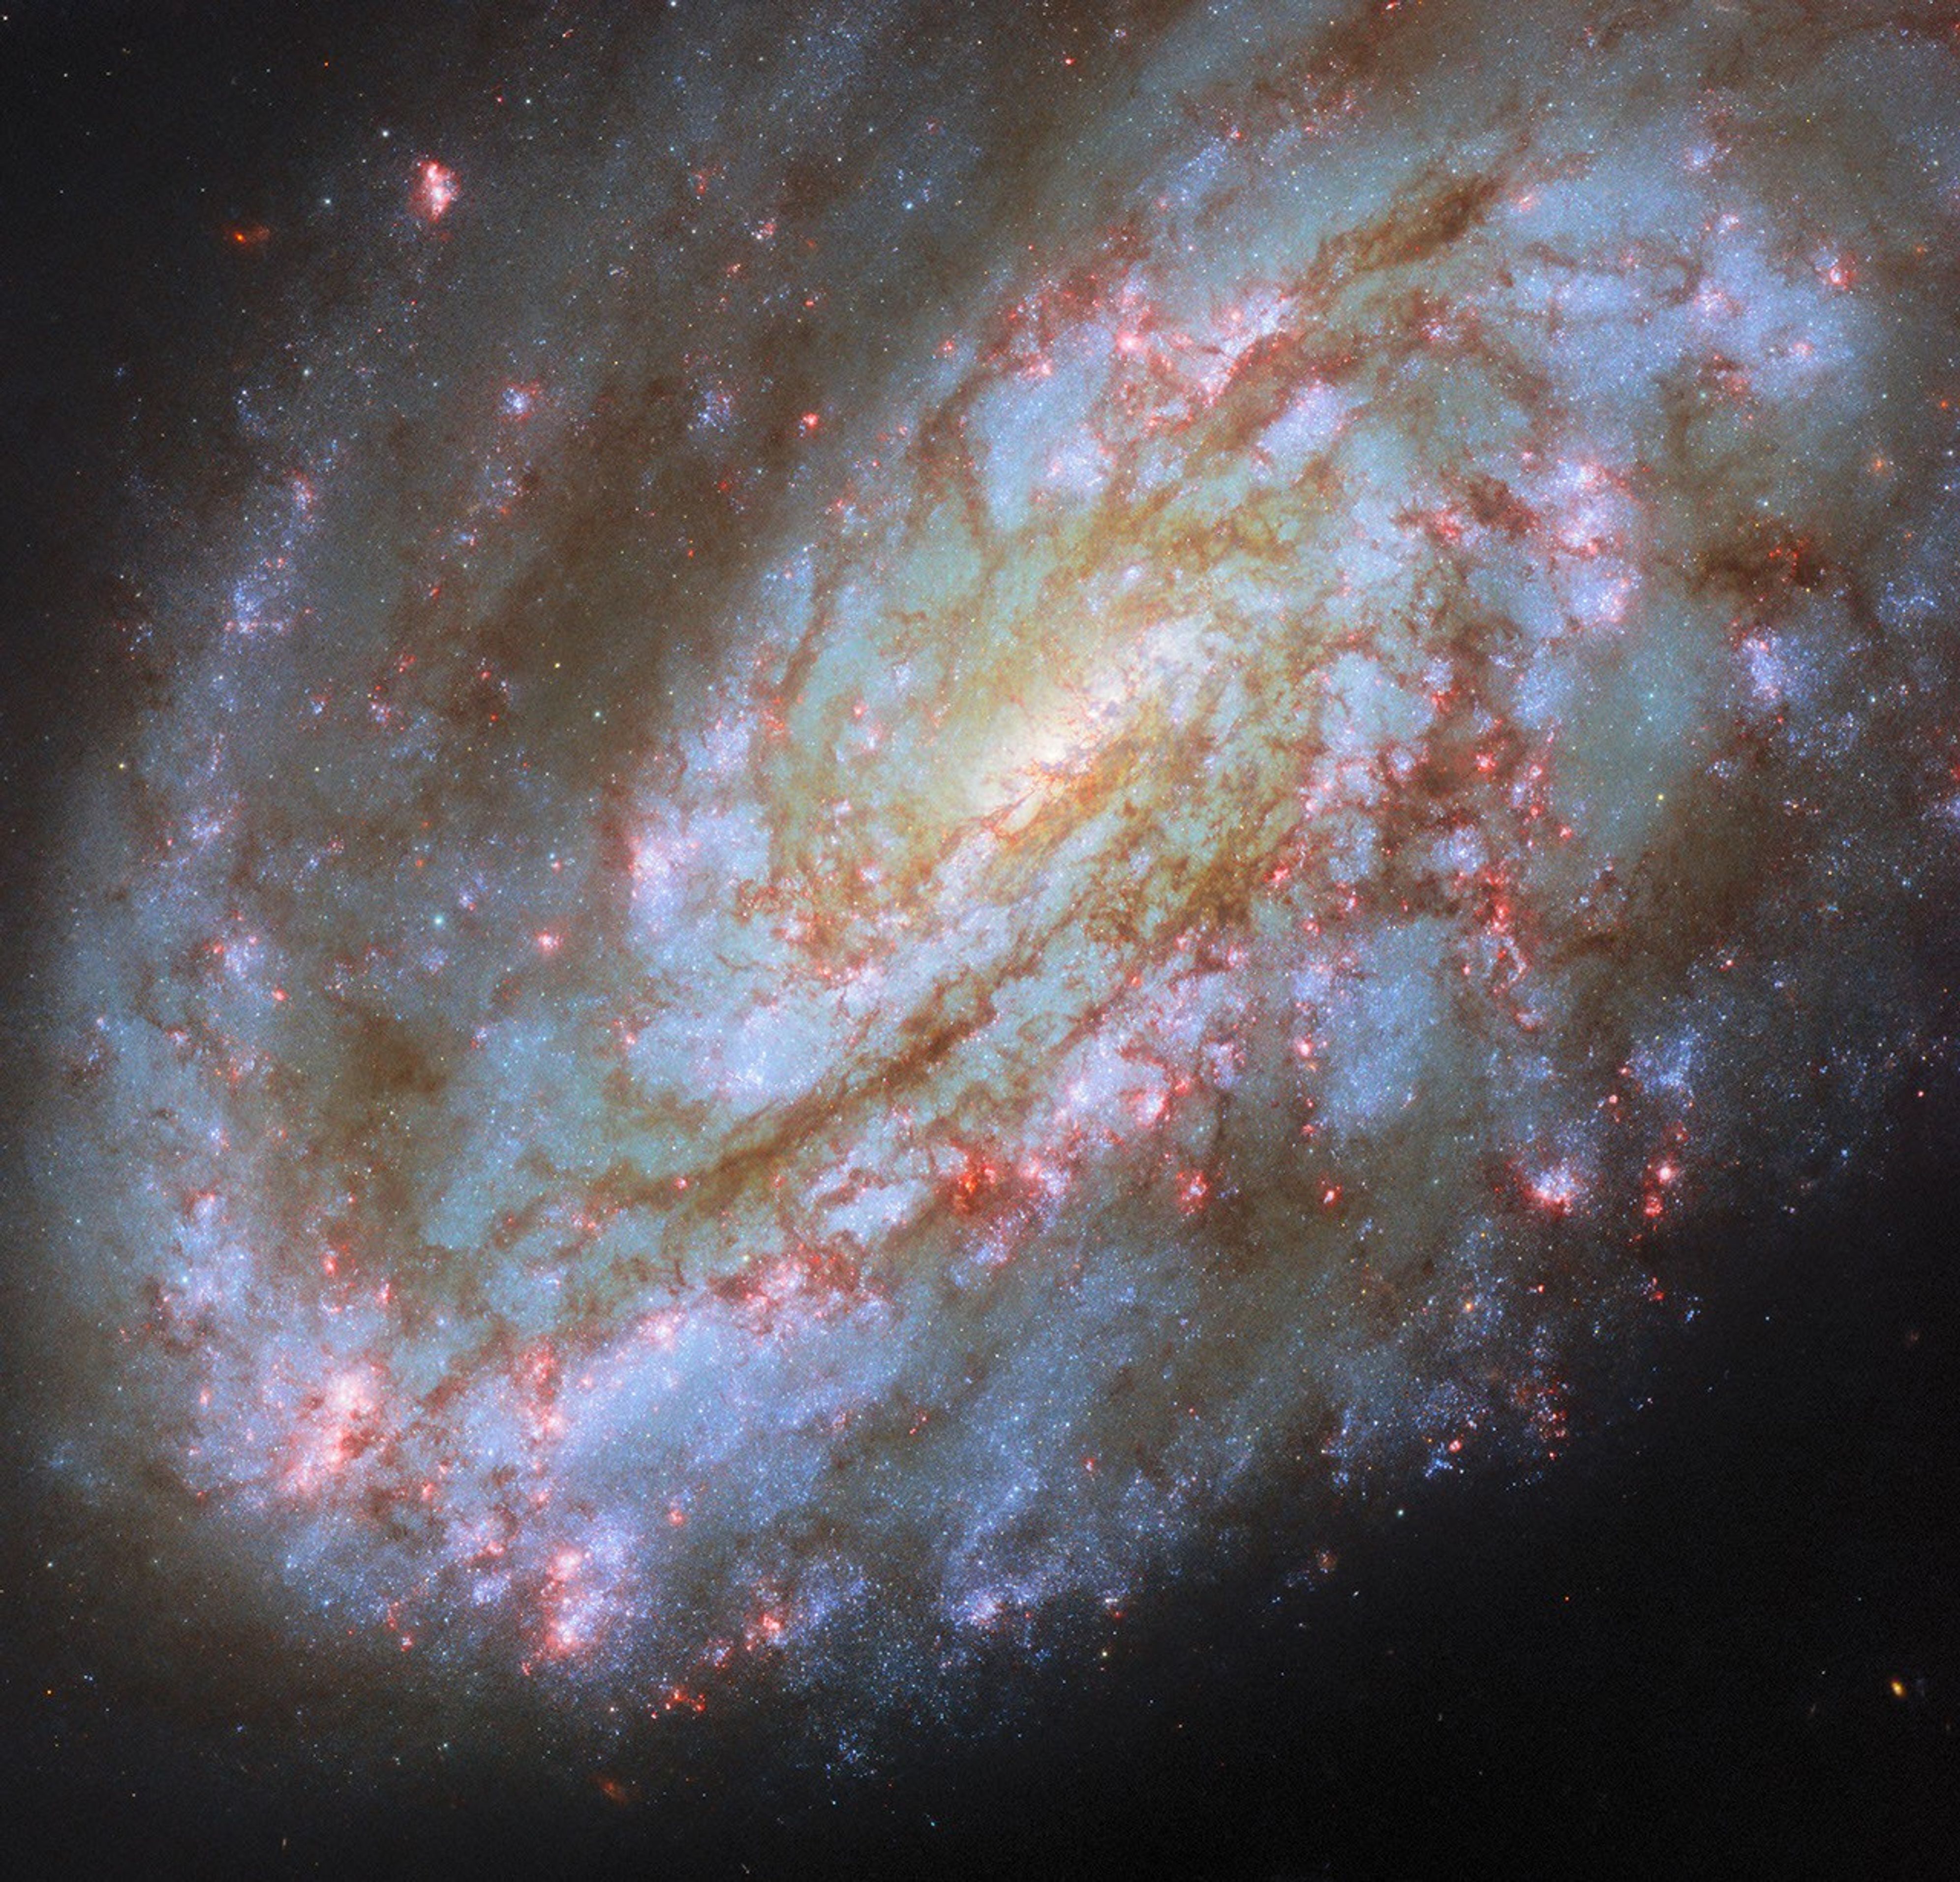
This NASA/ESA Hubble Space Telescope image features the spiral galaxy NGC 4654, located 72 million light-years away in the constellation Virgo (the Maiden).
NASA, ESA/Hubble, D. Thilker, J. Lee, and the PHANGS-HST Team
The subject of this NASA/ESA Hubble Space Telescope image is a spiral galaxy struggling against titanic forces that appear on galactic scales in space. This is NGC 4654, an intermediate spiral galaxy in the constellation Virgo (the Maiden). It is classified as an “intermediate” because its overall shape lies between spiral galaxies that have a bar across their centers and those that don’t. NGC 4654 has a weak bar structure at its center and is located 72 million light-years from Earth in the Virgo Cluster, a particularly massive and populous galaxy cluster.
NGC 4654 is particularly asymmetric, with a rounded and clearly-defined edge on one side and a long tail of gas stretching out from the opposite side — outside the field of view captured in this image. This gaseous tail is the result of ram pressure stripping, a force that galaxies can experience as they plow through space. NGC 4654 moves with such high velocity that it sweeps up and rams through the hot, rarefied gas filling the space between the Virgo Cluster’s galaxies. This intracluster medium in turn exerts a “ram pressure” on the galaxy, compressing the galaxy’s leading edge and dragging its gas behind the galaxy, creating the elongated tail.
It’s not just the galaxy’s gas that is unevenly distributed: its stars are too, and this is more unusual for a spiral galaxy. While the spiral arm on its leading edge is rich with stars and gas, the opposite arm noticeably lacks stars, influencing the galaxy’s lopsided spiral shape. Astronomers think that ram pressure alone is unlikely to cause this effect. Rather, NGC 4654 was also subjected to the gravitational force of fellow Virgo Cluster galaxy NGC 4639. While the two galaxies are far apart now, it’s thought that a fly-by interaction between them around 500 million years ago ripped away NGC 4654’s gas along one side, limiting star formation there and creating the asymmetry in its shape.
Many galaxies that undergo ram pressure stripping suffer reduced star formation rates as the cold gas that collapses to form their stars is pulled away and lost. NGC 4654, however, is still forming nearly two Suns’ worth of stars every year, a rate comparable to other galaxies of similar size. The active star formation is visible in the latest Hubble data included in this image. The data picks up on a wavelength of red light emitted by the clouds of energized gas where newborn stars lurk. The bright pink bubbles that appear across NGC 4654 — from its forward spiral arm, to around its weak bar, and out to the edge of its disk — are areas where these newborn stars shine.
The data used in this image came from two observing programs (#15654, #17502) that aim to link the gas in galaxies with star formation. By observing many prominent galaxies in the vicinity of our own, researchers hope to better understand how gas moves in galaxies, where and when it collapses to form stars and star clusters, and what effect those new stars have on the gas around them.
The second law of thermodynamics states that entropy, or disorder, in an isolated system always increases over time. Einstein famously said that “the second law of thermodynamics occupies a unique position among the laws of Nature,” reflecting how fundamental he believed the principle to be.
In its early days, the universe was smooth and uniform, with low entropy. As it expanded, gravity pulled gas into stars, stars into galaxies, and eventually made life possible. Each step seems to create order in one place, even though the universe as a whole became more disordered. Cosmologists have usually explained this by pointing to the universe’s growing volume.
Gravity as a Ledger, Not a Force
Mathematician Ginestra Bianconi at Queen Mary University of London addressed this problem with a framework called Gravity from Entropy. Rather than treating gravity as a fundamental force, the Gravity from Entropy framework proposes that it emerges from an information-based difference between two descriptions of spacetime geometry. One metric describes the actual shape of spacetime, while the other describes the geometry that matter and curvature would create. When these two match, gravity disappears. When they differ, gravity arises from the difference.
In the low-energy, weak-curvature limit, the framework reduces to general relativity. In the new study, Bianconi adds a thermodynamic perspective. She applies Gravity from Entropy to the standard model of an expanding universe and shows that the local geometric degrees of freedom follow the first law of thermodynamics, with their own temperature and pressure emerging from the equations.
Falling Density, Rising Total
One of the study’s central findings is the distinction between total entropy and entropy per unit volume. As the universe grows, the total entropy increases, just as the second law demands. However, the study found that entropy per unit volume decreases over time even as the universe’s total entropy continues to increase. Within the Gravity from Entropy framework, Bianconi proposes that this declining local entropy density may help explain how galaxies and other cosmic structures emerge.
The study also shows that these geometric temperatures change depending on what dominates the universe. In a universe dominated by matter or radiation, the temperature decreases over time. In a universe dominated by dark energy, like our own, they remain nearly constant. The framework even assigns a temperature and pressure to empty spacetime.
A Theory Still Waiting to Be Tested
“This work reveals how the Gravity from Entropy theory can tackle the challenging question of reconciling the second law of thermodynamics with the emergence of complexity in our universe,” stated Bianconi. “These results may open new avenues for investigating the long-standing problem of reconciling the foundations of cosmological irreversibility, the emergence of complex structures, and ultimately life with fundamental gravitational dynamics.”
So far, Gravity from Entropy has not been confirmed by observations. The theory makes predictions that future observations of large-scale cosmic structures and other gravitational phenomena could test. While it remains unproven, Bianconi believes it could offer a new way to link gravity, thermodynamics, quantum mechanics, and the rise of complexity in the universe.
Austin Burgess is a writer and researcher with a background in sales, marketing, and data analytics. He holds an MBA, a Bachelor of Science in Business Administration, and a data analytics certification. His work focuses on breaking scientific developments, with an emphasis on emerging biology, cognitive neuroscience, and archaeological discoveries.
Charles Ross spent 50 years building “Star Axis,” a naked-eye observatory in New Mexico. Now his masterwork is ready. How to share it with a changed world?
For the first time, astronomers have reconstructed the magnetic field of an entire cluster of galaxies, from its central nucleus to its outer limits.
The record-breaking achievement is the product of the deepest-ever observations of the galaxy cluster Abell 2255, located around a billion light-years away — and those observations are thanks to the European radio telescope LOFAR (Low Frequency Array).
Abell 2255has long been known for its complexity in radio waves. Its vast, diffuse radio emissions are created by particles called electrons racing at near-light, or relativistic, speeds and interacting with magnetic fields of galaxies in the cluster. Thus, using Abell 2255 as a cosmic laboratory to study the universe in radio waves could lead scientists to a better understanding of how magnetic fields come about and evolve. These observations could also help paint a picture of the dynamics of hot gas in galaxy clusters. This could reveal how the largest structures in the universe are constructed.
As part of the LOFAR Galaxy Cluster Ultra-Deep Field project, thisteam used 224 hours of radio image collection to discover that the distribution of large-scale magnetic fields throughout Abell 2255 (which itself stretches out for several million light-years) are not randomly distributed. Instead, these magnetic fields seem to be organized by the motion of gas that occurred during the formation of this galactic cluster.
"Obtaining very sensitive images of galaxy clusters at radio wavelengths is crucial to understanding how electrons are accelerated to relativistic speeds and magnetic fields are amplified on large cosmic scales," team leader Andrea Botteon, of the Italian National Institute for Astrophysics (INAF), said in a statement. "The complexity of these studies is due to the elusiveness of the radio signal from electrons moving in very weak magnetic fields. We believe that the mechanism that 'turns on' these gigantic radio emissions is linked to the formation process of galaxy clusters."
Botteon added that for this research he and his colleagues combined the deepest radio observations ever made with an innovative data analysis technique that allowed them to reconstruct the shape of a galaxy cluster's magnetic field for the first time.
"The coherence of the magnetic field lines observed in some regions of the cluster suggests that the morphology of the field is intimately linked to the dynamics of the gas in which it resides, where it can be 'stretched' or 'compressed' by the motions associated with the formation of the cluster itself," Botteon said.
The invisible texture of the magnetic field in the central region of the galaxy cluster Abell 2255. (Image credit: A. Botteon et al. (INAF), A&A 2026)
This analysis revealed that, in some regions, the magnetic fields follow very specific directions, stretching radially along extended radio emissions. In contrast to this, in regions dominated byshock waves, magnetic fields are orientated at tangents. This suggests magnetic fields in Abell 2255 are carved out by the same dynamics that allow clusters to accrete gas and grow.
This serves as the first observational evidence that the same mechanisms that allow galaxies to grow and cluster, creating thelargest structures in the universe, also shape their magnetic fields.
The team's research has been accepted for publication in the journal Astronomy & Astrophysics and is available as a pre-peer-reviewed paper on the repository sitearXiv.
This image, which combines a background view from the Dark Energy Camera Legacy Survey with two inset images from the Very Large Telescope, shows an unusual pair of galaxies in the Fornax Cluster. The galaxies FCC 224 and FCC 240 are under scrutiny because they may have formed via a high-velocity collision between dwarf galaxies — the so-called “bullet-dwarf” model. Using new spectroscopy from the Very Large Telescope, Maria Luísa Buzzo (Yale University) and collaborators analyzed the ages and kinematics of the galaxies’ stars as well as the unusually bright globular clusters swirling around each galaxy. These data suggest that both galaxies are deficient in dark matter, and their stellar populations and globular clusters are all roughly 10 billion years old. The lack of dark matter and the uniform stellar ages are both consistent with the bullet-dwarf model, in which the collision strips away dark matter and ignites a burst of star formation. Since this type of collision can create more than two remnants, the team suggests searching along the trajectory defined by FCC 224 and FCC 240 for more fragments from the collision, some of which may contain the galaxies’ lost dark matter. To learn more about these galaxies and what they might mean for the bullet-dwarf mechanism, be sure to check out the full research article linked below.
Citation
“Dark-Matter-Deficient Twins: FCC 224 and FCC 240 as Possible Analogs of NGC 1052-DF2 and DF4,” Maria Luísa Buzzo et al 2026 ApJ1005 15. doi:10.3847/1538-4357/ae7349
The iconic disks of spiral galaxies are well known across the local universe and now far beyond. A recent study looks at the Milky Way to determine when its own disk emerged.
Spinning into Spirals
The Milky Way, a grand spiral galaxy with stars and gas rotating in a disk, did not always look this way. Galaxies begin as chaotic clumps of gas and stars inside a knot of dark matter, and at some point in time, spiral galaxies must transform into the flat rotating disks we observe them as today. Recent JWST observations have uncovered disk galaxies emerging much earlier in the universe than previously thought, shifting our understanding of how quickly spiral galaxies come together and settle into disks. While we cannot study the detailed assembly history of these very distant galaxies, we can dissect galaxies in the local universe to build a better timeline of galaxy evolution.
Looking as close to home as possible, astronomers have used the kinematics and chemical makeup of stars in our own Milky Way to trace the moment when the galaxy started to host a rotating stellar disk. This period, known as the “spin-up,” marks when the bulk kinematic signature of the galaxy transitioned from one dominated by random motions to one dominated by a rotating disk.
Stars hold on to the kinematic and chemical information they are born with, so stars of different ages and metallicities across the galaxy should trace the development of the disk. Because stellar ages have been difficult to constrain observationally, studies of galactic spin-up have typically relied on readily available metallicity measurements as a proxy for age; however, metallicity is not a clear-cut age indicator, making it difficult to truly distinguish different stellar populations across the Milky Way’s disk. Luckily, new major surveys have recently provided stellar databases adding the stellar age measurements necessary to pin down when the Milky Way spun up.
Dawn of the Galactic Disk
Plots showing stellar age and rotational velocity (Vϕ) versus metallicity, [Fe/H]. The metallicity range where the age–[Fe/H] relation stalls coincides with the point when the Vϕ–[Fe/H] relation rapidly increases, indicating the age of the spin-up in the Milky Way. Click to enlarge. [Modified from Feltzing et al 2026]
Sofia Feltzing (Lund Observatory) and collaborators used a catalog of over 300,000 subgiant stars from the Large Sky Area Multi-Object Fiber Spectroscopic Telescope with metallicities, kinematics, and crucial stellar ages to determine when the Milky Way began to host a stellar disk. After making quality cuts to ensure they included only the most robustly measured stars, the authors divided the sample into two distinct stellar populations that settled into the Milky Way’s disk differently: older stars with a high abundance of α elements (like oxygen, magnesium, and silicon) relative to iron and younger stars with low α-element abundances.
With these star samples, Feltzing and team analyzed how both stellar rotational velocity and age varied with metallicity to determine when the Milky Way spun up. They found that high-α stars clearly move from having random motions to being rotationally supported over a short range of metallicities about 12.5 billion years ago, while the low-α stars seem to begin in a rotating disk and stay there. When varying their selection criteria and looking at the full sample, the authors determined that the Milky Way spin-up happened between 12.1 to 12.5 billion years ago — the first time Milky Way spin-up has been age-dated in this way.
These results imply a rapid chemical evolution and change in kinematic properties as stars went from randomly orbiting to rotating in an ordered disk in the Milky Way. The authors suggest that future studies should focus on lower-metallicity stars to better disentangle stars in the disk from stars in the halo, which will lead to a more precise determination of the Milky Way’s spin-up. Upcoming large-scale surveys will make this possible and allow astronomers to build a better picture of galaxy formation in the early universe.
Citation
“Dawn of the Milky Way Disk: Determination of When a Rotationally Supported Disk Appears and Dating the Spin-up of the Disk,” Sofia Feltzing et al 2026 ApJL 1004 L28. doi:10.3847/2041-8213/ae6f14
The only three measurables in galactic astronomy are the position, luminosity and spectrum of the source light received in our telescopes. There is no distance information without unprovable assumptions, hence no direct measurement of size or age of the universe. Thus we may conclude it is young in agreement with the Bible.
New research reveals how an unusual celestial object resembling a cosmic “bullseye” could offer clues to one of the most perplexing phenomena in our universe.
The research, undertaken by physicists Pierre Sikivie and Yuxin Zhao at the University of Florida, focuses on an astronomical feature quite unlike any other—the galaxy LEDA 1313424, whose concentric rings have garnered it the apt nickname of the “Bullseye galaxy.”
Based on Sikivie and Zhao’s recent research, detailed in a new paper that appeared in The Astrophysical Journal, quantum behavior related to long-mysterious dark matter may hold the key to the galaxy’s unusual appearance.
Unraveling a Bullseye Galaxy’s Circular Secrets
In the past, astronomers have attempted to explain LEDA 1313424’s unusual concentric appearance as the likely result of an ancient collision between two galaxies.
Not so, according to Sikivie and Zhao, who now take a vastly different approach by arguing that a better explanation may involve a Bose-Einstein condensate of axions, a variety of extremely light hypothetical particles.
A stunning Hubble Telescope view of the Bullseye galaxy (Image Credit: NASA, ESA, I. Pasha (Yale), P. van Dokkum (Yale)).
This concept has much deeper roots that go back close to a century ago, when the first galaxy featuring an unusual concentric ring was discovered. This example, dubbed the Cartwheel galaxy, was only the first in a succession of similar astronomical discoveries involving galaxies with “ringed” appearances that incorporate as many as three annular features.
Unraveling an Annular Enigma
Explaining why these galaxies look this way has remained elusive. One theory proposed by astronomers, as noted earlier, involves impacts between two galaxies, which could create waves of density whose ripples become evident in ring-like structures surrounding the resulting galaxies.
However, a discovery in 2025 by Imad Pasha, a Yale University astronomer, and his colleagues presented an even stranger development in this ongoing concentric saga: the discovery of a galaxy that possesses not three rings, but nine of them. With its discovery, this remarkable celestial object’s unusual appearance garnered the nickname now familiar to us: “The Bullseye galaxy.”
Artist’s concept detailing the annular features encircling LEDA 1313424 (Image Credit: NASA, ESA, Ralf Crawford (STScI))
One theory that astronomers believed may account for the galaxy’s nine concentric structures had been a hypothetical impact—and a very energetic one—that occurred about 56 million years ago. However, while investigating this possibility, Sikivie and Zhao say a problem emerged: this would mean that the outermost ring in the galaxy would have had to travel at a speed of 758 miles per second as it blasted outward from the galaxy’s center.
This speed, they say, is impossible to reconcile with what astronomers can already discern about the nature of the supposed collusion, as well as the well-characterized behavior of galactic material observed in other regions of the cosmos.
An Alternative Approach
In an effort to get to the bottom of the mystery behind this unique galaxy, Sikivie and Zhao have put forward an alternative idea: that the rings in the Bullseye galaxy might instead be a byproduct of dark matter’s mysterious properties.
According to astronomers, dark matter is believed to be a nonluminous material that populates our universe, contributing around 85% of its total mass. Despite its ubiquity, direct detections that could confirm its existence have remained elusive.
However, there are some intriguing cosmic phenomena that astronomers are aware of that are very good candidates for being indirect evidence of this mysterious material. These observations include gravitational motion that occurs in galaxies, whereby the accumulation of dark matter is believed to manifest in the appearance of spherical halos encircling them.
In the past, Sikivie has explored this possibility, and whether current prevailing theories about dark matter, such as the idea that hypothetical particles known as axions, may offer the best interpretation of the physical reality behind dark matter.
If dark matter is indeed related to axions, it would also be required to obey what astrophysicists call conservation of angular momentum. According to Sikivie, when axions and galaxies interact, a phenomenon should emerge where portions of dark matter halos closest to the center would become oriented in structural forms known as “caustic rings.”
“We had earlier proposed that disk galaxies have caustic rings of dark matter with a pattern of ring radii, very similar to the pattern of ring radii observed in LEDA 1313424,” Sikivie recently said.
With this idea in mind, Sikivie and Lhao then turned their attention to the mysterious bullseye of LEDA 1313424 and “fitted the observed ring radii to the pattern of ring radii in the caustic ring interpretation,” from which they discerned that “LEDA’s rings are the imprint of caustic rings of dark matter on the baryonic matter in LEDA’s disk.”
Strange Quantum Behaviors
A further aspect of the researchers’ theory involves the quantum behavior that axions are expected to engage in.
Under extremely cold conditions, these hypothetical dark matter particles could collectively occupy the same quantum state, forming what is known as a Bose-Einstein condensate—a strange state of matter in which quantum effects become visible on macroscopic scales.
According to the team, such a condensate could interact with ordinary matter in ways that match astronomical observations. If the duo is correct, this could imply that ring-shaped galaxies such as LEDA may not result from galactic collisions at all—instead, these unique cosmic structures might be evidence of dark matter axions that have undergone Bose-Einstein condensation.
Presently, much like dark matter, axions have remained hypothetical and frustratingly difficult to detect. Of course, given their elusiveness, this also makes them a very good candidate in terms of helping scientists close in on the dark matter mystery, and new models are helping to provide potentially compelling new resolutions for such problems.
For now, mysterious ringed galaxies remain mysterious. However, as the work of researchers like Sikivie and Lhao progresses, one of astronomy’s more unusual recent discoveries is gradually coming into focus, while providing fresh insight into the intriguing quantum nature of dark matter.
Micah Hanks is the Editor-in-Chief and Co-Founder of The Debrief. A longtime reporter on science, defense, and technology with a focus on space and astronomy, he can be reached atmicah@thedebrief.org. Follow him on X @MicahHanks, and at micahhanks.com.
A star-forming galaxy in the early universe might have sent a ghostly particle known as a neutrino crashing into the ice at Earth’s South Pole, after an 11 billion-year journey through space.
This NASA Hubble Space Telescope image features a swarm of galaxies in the galaxy cluster called CL0016+1609 or MACS J0018.5+1626.
NASA, ESA, H. Ebeling (University of Hawaii), D. Coe (STScI, ESA, JWST); Image Processing: G. Kober (NASA/Catholic University of America)
This NASA Hubble Space Telescope image features a galaxy cluster, called CL0016+1609 or MACS J0018.5+1626, that is very bright at X-ray wavelengths and is one of the most extensively studied clusters at X-ray and radio wavelengths. The X-ray observations of this cluster revealed that it is two clusters merging along our line of sight.
Researchers requested time to observe CL0016+1609 with Hubble’s Advanced Camera for Surveys because that data would help them accurately measure the cluster’s dark-matter distribution, which helps them study the merger and the role of CL0016+1609 in the large-scale structure of the universe. Hubble can’t directly see dark matter, but its infrared and visible light observations can detect dark matter’s gravitational lensing effects on the normal matter Hubble observes.
The data in this image also includes observations with Hubble’s Wide Field Camera 3 taken as part of an observing program that obtained the first Hubble infrared images of 46 massive galaxy clusters and looked for distant galaxies gravitationally lensed by these clusters. Called RELICS (Reionization Lensing Cluster Survey), this survey found some 300 high-redshift candidate galaxies lensed by these clusters.
You can see the faint vertical arc of one of these distant galaxies in the image above. Look for it just to the left of the large elliptical galaxies in the center of the image. Another brighter, though shorter arc is visible just above and to the right of the large elliptical galaxies in the center of the image.

 Login