❌

Normal view

Aug. 17, 1877: Asaph Hall discovers Phobos

17 August 2026 at 14:00

Astronomer Asaph Hall met Angeline Stickney at New York Central College in 1855. Two years his elder, she instructed him in geometry and German, and was reputedly so strong a mathematician that Hall and his classmate made a game of trying to stump her, yet never could. The pair were married the following year. ForContinue reading "Aug. 17, 1877: Asaph Hall discovers Phobos"

The post Aug. 17, 1877: Asaph Hall discovers Phobos appeared first on Astronomy Magazine.

The Sons of Míl: The Science Behind the Irish Legend That Traces the Origins of the Celts to Northern Spain

13 August 2026 at 11:58
In 2006, geneticist Bryan Sykes, Professor of Human Genetics at the University of Oxford, published the results of a study that had taken him a decade to complete. His team had collected and analyzed the mitochondrial DNA and Y chromosome of 10,000 volunteers from England, Scotland, Wales, and Ireland, with the aim of reconstructing the […]

A Linear A Inscription Found on the Island of Crete Reveals a Minoan Ritual and the Name of a God Predating Dionysus

13 August 2026 at 07:43
A small object made of dark stone, carved with astonishing precision almost 3,500 years ago, has provided researchers with one of the clearest windows yet into the religion of ancient Crete. It is the inscription known as IO Za 2, engraved on a tiny libation table made of dark green serpentinite, measuring just 4.3 centimeters […]

Stops Along the Path of Totality

12 August 2026 at 05:01
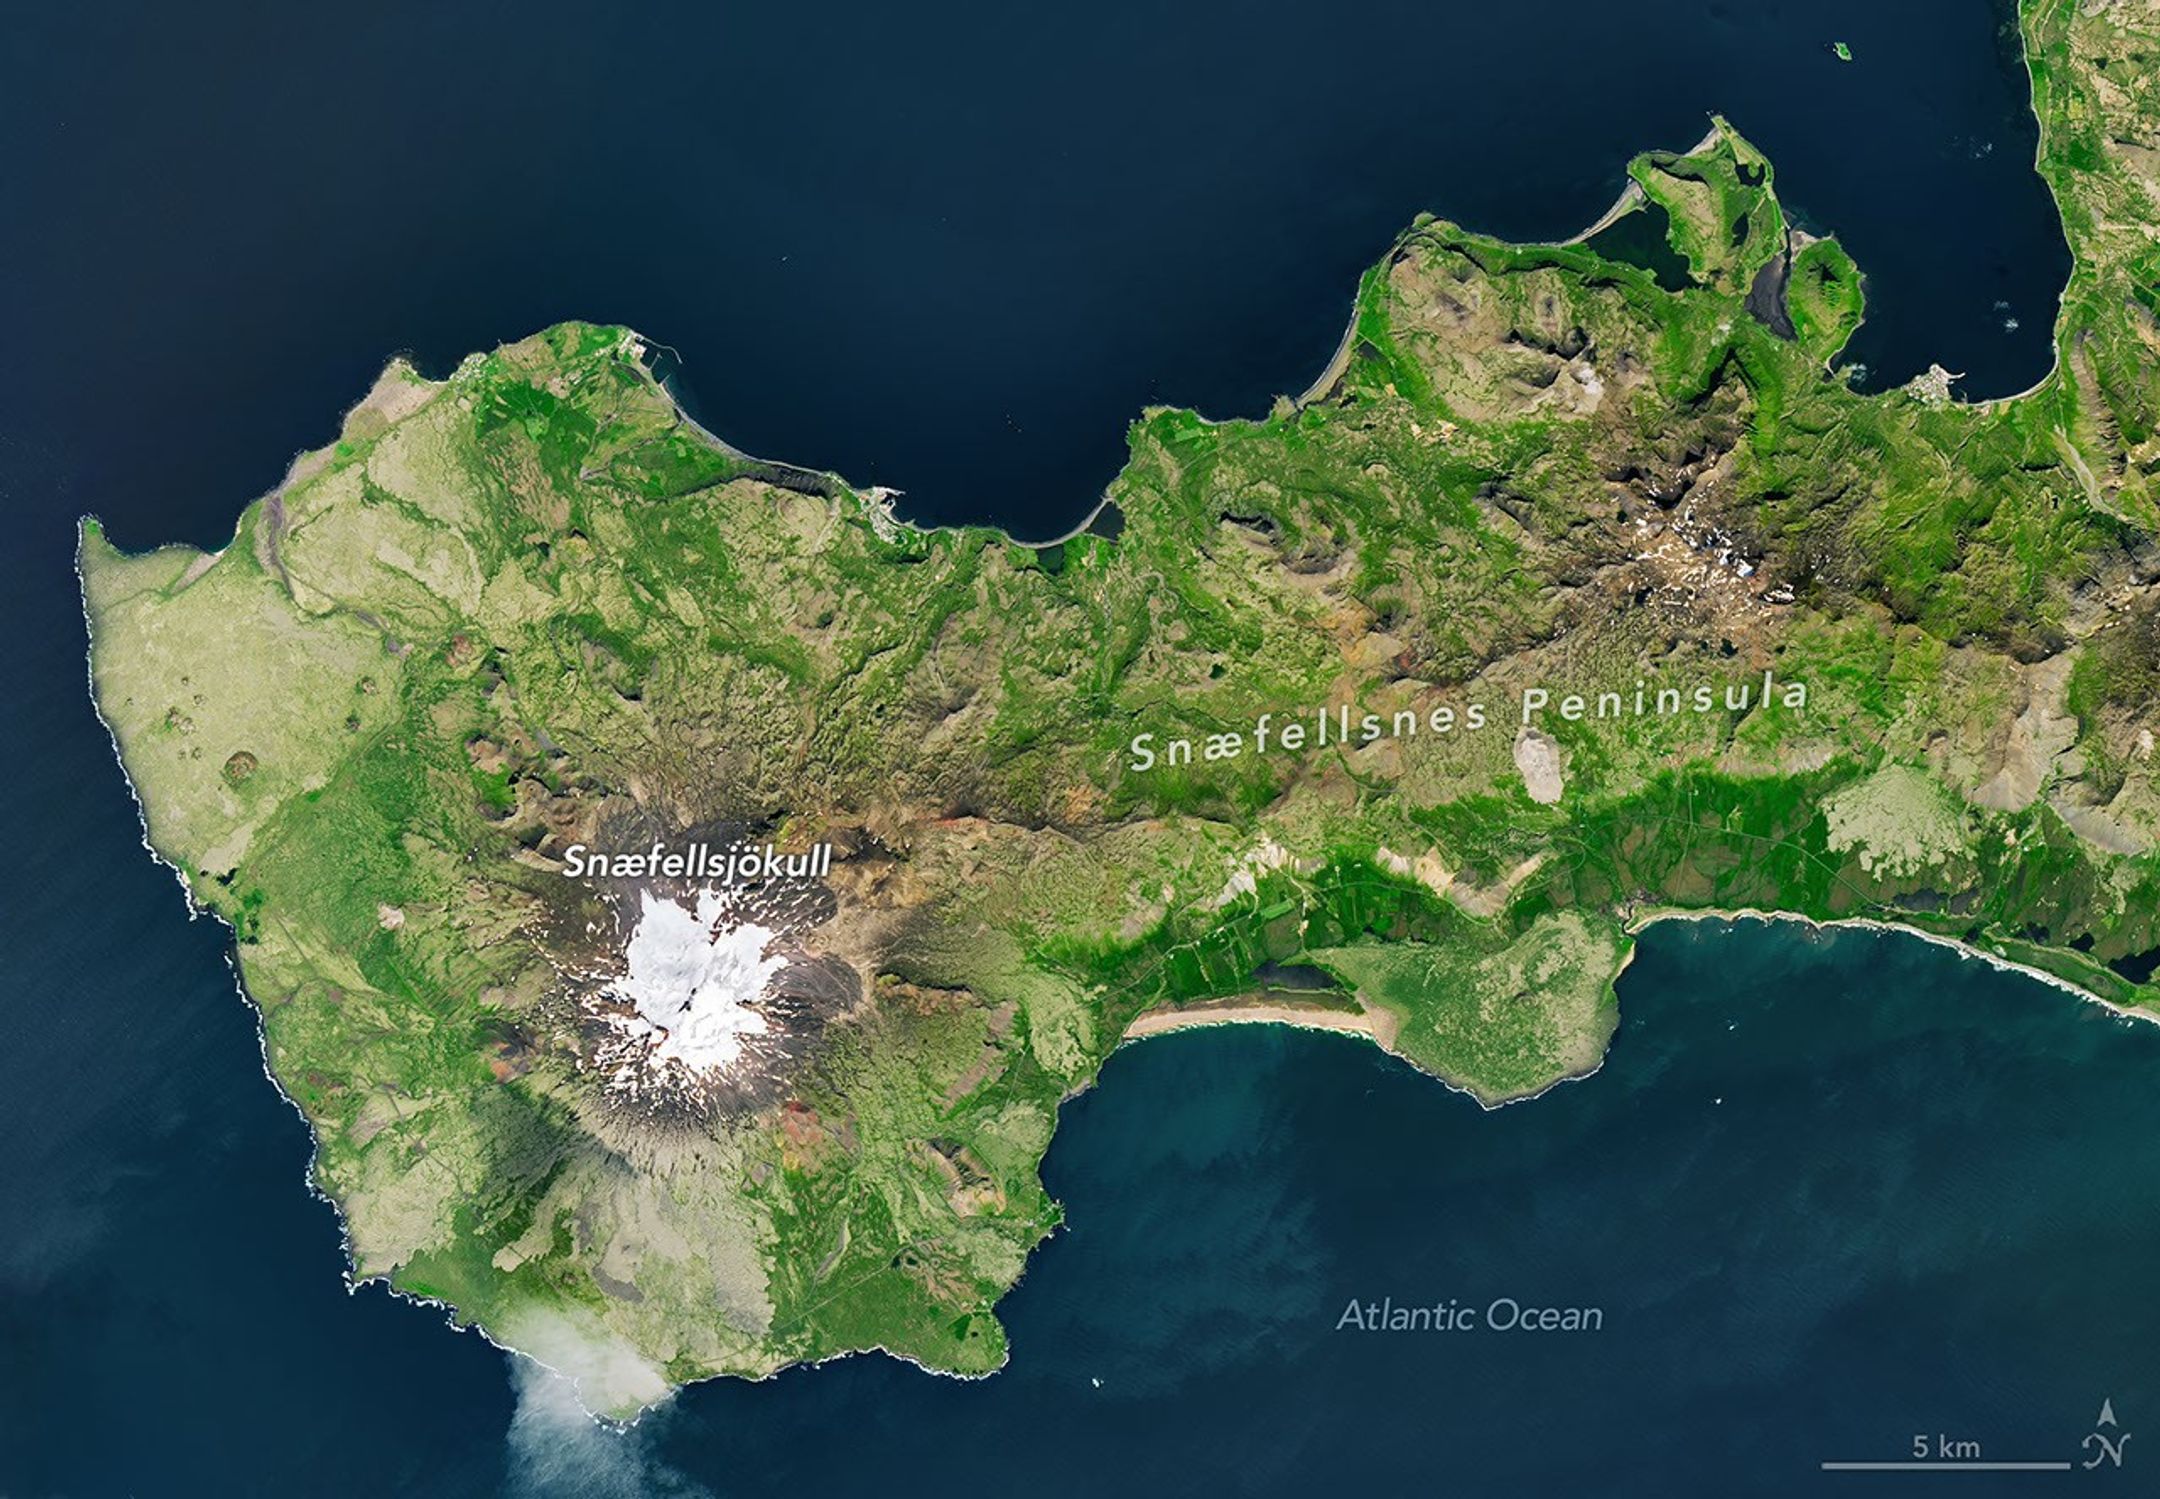
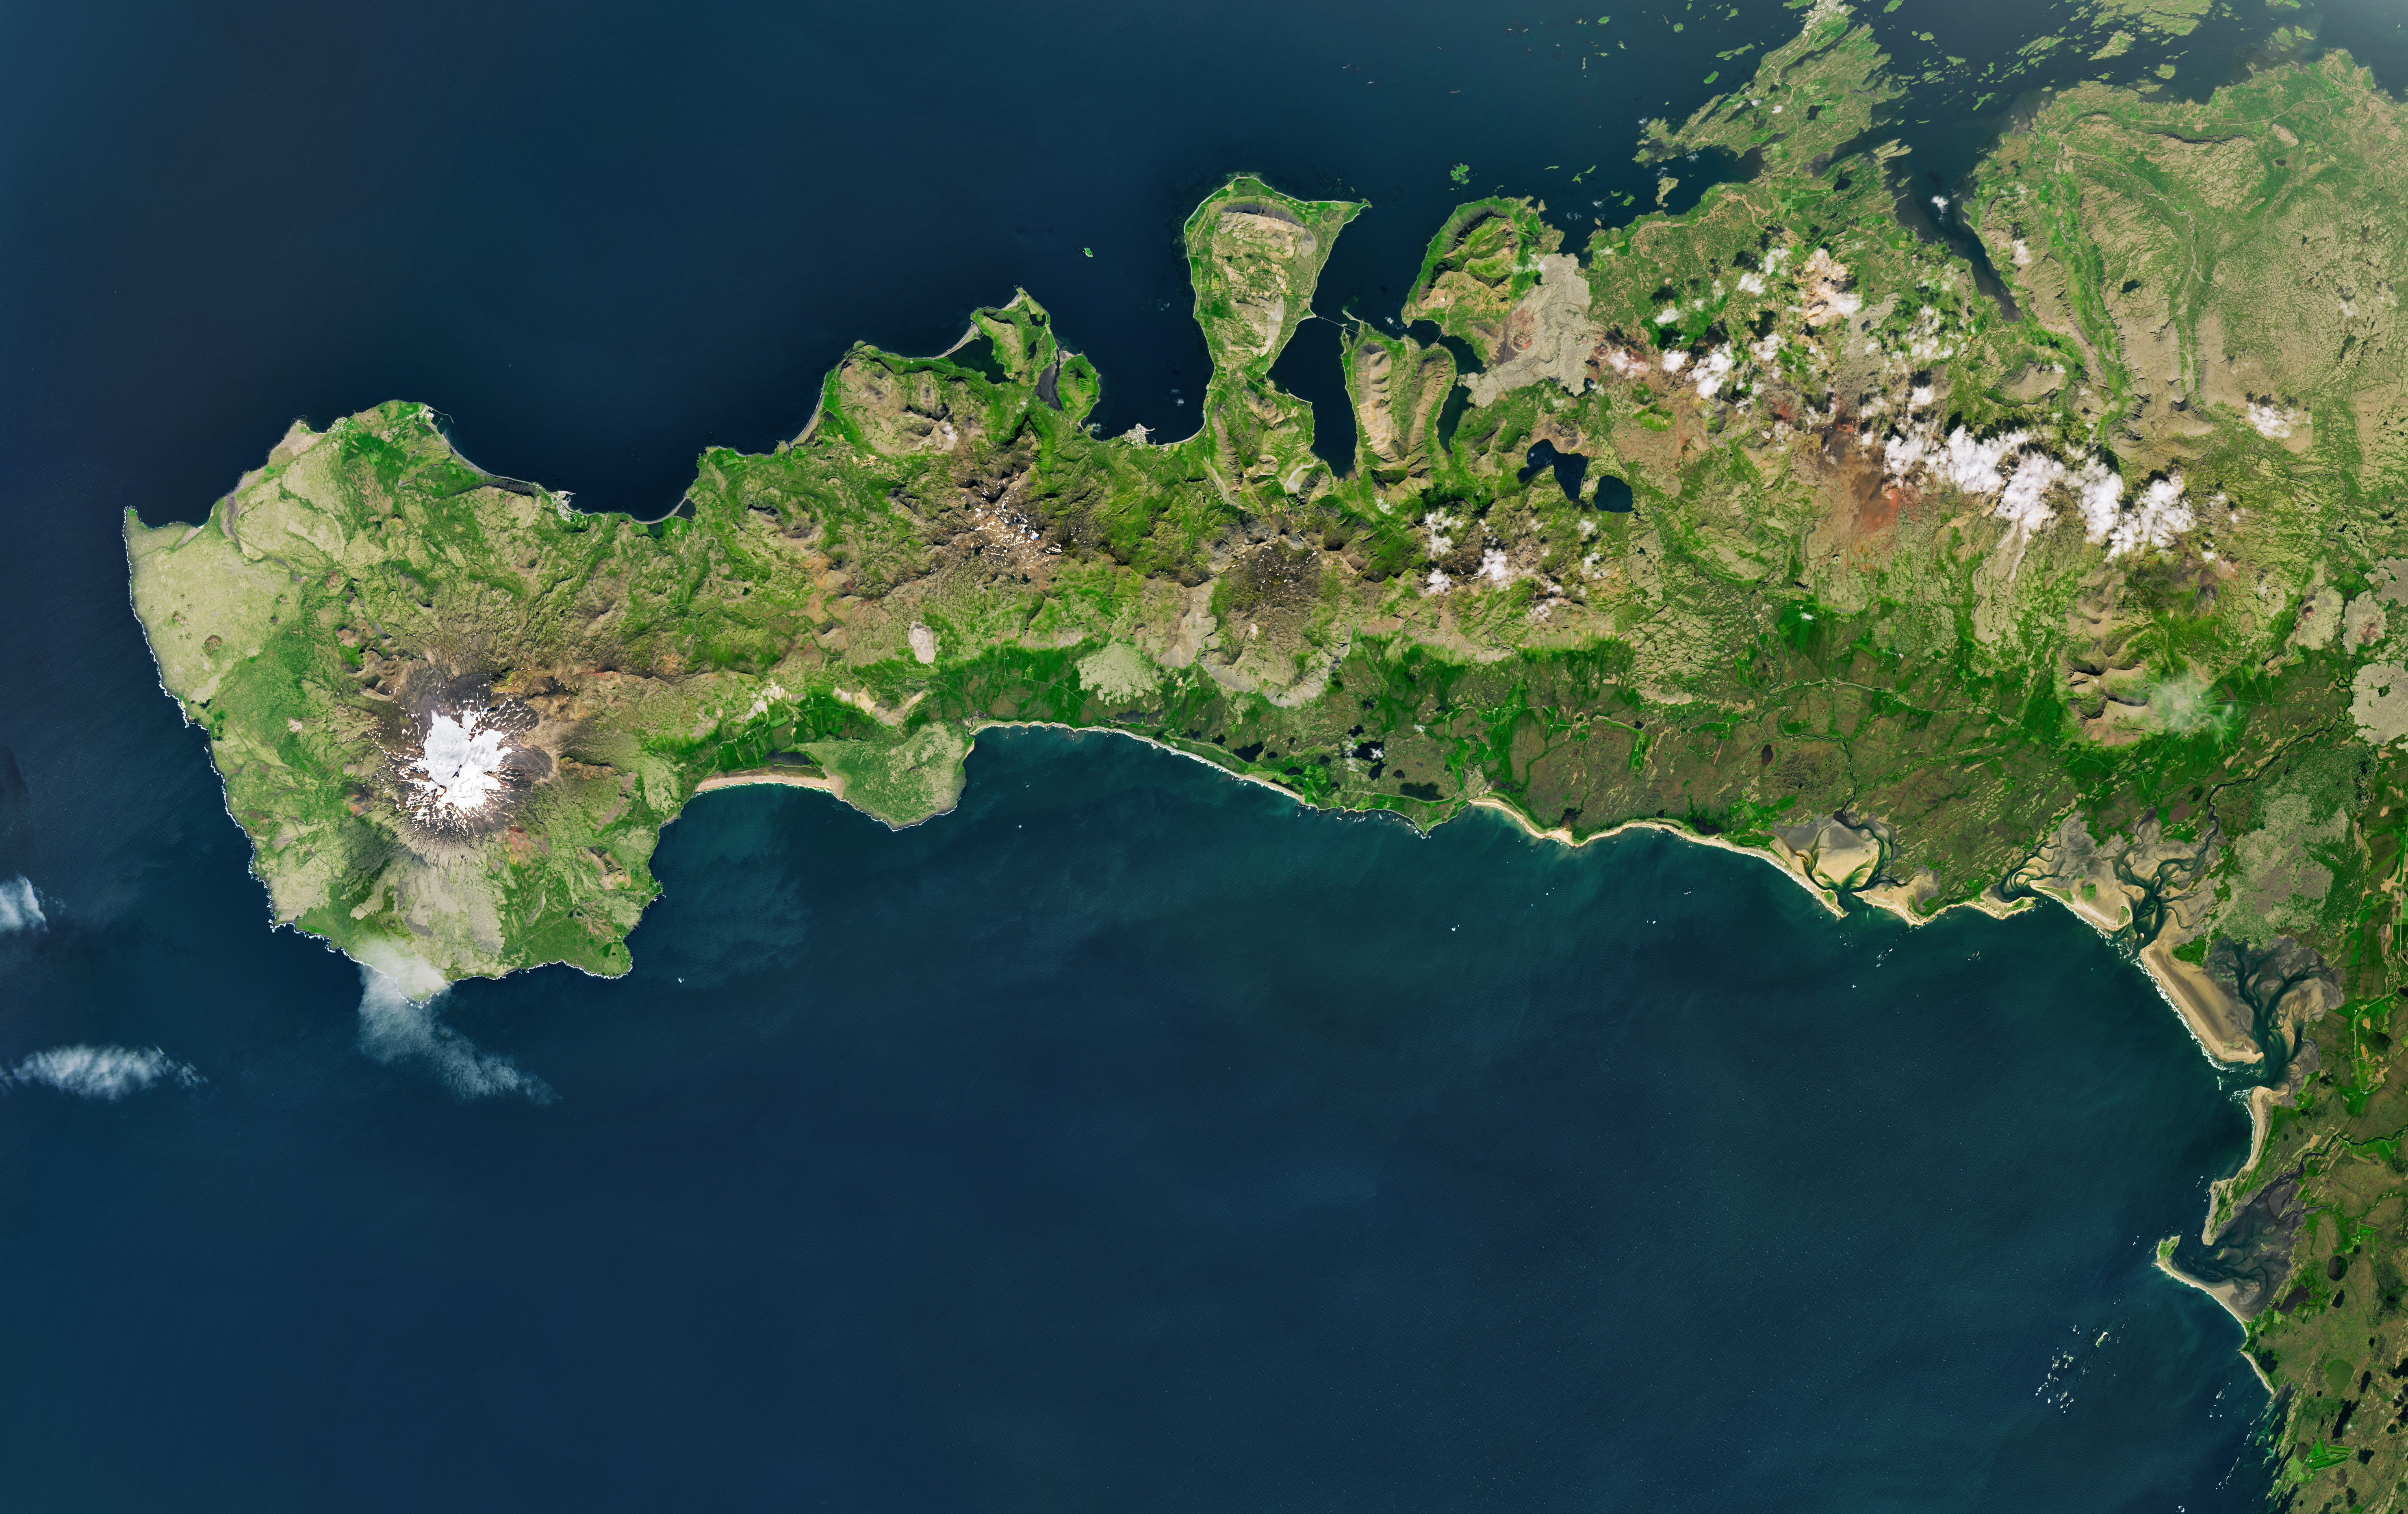
A peninsula in Iceland stretches across the image to the left. A prominent glacier-capped volcano sits near its western end.
The glacier-capped Snæfellsjökull volcano is the defining feature of Iceland’s Snæfellsnes peninsula, shown in this image acquired with the OLI (Operational Land Imager) on Landsat 9 on July 25, 2026.
NASA Earth Observatory/Michala Garrison

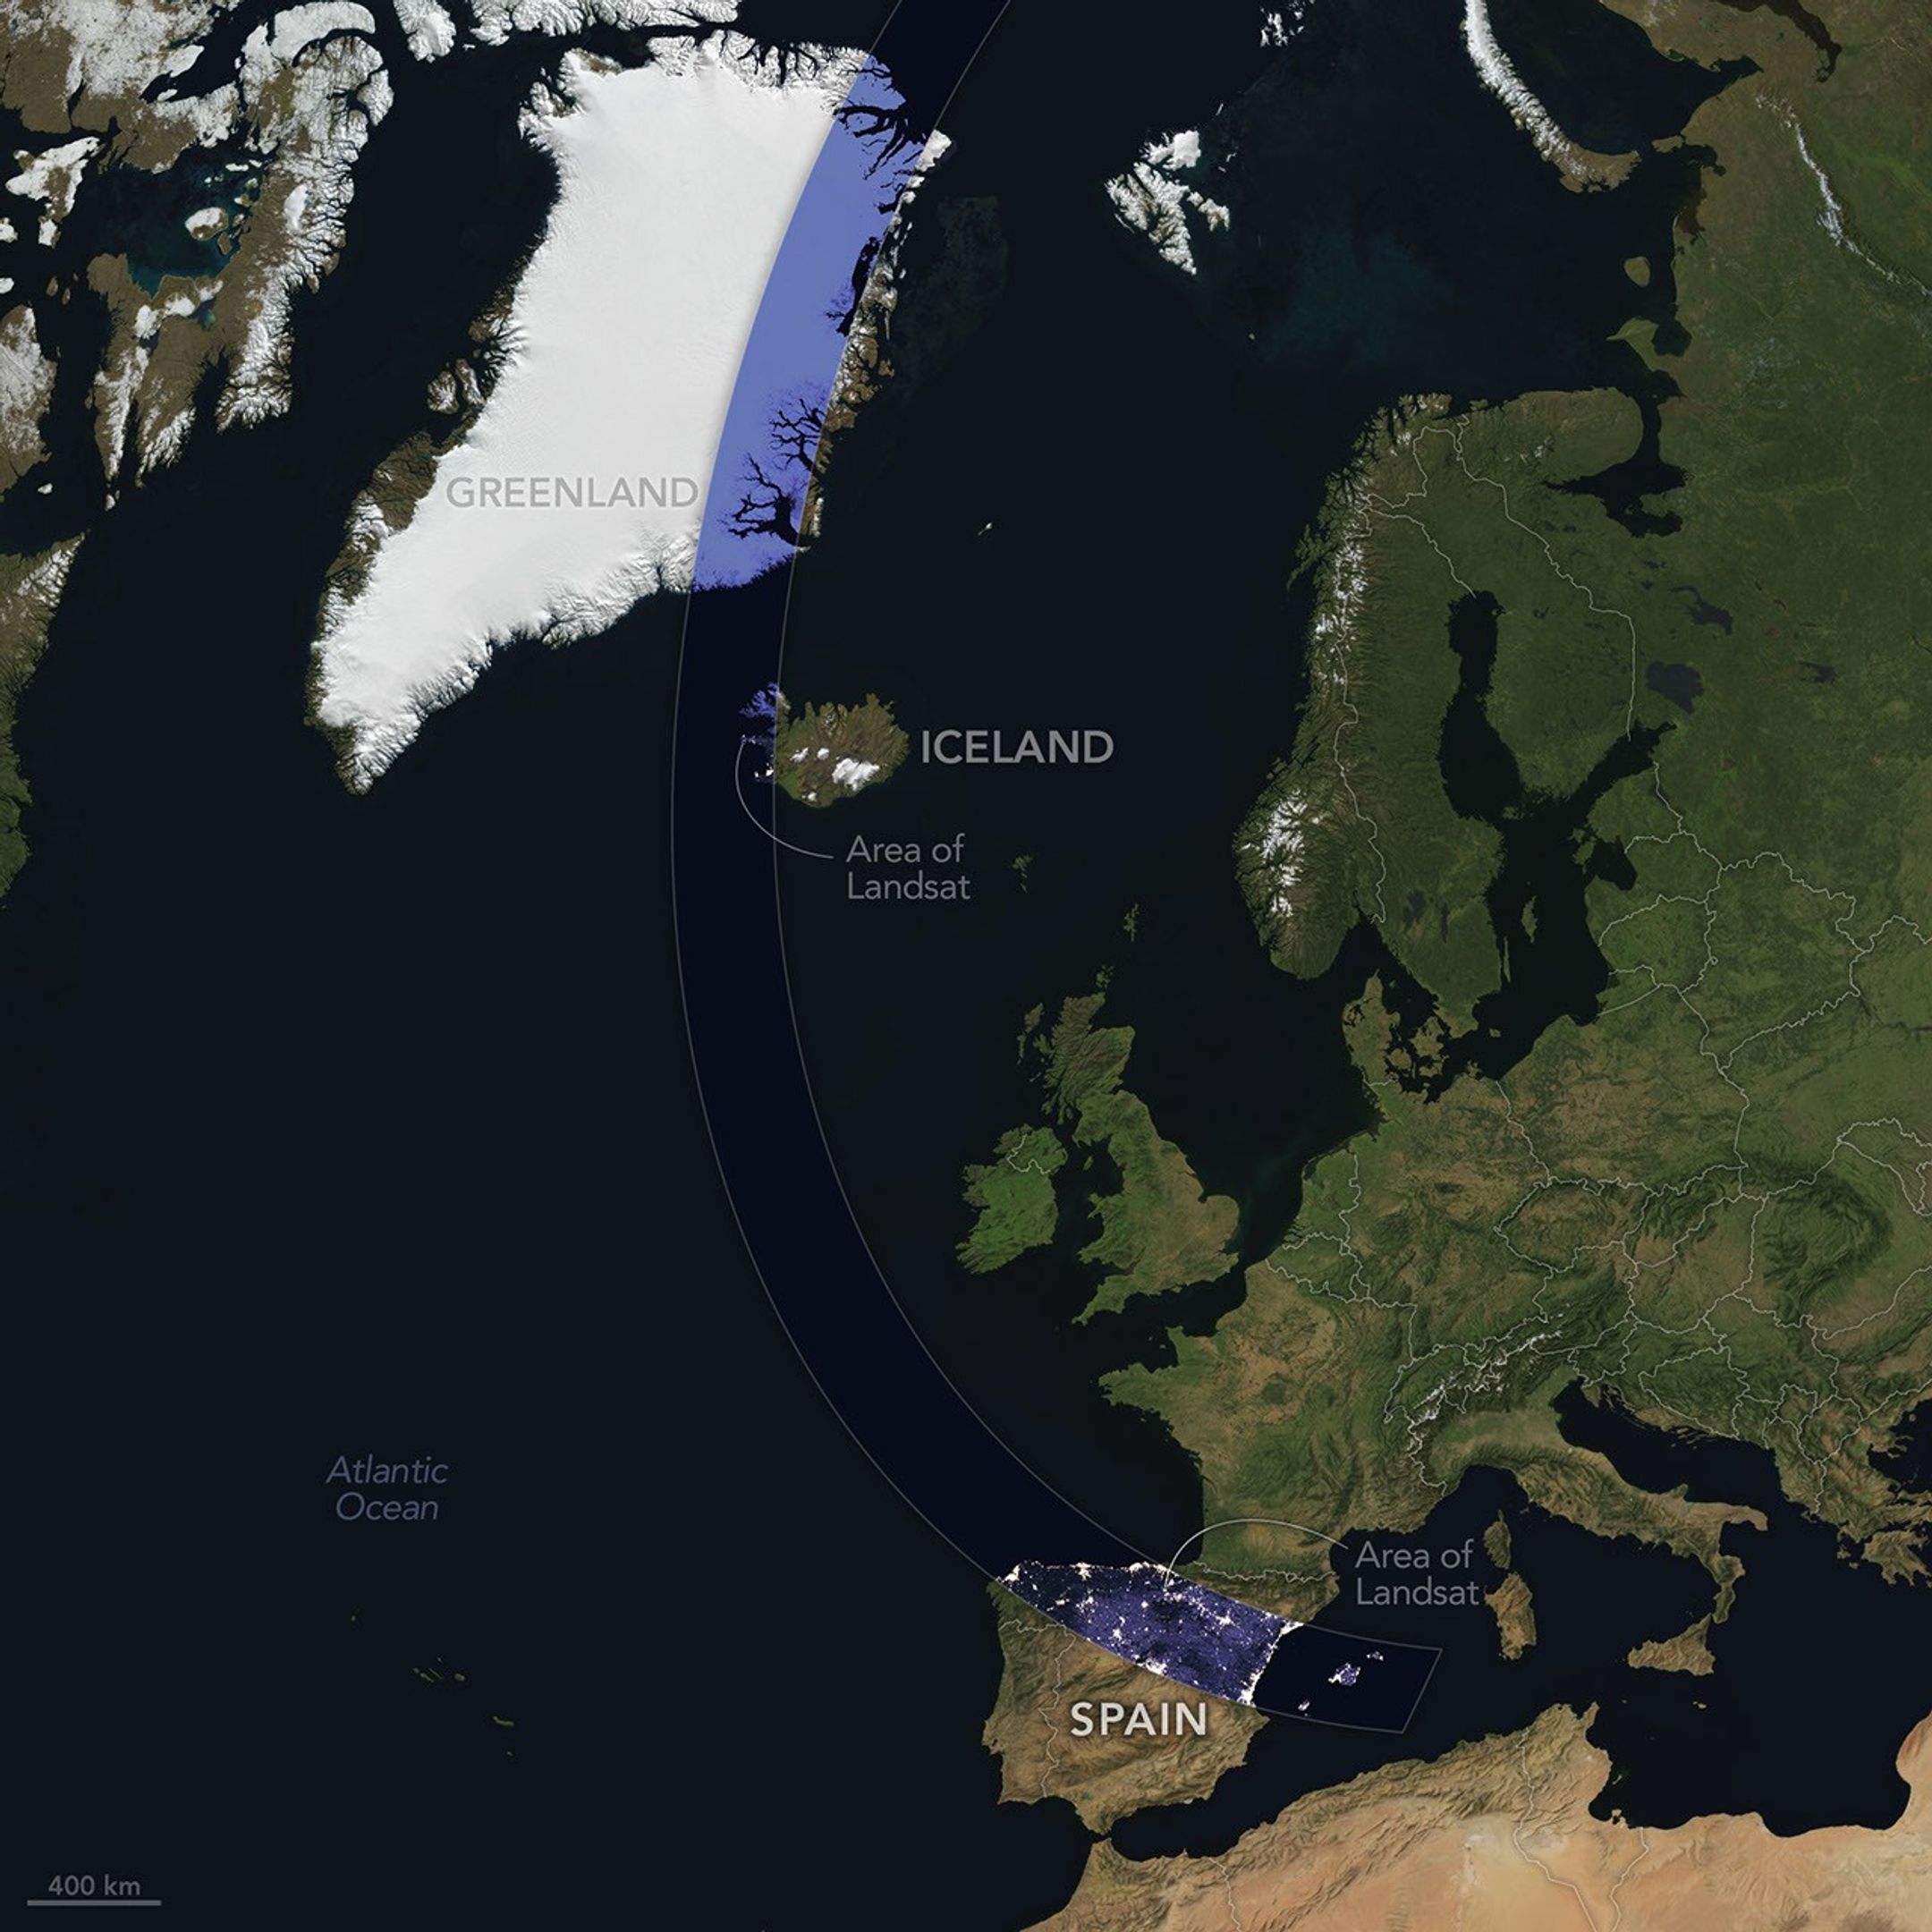
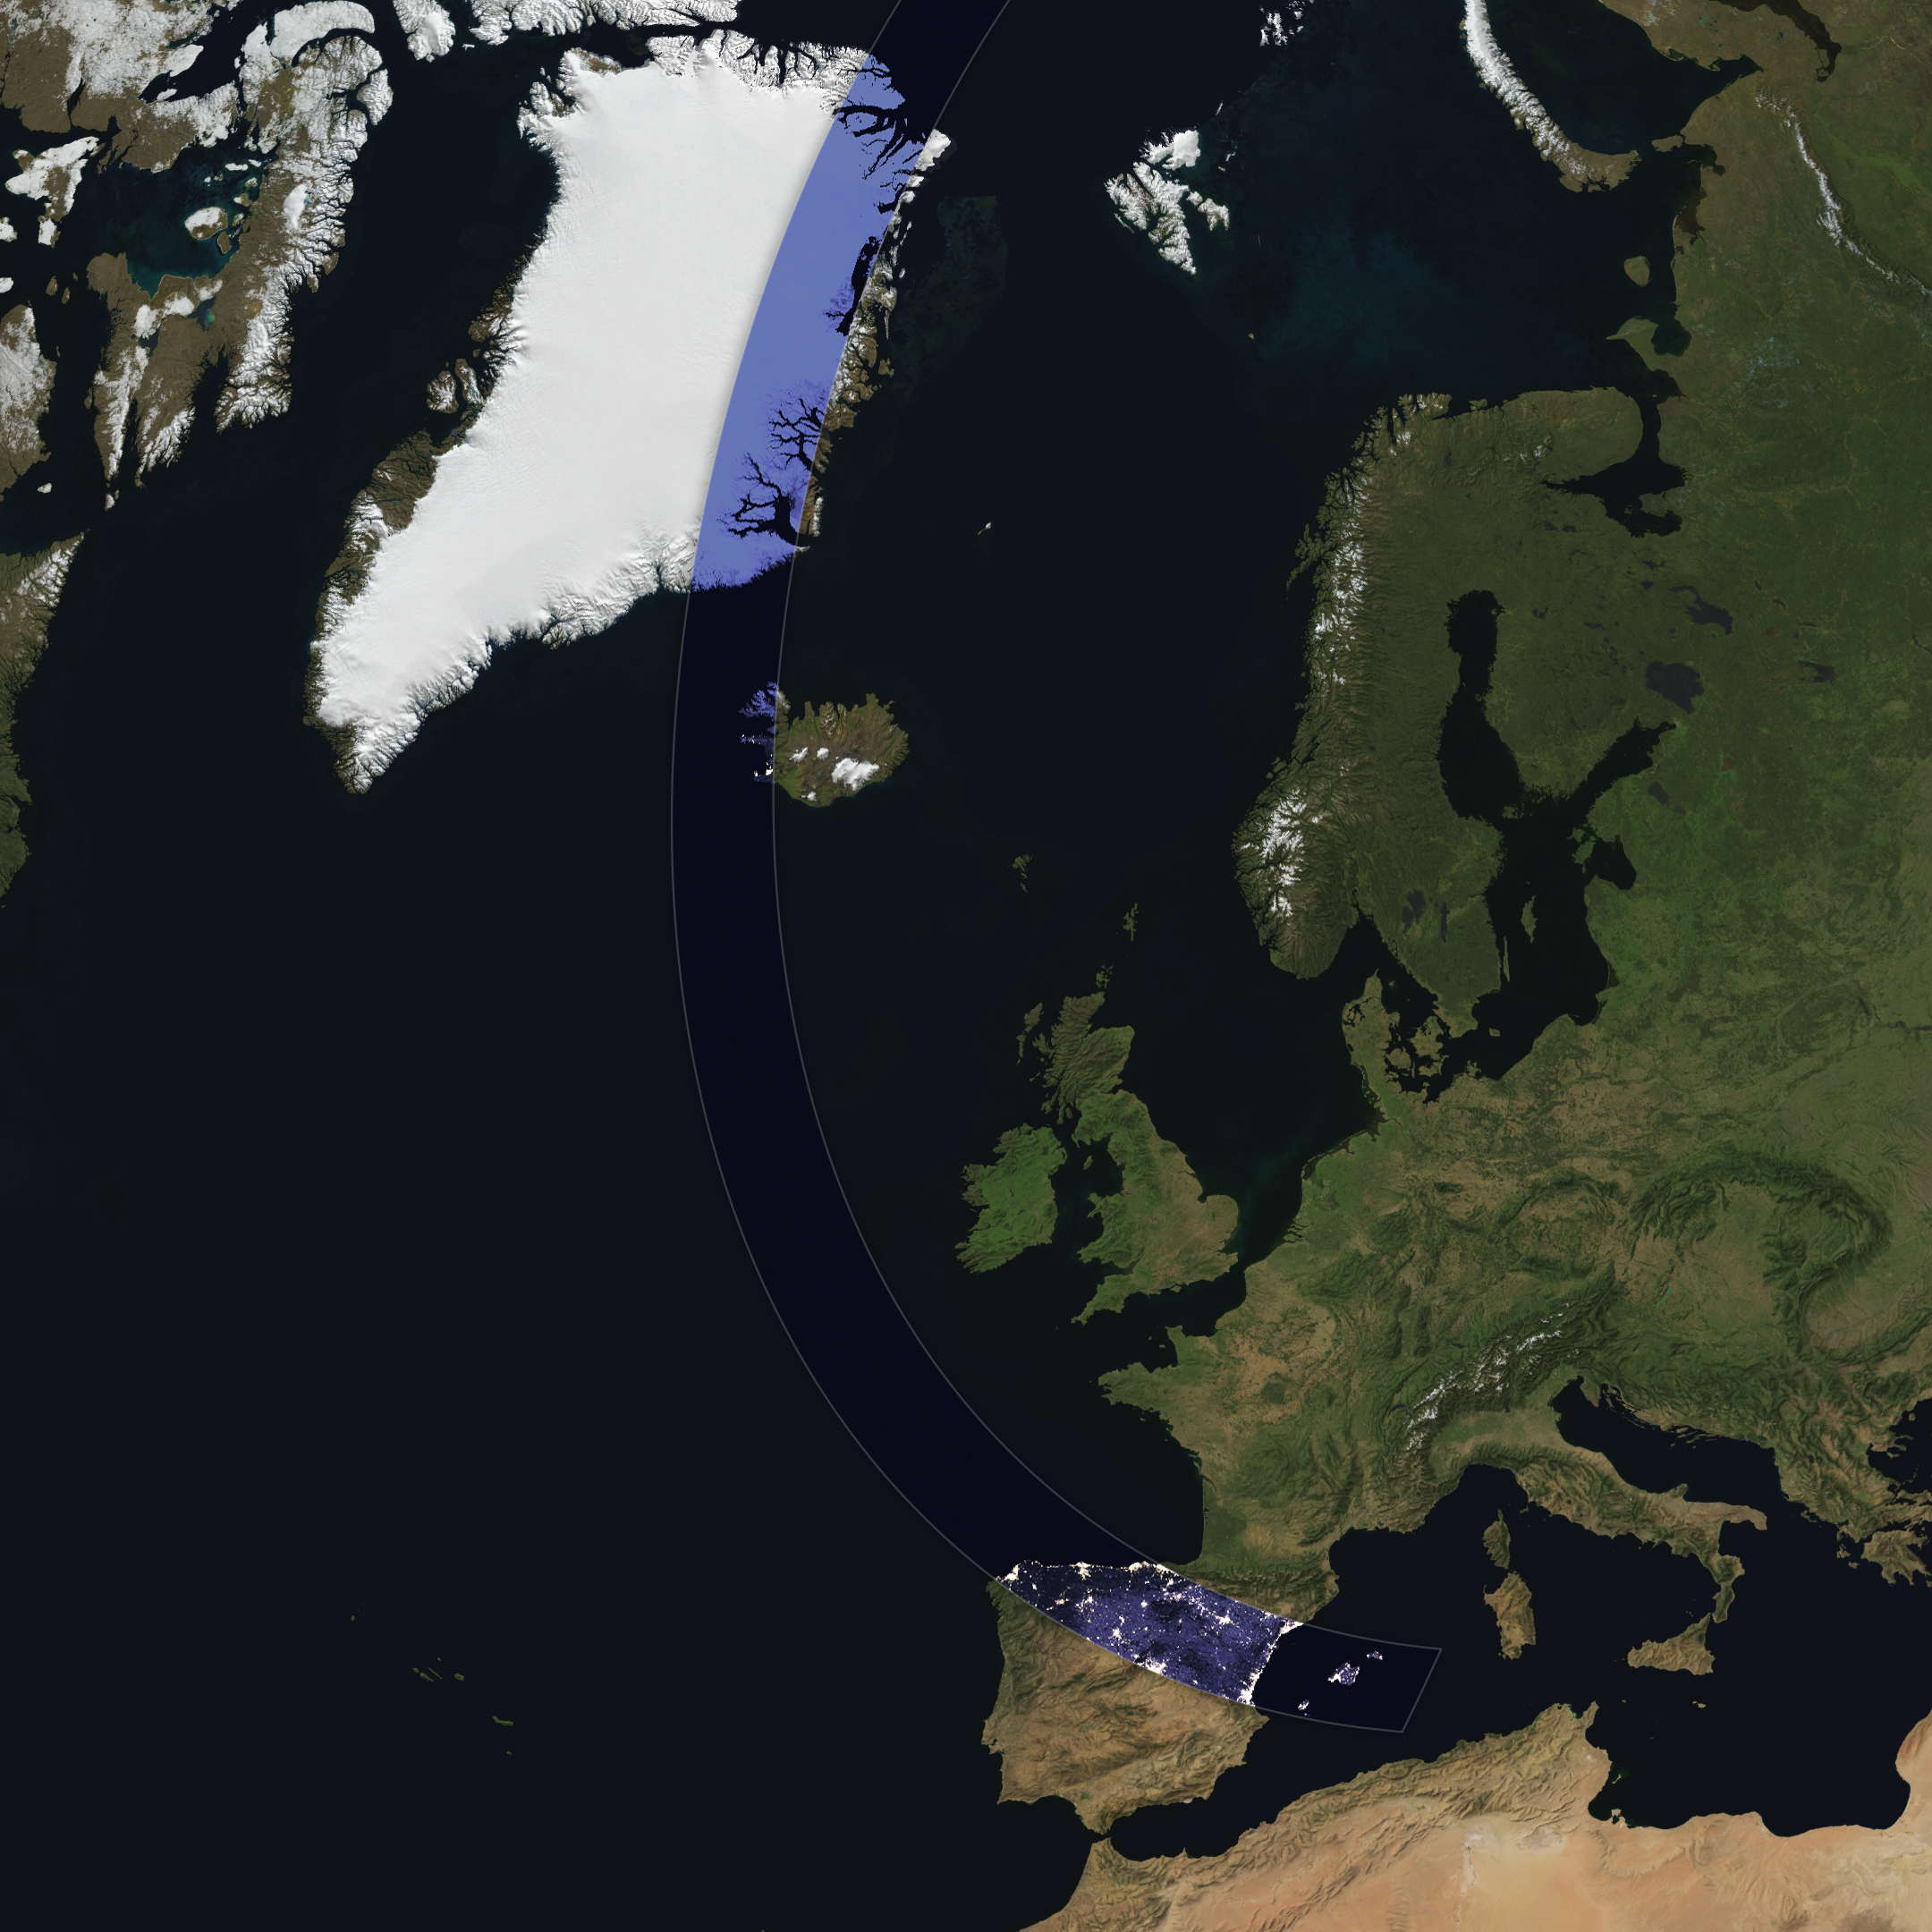
The Sun, Moon, and Earth align on August 12, 2026, to produce a total solar eclipse. When this celestial event last occurred, on April 8, 2024, the path of totality stretched across North America, giving millions the chance to glimpse the Sun’s corona. In 2026, the viewing locales are more limited; only a handful of land areas in the Northern Hemisphere, including parts of Iceland and Spain, fall within the path of totality.

On August 12, the Moon’s shadow will first cross over the Arctic Circle from northern Russia and then track along the eastern side of Greenland. At about 5:45 p.m. local time in Iceland (17:45 Universal Time), the country’s western fringes—including the Snæfellsnes peninsula, shown in the Landsat image above—will begin to experience totality. The greatest eclipse will occur near this sparsely populated peninsula when the Moon appears the largest and covers more of the Sun.

A map shows the path of totality of the solar eclipse on August 12, 2026, arcing across Greenland, Iceland, the North Atlantic, and Spain.
The path of totality of the solar eclipse on August 12, 2026, spans Greenland, Iceland, and Spain. The base imagery for the map comes from Blue Marble: Next Generation, with data from Black Marble shown in the path of totality. Blue Marble is built from scenes captured by MODIS (Moderate Resolution Imaging Spectroradiometer), while Black Marble is based on observations by the VIIRS (Visible Infrared Imaging Radiometer Suite) day-night band.
NASA Earth Observatory/Michala Garrison

The Snæfellsjökull volcano on the western end of the peninsula is covered in ice and last erupted about 1,800 years ago. It is the highlight of a national park of the same name, where people are expected to visit to view the eclipse. The stratovolcano even has a literary claim to fame: in Jules Verne’s A Journey to the Center of the Earth, characters venture underground through its crater, later emerging in an eruption of Stromboli, in Italy. In 2025, a broader area of the peninsula was designated a UNESCO biosphere reserve, containing over 70 percent of Iceland’s flora and an agglomeration of volcanic landscapes, wetlands, and grasslands.

From Iceland, the eclipse shadow, or umbra, progresses across the North Atlantic and reaches northern Spain shortly before sunset. It runs east-southeast across the country, much like the Ebro River (Río Ebro), seen in the Landsat image below.

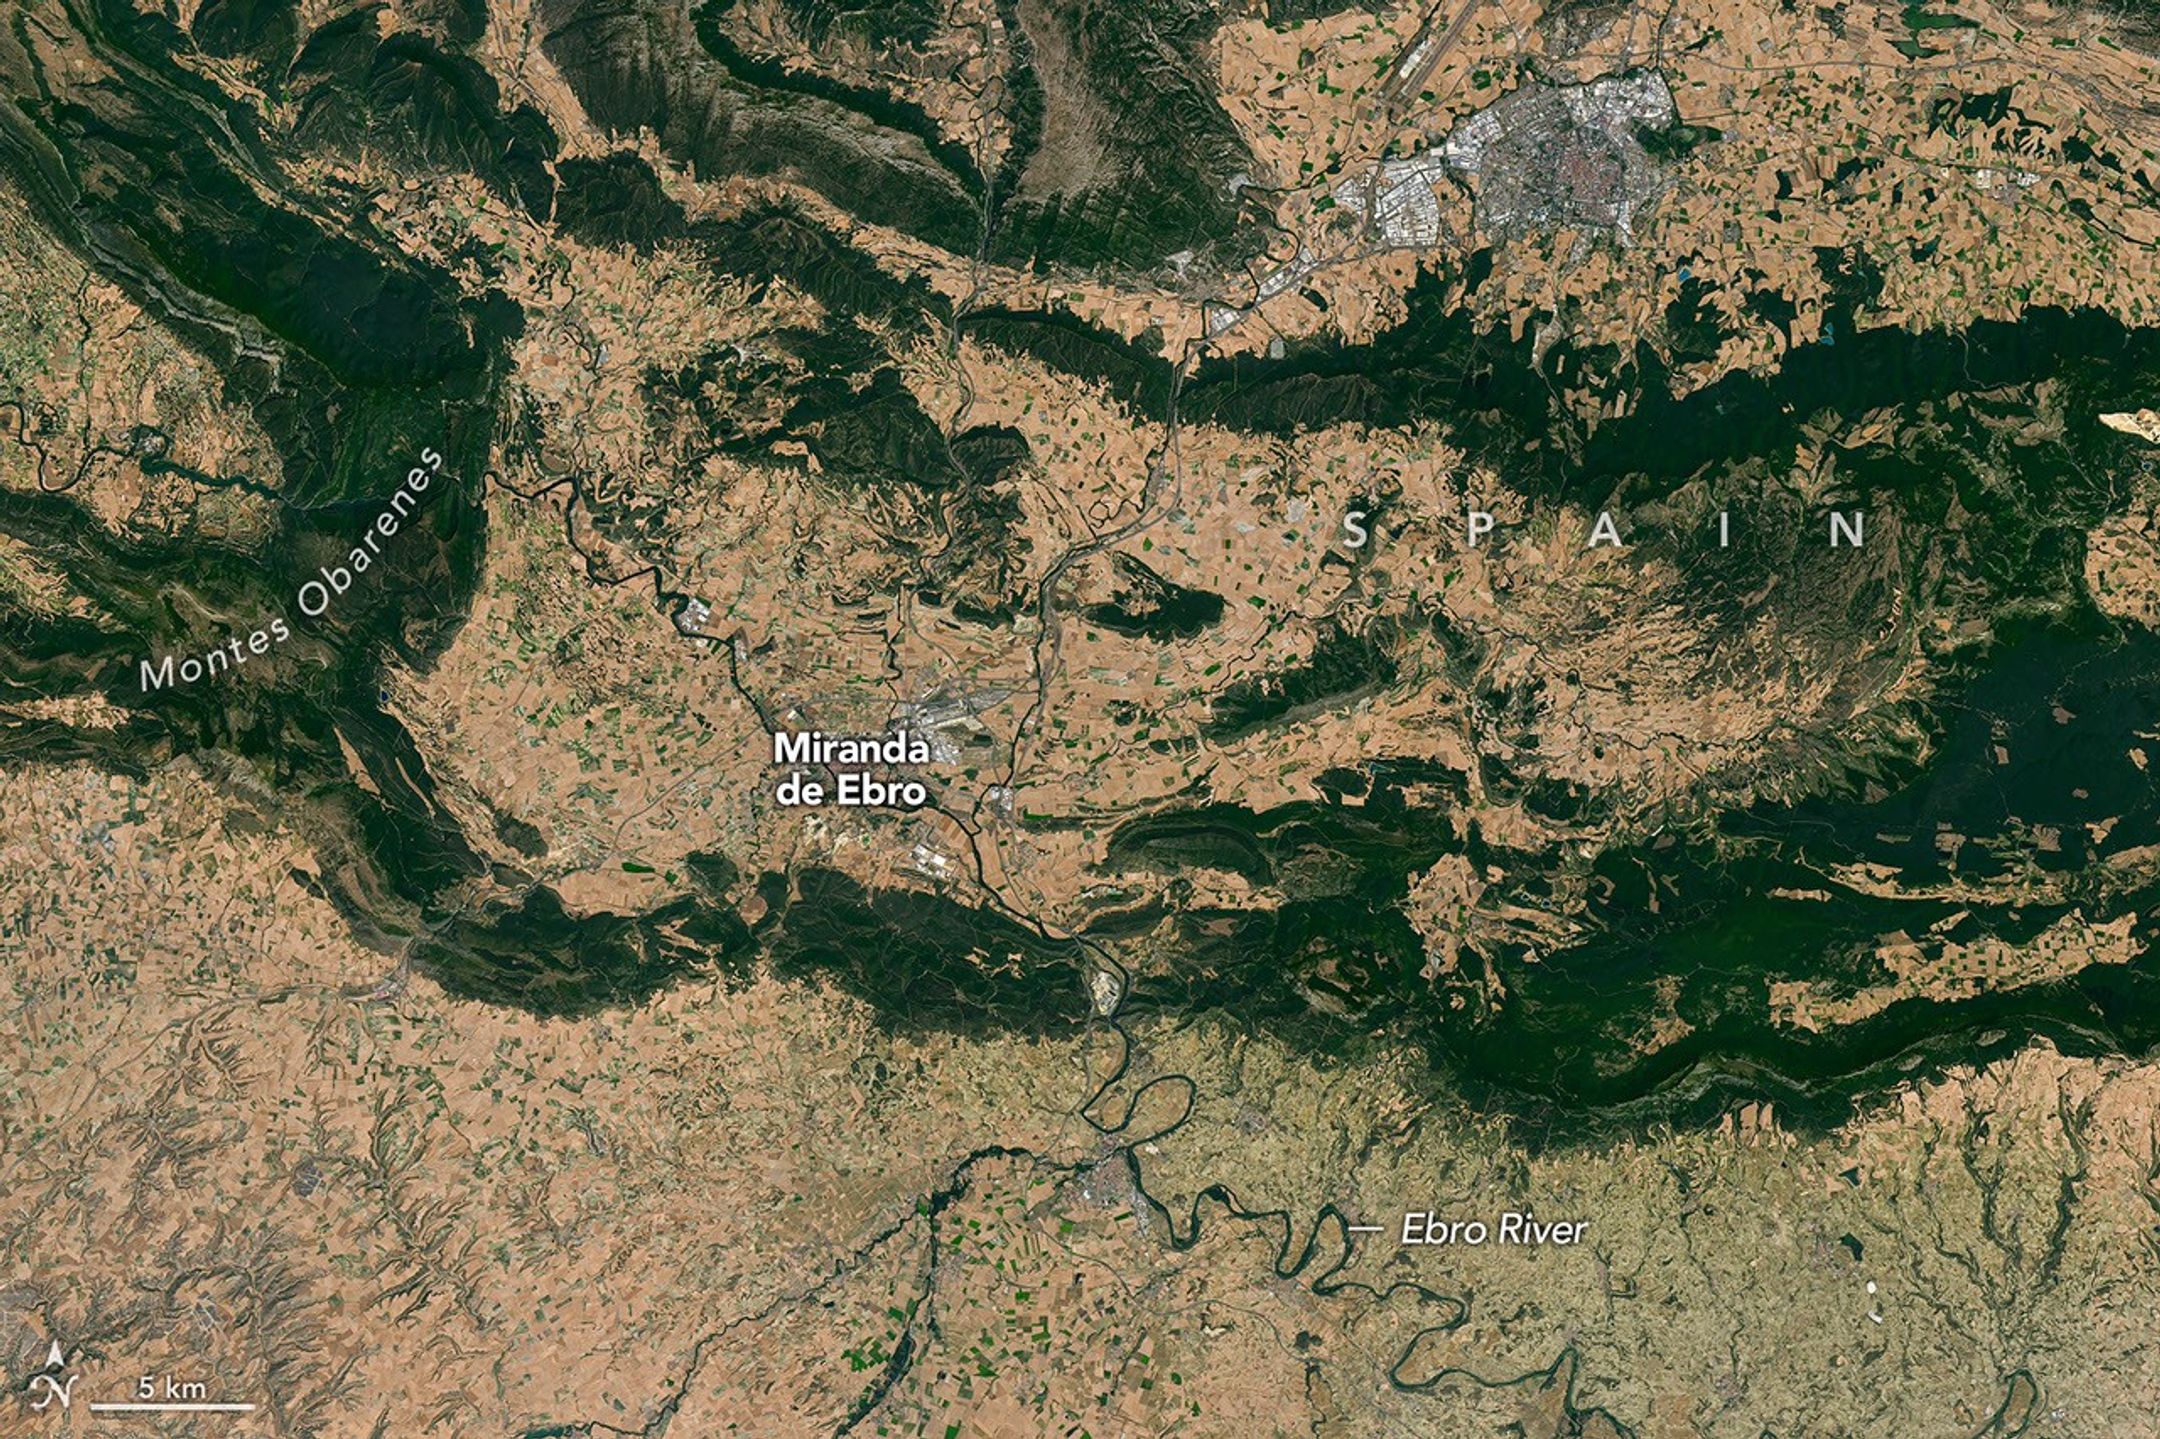
Meandering rivers cut through dark green mountain ridges, across agricultural land, and near several developed areas in northern Spain.

The Ebro River, meandering across northern Spain in this image acquired with the OLI (Operational Land Imager) on Landsat 8 on July 21, 2026, is in the path of totality of the August 2026 solar eclipse.
NASA Earth Observatory/Michala Garrison

The upper Ebro emerges from rugged terrain in Parque Natural de Montes Obarenes-San Zadornil, where it carves canyons and gorges through the eastern foothills of the Cantabrian Mountains. It then meanders through La Rioja, a region known for its vineyards. About 400 kilometers (250 miles) away, the river reaches a delta on the Mediterranean coast between Barcelona and Valencia.

Based on satellite measurements of cloud cover in August over several decades, viewers in Spain have a higher likelihood than those in Iceland of getting a clear look at the eclipse. And despite limited viewing opportunities in the path of totality, the rest of Europe, parts of Africa, Canada, and the northern and northeastern U.S. will experience a partial eclipse.

NASA Earth Observatory images and map by Michala Garrison, using Landsat data from the U.S. Geological Survey, base imagery from Blue Marble: Next Generation and Black Marble, and eclipse path data from Xavier Jubier. Story by Lindsey Doermann.

Downloads

A peninsula in Iceland stretches across the image to the left. A prominent glacier-capped volcano sits near its western end.

July 25, 2026

JPEG (14.69 MB)

A map shows the path of totality of the solar eclipse on August 12, 2026, arcing across Greenland, Iceland, the North Atlantic, and Spain.

August 12, 2026

JPEG (1.92 MB)

Meandering rivers cut through dark green mountain ridges, across agricultural land, and near several developed areas in northern Spain.


July 21, 2026

JPEG (34.46 MB)

References & Resources

You may also be interested in:

Stay up-to-date with the latest content from NASA as we explore the universe and discover more about our home planet.

Colonial National Historical Park

2 min read

The colonial communities of “America’s historic triangle” played defining roles in the road to American independence.

Article

Minute Man National Historical Park

3 min read

Sites relevant to the start of the American Revolutionary War are interspersed throughout the modern-day Boston metropolitan region.

Article

Earthset From the Lunar Far Side

2 min read

The crew of NASA’s Artemis II mission captured extraordinary images of our home planet during their journey around the far…

Article

NASA Completes Astronaut-Deployed Science Instrument for Lunar Surface

11 August 2026 at 20:41
Rectangular box-shaped device resting on a metal table. The front face is covered with a grid of many small black rectangular panels bordered in white. Metal components, brackets, and small box units are mounted along the top. The background shows a large windowed wall with a blurred American flag and an Artemis flag visible behind the device.
The fully-integrated LEMS (Lunar Environment Monitoring Station) ready for environmental testing. A small suitcase-size instrument suite built at NASA Goddard, LEMS is designed to carry out continuous, long-term monitoring of the seismic environment at the Moon, including surface motion caused by moonquakes and meteorite impacts in the lunar south polar region.
NASA Goddard/Mike Guinto

NASA has declared “wrenches down” on the first completed payload designed for Artemis astronauts to deploy on the Moon’s surface. Engineers working on NASA’s Lunar Environment Monitoring Station, or LEMS, have completed hardware development and testing and the payload is ready for its permanent home near the lunar South Pole. With the hardware complete, LEMS is ready to support one of the Artemis program’s core goals: enabling sustained lunar science and exploration.

The LEMS instrument package contains two highly sensitive seismometers that will monitor ground vibrations from moonquakes and meteorite impacts, providing scientists with insights into the Moon’s interior and the seismic hazards astronauts might encounter at the surface. Its modular design allows the system to be adapted or expanded to host new instruments in the future, creating a reusable platform that can evolve as scientific priorities grow.

The payload will remain in a clean room at NASA’s Goddard Space Flight Center in Greenbelt, Maryland, where it was built, until it is assigned to an Artemis mission for deployment to the lunar surface.

“The completion of the LEMS scientific instrument is a major step in a new era of lunar surface science. Innovative science experiments will uncover, measure, and reveal the Moon’s secrets while astronauts open new frontiers for discovery,” said Joel Kearns, deputy associate administrator for exploration, Science Mission Directorate, NASA Headquarters in Washington. “And, behind the scenes, countless teams across NASA and our partners are pushing the boundaries of what surface instruments can do, building the tools that will make future exploration possible and safer.”

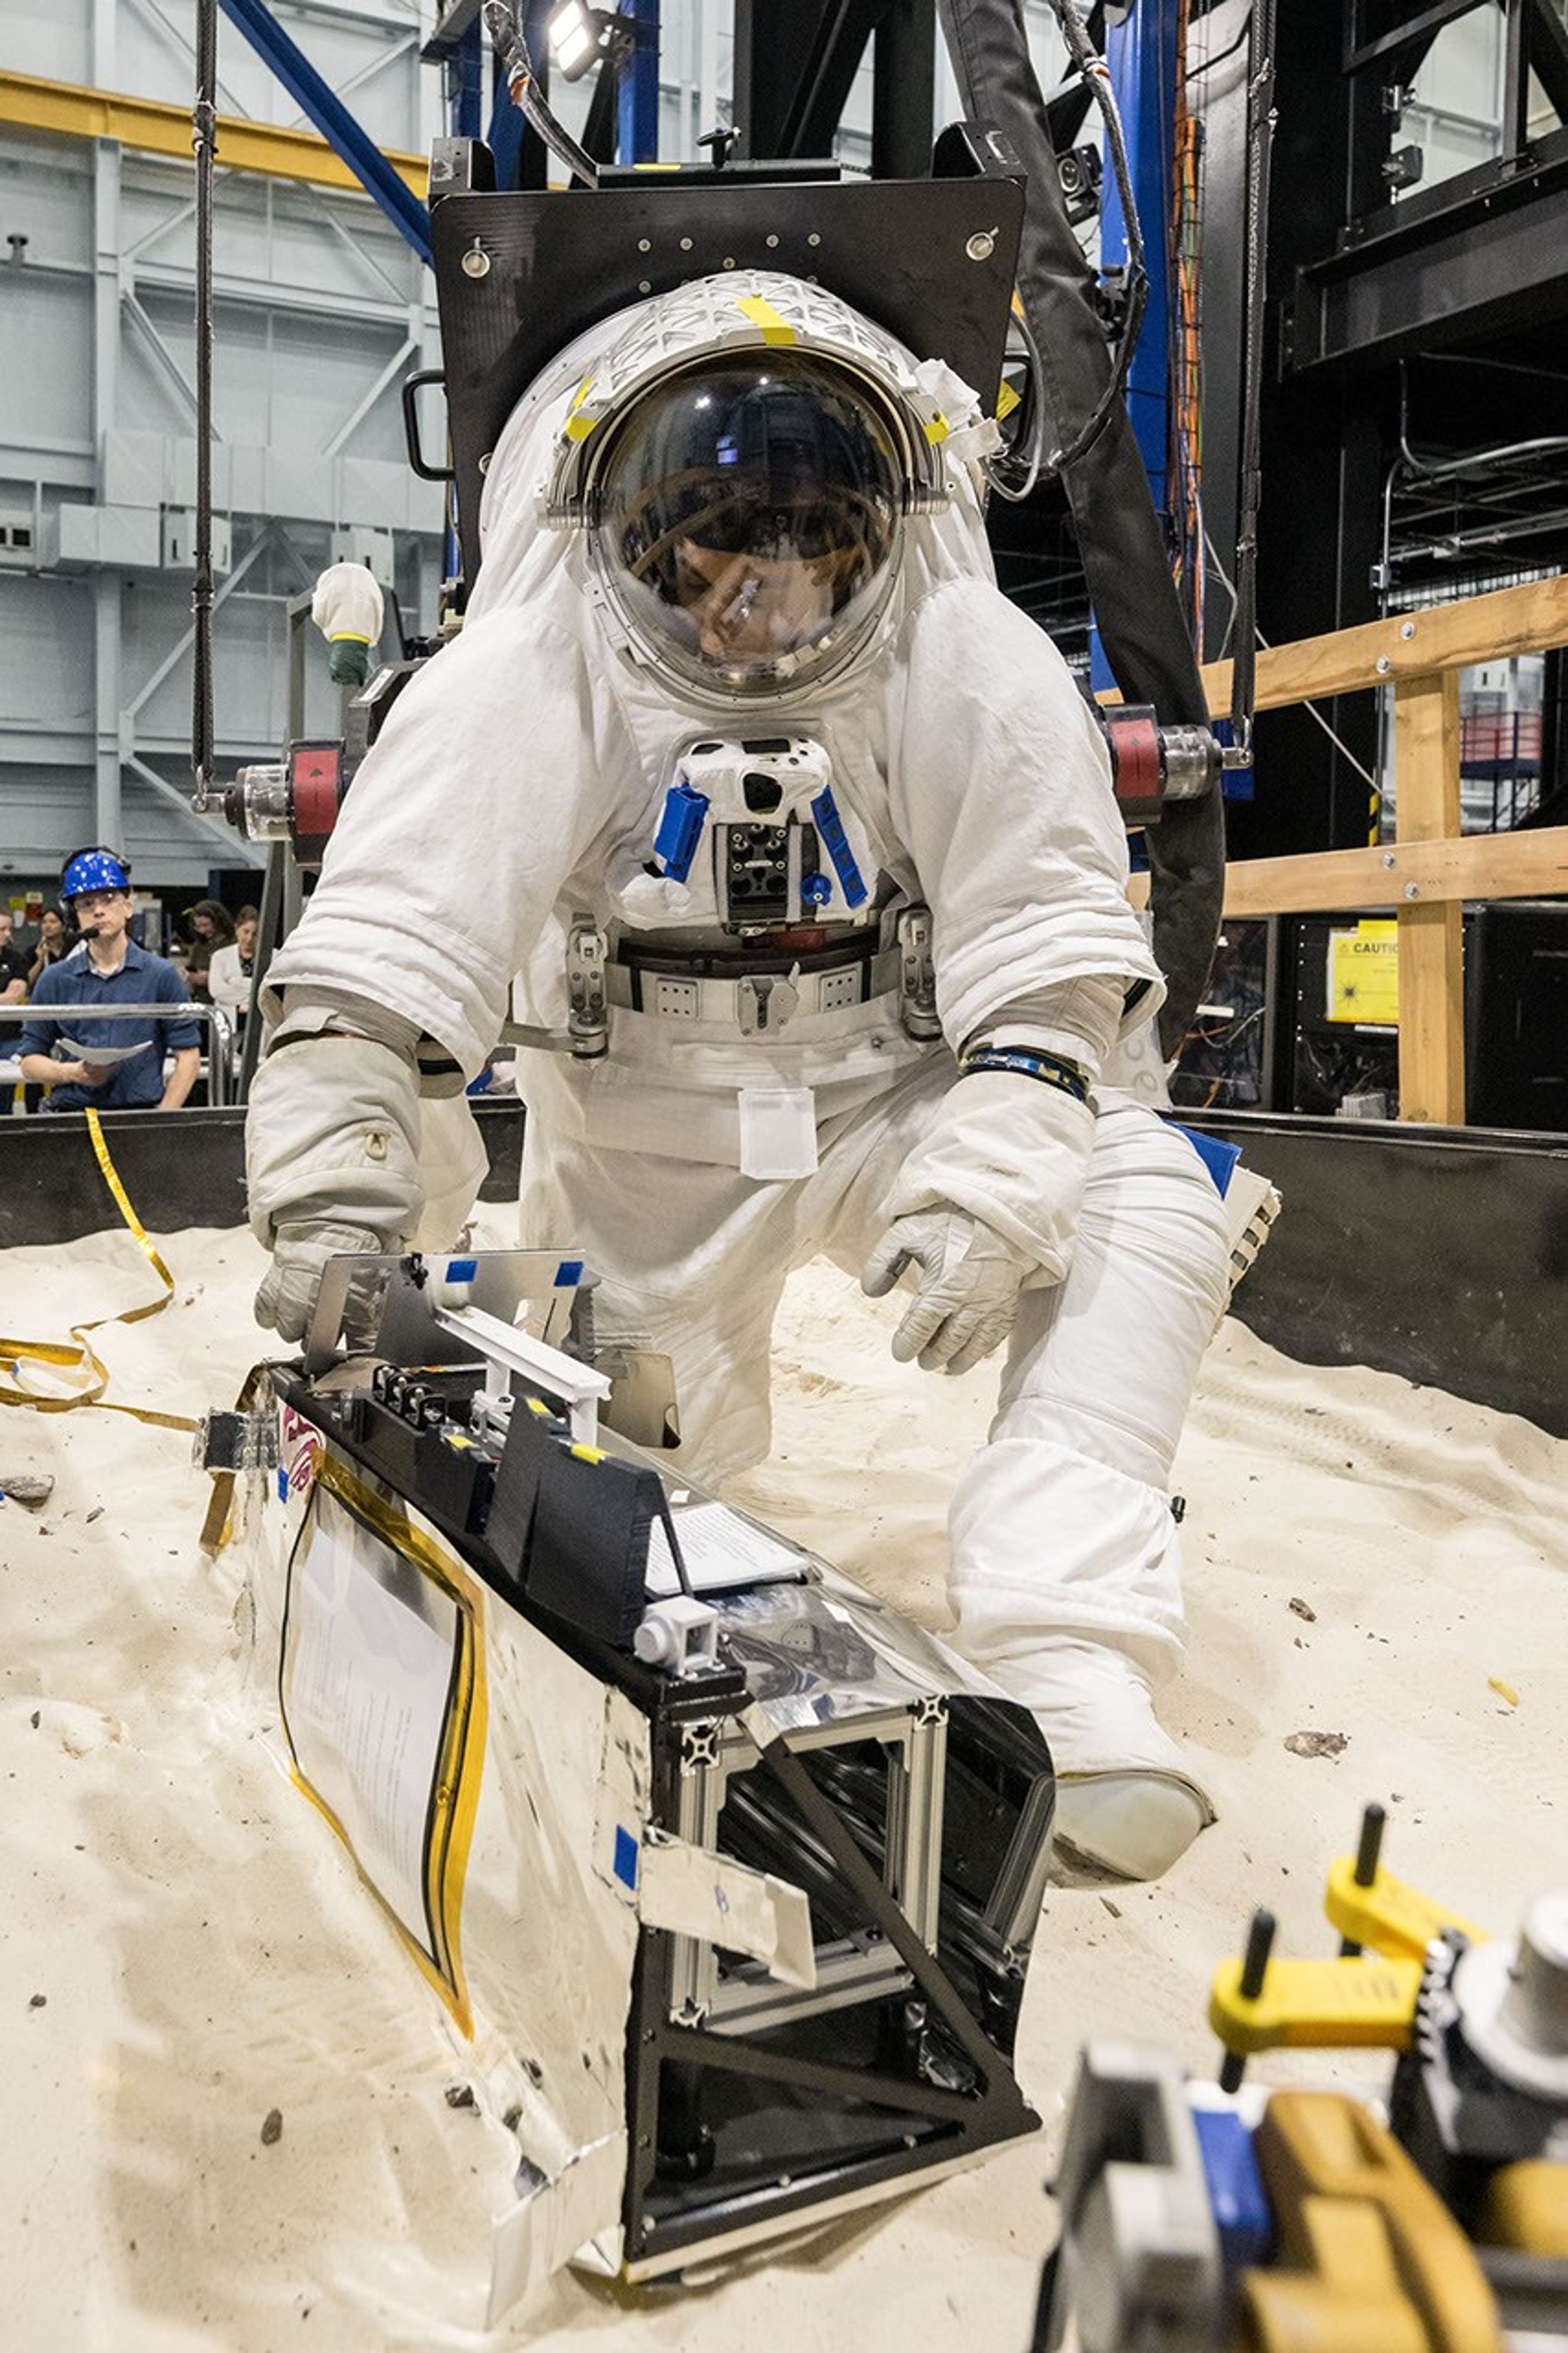
An astronaut in a white spacesuit kneels in simulated lunar soil while working with scientific equipment in a large testing facility. Staff members and support structures are visible in the background.
A scientist wearing NASA’s xEMU prototype space suit is testing the handling of a mockup version of NASA’s Lunar Environment Monitoring Station, or LEMS. The testing took place at the Active Response Gravity Offload System, a simulated reduced gravity environment at NASA’s Johnson Space Center in Houston.
NASA Johnson

The LEMS payload builds on a legacy of lunar seismic tracking. Apollo astronauts deployed a network of seismometers on the Moon’s nearside equatorial region between 1969 and 1972. Those instruments operated until 1977, recording about 13,000 moonquakes and other ground vibrations that helped scientists begin to understand the composition of the Moon’s interior. For decades, researchers have hoped to spread more seismometers, updated with new technologies, across the lunar surface.

Now, LEMS will carry the first seismometers to be deployed by future astronauts to listen for faint ground vibrations, collecting new clues to the Moon’s internal structure and ongoing seismic activity. The sensors will be the most compact, sensitive, and energy-efficient seismometers ever built for planetary exploration.

LEMS itself is about the size of a small suitcase, weighing 11 pounds in the Moon’s low-gravity environment. It will carry not just these seismic sensors, but everything it needs to function independently of humans after deployment. LEMS is built to manage its own power production via a lightweight, flexible solar array that conforms to the shape of the LEMS unit. It also will manage its operational activities to ensure continuous data collection based on a preset plan, and monthly data transmission to Earth. The payload will do all this while maintaining a stable internal temperature throughout the massive day-to-night temperature swings of the South Pole region.

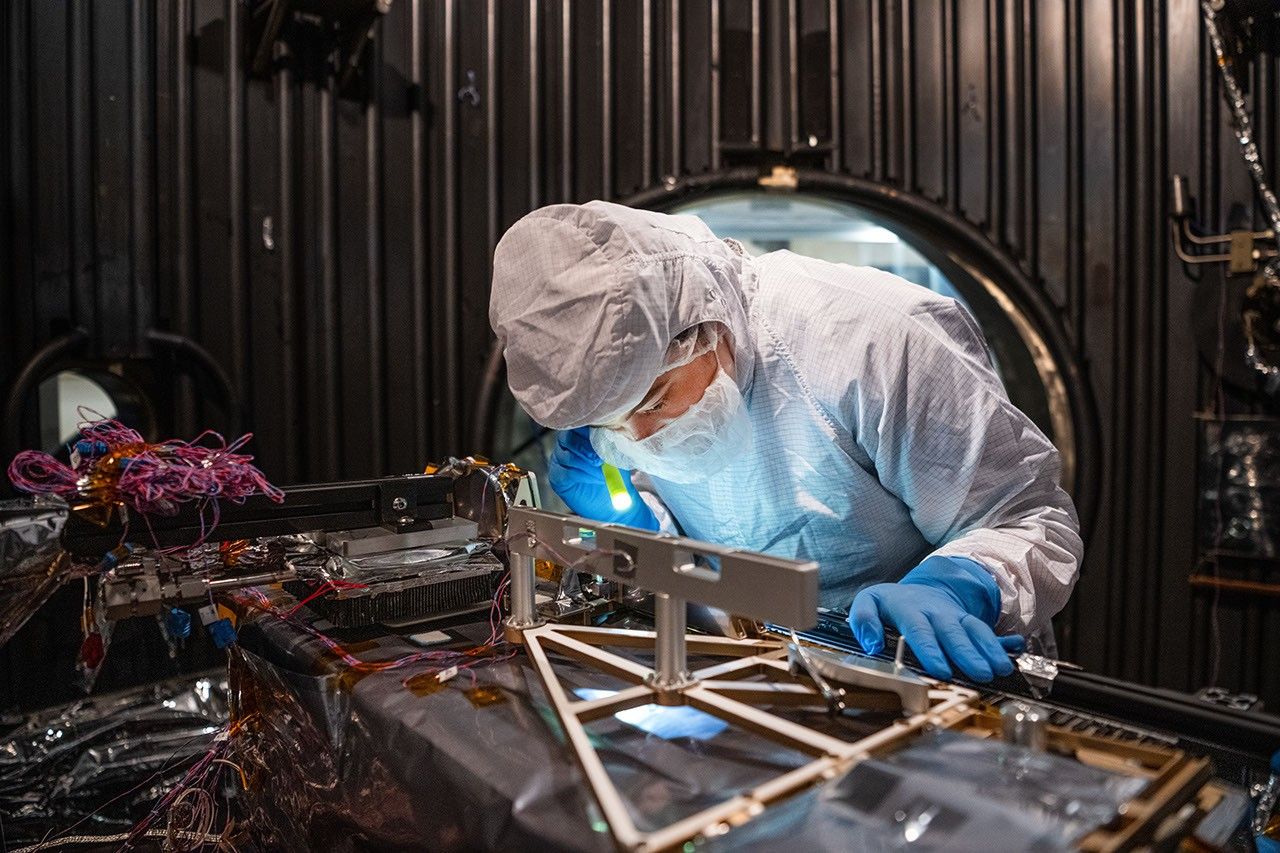
A technician in a white clean-room suit and blue gloves uses a small flashlight to inspect a spacecraft instrument inside a dark testing chamber. Colorful wires and metallic components surround the instrument.
Mechanical Engineer Brie Ludwig inspects the Lunar Environment Monitoring Station (LEMS) in preparation for testing in a thermal vacuum chamber at Goddard Space Flight Center in Greenbelt, Maryland, on March 31, 2026. LEMS is a compact, autonomous, and self-sustaining seismometer suite designed to carry out continuous, long-term monitoring of the lunar seismic environment at the South Polar region.
NASA/Denny Henry

“When we conceived of LEMS, we weren’t just thinking about the next mission, we were thinking about the next generation of lunar exploration,” said Mehdi Benna, a University of Maryland Baltimore County scientist who leads LEMS from NASA Goddard. “Our vision was to create a scientific buoy for the Moon. Like an ocean buoy on Earth, LEMS is designed to be easy to build, adaptable to different scientific objectives, and capable of operating independently for years.”

Before any surface science could happen, Benna and his team had to ensure that LEMS could survive the trip to the Moon and the harsh environment of its surface. Over the past five months, LEMS and its components have been subjected to a demanding series of environmental and operational tests. Engineers verified LEMS can endure the violent shaking of launch, the journey to the lunar surface, and the Moon’s temperature and radiation environment. The team also showed that the instrument package’s mechanical and electrical design is safe for astronaut handling.

The LEMS payload was built to operate through the lunar night, which lasts two Earth weeks, without external power assistance or a heat source. Past lunar surface instruments relied on radioisotope heaters for warmth and power. But LEMS instead will withstand temperatures that dip to minus 400 degrees Fahrenheit in some areas by using advanced insulation materials, low-thermal-conductivity cables that minimize heat loss, and a thermal regulator that conducts heat away during the day to prevent overheating and helps retain heat at night.

These innovations reduce mass and power needs, setting the stage for lighter, energy-efficient instruments that can operate continuously at future Artemis landing sites and the NASA-led Moon Base.

The LEMS payload is led by University of Maryland Baltimore County and University of Maryland College Park. Technical implementation is led by NASA Goddard. The University of Arizona, in partnership with Silicon Audio, Inc., supplied LEMS’ two state-of-the-art seismometers. Morehead State University in Kentucky provided LEMS’ telecommunication system and will operate the instrument on the surface. Washington University in St. Louis will manage the instrument’s data processing and dissemination to the larger scientific community.

Arkansas researchers map genetic neighborhoods to identify disease-causing bacteria

11 August 2026 at 19:57

Scientists in Arkansas have developed a machine-learning approach that can identify potentially disease-causing strains of a poultry bacterium by analyzing not only which genes are present, but also how those genes are arranged across the genome. The method focuses on the “genetic neighborhoods” surrounding genes, offering a new way to distinguish harmful strains of Enterococcus cecorum from closely related strains that do not cause disease.

E. cecorum is commonly found in poultry environments, and many of its strains are harmless. However, pathogenic strains can cause arthritis, bone infections and lameness, creating serious animal-welfare problems and economic losses for poultry producers. Because pathogenic and nonpathogenic strains can share many of the same genes, identifying the genetic features associated with disease has been challenging.

The research team, led by Aranyak Goswami of the Arkansas Agricultural Experiment Station’s Center for Agricultural Data Analytics, examined the organization of genes within genomic islands. These are segments of DNA that bacteria often acquire from other microorganisms through horizontal gene transfer. Genomic islands can carry genes involved in antibiotic resistance, bacterial survival, movement of DNA and virulence, making them important regions for understanding how pathogens emerge.

Rather than treating the bacterial genome as a simple list of genetic components, the researchers analyzed it as a structured map. They investigated which genes occurred near one another, the order in which they appeared and the way groups of neighboring genes formed recurring units known as genomic-island cassettes. This architecture provided information that could be missed when genes are examined individually.

“The machine-learning model recognizes patterns in gene order much like it recognizes patterns in language,” Goswami said. In the same way that a language model can learn that certain words frequently appear together, the computational system learned that particular combinations and arrangements of bacterial genes were associated with pathogenic strains. The approach therefore captures relationships among genes rather than relying only on the presence or absence of individual DNA sequences.

For the proof-of-concept study, the researchers analyzed the genomes of 145 E. cecorum strains isolated from poultry. The dataset included 95 nonpathogenic strains and 50 pathogenic strains capable of causing illness. The analysis found that disease-associated strains were more likely to contain genomic islands enriched in genes linked to antimicrobial resistance and the transfer of genetic material between bacteria.

Those findings do not mean that every bacterium carrying such genes will necessarily cause disease. Instead, the researchers describe the system as an exploratory classification and research tool. It identifies patterns that may help scientists investigate why some bacterial lineages become harmful, while also providing clues about how resistance and virulence traits move through bacterial populations.

Current monitoring methods for E. cecorum often depend on culturing the bacterium or screening for specific genes. Such techniques remain valuable, but they may overlook broader genomic relationships. The new pipeline could complement these approaches by evaluating the wider context in which genes occur. Additional testing with larger and more geographically diverse datasets will be necessary before the method can be used for routine flock surveillance or diagnostic decision-making.

The researchers believe the strategy could eventually be adapted to other bacterial species affecting animals, humans, wildlife and plants. Goswami’s team is beginning to examine Enterococcus faecalis, a close relative of E. cecorum and a frequent cause of hospital-acquired infections in humans. They also plan to apply the pipeline to Escherichia coli and other bacteria to study how nonpathogenic lineages acquire the genomic configurations associated with disease. The study, published in Frontiers in Microbiology, demonstrates how machine learning and comparative genomics can reveal hidden signals in bacterial DNA and may help researchers track the evolution of emerging pathogens.

Subject of Research: Animals

Article Title: Genomic-island cassette architecture provides interpretable signal for exploratory classification of poultry-associated Enterococcus cecorum lineages

News Publication Date: 7-Jul-2026

Web References: https://doi.org/10.3389/fmicb.2026.1882753

References: Frontiers in Microbiology, DOI: 10.3389/fmicb.2026.1882753

Image Credits: UA University Relations photo by Chieko Hara

Keywords: artificial intelligence, machine learning, deep learning, computational biology, bacterial pathogens, Enterococcus cecorum, genomic islands, genomic architecture, antibiotic resistance, poultry disease, pathogen surveillance, comparative genomics

Ancient Warming Event Reveals Possible Climate Tipping Point

11 August 2026 at 19:40

A climate shock that unfolded about 304 million years ago is offering scientists a dramatic warning about how quickly Earth’s climate system can amplify an initial temperature rise. During the Late Paleozoic Ice Age, a relatively modest increase in global temperatures appears to have triggered a much larger episode of warming, as methane released from thawing permafrost intensified the greenhouse effect. Researchers say the ancient event provides a powerful geological parallel for the climate changes occurring today.

The study, led by Le Yao of the Nanjing Institute of Geology and Paleontology with contributions from University of Cincinnati geosciences professor Thomas Algeo and international colleagues, examined a short-lived warming episode during Earth’s penultimate ice age. Their findings suggest that global sea surface temperatures eventually increased by more than 7 degrees Celsius, or approximately 12 degrees Fahrenheit. The rise was not necessarily caused by one enormous initial pulse of carbon. Instead, it may have developed through a chain reaction in which warming activated additional natural sources of greenhouse gases.

The Late Paleozoic Ice Age extended across a vast span of geological time, when large ice sheets covered parts of the supercontinent Gondwana. Although the planet was in an “icehouse” state, atmospheric carbon dioxide and methane still had the power to destabilize the climate. The newly analyzed warming event is particularly significant because it occurred under ice-age conditions rather than during an already warm greenhouse world. That makes it a valuable analog for the modern Earth, which still contains continent-scale ice masses in Greenland and Antarctica.

According to the researchers, the initial climate disturbance may have been linked to volcanic activity. Volcanic emissions can inject carbon dioxide and other gases into the atmosphere, where they absorb outgoing infrared radiation and prevent some heat from escaping into space. The warming may also have been assisted by changes in Earth’s orbit. Over long cycles, variations in orbital shape alter the distribution of sunlight across the planet, influencing the growth and retreat of ice sheets and changing the seasonal balance of solar energy.

At first, the additional carbon may have produced only a limited temperature increase. But once warming crossed a critical threshold, frozen ground in high-latitude regions began to thaw. Permafrost contains large quantities of organic carbon preserved in frozen soils. When that material becomes available to microbes, decomposition can release carbon dioxide and methane. Methane is especially powerful over shorter atmospheric timescales because, molecule for molecule, it absorbs considerably more infrared radiation than carbon dioxide, even though it remains in the atmosphere for less time.

This process can create a positive climate feedback. An initial warming causes permafrost to thaw, thawing releases greenhouse gases, and the additional gases produce further warming. That extra heat can accelerate more thawing, allowing the cycle to reinforce itself. The researchers describe the ancient event as a transient global warming episode in which a comparatively modest carbon release appears to have crossed a climatic tipping point and initiated much more extensive carbon emissions from natural reservoirs.

The geological timescale of the ancient warming is also central to the study’s relevance. Algeo said the temperature change unfolded over tens of thousands of years, with warming occurring at an average rate of roughly one-tenth of a degree Celsius per 1,000 years. Modern warming is progressing far more rapidly. Researchers have observed an increase of nearly 1 degree Celsius in global sea surface temperature over approximately the past century, a rate many times faster than the average change reconstructed for the ancient event.

The comparison does not mean that Earth is destined to repeat the precise conditions of 304 million years ago. Continents, ecosystems, atmospheric composition and ice-sheet geometry were all different in the Late Paleozoic. However, the physics of greenhouse warming and the existence of carbon feedbacks remain relevant. Ancient climate records reveal how a system that appears stable can respond nonlinearly when warming activates processes capable of releasing additional greenhouse gases.

The findings also place human history in a broader planetary context. All recorded human civilization has developed during the most recent ice age, despite the fact that the term can sound incompatible with today’s climate. In scientific usage, Earth remains in an ice age because substantial permanent ice sheets still exist in Greenland and Antarctica. The ancient warming episode matters precisely because it demonstrates that an ice age does not guarantee a permanently cold or stable climate. Even within an icehouse world, a small disturbance can trigger rapid and substantial changes when reinforcing feedbacks are engaged.

The research, published in the Proceedings of the National Academy of Sciences, underscores why scientists closely monitor permafrost, polar ice and other climate-sensitive carbon stores. The ancient record cannot provide an exact forecast of future warming, but it shows that Earth’s climate has repeatedly responded to carbon disturbances with amplifying feedbacks. As modern emissions continue to raise temperatures at an exceptional rate, the geological evidence offers a clear message: the danger lies not only in the carbon released directly by human activity, but also in the natural carbon sources that warming can unlock.

Subject of Research: Ancient global warming, permafrost methane feedbacks, and climate tipping points during the Late Paleozoic Ice Age

Article Title: A transient global warming event during Earth’s penultimate icehouse

Web References: https://doi.org/10.1073/pnas.2601643123

References: Proceedings of the National Academy of Sciences, DOI: 10.1073/pnas.2601643123

Image Credits: Andrew Higley, University of Cincinnati

Keywords: climate change, global warming, ice age, Late Paleozoic Ice Age, permafrost, methane, climate feedback, tipping point, paleoclimate, geology, volcanic activity, Earth’s climate history

Which Families Pay Most for Neonatal Intensive Care? Analyzing NICU Out-of-Pocket Costs

11 August 2026 at 14:06

The price of saving a newborn’s life can extend far beyond the hospital walls. A new analysis published in the Journal of Perinatology is drawing attention to a largely invisible consequence of neonatal intensive care: the direct medical out-of-pocket costs paid by families. The study, led by researchers Gorka, Profit and Phibbs, examines who carries the greatest financial burden during a neonatal intensive care unit admission and investigates how structural conditions may shape those costs.

Neonatal intensive care is among the most technologically advanced forms of medicine. Infants in NICUs may require mechanical ventilation, incubators that regulate temperature and humidity, continuous heart and oxygen monitoring, intravenous nutrition, specialized medications and repeated laboratory testing. These interventions can be lifesaving, particularly for babies born extremely prematurely or with serious medical complications. Yet the financial consequences of receiving this care are not experienced equally by every household, even when families receive treatment in the same health-care system.

The researchers’ focus is direct medical out-of-pocket spending: the money families must pay themselves for medical services connected to a NICU admission. This can include deductibles, copayments, coinsurance and other forms of cost sharing that remain after insurance has paid its portion. Unlike the total hospital charge or the amount reimbursed by an insurer, out-of-pocket cost reflects the portion that reaches a family’s own budget. For households already coping with an unexpected high-risk birth, even relatively small individual charges can accumulate rapidly.

The study is designed not only to document these expenses, but also to explore the structural forces behind differences in cost burden. In health economics, structural contributions refer to the way institutions and systems distribute risk and resources. Insurance design, employment-linked coverage, household income, geographic location, hospital characteristics and access to public assistance can all affect how much a family ultimately pays. Two infants with similar clinical needs may therefore generate very different financial experiences for their parents, depending on the architecture of coverage surrounding them.

That distinction matters because the effects of a NICU admission are not limited to the newborn’s medical condition. Parents may need to travel long distances to reach a specialized hospital, arrange accommodation near the facility, pay for transportation or meals, and take unpaid leave from work. These expenses may not always appear in estimates of direct medical out-of-pocket costs, but they can intensify the economic shock associated with a prolonged admission. The medical bill is only one component of the broader financial strain that can accompany neonatal illness.

A central question raised by the analysis is whether the families with the fewest financial resources are also the ones most exposed to high cost sharing. A payment that is manageable for a high-income household may consume a substantial share of a lower-income family’s monthly budget. Economists often describe this pattern as a disproportionate cost burden: the absolute amount paid may not be the highest, yet the payment represents a greater fraction of household resources. This distinction can reveal inequities that remain hidden when researchers look only at average dollar amounts.

The findings are expected to be relevant to health-policy debates about medical debt, insurance protection and the financial consequences of premature birth. If structural factors account for meaningful differences in family payments, reducing inequality may require more than improving clinical care. Potential responses could include limits on neonatal cost sharing, stronger protections against unexpected bills, expanded eligibility for public coverage and assistance with transportation or family support services. The analysis may also help hospitals and policymakers identify families at risk of financial hardship while an infant is still receiving care.

The issue has significance beyond individual hospitalizations because NICU care can influence a family’s financial stability long after discharge. Parents may face follow-up appointments, medications, developmental assessments and specialist care for children who experienced complications of prematurity or serious illness. Medical expenses can overlap with reduced work hours, job loss or the need for one parent to become a full-time caregiver. A short period of intensive treatment can therefore produce a long economic aftershock, particularly when families lack savings or paid leave.

By placing family payments at the center of neonatal research, Gorka, Profit and Phibbs emphasize a dimension of NICU care that is often absent from clinical success measures. Survival, complications and length of stay remain essential indicators, but they do not fully describe the experience of families navigating intensive care. Understanding who pays the most, why they pay it and how those payments relate to broader social structures could help redefine quality in neonatal medicine. The study’s message is potentially viral because it connects cutting-edge life-saving technology with a simple but consequential question: when medicine saves a baby, how much of the cost is left for the family to survive?

Subject of Research: Direct medical out-of-pocket costs of neonatal intensive care admissions and structural factors contributing to differences in financial burden among NICU families.

Article Title: Who pays the most for neonatal intensive care? An analysis of the out-of-pocket cost burden borne by NICU families

Article References: Gorka, N., Profit, J. & Phibbs, C.S. “Who pays the most for neonatal intensive care? An analysis of the out-of-pocket cost burden borne by NICU families.” Journal of Perinatology (2026). https://doi.org/10.1038/s41372-026-02869-6

Image Credits: AI Generated

DOI: 10.1038/s41372-026-02869-6

Keywords: neonatal intensive care, NICU, out-of-pocket costs, medical expenses, health-care inequality, premature birth, financial burden, insurance, neonatal health, health policy

Transit-based exoplanet survey finds its first microlensing exoplanet

11 August 2026 at 14:00

NASA’s Transiting Exoplanet Survey Satellite (TESS) mission has notched up its first discovery of an exoplanet via a method known as microlensing. The planet is a “super Jupiter” known as Gaia23bra b, and TESS observed it when the planet and its host star acted as a gravitational lens, magnifying the light from a second, more distant background star.

Astronomers have several ways of finding planets beyond our solar system. The most successful of these by far – and the one that TESS was designed for – is the transit method, which is responsible for roughly 75% of all exoplanet detections to date. This approach relies on observing the periodic dimming of a star’s light as a planet passes between the star and an observer here on Earth.

The transit method does have limitations, however. The main limitation is that we can see transits for only a small number of planets, namely those with orbital planes that are almost exactly edge-on to Earth. An alternative approach known as photometric microlensing is somewhat more flexible in this respect, as it relies on the star-planet system magnifying the light from a background star, which is known as the source. This magnification occurs because the gravitational pull of the planet-star system warps space, bending and magnifying the source’s light (as Albert Einstein predicted as part of his general theory of relativity) like a lens and producing characteristic spikes in its brightness.

A second bite at the exoplanetary cherry

Astronomers initially identified a planet in the Gaia23bra system using observations made in 2023 by the European Space Agency’s now-retired Gaia space telescope. However, while Gaia picked up the unexpected brightening of a background star, it did not identify this event as coming from a binary-star system, and it could not pick out the planet itself because its observations were too sparse, explains Mallory Harris, an astronomer at the University of New Mexico, US who led the TESS study.

In the new work, Harris and colleagues scoured TESS data from the same period. Because TESS’ observations were much denser – it observed the region every 200 seconds for nearly 60 days – they were able to identify extra features in the brightness of the light curve that indicated the presence of a planet in the system. Subsequent analyses revealed that this planet is about 1.63 times the size of Jupiter, and it orbits its host – an orange dwarf star 20% smaller than our Sun – at a distance similar to that of Jupiter from our Sun.

Complementary techniques

The transit technique is particularly sensitive to planets that orbit close to their star because these planets are the most likely to transit and block out most of their host stars’ light as they pass in front of them. In contrast, Harris explains that microlensing is most sensitive to planets orbiting at Earth-like distances or further from their stars, making it better for studying planetary systems more like our own solar system. “With microlensing, we can find smaller planets with greater orbital distances, including worlds in the habitable zone of their star and even farther away,” she says.

The transit technique and microlensing are therefore complementary because each reveals a category of planet that the other may not be able to detect, adds team member Diana Dragomir. The only problem, Harris notes, is that microlensing observations are limited-time opportunities. “Microlensing events happen once and they’re gone – they don’t repeat,” Harris says. “I like to joke that we’ll probably find the first Earth analogue with microlensing and then wave at it as it goes by because we’ll never see it again.”

That said, Harris says that Gaia23bra will be an important observing target for the Nancy Grace Roman Space Telescope. “Microlensing is currently the only method capable of detecting Earth‑mass planets at Earth‑like orbital distances,” she explains. “We already knew that this technique could find planets, because it has done so in the past using ground-based observatories.

“What we demonstrated in this work is that high-cadence observations (even with low spatial precision) and high-precision long-baseline observations can work together to find a microlensing planet. And that it is possible to specifically do this by pairing TESS observations with those from another instrument.”

This synergy between long-time-scale surveys and high cadence observations could be therefore applied towards future searches for potentially habitable worlds, she tells Physics World. Although Gaia was retired last January, making it unlikely that astronomers will find many additional events via a Gaia–TESS combination, Harris adds that there could nevertheless be other microlensing planets in the past eight years of archived TESS observations. “I’m excited to see whether there are other events like this already hiding in the TESS data and whether future surveys can work together with TESS to find more microlensing planets in different parts of the galaxy,” she says.

The post Transit-based exoplanet survey finds its first microlensing exoplanet appeared first on Physics World.

Aug. 11, 1877: Asaph Hall discovers Deimos

11 August 2026 at 14:00

After spending the 1850s at Harvard Observatory calculating orbits, Asaph Hall became an assistant at the U.S. Naval Observatory at Washington, D.C., in 1862. He was quickly promoted, and by 1873 had not only held several scientific discussions with Abraham Lincoln during the president’s visits to the observatory, but had also been put in chargeContinue reading "Aug. 11, 1877: Asaph Hall discovers Deimos"

The post Aug. 11, 1877: Asaph Hall discovers Deimos appeared first on Astronomy Magazine.

Archaeologist Finally Decodes 2,200-Year-Old Mysterious Stonemason Inscriptions That Have Stumped Researchers for Centuries

11 August 2026 at 12:41

A University of Warsaw scientist has determined that a series of mysterious stonemason inscriptions on the Tauchira Gate at Ptolemais, on Libya’s northern coast, which have perplexed researchers for centuries, are likely stonemason marks intentionally left visible by the artisans who built the ancient structure.

The new analysis, which was performed by Anna Urszula Kordas of the Faculty of Culture and Arts at the University of Warsaw in Poland, also dates the gate’s construction to the reign of Ptolemy VIII, roughly 2,200 years ago.

If correct, the new dates for the site would help settle a longstanding debate about the gate’s precise age.

Mysterious Stonemason Inscriptions Regularly Misidentified

According to Korda’s research study, archaeologists consider the Tauchira Gate to be the best-preserved section of the ancient fortifications built around the ancient Egyptian city of Ptolemais. Several visitors and scholars have noted the gate over the centuries, with a particular focus on its mysterious stonemason inscriptions.

The earliest documented attempt by a Western researcher to decipher their meaning comes from a French traveler identified as Granger, who recorded the marks sometime between 1733 and 1734. According to Korda, that first attempt mistakenly described the marks as likely instructions for masons to arrange the gate’s stones during its construction.

mysterious stonemason inscriptions
The north wall of the Tauchira Gate bears mysterious stonemason marks. Image Credit: Miron Bogacki, University of Warsaw/European Journal of Archaeology, © Kordas, A.U. 2026. Published by Cambridge University Press on behalf of The European Association of Archaeologists.

A second, 19th-century effort inaccurately ascribed the mysterious stonemason inscriptions to donors financing specific blocks. In the 1970’s, another researcher suggested the inscriptions were ‘ephebic’ names added after construction as graffiti “unrelated to the gate’s construction but connected to the functioning of the nearby gymnasium.”

Although the most recent effort dated the inscriptions to sometime during the city’s Roman period, Korda notes that the date is still in debate. She also points out that the meanings of the mysterious stone inscriptions were unlikely to be any of the proposed explanations, motivating the new analysis.

2006 Photos Enable Digital Recreation and Discovery of Techniques

To decipher the mysterious stone inscriptions, Korda said she reconstructed the gate’s construction process, organization, and chronology by applying the “chaîne opératoire approach.” This method allowed Korda to study these variables “within its technological and socio-cultural context.”

Thanks to a series of photographs captured by the Polish Archaeological Mission to Ptolemais in 2006, Korda was able to trace the location of each inscription using digital mapping software. The researcher notes that this process still included challenges, including “damaged stone surfaces, suboptimal picture quality, invasive plants, and later inscriptions,” all of which made some of the actual stone markings illegible. Korda said these limitations also hampered the “observation of stone processing techniques.”

mysterious stone inscriptions
Above: A view of the Tauchira Gate from the eastern side of the town (Image Credit: Photographs by Miron Bogacki). 

After a thorough initial examination, Korda separated the mysterious stonemason inscriptions into 27 ‘types’ and then split them into two groups. The first group represented marks found on rough, unfinished blocks. These marks were also mostly hidden from view, suggesting they were recorded during a block’s quarrying and transport.

Korda’s second group included inscriptions found on finished, textured outer surfaces of the gate’s two towers. Notably, the second group of markings appeared to be carved with more care than those in the first group.

Mysterious Stonemason Inscriptions Likely Stonemason Marks Identifying Workers and Work

Korda ultimately determined that the inscription pattern represented two distinct systems used to organize and pay for stonemason work. For example, some marks appear to follow a simple letter sequence, which Korda suggests shows how the team was divided for work.

“The stonemasons’ marks on the Tauchira Gate consist of single Greek letters, double letters, ligatures, and elaborate monograms,” the study author writes. “The marks A, Β, Γ, Δ, AP/Ε, Ζ, and Η likely form a letter-label system representing the division of labour among stonemasons’ teams.”

The analysis also revealed some of the mysterious stone inscriptions combine to form complex monograms. Korda said these inscriptions “appear as ligatures or monograms, possibly abbreviating stonemasons’ names.” The inscriptions also likely represent names or workshop owners or private donors who helped fund the project, a common Greek practice during this era.

“The hypothesis presented here is that the marks, especially attested in the lower levels, correspond to the division of stonemasons into seven teams numbered A to H and suggest a well-organized system, possibly financed from public funds,” Korda writes.

mysterious stone inscriptions
Didyma, Temple of Apollo: stonemasons’ marks on unprocessed stone blocks visible on the southern inner wall of the temple, along with smoothed blocks without marks (Image Credit: Photographs by Miron Bogacki).

One unusual aspect highlighted by Korda’s work was that the mysterious stonemason inscriptions were not hidden during construction, unlike stonemason marks found at other ancient construction sites. The researcher suggests that the marks on the Tauchira Gate being left visible were an intentional act representing a local tradition instead of a wider societal practice.

“Even in the absence of instructive parallels—whether due to lost evidence or gaps in research—it may be inferred that the practice of inscribing rusticated blocks with masons’ or patrons’ names, while inspired by the broader Greek tradition of commemorating benefactors on public buildings, represents a local innovation,” Korda writes, adding that the Tauchira Gate is, therefore, “remarkable for its distinctiveness, as fortifications displaying comparable evidence for labour organization and the public display of stonemasons’ marks remain without close parallels.”

Analysis Includes Early Second Century Construction Date

Along with successfully deciphering the meaning of the mysterious stone inscriptions, Korda’s analysis determined that the gate’s two towers were built at the same time instead of one after another. Kordas said this finding contradicts a 2009 German team that examined the site in person.

Because the gates lack organic material for radiocarbon testing, Kordas dated their construction by comparing the shapes of the letters used in the inscriptions with other inscriptions from the same region that have been conclusively dated. The researcher also factored in nearby graffiti mentioning a visitor from Rhodes, which helped narrow the site to the earlier half of the second century BC.

“The arguments deployed by the epigraphic analysis of the marks on the Tauchira Gate and the evidence of the stonemasons’ marks visible there and presented in the analysis submitted here suggest that the gate was remodeled during the reign of Ptolemy VIII Physcon in the second century BC,” Korda concludes, adding that “at the very least, the hypothesis merits serious consideration.”

The article “Life on a Hellenistic Construction Site: Stonemasons’ Marks on the Tauchira Gate at Ptolemais in Cyrenaica” was published by Cambridge University Press.

Christopher Plain is a Science Fiction and Fantasy novelist and has spent the last six years as Associate News Editor and Head Science Writer at The Debrief. Follow and connect with him on X, learn about his books at plainfiction.com, or email him at christopher@thedebrief.org

Something May Be Flowing Beneath Pluto’s Giant Heart-Shaped Glacier

11 August 2026 at 12:03
Pluto New Horizons 2015Researchers used New Horizons images to identify evidence that liquid nitrogen may have flowed from beneath Pluto’s famous heart-shaped glacier. Dark markings across part of Pluto’s enormous heart-shaped glacier may record something unexpected beneath its frozen surface: liquid nitrogen moving upward and briefly flowing across the ice. Using observations from NASA’s New Horizons spacecraft, researchers [...]

OPPO K15 Smartphone Review: The Truly Practical Choice in the 2K Price Segment

11 August 2026 at 11:06

1. Introduction: Cooling Is Usually Reserved for Gaming Flagships, But Mid-Range Phones Need It More

There are plenty of smartphones in the 2,000-yuan price range that focus on stacking specifications, but very few invest in advanced cooling systems.

Looking across the market, phones in this price segment are usually competing on performance, cameras, and fast charging. Cooling solutions are often mentioned only briefly—or ignored completely.

It is not because cooling is unimportant. The reason is simple: with limited costs, manufacturers usually spend their budget on features that users can immediately notice.

However, overheating and performance throttling are exactly the problems that trouble mid-range smartphone users the most.

Examples include:

  • A phone becoming too hot to hold while navigating outdoors in summer
  • Gaming frame rates dropping from 60fps to 40fps after half an hour
  • The device overheating while charging and being used at the same time
  • Reduced battery lifespan caused by long-term heat exposure

OPPO K15 is a practical all-round smartphone that brings an active cooling fan system into the 2K price segment.

OPPO K15 Review: 8000mAh Battery + Active Cooling Fan Makes It the Most Practical 2K Phone

The OPPO K15 is equipped with the MediaTek Dimensity 7360 SUPER processor, OPPO’s Tidal Engine optimization system, an 8000mAh large-capacity battery, and IP69 flagship-level water resistance.

It also features:

  • Three 50MP cameras
  • A large 5000mAh-class imaging system
  • Active cooling fan
  • Long-lasting battery performance

The phone aims to solve two of the biggest complaints among mid-range smartphone users:

  1. Overheating
  2. Running out of battery

Honestly, I did not have very high expectations for cooling performance on a 2K-range smartphone. With cost limitations, simply keeping temperatures under control is already considered good enough.

However, OPPO added an active cooling fan this time, making me curious:

Is the cooling fan just a marketing gimmick, or can it actually reduce temperatures?

Active Cooling Fan: More Than Just a Marketing Feature

The OPPO K15 uses a new-generation Wind Cooling Engine, featuring a built-in micro cooling fan.

According to OPPO, the cooling system can:

  • Reduce temperature by 5°C within 5 minutes
  • Keep fan noise as low as 30dB during full-speed operation


The fan is integrated with the rear camera module design. Thanks to this approach, the back cover remains completely flat without a large camera bump.

The entire phone is only:

  • 8.27mm thick

This means the cooling system does not negatively affect the grip or overall feel.

After completing temperature tests, I found that the fan performed better than expected.

Adding a cooling fan to a 2K-range smartphone reminds me of installing a turbocharger on an economy car—not to make it a racing machine, but to ensure it does not lose power when climbing uphill.

For flagship gaming phones, cooling is about achieving peak performance.

For mid-range phones, cooling is about maintaining stable performance during daily use.


Battery and Charging: 8000mAh Battery Designed for All-Day Use

The OPPO K15 features an 8000mAh Glacier Battery, providing enough endurance for heavy daily usage.

It supports:

  • 80W SUPERVOOC fast charging
  • UFCS universal fast charging protocol
  • PPS charging protocol
  • Bypass charging
  • Wired reverse charging

The bypass charging feature allows power to directly supply the motherboard instead of continuously charging the battery during gaming sessions.

This helps:

  • Reduce heat generation
  • Protect battery health
  • Improve long-term durability

The reverse charging function also allows the phone to act as an emergency power source for accessories such as:

  • Earbuds
  • Smartwatches
  • Other small devices


Camera System: Three 50MP Cameras in the 2K Segment

The OPPO K15 features three 50MP cameras:

  • Rear main camera
  • Ultra-wide-angle camera
  • Front selfie camera

The main camera includes:

  • 1/2-inch large sensor
  • f/1.88 aperture
  • Optical Image Stabilization (OIS)

The ultra-wide-angle camera offers:

  • 143.3° ultra-wide field of view

The front camera supports:

  • 50MP resolution
  • Autofocus (AF)

For a phone in the 2K price segment, this camera configuration is quite generous.


Durability: IP69/IP68/IP66 Protection and Military-Grade Testing

The OPPO K15 focuses heavily on durability.

It supports:

  • IP69 waterproof rating
  • IP68 dust and water resistance
  • IP66 protection
  • Eight military-standard durability tests

The phone also features:

  • Crystal Shield glass protection
  • Metal middle frame

The combination makes it more resistant to:

  • Drops
  • Water exposure
  • Dust
  • Extreme environments

2. Design Review: Cloud Pattern Back Cover with Hidden Cooling Fan

The OPPO K15 features a 6.59-inch centered punch-hole flat display.

The rounded corners and narrow bezels provide a comfortable viewing experience.

The display supports:

  • 1.5K resolution
  • 120Hz refresh rate

Daily activities such as:

  • Watching videos
  • Switching apps
  • Scrolling webpages

all feel smooth and responsive.

The front panel uses high-strength Crystal Shield glass, while the back cover has a smooth texture that reduces fingerprints.


Colors and Rear Design

The OPPO K15 comes in two colors:

  • Speed White
  • Wind Gray

The review unit is the Speed White version, featuring a unique cloud-pattern texture.

When light reflects across the surface, it creates a flowing storm-like visual effect.

At the bottom of the back panel is the text:

“ACTIVE COOLING, MASTER THE WIND”

This highlights the phone’s cooling identity without making the design look aggressive.


Camera Module and Cooling Fan Integration

The rear camera module is one of the most distinctive parts of the phone.

It uses:

  • A square silver camera base
  • Four corner screws
  • Industrial-style design elements

Layout:

  • Top left: Main camera
  • Top right: Ultra-wide camera
  • Bottom left: Cooling fan air intake
  • Bottom right: Flash

The fan and camera system are integrated into one flat module.

Despite including an internal fan, the phone remains:

  • 8.27mm thick
  • Comfortable to hold
  • Free from a large camera bump

This design is clever because many flagship phones now have large protruding camera modules, while the OPPO K15 maintains a cleaner back design.

3. Cooling Test: The Active Fan Actually Works — Overheating and Throttling Become Less of a Concern

When people think of smartphones with built-in cooling fans, gaming flagships usually come to mind.

However, for users in the 2K price segment, long-term stable performance is arguably more important.

Common scenarios such as:

  • Outdoor navigation under strong sunlight
  • Long gaming sessions
  • Recording videos for extended periods
  • Using the phone while charging

can easily cause mid-range phones to heat up and reduce performance.

The OPPO K15 features the new-generation Wind Cooling Engine, which uses a three-layer cooling solution:

  1. Large-area VC vapor chamber

    The VC cooling plate quickly spreads heat away from the processor area.

  2. High-conductivity graphite layer

    The graphite material helps transfer heat more efficiently throughout the body.

  3. Built-in micro cooling fan

    The active fan pulls hot air away through the exhaust outlet, actively accelerating heat dissipation.

The key difference is that this is active cooling, not traditional passive cooling.

The fan is physically running, and heat is actively being removed.


Temperature Reduction Test

First, we used the AnTuTu stress test to push the OPPO K15 into a high-load state.

After continuous full-load operation:

  • Front temperature reached: 45.5°C
  • Rear temperature reached: 46.5°C

At this point, the phone felt noticeably hot in the hand.

Then we activated the cooling fan.

After 7 minutes:

  • Front temperature dropped to 40.9°C
  • Rear temperature dropped to 40.2°C

The phone changed from hot to only slightly warm.

After waiting 12 minutes:

  • Front temperature: 38.8°C
  • Rear temperature: 36.5°C

Compared with the peak temperature of 46.5°C, the rear temperature dropped by approximately 10°C.

The thermal imaging results clearly showed that heat was being transferred away through the fan system.

The temperature around the cooling fan area was noticeably lower than other parts of the phone, proving that the fan was actively removing heat.


High-Energy Outdoor Mode

The OPPO K15 also includes a High-Energy Outdoor Mode, which can be enabled through the accessibility settings.

Once activated, the system automatically:

  • Starts the cooling fan
  • Optimizes temperature control
  • Keeps the phone operating within a stable performance range

This mode also includes several practical outdoor improvements:

Enhanced Screen Brightness

The display automatically increases brightness, making it easier to see under direct sunlight.

Improved Voice Volume

When Bluetooth devices are disconnected, the phone automatically switches to the speaker and increases volume.

Extended Screen Timeout

The display stays active longer, preventing interruptions during:

  • Navigation
  • Outdoor work
  • Long-term map usage

Quick Access Optimization

Frequently used applications can be pinned to a shortcut bar for faster switching.

There are also desktop shortcut cards that allow one-tap access to important functions.

The combination of cooling assistance and outdoor optimization makes the OPPO K15 more convenient for real-world use.

The purpose of active cooling in a 2K smartphone is not chasing the highest benchmark score.

It is about maintaining stable performance during long gaming sessions, navigation, and video recording.

Other phones compete for peak performance.

The OPPO K15 focuses on staying stable for longer.

4. Performance Test: Dimensity 7360 SUPER + Tidal Engine Focus on Stability

The OPPO K15 is powered by the MediaTek Dimensity 7360 SUPER processor.

Although positioned as a mid-range chipset, OPPO has added its own Tidal Engine optimization system to improve long-term performance.

The phone also features:

  • 4950mm² VC vapor chamber
  • High-conductivity graphite cooling layer
  • Built-in active cooling fan

This combination provides a strong thermal foundation for a phone in this price category.

To evaluate real-world performance, we tested two popular mobile games.


Gaming Test 1: Honor of Kings

For Honor of Kings, we set:

  • Frame rate: Ultra-high
  • Graphics quality: HD
  • Performance mode: Enabled

During a full 5v5 match:

Results:

  • Average frame rate: 90.72 FPS
  • Frame fluctuation index: 0.22

The phone maintained smooth performance throughout the match.

Whether during:

  • Large team fights
  • High-density skill effects
  • Tower battles

there were no obvious frame drops or visible lag.

Average power consumption:

  • 3.34W

Energy consumption per frame:

  • 36.8mW

After enabling the cooling fan in smart variable-speed mode, temperatures remained well controlled.


Gaming Test 2: PUBG Mobile

For PUBG Mobile, settings were:

  • Graphics: Smooth
  • Frame rate: Extreme (60 FPS)
  • Mode: Classic Squad Battle

During the entire match:

  • Landing
  • Rotating zones
  • Fighting enemies
  • Final circle battles

the frame rate remained around 60 FPS.

There were no common mid-range phone issues such as:

  • Sudden frame drops when entering the zone
  • Delayed aiming response
  • Stuttering during combat

Average power consumption:

  • 2.84W

Energy consumption per frame:

  • 47.5mW

The cooling fan helped maintain stable temperature during the gaming session.


5. Camera Review: Three 50MP Cameras Deliver Strong Image Quality

The OPPO K15 represents a major improvement in imaging for the K series.

It features three 50MP cameras:

  • Main camera
  • Ultra-wide camera
  • Front camera

The main camera includes:

  • 1/2-inch large sensor
  • f/1.88 aperture
  • OIS optical stabilization

The ultra-wide camera provides:

  • 143.3° ultra-wide field of view

Unlike many mid-range phones where secondary cameras are mainly for marketing, the OPPO K15 gives more attention to practical photography.


Main Camera Experience

The 50MP main camera performs well in daylight scenes.

Strengths include:

  • Good detail retention
  • Natural colors
  • Strong dynamic range
  • Stable handheld shooting thanks to OIS

Photos maintain good clarity even when zooming into details.

The large sensor also helps improve:

  • Low-light performance
  • Background separation
  • Night photography quality

Ultra-Wide Camera Experience

The 143.3° ultra-wide camera is useful for:

  • Architecture photography
  • Landscape shots
  • Group photos
  • Travel scenes

The wider perspective allows users to capture more content in a single frame.


Night Photography

The main camera’s large sensor and optical stabilization help improve nighttime shooting.

Night photos show:

  • Better light control
  • Reduced motion blur
  • Improved shadow details

For a mid-range smartphone, the camera performance is above average.

6. Battery and Charging: 8000mAh Battery Easily Lasts a Full Day, 80W Flash Charging Keeps You Going

Battery life is one of the strongest selling points of the OPPO K15.

The phone comes with an 8000mAh Glacier Battery, which is significantly larger than the batteries commonly found in mainstream smartphones.

For users who rely heavily on their phones every day, such as:

  • Outdoor workers
  • Travelers
  • Navigation users
  • Mobile gamers
  • Video streamers

the large battery capacity provides a clear advantage.


Battery Life Test

To evaluate real-world endurance, we used the Battery Dog testing tool developed by Kuai Technology.

The test simulated typical daily usage scenarios, including:

  • CPU high-load operation
  • Multi-thread processing
  • AI recognition
  • Image browsing
  • Video playback
  • Web browsing

Testing conditions:

  • Screen brightness: 50%
  • Auto brightness: Disabled
  • Volume: 30%

The results showed:

The OPPO K15 lasted:

14 hours and 33 minutes from 100% battery down to 20%.

Based on this result, the theoretical full battery endurance is approximately:

18 hours of continuous usage.

This result matches the expectations of an 8000mAh battery and demonstrates the phone’s excellent endurance.

For normal users, the OPPO K15 can easily handle:

  • A full day of heavy usage
  • Long outdoor navigation
  • Extended gaming sessions
  • Continuous video playback

without worrying about battery anxiety.


80W SUPERVOOC Fast Charging Experience

The OPPO K15 supports:

  • 80W SUPERVOOC fast charging
  • UFCS universal fast charging
  • PPS fast charging protocol

We tested charging with the included 80W charger.

Starting from:

1% battery

Charging results:

Charging Time Battery Level
5 minutes 11%
10 minutes 18%
30 minutes 43%
60 minutes 81%
80 minutes 100%

Although the phone uses a large 8000mAh battery, it can still reach a full charge within around 80 minutes.

This provides a good balance between battery capacity and charging speed.


Bypass Charging: Better for Long Gaming Sessions

The OPPO K15 supports bypass charging, which is especially useful for gamers.

When enabled:

  • Power goes directly to the motherboard
  • Battery charging is reduced
  • Heat generation is lowered
  • Battery aging is minimized

This means users can keep playing games while connected to power without constantly stressing the battery.

For people who often:

  • Play games while charging
  • Watch videos for long periods
  • Use the phone as a stationary entertainment device

this feature is very practical.


Wired Reverse Charging

The OPPO K15 also supports wired reverse charging.

The phone can temporarily act as a power bank for devices such as:

  • Wireless earbuds
  • Smartwatches
  • Other smartphones

When traveling, this feature provides an emergency power solution without carrying an additional charger.


7. Special Features: IP69 Protection, Breathing Light, NFC and Infrared

Beyond cooling, performance, and battery life, the OPPO K15 also includes many practical features that improve everyday experience.


IP69 Protection: Designed for Tough Environments

The OPPO K15 supports:

  • IP69 waterproof protection
  • IP68 dust and water resistance
  • IP66 protection

It also passed eight military-standard durability tests covering:

  • High temperature
  • Low temperature
  • Rain exposure
  • Dust environments
  • Drop resistance

This makes the phone suitable for more demanding environments.


Water Resistance Test

During testing, we played Douyin videos on the OPPO K15 while placing it under running water.

The results:

  • Video playback continued normally
  • Touch controls remained responsive
  • Wet fingers could still operate the screen

The phone remained fully functional after exposure to water.

While IP69 protection does not mean users should intentionally abuse their devices, it provides additional confidence for:

  • Outdoor workers
  • Travelers
  • Users in rainy environments

Mist Shadow Breathing Light: Adding Gaming Atmosphere

The rear panel includes OPPO’s Mist Shadow Breathing Light system.

Users can customize:

  • Full lighting area
  • Strip lighting
  • Fan lighting

Lighting effects include:

  • Flowing effects
  • Breathing effects
  • Always-on mode
  • Flashing effects

The fan lighting also supports:

  • Breathing mode
  • Constant lighting
  • Flashing mode

Multiple colors are available.

At night, the lighting can synchronize with music, creating a gaming-style atmosphere.

Unlike inexpensive RGB lighting effects, the implementation feels more refined.

Users can also configure:

  • Activation time
  • Lighting behavior
  • Automatic disabling when the phone is in a pocket

Mountain-Sea Communication Technology: Better Signal in Weak Areas

The OPPO K15 includes OPPO’s self-developed Mountain-Sea Communication Technology.

The system uses:

  • 360° surround antenna design
  • Multi-source signal optimization algorithms

It is designed to improve connectivity in difficult environments such as:

  • Underground parking areas
  • Elevators
  • Buildings with weak signals

During testing in an underground parking area:

Network results:

  • Ping latency: 37ms
  • Download speed: 8.37Mbps
  • Upload speed: 16.12Mbps

The phone maintained stable connectivity without obvious disconnections.

Dual-Frequency GPS: Faster and More Accurate Positioning

The OPPO K15 is equipped with:

  • Dual-frequency GPS
  • Flagship-level sensors
  • Multi-source positioning algorithms

During navigation testing with Amap:

  • Location locking was fast
  • Navigation started quickly
  • Position accuracy remained stable

The real-time navigation interface showed:

  • 26 BeiDou satellites assisting positioning

Even in complex environments such as:

  • Urban streets
  • Tunnels
  • Underground parking areas

the positioning performance remained reliable.


8. Final Verdict: A Smartphone That Solves Real Problems

At the beginning of this review, the question was:

Is the cooling fan on a 2K-range smartphone just a gimmick, or does it really work?

After testing, the answer is clear:

It works.

During the AnTuTu stress test:

  • Rear temperature reached 46.5°C
  • After activating the fan for 12 minutes, it dropped to 36.5°C

A temperature reduction of around 10°C was confirmed through thermal imaging.

The active cooling fan is the feature that truly separates the OPPO K15 from other phones in the same price range.

Many smartphones offer:

  • Large batteries
  • Water resistance
  • Fast charging

But fewer combine these features with an integrated cooling fan.


OPPO K15 Key Strengths

The phone delivers:

8000mAh large battery
Active cooling fan
IP69/IP68/IP66 protection
Stable gaming performance
80W fast charging
Three 50MP cameras
120Hz 1.5K display
Dual-frequency GPS
Strong signal performance


Who Should Buy the OPPO K15?

The OPPO K15 is especially suitable for users who care about:

  • Long battery life
  • Stable performance
  • Outdoor usage
  • Gaming without overheating
  • Durability
  • Practical everyday features

However, users who want:

  • Maximum gaming frame rates
  • Flagship-level processor performance

may prefer higher-end gaming smartphones.

The Dimensity 7360 SUPER is not designed to chase extreme benchmark records. Instead, it focuses on delivering stable performance over long periods.

Final Conclusion

Many smartphones in the 2K price range compete by making their specification sheets look impressive.

OPPO K15 takes a different approach.

Instead of only chasing higher numbers, it focuses on solving real user problems:

  • A phone that does not become uncomfortable when hot
  • A battery that lasts all day
  • A device that remains reliable outdoors
  • A smartphone that can handle daily challenges

The built-in cooling fan is like adding a turbocharger to an economy car—not for racing, but to prevent losing power when climbing a hill.

After testing, the OPPO K15 proves that it can:

  • Stay cool under pressure
  • Maintain stable performance
  • Last through demanding usage
  • Survive tougher environments

For users looking for a practical, durable, and reliable smartphone in the 2K price segment, the OPPO K15 is one of the most complete choices available.

OPPO K15: A truly practical smartphone built for real-world use.

The post OPPO K15 Smartphone Review: The Truly Practical Choice in the 2K Price Segment appeared first on IGeeKphone China Phone, Tablet PC, VR, RC Drone News, Reviews.

AI’s potential climate benefits outweighed by role in boosting fossil fuels, study finds

11 August 2026 at 10:15

Modelling finds AI-driven productivity gains in coal, oil and gas enable more emissions than applications in renewables avoid

AI-driven productivity gains enable more planet-heating pollution from fossil fuels than they avoid from renewables, a study has found.

Researchers modelled the technical potential for AI to boost clean power generation along with projections for how it can help produce coal, oil and gas. Across 64 scenarios, they found net yearly carbon pollution rose by 0.47-1.8 gigatonnes, or about 1-5% of the energy sector’s annual emissions.

Continue reading...

© Photograph: KENDALL/Alamy

© Photograph: KENDALL/Alamy

© Photograph: KENDALL/Alamy

❌