❌

Normal view

NASA Science Soars During August Total Solar Eclipse

27 July 2026 at 19:01

6 min read

NASA Science Soars During August Total Solar Eclipse

Each time the Moon covers the Sun during a total solar eclipse — darkening daytime skies and briefly revealing the Sun’s ethereal outer atmosphere, the corona — it presents new opportunities to better understand our star and its influence on Earth.

On Wednesday, Aug. 12, as the next total solar eclipse sweeps over Greenland, Iceland, and Spain, NASA-funded science teams will be chasing the Moon’s shadow with a high-altitude jet and scientific balloons to investigate the Sun’s dynamics and how the temporary darkening of our skies affects our atmosphere.

“From our unique perspective on Earth during a total solar eclipse, scientists can study the Sun’s corona in a way we can’t from anywhere else in the solar system,” said Kelly Korreck, eclipse program manager at NASA Headquarters in Washington. “The Sun impacts our daily life, satellites, and astronauts in space, and we can take advantage of this moment to advance our understanding of that influence.”

High-flying jet to record solar dynamics

Soaring in the nose cone of NASA’s WB-57 high-altitude research aircraft is a suite of four cameras to take high-resolution images of the corona in several different wavelengths of visible and infrared light. Part of an instrument developed by the NASA Scientifically Calibrated In-Flight Imagery (SCIFLI) team at NASA’s Langley Research Center in Hampton, Virginia, the cameras will capture at least 20 images per second, recording structures, outflows, and rapid changes in the corona during the total solar eclipse.

With these images, scientists hope to learn more about the formation of prominences (solar material that gets suspended above the Sun’s surface), better understand the corona and how it gets heated to nearly a million degrees, and investigate how material in the corona and the solar wind are related, which flows out from the Sun across the solar system.

These images of the corona and solar prominences were taken in different wavelengths of visible and infrared light by imagers aboard a NASA’s WB-57 jet during the April 8, 2024, total solar eclipse. The same cameras will fly on a NASA WB-57 jet again during the Aug. 12 eclipse.
NASA / SwRI / William Ashfield

By chasing the Moon’s shadow, the jet will extend how long the cameras can observe the corona. On the ground, the longest anyone will be able to see the corona is two minutes and 18 seconds. But flying along the eclipse path at 460 miles per hour, the jet’s view of the corona will last nearly three minutes.

NASA’s WB-57 will fly at 50,000 feet, above any clouds that might obscure the view of the corona from the ground. The altitude also allows the cameras to observe some infrared wavelengths that get absorbed by the lower atmosphere before reaching the ground, and the corona only has been observed in those wavelengths a few times before.

A small white airplane sis on a beige tarmac. It has a skinny nosecone and a fin that sticks straight up, with the NASA insignia.
One of NASA’s WB-57 high-altitude jets will carry a suite of cameras up to 50,000 feet to capture images of the solar corona during the Aug. 12 total solar eclipse.
NASA

The instrument, called SCIFLI Multispectral Airborne Imager, or SAMI, also flew on a WB-57 during the total solar eclipse on April 8, 2024, providing valuable imagery and information about the corona. However, the study’s principal investigator, Amir Caspi of the Southwest Research Institute in Boulder, Colorado, says each total solar eclipse provides new opportunities to learn more about the corona.

“The Sun is always changing,” Caspi said. “Every eclipse is different. So we could see things we didn’t see before. And we learn from each eclipse how to better observe the next one.”

Caspi’s team also is making some enhancements for the 2026 campaign based on lessons learned in 2024. For example, the team will adjust exposure times to better capture bright features that were overexposed in 2024 imagery. They will also leverage software developed since 2024 to process and analyze the data sooner than before.

The experiment is funded by NASA’s Heliophysics Low Cost Access to Space Program.

As a total solar eclipse crosses Russia, Greenland, Iceland, Spain, and Portugal on Aug. 12, 2026, some of the best views will come from 50,000 feet up, aboard NASA’s WB-57 jet. Credit: NASA’s Goddard Space Flight Center

Balloons to watch atmospheric changes

When a total solar eclipse suddenly turns daytime skies dark, our atmosphere changes in ways we don’t yet fully understand.

The NASA-supported Nationwide Eclipse Ballooning Project, led by Angela Des Jardins at Montana State University, is sending students from several U.S. universities to Iceland and Spain to launch scientific balloons before, during, and after the eclipse to better understand those changes.

A photograph shows several people in silhouette standing in a large field in front of the setting Sun, gathered around a large, round, white balloon floating just above their heads against a blue sky.
A student team from the University of Kentucky prepares to launch a ballon from Bloomington, Indiana, to take atmospheric measurements on April 8, 2024, during the 2024 Nationwide Eclipse Ballooning Project campaign.
Sean Bailey (University of Kentucky)

In Iceland, two teams will launch a total of 80 balloons starting 18 hours before the eclipse until eight hours afterward to study how the eclipse affects Earth’s “boundary layer,” the part of the atmosphere that touches the ground. The thickness of the boundary layer changes depending on factors such as surface temperature and moisture in the air.

Previous balloon flights during solar eclipses in October 2023 and April 2024 showed that the boundary layer collapsed, or decreased in thickness, in locations with clear skies but not where there were cloudy skies. Scientists wonder whether that will be different in Iceland in 2026. Changes in the boundary layer are driven by the day-night cycle. However, in Iceland in August, the days are long and nights are short, so the nighttime influences might not be as strong as in 2023 or 2024.

“Will this eclipse be able to collapse the boundary layer?” said Matthew Bernards, a chemical engineering professor at the University of Idaho, who leads one of the Iceland teams.
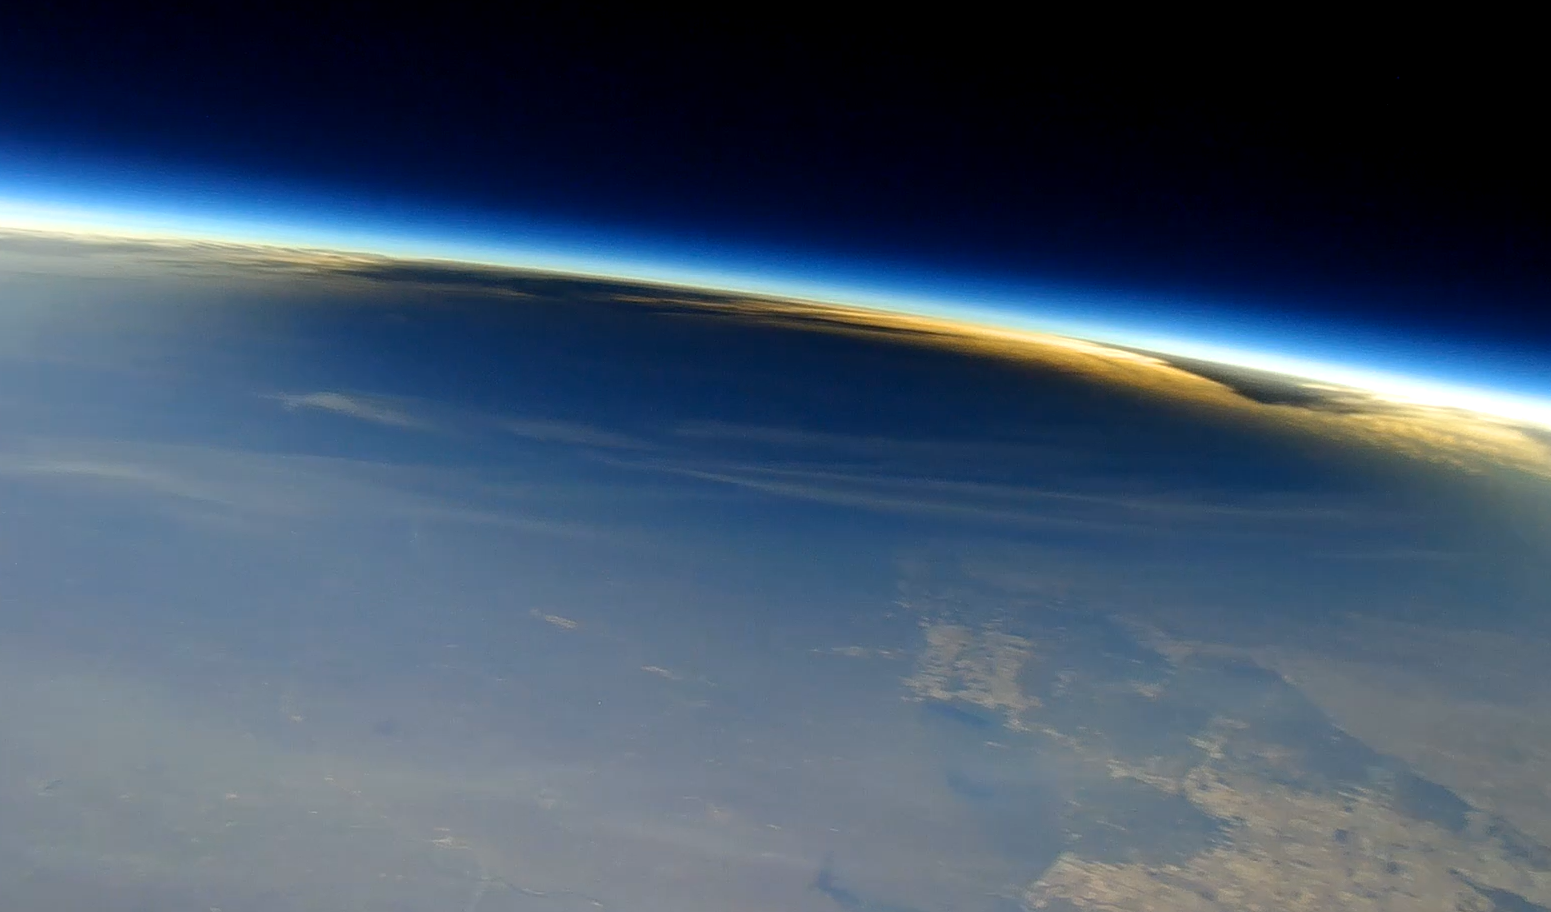
A small part of Earth appears in the lower portion of the view, with the blackness of space in the background at the top. The atmosphere appears as a thin, blue band separating Earth from space. Projected on to Earth is a dark, oval-shaped shadow cast by the Moon during a total solar eclipse.
This image shows the Moon’s shadow on Earth during the total solar eclipse on April 8, 2024, as seen from about 90,000 feet from a camera carried by a scientific balloon. Cameras carried by balloons launched from Spain will capture similar images during the Aug. 12 total solar eclipse.
Nationwide Eclipse Ballooning Project/Virginia Tech

In Spain, three balloon teams will launch a total of six balloons with 360-degree cameras to image the eclipse shadow from above. These balloons also will include instruments designed to measure levels of ozone in the atmosphere, which requires sunlight to form. Similar balloon experiments showed that ozone decreased during totality in April 2024. Scientists wonder whether there will be differences with this eclipse, particularly since it happens at a later time of day and during a different season.

The NASA-funded Nationwide Eclipse Ballooning Project will allow teams of students from across the U.S. to get a unique view of the August total solar eclipse with scientific balloons. Credit: NASA’s Goddard Space Flight Center

Follow along

While the total solar eclipse won’t be visible in the U.S., some parts of the country will be able to see a partial solar eclipse. Learn more about where to see the eclipse and how to view it safely.

by Vanessa Thomas
NASA’s Goddard Space Flight Center, Greenbelt, Md.

Lee esta historia en español aquí.

Keep Exploring

Discover More Topics From NASA

NASA’s Swift Sees ‘Wandering’ Mega Black Hole Shredding Star

27 July 2026 at 17:06
An artist's concept of a tidal disruption event
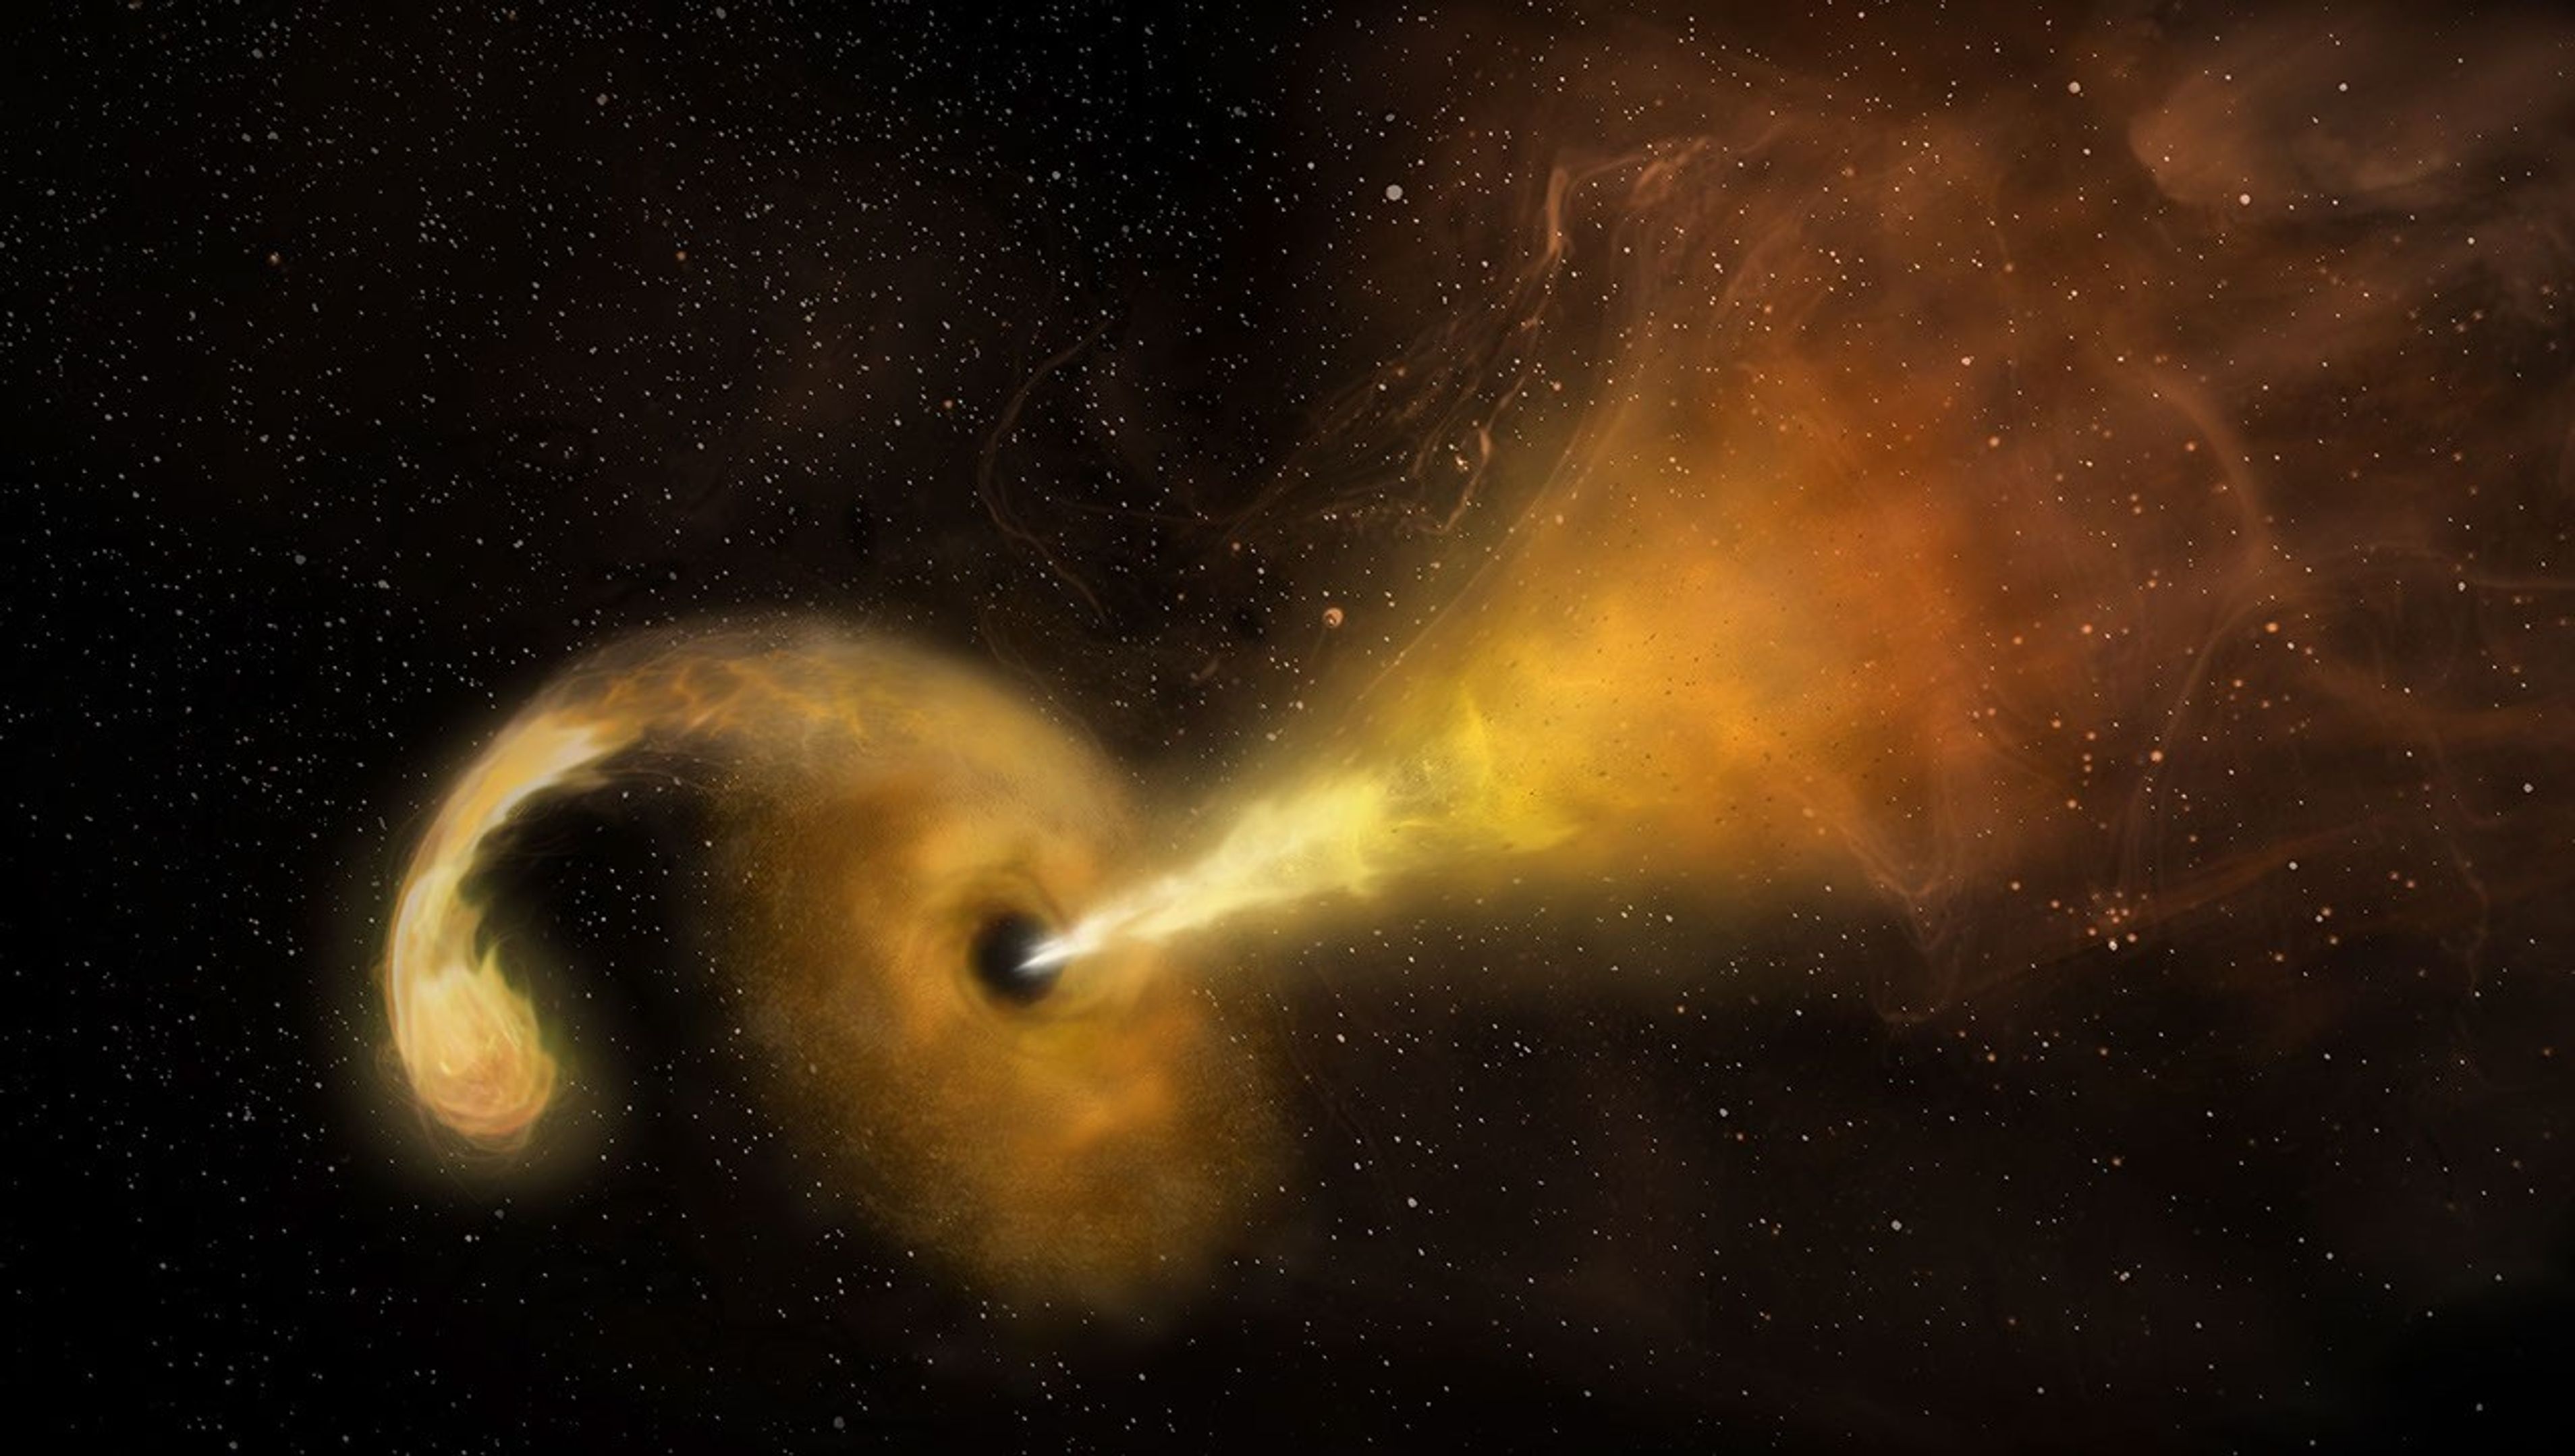
This artist’s concept depicts a tidal disruption event, which occurs when a star passes fatally close to a supermassive black hole. Crumbs of the splintering star heat up as they swirl around the black hole, creating a glow astronomers can see from far across the cosmos, and the black hole launches a relativistic jet into space.
NRAO/AUI/NSF/NASA

NASA’s Neil Gehrels Swift Observatory captured an “orphan” black hole lighting up as it devoured a star on the outskirts of a faraway galaxy. These phenomena are rare to begin with, and none had ever before been seen so far outside of a galaxy’s core.

“We were looking for these star-shredding events as a way to find otherwise invisible supermassive black holes wandering away from the galactic cores where they usually reside,” said Robert Stein, a research fellow at The University of Maryland, College Park and NASA’s Goddard Space Flight Center in Greenbelt, Maryland. “With this discovery, which is one of just a couple that have been confirmed so far, we’ve validated a new technique and can use it to hunt for more.”

A paper describing the results, led by Stein, was published Monday in The Astrophysical Journal Letters.

Researchers saw an ultrabright flare unleashed by a star being torn apart by extreme gravitational forces after drifting too close to a monster black hole — a phenomenon called a tidal disruption event. The black hole behind the blast weighs in at about a million times the Sun’s mass. Its existence was first flagged in November 2025 as an unusual brightening in a galaxy about 750 million light-years away by ZTF (Zwicky Transient Facility), a survey conducted by the Palomar Observatory in Southern California.

“Out of the half million flashes ZTF detects each night, our new artificial intelligence algorithm automatically recognized a flare that looked a lot like a tidal disruption event, despite its unusual location in the outskirts of a galaxy,” Stein said. For a few months, the tidal disruption event outshone its entire host galaxy in ultraviolet wavelengths, temporarily radiating with the light of about 10 billion suns.

Animated observation showing the appearance of a blue orb
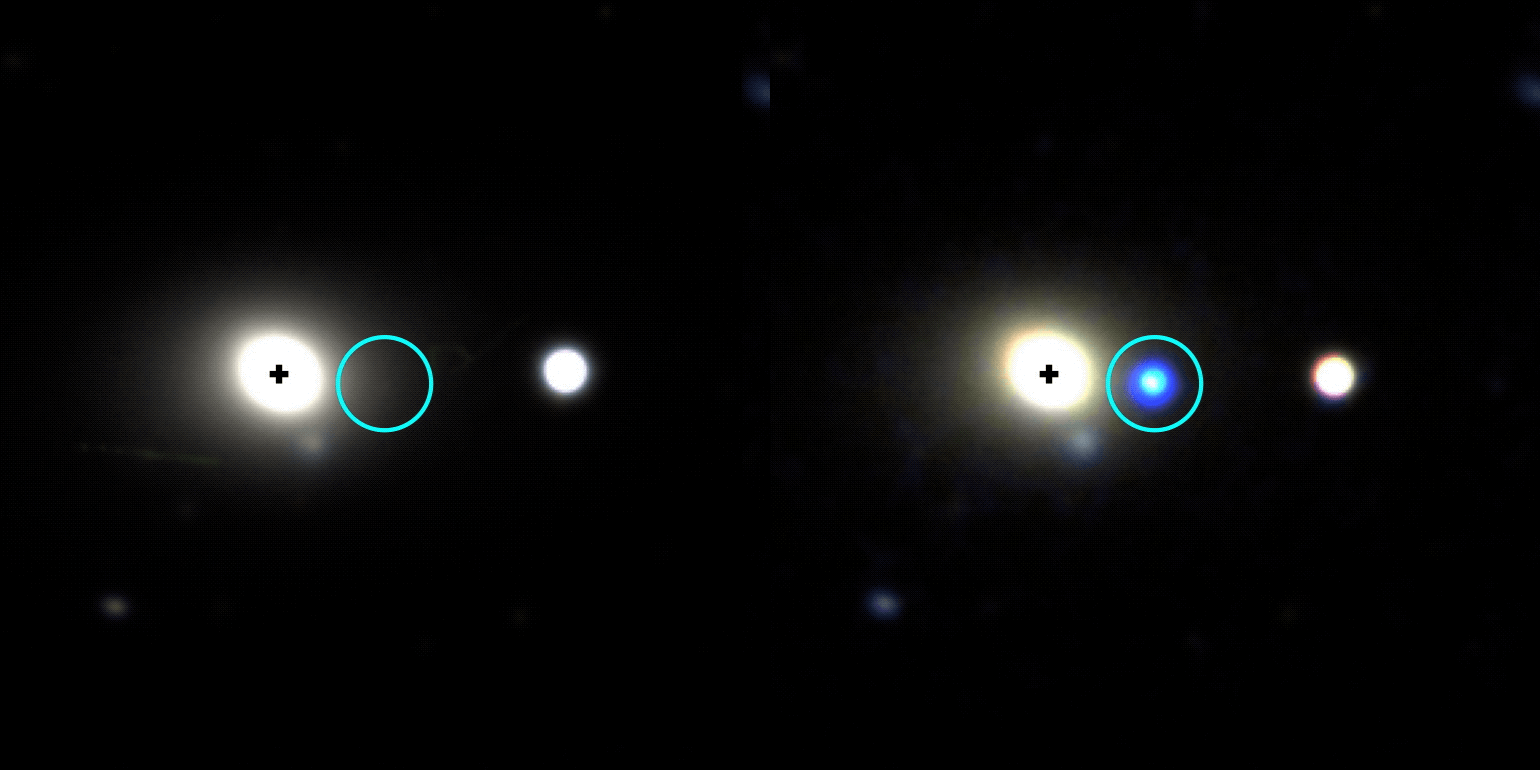
This gif shows the galaxy WISEA J014656.04-152214.7, located about 750 million light-years away in the constellation Cetus, before and after a tidal disruption event was spotted on its outer edge in November 2025. The image at left was taken by the DESI (Dark Energy Spectroscopic Instrument) Legacy Survey and the one at right is from the Lowell Discovery Telescope.
Lowell Discovery Telescope/Legacy Survey/Robert Stein

Other telescopes, including the SOAR (Southern Astrophysical Research) telescope in Chile, followed up on the ZTF source to look at the event’s spectrum, which revealed features supporting that it was likely a tidal disruption event. Astronomers then used NASA’s Swift to look at wavelengths they can’t detect with ground-based telescopes to uncover new information. For example, Swift’s UVOT (Ultraviolet/Optical Telescope) took the blip’s temperature and found that it had quite a fever at about 54,000 degrees Fahrenheit (30,000 degrees Celsius).

“The combination of all this data helped us rule out other explanations and confidently say it’s a tidal disruption event, despite its strange location,” said Jonathan Carney, a doctoral student at the University of North Carolina at Chapel Hill, who took the first spectra that supported the flare’s interpretation as a tidal disruption event.

Hidden heavyweights

Nearly every galaxy in the universe is anchored by a supermassive black hole sitting right in the center. About once every 100,000 years, a star will drift too close to this invisible heavyweight and trigger a tidal disruption event.

While they’re rather rare in any given galaxy, scientists scour millions of galaxies for them. Each year, astronomical surveys typically spot about 30 tidal disruption events occurring somewhere in the universe.

Prior to 2024, they’d only been seen in galaxy cores. That’s partly because astronomers mainly looked for them there; after all, it’s where all the known supermassive black holes were, and you can’t get a tidal disruption event without one (the gravitational pull of lighter black holes isn’t strong enough).

Then scientists saw the telltale signs of a star being shredded 2,600 light-years from the center of its host galaxy. That inspired more astronomers to look beyond galaxy cores for similar events, and now a team has identified one more than 30,000 light-years away from a galaxy’s center.

This video visualizes a star approaching a supermassive black hole so closely that it’s stretched to a breaking point by the black hole’s strong gravity. Intense tidal forces crack the star open and hurl its gaseous guts outward. Stellar debris forms a spinning accretion disk as it continues to spiral into the black hole.
NASA, ESA, STScI, Ralf Crawford (STScI)

Oddball origin story

So how did the newfound black hole become so off-kilter?

“It must have originated in a galaxy’s center, but not the one it’s in the outskirts of now,” Stein said. “We think the host galaxy’s supermassive black hole is still at its core, but the one eating the star could have started off in a small galaxy that merged with the big one we see today.”

The researchers have outlined two possibilities. Three or more galaxies may have merged together, and the gravitational tug-of-war between their central supermassive black holes may have flung the lightest black hole out to the galaxy’s edge.

Or a dwarf galaxy could be midway through a merger. As the dwarf’s stars fell into the larger galaxy, one may have passed too close to the dwarf’s supermassive black hole.

“Further discoveries could reveal the origin of this apparent ‘orphan’ black hole,” Stein said. “The key science question we want to answer is: How common are wandering black holes?”

The answer may soon be within reach. “Pointed science observations with Swift’s UVOT and XRT (X-Ray Telescope) instruments are temporarily suspended as the mission awaits an orbit boost, which is planned for this summer,” said co-author S. Bradley Cenko, Swift’s principal investigator at NASA Goddard. The spacecraft, whose primary mission ran from 2004 to 2006, is slowly sinking toward Earth due to atmospheric drag after more than 20 years of observations of the changing universe. Nudging it to a higher orbit could extend its lifetime even longer. “Once it resumes normal operations, Swift could continue searching for more examples of out-of-place black holes.”

In the coming years, scientists will use the new technique to search for disintegrating stars in observations from the newly operational Vera C. Rubin Observatory, jointly funded by the U.S. Department of Energy and National Science Foundation, in Chile and NASA’s upcoming Nancy Grace Roman Space Telescope.

“Rubin’s wide, deep surveys will reveal a much larger sample of tidal disruption events than current observatories are capable of collecting, including ones that are off-center,” Carney said. “And Roman’s space-based surveys will extend the current search zone by seeing ones that are farther away, looking back through 9 billion years of cosmic history.” Adding their observations to Swift’s and those from ground-based observatories will bring astronomers closer than ever before to completing a census of the universe’s behemoth black holes.

To learn more about the Swift mission, visit:

https://nasa.gov/swift

By Ashley Balzer
NASA’s Goddard Space Flight Center, Greenbelt, Md.

Media contact:

Claire Andreoli
NASA’s Goddard Space Flight Center, Greenbelt, Md.
301-286-1940

NASA’s Hubble Shows Star Formation in Andromeda Galaxy Winding Down

27 July 2026 at 15:00
6 Min Read

NASA’s Hubble Shows Star Formation in Andromeda Galaxy Winding Down

The left half of the disk of the Andromeda galaxy, with a jagged outer edge at the top and bottom on a black background. At right, the galaxy’s center is a horizontal yellow oval extending across about a third of the image. Two crescent shaped clumpy, dark dust lanes with abundant stars throughout extend out from the center. The galaxy becomes bluer as you move outward. At top middle, the satellite galaxy M32 appears as a small, fuzzy yellow oval. Within the disk of Andromeda, two regions at upper right and lower middle are outlined in small white boxes labeled 1 and 2, respectively. At the left side of the image, those two regions are enlarged in pullouts. Both contain a dense, grainy-appearing field of thousands of stars. Region 1 is noticeably bluer than region 2 and contains blue star-forming clumps.
NASA Hubble’s view of part of the Andromeda galaxy.
Credits:
Image: NASA, ESA, Benjamin Williams (UWashington), Zhuo Chen (UWashington), L. Clifton Johnson (Northwestern); Image Processing: Joseph DePasquale (STScI)

A new study using data from NASA’s Hubble Space Telescope finds that star formation in the nearby Andromeda galaxy has undergone a 500-million-year decline, with an even steeper drop in the last 40 million years. Andromeda, a spiral galaxy comparable in size to our Milky Way, is close enough to be seen with the unaided eye from areas with dark skies. Located about 2.5 million light-years from Earth, practically our cosmic backyard, Andromeda offers an opportunity for astronomers to examine its stellar populations in detail, leading to better understanding of the past of galaxies like our own.

The results published Monday in The Astrophysical Journal.

To reach this conclusion, the researchers combined data from two Hubble surveys: the Panchromatic Hubble Andromeda Treasury and the Panchromatic Hubble Andromeda Southern Treasury. Together, these two surveys mapped two-thirds of the disk of Andromeda in ultra-sharp detail. In total, the team measured about 200 million individual stars across the galaxy, giving them a detailed picture of Andromeda’s past activity.

“We need to measure the individual stars because they are the fossil record of the galaxy’s formation. Hubble is the only telescope that can give you high enough spatial resolution over a large enough area to be able to do that in Andromeda,” said Ben Williams, astronomer at the University of Washington and a co-author on the study.

Massive stars are bluer and short-lived, while less massive stars are redder and longer-lived. As a result, areas that have experienced recent star formation tend to have a larger fraction of blue stars, while areas with less recent star formation typically have a redder population. The team divided the Andromeda images into thousands of squares, spanning 300 light-years on each side of the square, and determined the history of star formation within each parcel to gain a comprehensive view of the galaxy’s past.

NASA’s Hubble Space Telescope has provided a detailed view of millions of stars in the Andromeda galaxy. Regions that have experienced recent star formation (1) appear significantly bluer than regions with less recent star formation (2).
NASA, ESA, Benjamin Williams (UWashington), Zhuo Chen (UWashington), L. Clifton Johnson (Northwestern); Image Processing: Joseph DePasquale (STScI)

Steady decline

Previous research showed the Andromeda galaxy experienced a dramatic burst of star formation about 2 billion years ago, likely due to a past interaction or merger with another galaxy. Since that time, star formation has been steadily declining.

Astronomers measure the rate of star formation in terms of the mass, or amount of gas and dust, converted into stars per year. The researchers calculated that, 500 million years ago, Andromeda formed stars at a rate of about one solar mass per year. However, the formation rate dropped to about half that by 40 million years ago. The current rate has plummeted even farther, to about one-fifth the mass of our Sun per year.

The team also examined whether that decline was consistent across the galaxy or concentrated in certain areas. They found that much of the recent star formation has occurred in a star-forming ring located about 32,000 light-years from the galaxy’s center. As a result, much of the decline they measure is driven by decreasing activity within that ring.

Rather than being the result of reduced material from which new stars can form, the decline is more likely to be a natural winding down from its previous, more active state.

“It’s just like after running a marathon, sometimes you’ve got to take a bit of a breather,” said Tobin Wainer, lead author, University of Washington.

Likely suspect

The team also investigated whether there was any connection between the decrease of activity in Andromeda and its proximity to satellite galaxy M32 (Messier 32). The M32 galaxy is separated from Andromeda by about 16,000 light-years in the plane of the sky; however, its 3D location in space is uncertain. As a result, astronomers are unsure if or when it might have interacted with Andromeda in the past.

“One of the major motivations for this program was to probe potential interactions between M32 and Andromeda’s disk,” said Zhuo Chen, co-author, University of Washington.

Survey data from the Panchromatic Hubble Andromeda Southern Treasury allowed the team to study the history of star formation in Andromeda near M32. They found that this area showed signs of decreased star formation compared with other regions. The timing of this decrease, which this study finds began roughly 60 million years ago, could help constrain when the M32 galaxy interacted with Andromeda’s disk.

“We can’t explicitly say that we are seeing a decrease in star formation because of M32. But it’s right there, and it’s definitely the most likely suspect,” said Wainer.

This movie, created from an analysis of data from NASA’s Hubble Space Telescope, demonstrates how the rate of star formation in the Andromeda galaxy has declined over the past 500 million years. Brighter colors indicate where star formation was highest during a given time.
Visualization: Tobin Wainer (UWashington); Image Processing: Joseph DePasquale (STScI); Video: NASA, ESA, STScI, Gregory Bacon (STScI)

The team plans to continue analyzing the Hubble data and combine it with data from ground-based observatories to gain additional insights into the history of Andromeda.

“There’s a strong scientific value to this archival data. Andromeda is important because it’s a neighbor that is close enough that we can see it in great detail while also getting a global perspective,” said Raja GuhaThakurta, co-author, University of California Santa Cruz.

An even greater global perspective is likely to come from NASA’s Nancy Grace Roman Space Telescope after it launches as early as Sunday, Aug. 30. Roman’s gigantic field of view can cover at least 100 times as much area as Hubble at near-infrared wavelengths in a single observation. A newly approved Roman observing program will image the entirety of Andromeda’s disk and areas of its surrounding halo, allowing astronomers to measure hundreds of millions of stars and enabling groundbreaking new science.

The Hubble Space Telescope has been operating for more than three decades and continues to make ground-breaking discoveries that shape our fundamental understanding of the universe. Hubble is a project of international cooperation between NASA and ESA (European Space Agency). NASA’s Goddard Space Flight Center in Greenbelt, Maryland, manages the telescope and mission operations. Lockheed Martin Space also supports mission operations at Goddard. The Space Telescope Science Institute in Baltimore, which is operated by the Association of Universities for Research in Astronomy, conducts Hubble science operations for NASA.


Related Images & Videos

The left half of the disk of the Andromeda galaxy, with a jagged outer edge at the top and bottom on a black background. At right, the galaxyu2019s center is a horizontal yellow oval extending across about a third of the image. Two crescent shaped clumpy, dark dust lanes with abundant stars throughout extend out from the center. The galaxy becomes bluer as you move outward. At top middle, the satellite galaxy M32 appears as a small, fuzzy yellow oval. Within the disk of Andromeda, two regions at upper right and lower middle are outlined in small white boxes labeled 1 and 2, respectively. At the left side of the image, those two regions are enlarged in pullouts. Both contain a dense, grainy-appearing field of thousands of stars. Region 1 is noticeably bluer than region 2 and contains blue star-forming clumps.

Andromeda Galaxy

NASA’s Hubble Space Telescope has provided a detailed view of millions of stars in the Andromeda galaxy.

On a black background, a pixelated, partial ring of bright pink and purple extends from 8 ou2019clock clockwise to 3 ou2019clock. There is a black gap at the bottom of the ring as well as in the middle. Below the ring, a timeline labeled millions of years ago lists the numbers 500, 200, 100, 50, 25, 0. The numbers 500 and 200 are yellow with a yellow line between them, indicating that the image shows the rate of star formation that was occurring in that timeframe.

Star Formation Rate in Andromeda Over Time

This movie, created from an analysis of data from NASA’s Hubble Space Telescope, demonstrates how the rate of star formation in the Andromeda galaxy has declined over the past 500 million years.


Share

Details

Last Updated
Jul 27, 2026
Editor
Andrea Gianopoulos
Contact
Media

Claire Andreoli
NASA’s Goddard Space Flight Center
Greenbelt, Maryland
claire.andreoli@nasa.gov

Christine Pulliam
Space Telescope Science Institute
Baltimore, Maryland

Shaping the field of medical imaging: a fireside chat with Simon R Cherry and Xinchen Deng

23 July 2026 at 14:47


Join us for an in‑depth conversation with Simon Cherry, former editor‑in‑chief of Physics in Medicine & Biology (PMB), as he shares his expert perspective on the evolving landscape of medical physics research, molecular imaging, and non-invasive imaging technologies. Drawing on decades of leadership in biomedical imaging and academic publishing, Simon will reflect on major advances shaping the field, define the characteristics of high‑impact imaging research, and highlight how PMB continues to support rigorous, influential scientific work through its editorial standards and peer‑review practices.

This session will additionally spotlight the research of Xinchen (Alison) Deng, a finalist of the PMB 2024 Early Career Award. Attendees will gain insights into her contributions to the advanced medical imaging community, such as photon-counting CT for clinical applications and how her work supports broader advances in medical physics and X-ray/CT imaging research.

Simon will also discuss what makes early‑career research stand out and share strategies for researchers aiming to increase the visibility, reach, and long‑term impact of their publications within competitive scientific journals.

Carol Clark, Simon Cherry, Xinchen Deng
Left to right: Carol Clark, Simon Cherry, Xinchen (Alison) Deng

Moderator

Carol Clark, Publisher, Physics in Medicine & Biology

Speakers

Simon R Cherry, PhD received his BSc (Hons) in physics with astronomy from University College London in 1986 and a PhD in medical physics from the Institute of Cancer Research, University of London in 1989. Simon is currently Distinguished Research Professor in the Departments of Biomedical Engineering and Radiology at UC Davis and Professor of Total-Body Imaging at King’s College London. Simon’s research interests centre around biomedical imaging. His major contributions have been in developing systems for positron emission tomography (PET), including designing the microPET scanner for small-animal imaging, the earliest examples of simultaneous PET and MRI studies and co-leading the EXPLORER consortium that developed the world’s first total-body PET scanner. Simon is a Fellow of the Royal Society and Member of the U.S. National Academy of Engineering and National Academy of Inventors. He has received several international awards including the Society of Nuclear Medicine and Molecular Imaging Cassen Prize in 2022. He served as editor-in-chief of the journal Physics in Medicine & Biology from 2011–2020. Simon is the author of more than 350 peer-reviewed journal articles, review articles and book chapters in the field of biomedical imaging. He is also lead author of the widely-used textbook Physics in Nuclear Medicine.

Xinchen (Alison) Deng, PhD, is a diagnostic imaging physics resident at The Ohio State University. Her research focuses on advancing photon-counting CT for clinical applications, including multi-contrast imaging, early disease detection, detector optimization, and AI-based improvements in image quality. Before beginning the residency, Xinchen (Alison) was a postdoctoral fellow in medical physics at the University of Victoria, where she worked with Magdalena Bazalova-Carter and collaborated with Redlen Technologies on the optimization of photon-counting detectors and the clinical applications of spectral CT. She received her PhD in medical physics from the University of British Columbia, where she applied Raman spectroscopy, machine learning, and explainable AI to study radiation treatment response in cancer cells and tissues. Her broader research background spans photon-counting CT, spectral X-ray imaging, Raman spectroscopy, radiotherapy response assessment, and AI-driven image and data analysis. Her photon-counting CT research has been featured in the Physics in Medicine & Biology Early Career Researcher Focus Collection. She is a finalist for the PMB Early Career Researcher Award.

About this journal

Physics in Medicine & Biology. The international journal of biomedical physics and engineering, published by IOP Publishing on behalf of the Institute of Physics and Engineering in Medicine (IPEM)

Editor-in-chief: Katia Parodi, Ludwig-Maximilians University, Munich, Germany


The post Shaping the field of medical imaging: a fireside chat with Simon R Cherry and Xinchen Deng appeared first on Physics World.

The physics of protein condensates

22 July 2026 at 09:37

Intrinsically disordered proteins (IDPs) do not form stable 3D structures. Instead, they remain flexible, adopt many conformations, and can interact with multiple molecules. Although proteins were once thought to require a fixed structure to function, many IDPs play essential cellular roles. Some IDPs can assemble into biomolecular condensates, membrane-less compartments that help organise processes such as gene expression and stress responses.

Many IDPs contain prion-like low complexity domains (PLCDs), which have defined sequence features known as molecular grammas. These IDPs are multivalent and can form hierarchies of interactions with one another. These interactions promote clustering and, under the right conditions, phase separation into a protein-rich condensate and a surrounding dilute phase. Dysregulation of condensates has been linked to disease.

In this study, researchers used computer simulations to investigate the PLCD known as A1-LCD. Their aims were to accurately identify the critical point where phase separation ceases, map the full phase diagram, and assess methods used to estimate the theta temperature (Tθ), a measure related to solvent quality and protein interactions.

The simulations revealed three distinct phase-separation regimes: a dilute phase containing mostly isolated proteins, an intermediate regime where clusters form before large condensates appear, and a regime near the critical point characterised by system-spanning networks. The study also showed that condensates behave as percolated networks of interconnected proteins. Importantly, the authors found that commonly used methods for estimating theta temperature may be inaccurate for these systems.

Overall, this work provides new insights into the phase behaviour of condensate-forming proteins and highlights the need for more reliable approaches to assessing solvent quality. These findings could improve future studies of biomolecular condensates and their roles in health and disease.

“Comparative assessments of driving forces for phase separation requires knowledge of IDP-specific critical points. Our application of rigorous finite size scaling methods pioneered by Kurt Binder helped us delineate the critical and mean field regimes and demonstrate how the critical point can be converged upon for realistic approximations of IDPs. This revealed several surprises regarding the complex nature of the coexisting dilute phase. Additionally, we found that calculation of the two-body interaction coefficient provides a computationally tractable approach to compute comparative, sequence-encoded driving forces for phase separation of IDPs. This is directly relevant to inferring how changes to molecular grammars influence phase behaviors driven by homotypic associations.” – Rohit V. Pappu, Washington University in St. Louis

Read the full article

Distinguishing near- versus off-critical phase behaviors of intrinsically disordered proteins

Gaurav Mitra et al 2026 Rep. Prog. Phys. 89 068101

Do you want to learn more about this topic?

Biomolecular dynamics: order–disorder transitions and energy landscapes by Paul C Whitford, Karissa Y Sanbonmatsu and José N Onuchic (2012)

The post The physics of protein condensates appeared first on Physics World.

Nonlinear photoexcitation in Mott Insulators

22 July 2026 at 09:36

According to band theory, materials with partially filled energy bands and unpaired electrons should conduct electricity, but in Mott insulators this rule is broken. In these materials, the repulsion between electrons is so strong that they cannot move freely and become localized. When sufficient energy is supplied (for example by light), electrons can form a doublon (two electrons on one site) and a hole (an empty site). These excitations can move, enabling electrical conductivity.

A key question for Mott insulators is how these charge carriers are created and what controls their production. Traditionally, two regimes were known: multiphoton absorption, where several photons combine their energy, and tunnelling, where a strong electric field drives electrons across the gap.

In this work, the authors show that there are actually four regimes: multiphoton, tunnelling, a cooperative regime where the two processes work together, and an incoherent regime where weak fields and scattering dominate. They also show that the energy gap (the cost to create a doubloon-hole pair) is not fixed, but changes during the process because the generated carriers modify the system. This creates a feedback loop, making the dynamics nonlinear and time-dependent. As a result, carrier production can either slow down or suddenly speed up, even making the system more efficient without changing the driving field.

The behaviour depends on field strength, frequency, dissipation, and time, and each mechanism can be identified by its distinct momentum pattern. By tuning laser parameters, the system’s properties can be controlled in real time. Overall, this work shows that light can be used to dynamically reshape and control strongly interacting materials, opening possibilities for ultrafast, light-driven technologies.

Read the full article

Subgap pumping of antiferromagnetic Mott insulators: photoexcitation mechanisms and applications

Radu Andrei et al 2026 Rep. Prog. Phys. 89 068004

Do you want to learn more about this topic?

PLP-Logo-2.png, find out more. Quantum frustration in organic Mott insulators: from spin liquids to unconventional superconductors by B J Powell and Ross H McKenzie (2011)

The post Nonlinear photoexcitation in Mott Insulators appeared first on Physics World.

Making sense of quantum wavefunction collapse

15 July 2026 at 08:12

Quantum mechanics has two seemingly competing rules. Firstly, a system evolving without measurement follows a continuous, deterministic evolution governed by the Schrödinger equation, with dynamics determined by a Hamiltonian. Secondly, when a measurement occurs, the wavefunction collapses, producing a sudden, discontinuous change that is not derived from a Hamiltonian. Several approaches attempt to reconcile these behaviours, including the Copenhagen interpretation (which does not explain the mechanism of collapse), decoherence theory (which does not provide a single definite outcome), stochastic collapse models, and continuous measurement theory.

In this work, measurement is not treated as fundamentally different. Instead, it is described using stochastic (random) Hamiltonians that generate continuous evolution of the quantum state. In this picture, collapse emerges from noisy dynamics. The authors show that these dynamics can be understood as double-bracket gradient flows, where the system is driven to align with a measured observable, steadily reducing uncertainty until it reaches a definite outcome. Thus, wavefunction collapse can be viewed as coarse-grained continuous dynamics that minimise the variance of the observable. By interpreting this as a gradient flow, the same mechanism can be exploited using feedback to drive a system into desired states, including entangled ones.

This approach provides a continuous and physically interpretable picture of wavefunction collapse. Compared to decoherence theory, it explains the emergence of a single outcome but does not specify when measurement dynamics begin. More broadly, it replaces the notion of collapse with a dynamical process, making the theory more internally consistent, while also offering practical tools for controlling quantum systems, which is important for quantum computing and experiments.

“These geometric connections between Hamiltonian dynamics and quantum measurements open the door to exciting new approaches to quantum algorithm design.” – Aaron Villanueva, Radboud University

Read the full article

Hamiltonian and double-bracket flow formulations of quantum measurements

Aarón Villanueva and Luis Pedro García-Pintos 2026 Rep. Prog. Phys. 89 067602

Do you want to learn more about this topic?

Genuine quantum correlations in quantum many-body systems: a review of recent progress by Gabriele De Chiara and Anna Sanpera (2018)

The post Making sense of quantum wavefunction collapse appeared first on Physics World.

Experimental realisation of percolation with coupled lasers

15 July 2026 at 08:10

Percolation studies how small connections can group together to form a larger connected system, known as a cluster. In a grid where sites can be turned on or off, turning on more sites leads to the formation of clusters, and at a certain point a giant cluster spanning the system emerges. This behaviour is relevant to many real-world systems where local interactions lead to global effects, such as power grids, disease spreading, forest fires, and brain activity. While percolation is often studied using theoretical models or simulations, real systems are more complex. Nonlinear effects, noise, imperfect connections, and time-dependent dynamics can all shift the tipping point and change how clusters form.

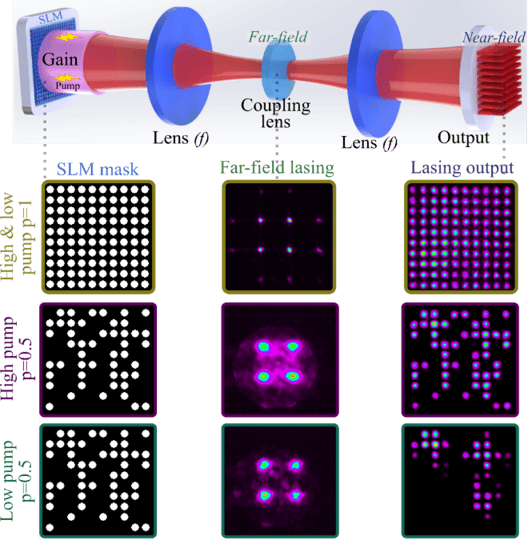
Schematic diagram of the experimental setup for implementing percolation using coupled lasers, along with the corresponding lasing output for different percolation mask realizations. Figure 1 from Simon Mahler et al 2026 Rep. Prog. Phys. 89 067901
Schematic diagram of the experimental setup for implementing percolation using coupled lasers, along with the corresponding lasing output for different percolation mask realizations. Figure 1 from Simon Mahler et al 2026 Rep. Prog. Phys. 89 067901 (Courtesy: Mahler/Weizmann Institute of Science)

In this work, the researchers built a physical system using a 2D array of 100 coupled lasers to study percolation experimentally. Each laser acts as a site that can be turned on and interacts with its neighbours, making the system a controllable realisation of a percolation grid. They found that when a large connected cluster forms, the lasers also begin to phase-lock, meaning that connectivity and synchronisation emerge together. Normally, these effects are studied separately.

At high pump power (the energy supplied to the lasers), the system behaves like an ideal percolation model, with a clear critical threshold and a smooth (second-order) transition, consistent with theory. However, at low pump power, nonlinear effects become important. The lasers compete more strongly, meaning more active sites are needed to form a spanning cluster, and weaker clusters are suppressed. This shifts the percolation threshold and alters the cluster size distribution, contrary to the usual expectation that nonlinear effects are stronger at higher power.

To explain this, the researchers introduced a simple model where a site only remains active if it has enough active neighbours, effectively modifying the connectivity rules. This reproduces the observed behaviour and shows how nonlinear effects can reshape percolation. Overall, the work demonstrates that real physical systems can significantly modify ideal percolation behaviour, and provides a controllable platform for studying how connectivity, competition, and synchronisation interact in complex networks.

Read the full article

Percolation with coupled lasers: effect of non-linearities on the phase transition

Simon Mahler et al 2026 Rep. Prog. Phys. 89 067901

Do you want to learn more about this topic?

Percolation theory by J W Essam (2018)

The post Experimental realisation of percolation with coupled lasers appeared first on Physics World.

Powerful cosmic winds may have destroyed galaxies in the early universe

10 July 2026 at 09:00

A galaxy that formed around a billion years after the Big Bang is in its death throes thanks to a powerful galactic wind that is blasting its gas into space, say astronomers at Australia’s Swinburne University of Technology. The discovery, which is based on data from the James Webb Space Telescope (JWST) and the Atacama Large Millimeter/submillimeter Array (ALMA) in Chile, could help explain why some of the universe’s earliest massive galaxies ceased to form new stars.

One of the JWST’s most surprising discoveries is that when the universe was between one and two billion years old, it already contained large numbers of massive galaxies. Astronomers think these galaxies may have acquired most of their mass in intense bursts of star formation. But at some point, that process stopped: in technical terms, the galaxies became quiescent.

“These galaxies seemed to have formed all their stars very quickly and then they suddenly died, all within the first two billion years of the universe being formed,” says Rebecca Davies, who led the new research.

The CRISTAL-02 galaxy

One possible explanation for the onset of quiescence is that when galaxies collide with each other, the resulting winds “blow away” the hydrogen fuel required for new stars to form. To investigate this hypothesis, Davies and colleagues focused on a galaxy called CRISTAL-02, which was one of 20 galaxies in the recent ALMA-CRISTAL survey of early star-forming galaxies.

“When we looked at the data, it stood out because it was the only one that showed strong evidence for a galaxy wind,” Davies explains. “We saw this as an excellent opportunity to study how winds impacted the evolution of galaxies in the early universe.”

The light from CRISTAL-02 travelled for approximately 12.7 billion years to reach us, meaning that we see it as it was one billion years after the Big Bang. Because the universe has been expanding since then, the galaxy’s spectra appear highly red-shifted. This meant the Swinburne astronomers needed the JWST’s infrared-sensing capabilities to analyse a spectral feature known as the hydrogen-alpha (Hα) line that is normally red. They also used ALMA to analyse CRISTAL-02’s C II line, which comes from ionized carbon and has a (non-redshifted) wavelength of 158 mm. Both emission lines can yield important information about the properties of early galaxies.

Living fast and dying young

From the ALMA-CRISTAL survey’s measurements of Hα luminosity, astronomers knew that CRISTAL-02 forms stars at a rate of around 260 M☉ per year. This is about three times the average value for “main-sequence” star-forming galaxies at similar mass and redshifts.

The latest observations, however, suggest that it won’t maintain this pace for long. Davies and colleagues identified a huge plume of C II emissions that extends as far as 7 kiloparsecs (kpc) to the north-east of CRISTAL-02, making it almost as long as the galaxy itself. This is a telltale sign that gas is being driven out of the galaxy. The fact that the gas in this plume is blue-shifted by 100 km s-1 lends further support to this explanation.

If this rapid blowout continues, Davies says that CRISTAL-02 will cease to exist in less than 50 million years. But the team’s findings may have implications beyond the fate of this single galaxy. “Our results could help to explain how some of the earliest massive quiescent galaxies in the universe behave,” she tells Physics World. “When the JWST started observing distant galaxies in 2022, it found far more evolved galaxies in the early universe than models predicted. These galaxies seemed to have formed all their stars very quickly and then suddenly died, all within the first two billion years of the universe. The galaxy we discovered seems to be following this path.”

Learning about the early universe

Davies explains that because the early universe was much more compact than it is now, collisions between galaxies were common. During such collisions, gas funnels towards the galactic centres, triggering strong bursts of star formation but also producing strong winds that eventually drive the gas away. “If many early galaxies collide and experience rapid growth, then it may not be surprising at all that we see so many dead galaxies in the early universe,” she says.

The researchers stress that the present work, which is detailed in the Monthly Notices of the Royal Astronomical Society, is based on a case study of just one galaxy. They now need to observe other early, massive galaxies caught during periods of intense growth to determine whether they, too, experience powerful winds that could rapidly expel their gas and stop them from forming stars.

The post Powerful cosmic winds may have destroyed galaxies in the early universe appeared first on Physics World.

Measuring the invisible: how internal dosimetry shapes radiation protection

8 July 2026 at 14:31
<strong>Safety first:</strong> Internal Dosimetry is the practice of estimating intakes and risk from occupational exposures to radioactive materials (Credit: iStock/magicmine)
Safety first: Internal Dosimetry is the practice of estimating intakes and risk from occupational exposures to radioactive materials (Credit: iStock/magicmine)

Radioactive materials have become a vital tool in our modern society, enabling the delivery of powerful medical treatments, the detection of toxic substances, and the generation of energy on a massive scale. But they also pose significant risks to human health, which means that organizations handling radioactive isotopes must have robust procedures in place to manage and monitor the dose received by their workforce and the wider public.

Dosimetry badges provide a visible and straightforward way to measure external exposure to radiation, but they are unable to determine the amount of radioactive particulates that have entered the body. Quantifying these intakes requires internal dosimetry, which typically uses measurements of urine or faecal samples – or less commonly in vivo radiological counts – to estimate the intake of specific radioisotopes. While the internal dose cannot be measured directly, monitoring data from these bioassays can be combined with biokinetic models to assess the likely impact of an individual inhaling, ingesting or being injected with a radioactive substance.

But internal dosimetry is not an exact science, and organizations with limited experience of radiation safety can struggle to translate regulatory requirements and the associated guidance into monitoring programmes that provide appropriate protection for their employees. Luckily, help is at hand. Dade Moeller & Associates, a wholly owned subsidiary of NV5, is a consultancy company specializing in radiation safety and dosimetry monitoring. Dade Moeller’s team of senior and certified health physicists can help organizations to balance worker protection with regulatory compliance.

Fit for purpose

“We encourage people to think about what they are monitoring for,” says Dr Brett Rosenberg, a certified health physicist at Dade Moeller with expertise in internal dosimetry. “The dosimetry programme must be tailored to the activity and half-life of the materials being handled, how those particular radionuclides interact with the body, and the maximum dose that an individual is likely to receive.” All of these considerations are important for prescribing a monitoring programme that does not become too onerous in costs and implementation while still providing an accurate assessment of occupational exposures.

In low-dose environments, for example, Rosenberg would advise organizations to run a confirmatory programme, in which samples from a subset of the workforce are used to check for any unexpected intake that would warrant further investigation. In contrast, routine internal dosimetry becomes a necessary requirement when there is a greater risk of workers receiving doses that exceed monitoring criteria – or even limits – set by the regulations.

Such situations are likely to arise, for example, in facilities that develop and manufacture medical radioisotopes, such as highly volatile iodine-131 for treating thyroid conditions. Radionuclides with the potential to generate higher doses are also produced throughout the fuel cycle for nuclear power generation, from extracting and refining the uranium – which creates radioactive dust that is easily inhaled – through to the management of nuclear waste.

In the US, such commercial operations are overseen by the Nuclear Regulatory Commission (NRC), which sets maximum limits both for the total radiation dose and the intake that a worker can receive. Companies must demonstrate compliance with these limits, but the NRC does not dictate the methodologies that are used for internal monitoring, or for estimating the intake from lab-based measurements. “Programme development and design is not based on regulation, it’s based on guidance,” says Rosenberg.

Flexibility leads to variability

That leaves organizations with significant flexibility in how they design their monitoring strategies, which allows programmes to be tailored to operational realities rather than forced into a rigid template. However, it also leads to variability in monitoring approaches and in the interpretation of results. Annual audits required by the NRC offer an opportunity for experts like Rosenberg not just to verify compliance, but also to identify opportunities for improvement. “I look for technical shortfalls in internal dosimetry, and check that the measures in place are effective and appropriate,” he says.

Many companies value the input they receive through these regular evaluations. Dan Sowers, for example, is the Global Radiation Protection Manager for Westinghouse, a nuclear services company that, among other things, fabricates uranium fuel and maintains the inner workings of nuclear reactors when they are not being operated. “My priority is the health of our workers,” he says. “Ultimately, we want our internal dosimetry programme to demonstrate that workplace controls are effective.”

Regular input from external advisors helps Sowers to ensure that robust procedures are in place for contamination control, and for assigning a dose to an employee when there is an intake of radioactivity. “The experts at Dade Moeller have enough real-world experience to know what’s right, which can go beyond the guidance we get from the regulators,” says Sowers. “They bring a fresh set of eyes to our operation and share best practice from other sites.”

The team at Dade Moeller also provides expert input to the US Department of Energy (DOE), which runs the national labs as well as facilities for nuclear security. Unlike the NRC, the DOE prescribes structured programmes for internal dosimetry that are tailored to the radioactive materials being handled at each site. It mandates lower dose thresholds than specified by the NRC for workers to undergo routine internal dosimetry checks, and uses a newer set of recommendations for assessing intake and estimating the dose received by different parts of the body. (However, notes Rosenberg, neither the NRC nor DOE use the latest set of recommendations, which are being adopted internationally.)

Creating consistency

Many of those recommendations come from the International Commission on Radiological Protection (ICRP), an independent body that provides guidance on dose limits and monitoring methodologies. The ICRP also develops and publishes the biokinetic models that are used by dosimetrists to translate the radiation counts from bioassays into estimates of intake and effective dose. Specific models have been developed to assess the impact of inhaling or ingesting different radioactive species, but the results are open to interpretation and depend on the version of the model being used.

To avoid these ambiguities, national regulators in Europe have combined forces to create a unified framework for internal dosimetry. Based on the outcomes from a co-ordinated research project in the early 2000s, this framework defines a standard set of methods and assumptions to ensure that different organizations calculate similar dose estimates from the same monitoring data. However, no such consistency exists in the US, where the NRC does not specify the details of the monitoring programme or the modelling methods a company should use, or between regulators in other parts of the world.

That lack of consistency can create difficulties for international companies like Westinghouse, which operates across 21 countries in different geographic regions. “Our internal dosimetry programmes are slightly different in each location,” says Sowers. “Those differences don’t affect the fundamentals of how we protect the health and safety of the worker, but the fine print of the regulations often requires us to do things slightly differently to make sure we are compliant.”

Dealing with uncertainty

To improve consistency, Rosenberg is involved in both national and international standards initiatives that aim to define best practice. However, he says, even the most carefully designed monitoring programme cannot eliminate the inherent uncertainty in estimating the effective dose from lab-based measurements of excreted samples.

“Even the most up-to-date models may not be very accurate,” says Rosenberg. “While the bioassay results are taken from a real individual, the model assigns the dose to a reference person who weighs 70 kg, excretes 135 g of faeces per day, and has both ovaries and a prostate.” As a result, the effective dose calculations based on excreted samples can carry errors of 300% when considering the anatomy and physiology of an “average worker”, and the practical limitations around counting statistics and sampling. “For practitioners, the challenge is not to remove uncertainty, but to understand and manage it,” says Rosenberg.

Given these intrinsic uncertainties, Rosenberg’s mission is to help regulators and commercial organizations to deploy the most effective methodologies for improving the standard of care. As part of these efforts, he has developed a week-long training course that aims to demystify the process of internal dosimetry for managers and regulators who need to understand the guidance from regulatory and international bodies like the ICRP.

“We do see uncertainty associated with inappropriate dosimetry practices, and to advance the field both the regulators and the practitioners need to stay current with the latest recommendations and models,” he says. “It’s easy to follow NRC regulations, but putting structured monitoring programmes in place and using the most appropriate models will help companies to produce more accurate evaluations and improve the safety of their workers.”

The post Measuring the invisible: how internal dosimetry shapes radiation protection appeared first on Physics World.

Advanced simulations of exotic quantum matter

8 July 2026 at 08:33

When electrons are placed in a strong magnetic field and cooled to very low temperatures, they stop behaving independently and instead act as a collective fluid. This is known as a fractional quantum Hall (FQH) system. In this regime, the electrons lose their individual behaviour and act as one correlated system. The strong interactions between them produce quasiparticles called anyons. These are not real particles but effective ones that emerge from the collective behaviour, and they have unusual properties that do not occur in ordinary systems.

Anyons exhibit braiding behaviour: when they are moved around each other, the system remembers the path taken. In Abelian braiding, this only adds a simple phase, so the quantum state is effectively unchanged. In contrast, non-Abelian braiding transforms the quantum state into a different one, which can be measured and used to encode information.

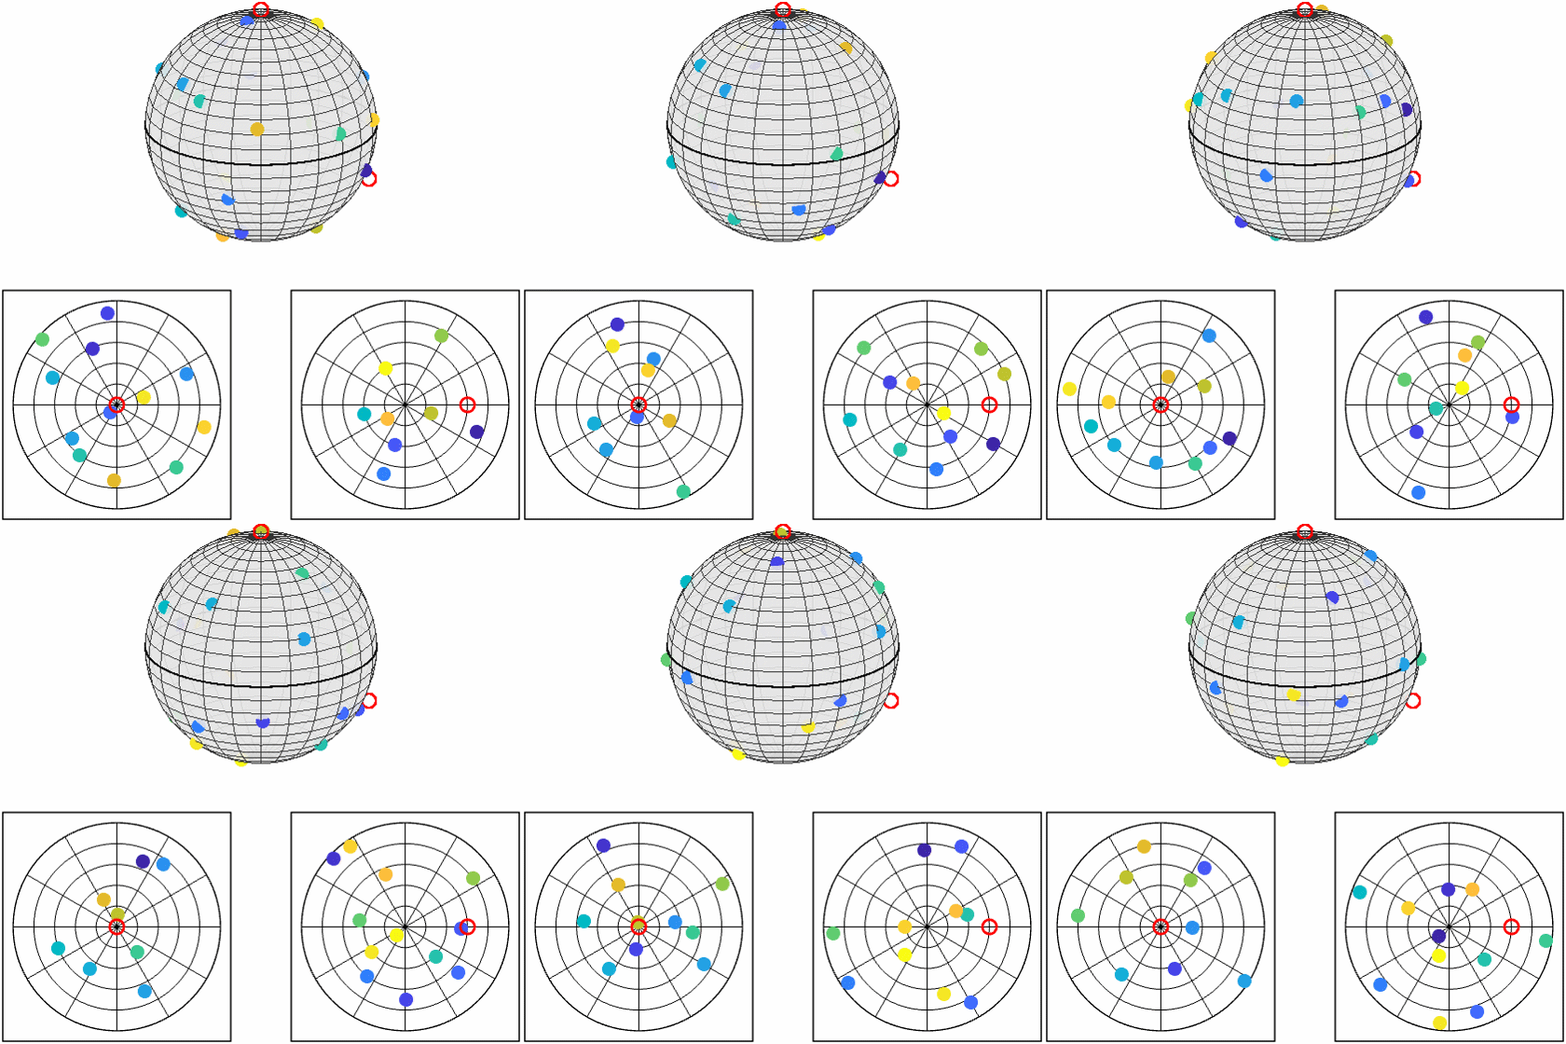
A Moore–Read state of 20 electrons on a sphere, with two quasiholes pinned at fixed positions
A Moore–Read state of 20 electrons (solid dots) on a sphere, with two quasiholes pinned at fixed positions (red open circles). The lower panel presents a double stereographic projection, showing the electrons in the northern and southern hemispheres, respectively. (Courtesy: Ting-Tung Wang/University of Hong Kong)

To study these systems, physicists must compute measurable properties from complicated wave functions, which is computationally challenging, especially for large systems. The traditional method, Metropolis Monte Carlo, is slow and struggles with large numbers of electrons, limiting system size, accuracy, and the ability to test advanced theories.

In this work, the researchers developed a new simulation method, Hybrid Monte Carlo (HMC), for FQH wave functions. It includes global updates (updating many electrons at once) and double stereographic projection to more accurately sample particle positions, making it much faster and more efficient than the Metropolis method.

Using this improved method, they accurately computed edge properties that reveal the system’s topology, as well as high-quality braiding matrices of non-Abelian quasiholes, which are crucial because such braiding underpins topological quantum computing. Overall, this work enables fast, large-scale simulations, allowing more accurate study of exotic quantum states and their anyon behaviour, advancing both fundamental physics and topological quantum computing.

Read the full article

Hybrid Monte Carlo for fractional quantum Hall states

Ting-Tung Wang et al 2026 Rep. Prog. Phys. 89 068001

Do you want to learn more about this topic?

A review of the quantum Hall effects in MgZnO/ZnO heterostructures by Joseph Falson and Masashi Kawasaki (2018)

The post Advanced simulations of exotic quantum matter appeared first on Physics World.

Controlling glycine polymorphs through nanoconfinement

8 July 2026 at 08:30

Molecules such as glycine, the simplest amino acid, can crystallise into different polymorphs with the same chemical composition but different structures. The two phases of glycine are α-glycine, which forms easily and is stable in bulk conditions, and β-glycine, which is difficult to produce and unstable in the bulk. However, β-glycine is piezoelectric; it generates electricity when compressed or bent and is therefore technologically useful.

In this work, the researchers developed a new method to produce glycine crystals. Using an electric field, they sprayed a glycine solution to create nanoscale droplets in which crystals form. By controlling the spraying conditions, they confined crystal growth at the nanoscale, thereby controlling how the crystals form. Crystals below 120 nm in size were pure β-glycine, above 130 nm were mostly α-glycine, and sizes between 120-130 nm produced a mixture of both polymorphs. This shows that crystal size (nanoconfinement) is the key parameter controlling which polymorph forms, and β-glycine is stable between 5 and 120 nm.

The crystals form in two steps. Firstly, nanoclusters form, then these clusters rearrange into crystals. β-glycine forms first because it has a lower interfacial energy, making it easier to create surfaces, and a lower nucleation barrier, so it forms faster. Overall, β-glycine is kinetically favourable. However, α-glycine has a lower bulk free energy and better packing. As crystals grow larger, they can rearrange into α-glycine, which is thermodynamically more stable. Under nanoconfinement, molecular rearrangement is restricted, preventing the formation of the more ordered α-phase and stabilising β-glycine.
This research is important because it shows how to precisely control which crystal form a material takes using nanoscale confinement, rather than relying on trial and error methods. It also provides a general strategy for stabilising metastable but functional materials, with potential applications in sensors, energy harvesting, and advanced functional materials.

Read the full article

Electric-field-driven nanoconfinement and the 5–120 nm stability regime of piezoelectric β-glycine

Kexin Zhang and Zhengbao Yang 2026 Rep. Prog. Phys. 89 058001

Do you want to learn more about this topic?

Physical properties and atomic arrangements in crystals by W A Wooster (1953)

The post Controlling glycine polymorphs through nanoconfinement appeared first on Physics World.

‘Back to the future’ messages are more efficient

3 July 2026 at 09:26

Science fiction has long embraced the idea of travelling backward in time, but the advent of Einstein’s general theory of relativity transformed these ideas from fantasies into potential – albeit contested – realities. In particular, solutions to the equations of general relativity known as closed time-like curves (CTCs) seem to allow a system’s trajectory to return to a previous point in time. Although the existence of CTCs has never been proven, their admissibility within general relativity has inspired many physicists to study their implications, which include increases in information processing speeds as well as retrograde time travel.

Inspired by the 2014 film Interstellar, in which a father sends messages to his daughter in the past, Kaiyuan Ji and Mark Wilde of Cornell University, together with Seth Lloyd at the Massachusetts Institute of Technology, have now investigated the potential advantages of a retrograde messaging channel based on a CTC. As well as deriving an exact expression for the information capacity of such a channel, they showed that this capacity exceeds that of regular channels that do not involve backward time travel.

Post-selected CTC models

To model their CTC, the researchers used an approach that Lloyd and his then-collaborators developed 15 years ago. This approach exploits the mathematical equivalence between a CTC and the combined operations of quantum teleportation and post selection, so it is often referred to as a post-selected CTC model. Previous analyses established that this model disallows time-travel paradoxes such as going back in time to kill your grandfather, while still preserving correlations between the system that travels backward in time and the environment.

The latter feature is important, Ji notes, because quantum CTC models without it have a distinct drawback: “If you travel through that closed time-like curve, you end up in the past, but basically you lost all the memory of what has happened before you do time travel,” he explains.

A further advantage of the team’s chosen model is that it does not prohibit causal loops in which correspondents in the past and future influence each other. To return to the Interstellar scenario, Ji explains that while the daughter is influenced by her father’s message, she also influences her father, because he witnessed how she decoded the message and therefore used that information to optimize his encoding protocols.

The existence of causal loops in the model allowed Ji and his colleagues to formulate an expression for the channel’s bit capacity. It also pointed towards the best way of maximizing that capacity. The optimal strategy, Ji explains, would involve the father using his memory from the past when encoding his message to the past, which makes sending messages to the past more efficient (and capable of a higher bit capacity) than sending messages to the future. “The causal loop is essential to the design of the optimal communication protocol in this retro causal communication setting,” he tells Physics World. “It is not possible in standard communication from the past to the future.”

Capacity for messages

The CTC can also be used to form a quantum channel capable of transmitting either regular classical data or quantum data back in time. Using their expression for the channel’s bit capacity, the researchers were able to show that its classical bit capacity is twice that of its quantum counterpart.

Nicole Yunger Halpern, a theoretical physicist at the University of Maryland who has studied some implications of CTCs for metrology but was not involved in the current work, describes the research as “creative and technically impressive”. She points out that while calculating a communication channel’s capacity is a common challenge in the field of information theory, obtaining straightforward answers can be difficult. “The authors combined this workaday task with a highly unusual (retrocausal) setting and, moreover, obtained a simple solution,” Halpern says.

Not everyone is sold on the mathematical format of post-selected CTC models, though. Scott Aaronson, a computer scientist at the University of Texas at Austin, US, who has previously studied the speed advantages of information processing using CTCs, believes that studies with this approach “attempt to model time travel but don’t fully succeed at it”. However, with respect to the question of channel capacity, Aaronson concedes it may be “interesting to prove things”.

While the current model considered the effects of distortion (“noise”) on messages in the channel, Ji suggests it might be interesting to broaden this to include noise in the memory of the process – like the father in Interstellar having a hazy recall of his daughter’s decoding protocol. Ji also notes that the post-selection CTC model has some mathematical equivalence with black hole final state projections, and he says it might be interesting to explore these connections, too.

The research is described in Physical Review Letters.

The post ‘Back to the future’ messages are more efficient appeared first on Physics World.

Can surplus renewable power make green hydrogen cheaper?

1 July 2026 at 08:50

Electricity grids need to be carefully balanced, with too low levels of electricity leading to blackouts and too high levels causing damage to grids. Due to the intermittent nature of renewable energy sources such as solar and wind, it is possible for specific regions (e.g. the north of Germany) to have an excess of electricity, while the power lines do not have enough capacity to transport it to higher demand regions such as cities and industrial areas. This is known as a grid bottleneck. To keep the grid running properly, operators redispatch electricity by reducing renewable feed-in in oversupplied areas and increasing generation elsewhere. However, this leads to renewable energy being wasted, and because producers are still compensated and generation increase on demand is costly, it is financially inefficient.

In 2024, Germany created regional redispatch markets so that renewable electricity that would otherwise be curtailed can instead be sold locally. This is particularly useful for hydrogen producers because they do not require a continuous supply of electricity. Because they can operate flexibly, turning on and off depending on electricity availability, they can take advantage of very low-priced electricity. In this work, the researchers ask whether using this electricity source makes producing green hydrogen cheaper and how market prices for otherwise curtailed renewable electricity affect this.

They found that using only redispatch electricity is not cost-effective because of its unreliability. However, combining it with different renewable energy sources does reduce costs. Depending on hydrogen storage costs, using redispatch electricity can reduce hydrogen production costs by €0.9 – €1.96 per kg, if the redispatch electricity is available for 0 €/MWh, compared to typical costs of around €6-8 per kg without redispatch electricity.

Increased redispatch prices reduce the potential for production cost reductions, which, combined with the unreliability of redispatch availability, lowers the incentive for
system beneficial electrolyser siting within the regional market areas. Therefore, the success of these markets depends heavily on keeping prices low, which might necessitate effective price capping but could increase green hydrogen competitiveness and simultaneously decrease renewable energy curtailment.

Read the full article

Negative redispatch power for green hydrogen production: game changer or lame duck? A German perspective

J Brandt et al 2026 Prog. Energy 8 025006

Do you want to learn more about this topic?

Metrics for assessing the economic impacts of power sector climate and clean electricity policies John Bistline (2021)

The post Can surplus renewable power make green hydrogen cheaper? appeared first on Physics World.

How can you fast-forward a quantum simulation?

1 July 2026 at 08:48

Quantum computers promise to simulate physical systems far beyond the reach of classical machines. But even quantum algorithms face fundamental limits: no fast-forwarding theorems. These say that if you want to simulate a system for longer, the computational effort increases at least in proportion.

In many real algorithms, the situation is even worse than the ideal case. This is because the requirements of accuracy and runtime compound one another, so that running longer and running precisely become entangled and costly together.

In their new study, a team of researchers from Beijing and Hong Kong showed that this link between time and cost is not as rigid as it seems, at least for a broad class of realistic systems that interact with their surroundings. These so‑called open quantum systems are described by Lindbladian dynamics, which include both ordinary evolution and the effects of noise or dissipation.

In earlier approaches, improving the accuracy of a simulation made long-time calculations much more demanding, because the two effects multiplied together. The new method separates these contributions, so that the cost of simulating longer times does not automatically amplify the cost of achieving accuracy. In practical terms, this means that extending a simulation in time becomes far more manageable than before.

An even more surprising result appears when the dissipative processes in the system have a particular structure common in quantum physics. In these cases, the number of sequential computational steps needed grows only very slowly as the simulated time increases. Instead of needing proportionally more effort to simulate longer dynamics, the algorithm can effectively skip ahead, compressing what would normally be a long sequence of steps into a much shorter one. This fast‑forwarding is a dramatic departure from the usual expectation that longer simulations must always take longer to run.

The team also demonstrated how these ideas can be applied to studying thermal properties of quantum systems. These are essential for understanding matter at finite temperature. Such calculations are especially challenging at low temperatures, where lots of interesting physics often occurs. By exploiting their more favourable scaling, the new approach can extract certain thermal properties more efficiently, making it easier to probe regimes that are typically hard to access.

Beyond the specific application of this advance itself, the work highlights an important shift in perspective. Rather than focusing only on the worst‑case limits imposed by general theorems, it shows that carefully chosen physical structure can loosen those limits. Only time will tell what the implications for quantum simulation and computation will be in the future.

Read the full article

Exponential Lindbladian fast forwarding and exponential amplification of certain Gibbs state properties – IOPscience

Zhong-Xia Shang et al 2026 Rep. Prog. Phys. 89 057602

The post How can you fast-forward a quantum simulation? appeared first on Physics World.

Observation of top-antitop quark excess

1 July 2026 at 08:46

Top quarks are the heaviest known elementary particles. They are produced in pairs with their antiparticle equivalent, the antitop quark. Researchers at the Large Hadron Collider (LHC) smash protons together at extremely high energies in the hope of producing these top-quark pairs. The minimum energy required to create a pair is known as the production threshold (approximately twice the top mass). Near this threshold, the particles move relatively slowly and, because of the strong nuclear force, they may briefly interact strongly enough to form a quasi-bound state before each top quark decays individually.

In this work, researchers used a huge dataset collected with the ATLAS detector at the LHC. Top quark pairs decay far too quickly to be observed directly, so the ATLAS team instead studied their decay products. A top quark usually decays into a W boson and a b-quark, while the antitop quark decays into the corresponding antiparticles. The W bosons then decay further, either through leptonic decay (producing an electron, muon or tau plus a neutrino) or through hadronic decay, which produces jets of particles.

The ATLAS analysis focuses on the case where both W bosons decay leptonically into electrons and muons and reconstructs the invariant mass of the system using the energy and momentum of the decay products.

If non-relativistic QCD effects are included, the event rate near threshold is expected to be higher than that predicted by standard perturbative QCD alone, due to contributions such as the formation of quasi-bound states that are not accounted for in the perturbative framework. The analysis also employs spin-correlation observables to enhance the sensitivity to the unique spin structure of the phenomena. If non-relativitic QCD effects occur near the production threshold, including the formation of quasi-bound states, physicists expect to see an excess of events concentrated at masses close to the minimum energy needed to produce the pair.

The researchers observed significantly more events near the production threshold (∼345 GeV) than standard QCD calculations predicted, confirming a previous similar measurement by the CMS collaboration. The excess matches predictions from non-relativistic QCD that the top and antitop quarks briefly perform non-relativistic QCD interaction, including the formation of quasi-bound states, before separating and decaying. This is important because it provides strong evidence for a subtle quantum effect of the strong force and improves our understanding of top-quark behaviour in an extreme regime. This measurement underscores the capacity of LHC experiments at the precision frontier, reinforcing the vital interplay between theory and experiment in these precision studies.

“This is a very exciting finding that pushes our current understanding of top quark physics and its modelling to the extreme. It has only been made possible by recent efforts to connect quantum information theory and collider physics.” – Yoav Afik, an ATLAS physicist affiliated with the Enrico Fermi Institute at the University of Chicago

“With the newly collected Run 3 dataset, which is more than twice as large as the Run 2 dataset used in this first analysis, we will be able to scrutinize this excess in much greater detail and determine whether it can be described solely by non-relativistic QCD effects, or whether there is something more to it.” – Baptiste Ravina, a Senior Research Fellow at CERN

Do you want to learn more about this topic?

Towards the identification of new physics through quark flavour violating processes by Andrzej J Buras and Jennifer Girrbach (2014)

The post Observation of top-antitop quark excess appeared first on Physics World.

Independent linac commissioning matters for radiotherapy

25 June 2026 at 14:03

Radiation therapy is an essential component of cancer care and is used in the treatment of roughly half of all cancer patients. To ensure that these treatments are both safe and effective, it’s critical that the linear accelerators, or linacs, that deliver the radiation are as reliable, efficient and accurate as possible.

The US-based medical physics consultancy One Physics aims to help hospitals and cancer centres meet these goals by bringing together a team of highly-trained expert medical physicists to provide a wide range of radiotherapy and diagnostic imaging physics services.

This episode of the Physics World Weekly podcast features James Giltz, director of commissioning services at One Physics. In a wide-ranging conversation with Physics World’s Tami Freeman, Giltz explains how the company provides comprehensive medical-physics support for radiotherapy – from planning new centres through to ongoing clinical operations.

This podcast is sponsored by One Physics.

The post Independent linac commissioning matters for radiotherapy appeared first on Physics World.

‘Superallowed’ alpha decay seen for the first time

25 June 2026 at 09:28

Physicists headed up by a team at the University of Tennessee, Knoxville, and the Radioactive Isotope Beam Factory (RIBF) at RIKEN in Japan say they have measured the alpha decay of tellurium-104 for the first time. The feat could help us better understand how alpha particles form inside atomic nuclei, which is one of the least understood problems in nuclear science.

Alpha radioactivity was discovered over 125 years ago and it is the process whereby an atomic nucleus emits an alpha particle, which is a helium nucleus consisting of two protons and two neutrons that are strongly bound. The alpha particle exits the nucleus by quantum-mechanical tunnelling through the energy barrier surrounding the nucleus. While this model broadly explains the lifetimes of radioactive nuclei, a big question remains, however, says study lead Robert Grzywacz at the University of Tennessee, Knoxville. This is: how do alpha particles form in the nucleus and where can they exist as “pre-formed” structures inside it before they leave?

Tellurium-104 is particularly suited to studying alpha radioactivity, he says, because it is predicted to have the highest chance of pre-forming alpha particles of all heavy nuclei. “Such a strong enhancement of preformation shouldn’t be possible in theory because the matter in heavy nuclei is uniformly distributed,” Grzywacz explains. “There must, therefore, be an extra mechanism that causes alpha particles to locally ‘clump’ or ‘cluster’.”

In their experiments, he and his colleagues set about measuring the alpha particles produced by tellurium-104. This was no easy task because this isotope of tellurium can only be observed during the decay of xenon-108, which itself is extremely difficult to make in the laboratory.

Pulses of alpha particles

The researchers did their work at Japan’s RIKEN accelerator complex, which consists of four coupled cyclotrons that accelerate a beam of  xenon-124 onto a beryllium production target. The collisions between the two produces xenon-108 and then tellurium-104. The tellurium-104 finally decays into tin-100.

Grzywacz and co-workers say they succeeded measuring pulses of alpha particles produced in short succession by the tellurium-104. They measured the half-life of the radioisotope as being 7.2 ns, which is the shortest known alpha decay half-life for alpha particle emission from a heavy nucleus. More importantly, when corrected for the tunnelling effect – using a parameter known as the reduced width, which separates quantum tunnelling from inherent alpha particle emission from the nucleus – they were able to confirm that the probability of an alpha particle pre-forming in the nucleus was much higher than expected from theory calculations.

The possibility that tellurium-104 could show such “superallowed” alpha decay was first put forward more than 60 years ago, but it has been impossible to observe experimentally, says Grzywacz. “We started our search for this decay more than 20 years ago at Oak Ridge National Laboratory and later at JAEA in Tokai (Japan). We proposed the present experiment in 2018 at RIKEN but because of the covid-19 pandemic, we had to repeat the proposal in 2022. The experiment was deemed to be of ‘very high priority’ and we performed our experiments almost exactly two years ago, in June 2024.”

The work, which is detailed in Nature, will be important for understanding how alpha particle form in nuclei and will push the theory to explain where and how nuclear cluster can form, says Grzywacz. “More than 300 nuclei – and importantly, almost all superheavy nuclei – decay via alpha particle emission. Lighter nuclei may also naturally form ‘alpha condensates’, but in heavier nuclei, it is not obvious how this happens.”

Grzywacz told Physics World that he and his colleagues will now need to measure alpha particle energies with better precision in order to constrain the preformation they have observed.

The post ‘Superallowed’ alpha decay seen for the first time appeared first on Physics World.

Can we create a shield to protect Earth from solar storms?

24 June 2026 at 15:00

An artificial buffer composed of a photoionizing material released into space at the edge of Earth’s magnetic field could hold off powerful solar storms that potentially pose a risk to modern civilization.

The plan to put a buffer in place is called StormWall, proposed by space plasma dynamicist Brian Walsh of Boston University, and Dan Welling and Zhenguang Huang of the University of Michigan.

Solar storms are triggered when a coronal mass ejection (CME) on the Sun launches a vast cloud of charged particles towards us. If this cloud hits us, the charged particles can overwhelm Earth’s magnetic field. Magnetic reconnection, the process of magnetic-field lines snapping under pressure from the solar storm and joining back together, inputs much of the CME’s energy into Earth’s magnetosphere, where it can make its way down to the surface via charged particles stored in Earth’s radiation belts.

“Magnetic reconnection is the gateway by which energy comes from the Sun into Earth’s space environment,” Walsh tells Physics World.

The efficiency with which magnetic reconnection accomplishes this is governed by the magnetic field’s strength and direction, plus the density of plasma – ionized atoms and molecules – in Earth’s magnetosphere. The stronger the field strength and the lower the plasma density, the more energy reconnection deposits on the Earth.

Bolstering our defences

Although we cannot change the magnetic-field strength, “we can increase the plasma density by depositing material into space that can be photoionized,” says Walsh.

Nature already does this to a modest extent. Atoms and molecules leak from the upper atmosphere and are photoionized by solar ultraviolet light. This involves knocking an electron off an atom or molecule, thereby giving it an electric charge that allows it to interact with the magnetic field. The ionized materials follow natural “drift paths” along magnetic-field lines to the edge of the magnetosphere.

StormWall intends to bolster these natural defences by adding large quantities of material. In their work, Walsh, Welling and Huang suggest that a group of six spacecraft placed in geosynchronous orbit and each carrying the equivalent of a dozen fuel tankers’ worth of material would provide enough of a shield to ward off a solar storm. However, Walsh says that ultimately a greater number of smaller spacecraft might be more efficient.

“There is an economy of scale and the potential for international collaboration when the number of spacecraft becomes bigger,” he says. “The beautiful thing is that there’s not a lot of complicated technology in it.”

The key component is the material, and Walsh and his team have looked at a range of materials, particularly alkalines such as lithium and sodium.

“The most important thing is that it has to photoionize relatively quickly, and alkaline materials are great for that,” says Walsh, who highlights salt water, which is rich in sodium, as one possibility.

Simulations indicate that such a plasma buffer could cut the intensity of a solar storm by half as the bulk of the solar plasma is diverted around us, in the same way that stream-water flows around a stone.

Expensive problems

StormWall would not be a perfect solution. For one thing, it would be mightily expensive to launch – Walsh’s estimate is in the same region as the $4 billion Artemis II mission, maybe a little less. Furthermore, StormWall is a one-shot deal. After the photoionizing material is released, the space tankers will be left dry and more spacecraft will have to be launched to replace them.

StormWall would also require perfect timing. The photoionizing material would only remain in Earth’s magnetosphere for about six hours before dissipating into space. Releasing it at the right time to coincide with the arrival of the CME is paramount. This would require consistent accuracy in predicting space weather, which would be dependent on better modelling and more spacecraft observing the Sun in stereo so that CMEs can be tracked.

Walsh’s team is currently exploring ways to bring the cost down and make the process more efficient, such as a staged release of material that lasts longer in the magnetosphere, or a more suitable orbit that enables a more targeted release of material.

The Carrington Event revisited

In 1859, a solar storm of such ferocity hit Earth that it prompted telegraph wires to catch fire from the energy that it dumped into electrical systems. This storm is known as the Carrington Event and, if it took place today, the total damage could exceed $2.4 trillion. Our entire modern way of life, revolving around electrical grids, data centres, banking systems, the Internet, satellite GPS and communications, would be affected. Following the powerful solar storms of May 2024, which saw the Northern Lights visible for several nights as far south as the Bahamas and the Canary Islands, the cost to farmers in the US alone who lost GPS signal for their precision tractor farming was at least $500 million. So while several billion dollars to launch StormWall is expensive, the cost of not launching could be far higher, argues Walsh.

Unfortunately, Walsh does not see a great deal of movement from governments or businesses to try and protect ourselves.

“There is a very small United Nations group that thinks about this, but there’s little action,” says Walsh. “In 2018 the US’s Department of Homeland Security reported on the most likely threats that we are not paying attention to. Number one was a pandemic, and number two was a solar storm.”

With private companies now owning more assets in space than governments, the onus is increasingly on both billionaires and politicians to take pre-emptive action to mitigate the effects of a catastrophic solar storm.

“We are vulnerable, but StormWall would be in a good position to do something about it,” says Walsh.

Walsh, Welling and Huang report their proposal in Space Weather.

The post Can we create a shield to protect Earth from solar storms? appeared first on Physics World.

Water use in green hydrogen production

23 June 2026 at 10:09

Proton Exchange Membrane Water Electrolysis is a method to split water into its components, hydrogen (H₂) and oxygen (O₂), using electricity typically sourced from renewables. It is one method for producing so-called green hydrogen. Key benefits are that it can easily start and stop, fitting well with fluctuating renewable energy sources; it produces high purity hydrogen suitable for fuel cells and industrial use; and it has a smaller carbon footprint than some alternatives.

This work explores how much water is used in Proton Exchange Membrane Water Electrolysis, which is significant in regions with low water availability, where hydrogen plants could stress supplies. The researchers looked at all lifecycle stages: manufacturing (building the electrolyser and producing materials), operation (water splitting, cooling, and purification), and end-of-life (disposal or recycling).

Electric Hydrogen’s 100MW PEM electrolyser plant utilizing dry cooling at Infinium’s Project Roadrunner e-SAF facility in Pecos, Texas (USA).
Electric Hydrogen’s 100MW PEM electrolyser plant utilizing dry cooling at Infinium’s Project Roadrunner e-SAF facility in Pecos, Texas (USA). The project reached financial investment decision in May, 2025 and is planned for 2027 commercial operation. (Courtesy: Parikhit Sinha/Electric Hydrogen Co.)

Their main conclusion was that most water use occurs during the operational phase, where the greatest opportunity to save water lies. Dry cooling uses much less water than wet cooling, reducing consumption by about a factor of three. In a best-case scenario with dry cooling, about 13 litres of water per kg H₂ is used, of which around 3.5 litres is lost in water treatment. This loss can be reduced by about 50% using a brine recovery system, depending on location and infrastructure.

Proton Exchange Membrane Water Electrolysis has a similar lifecycle water use to fossil hydrogen production, therefore switching to green hydrogen does not significantly increase water demand. Although hydrogen plants use comparable water to agriculture (e.g. corn farming), they generate much higher economic value per unit of water (~700×), making them an efficient use of water.

This research is significant because it shows that while green hydrogen can reduce carbon emissions, its water use must be carefully managed to ensure it is sustainable at scale.

Read the full article

Addressing water usage challenges for electrolyzer operations in arid areas

Parikhit Sinha et al 2026 Prog. Energy 8 025005

Do you want to learn more about this topic?

Research and development of hydrogen carrier based solutions for hydrogen compression and storage Martin Dornheim et al. (2022)

The post Water use in green hydrogen production appeared first on Physics World.

❌