For the first time, scientists have measured metal pollutants leaching from a piece of space junk in the atmosphere. They caught a burst of lithium as a SpaceX rocket burned up high above Earth’s surface. Such pollutants can damage the ozone layer and may impact global climate.
Humans have been launching metal things into orbit around Earth for nearly 70 years. But the pace of launches has skyrocketed in the past decade. And private companies plan to boost the number of launches in the near future. Consider SpaceX’s Starlink system. This system provides internet to far-flung places. It will eventually consist of more than 40,000 satellites. Already, nearly 10,000 Starlink satellites orbit Earth.
Each piece of Starlink equipment has a planned life of about five years. After that, the satellite burns up in the upper atmosphere. This releases metals. They include lithium, aluminum and copper. Those metals may speed up chemical reactions that destroy ozone. That’s a problem, because the ozone layer of Earth’s atmosphere protects life on Earth from getting too much ultraviolet (UV) light from the sun.
Metal pollution from space junk may also affect Earth’s climate. Such metals could change the balance of light that reaches the ground or gets bounced back to space.
The stratosphere is the layer of the atmosphere that extends from 14 to 64 kilometers (9 to 31 miles) above Earth. A 2023 study found that about 10 percent of particles there contain pollutants from burnt-up satellites and rocket parts.
This diagram shows different layers of the atmosphere. The breakup of meteors forms natural metal layers. But space junk can also cause pollution in the upper atmosphere that may mess with the ozone layer. R. Wing et al/Communications Earth & Environment 2026
Scientists wanted to see if they could directly trace such particles to a piece of space debris. They got their chance on February 19, 2025. That day, the researchers observed a cloud of lithium about 100 kilometers (60 miles) above Germany. It was blowing away from the upper stage of a Falcon 9 rocket. This rocket part contains fuel and an engine. The rocket part made a fireball as it broke apart over Ireland and the United Kingdom.
“A few hours after the reentry of this rocket, we could see 10 times more lithium than we would have observed otherwise,” says Claudia Stolle. She’s a meteorologist at the Leibniz Institute of Atmospheric Physics. That’s in Germany.
The measurements relied on lidar. Lidar sends out laser pulses and detects the light that bounces back. The laser light is tuned to specific wavelengths that reflect off particular materials, such as lithium.
The team also ran computer models of the atmosphere. These showed that the wind had carried the lithium from the spot where the rocket came down to the area over Kühlungsborn, Germany. That’s where the lidar was located.
The researchers shared their findings February 19. The work appeared in Communications Earth and Environment.
The technique could help monitor potential harms from space debris. Meteorites — space rocks that fall to Earth — bring metals into the atmosphere. But falling space junk may one day boost metal pollution by around 40 percent, Stolle’s team estimated. Tracking such contaminants and their effects will become increasingly important.
More companies and countries are planning to launch satellites into orbit, Stolle notes. “All of them will burn up sooner or later.”
Leaching lithium
R. Wing et al/Communications Earth & Environment 2026
Using a technique called lidar, researchers in northern Germany caught a burst of lithium in the upper atmosphere. The lithium came from a piece of a Falcon 9 rocket. Carried by the wind, the lithium spread from one point to a wider area. This type of spread is called a plume. The figure on the left is a heat map. It shows the density of lithium (per cubic centimeter) at different altitudes over time (shown in local German time). The plot on the right shows the lithium density at different altitudes at 1:30 a.m. on February 20. The amount of lithium is higher in the center of the plume and lower at the plume’s edges.
Data Dive:
Look at Figure A. When did the density of lithium increase?
What was the altitude of the lithium plume?
What was the lithium density at the center of the plume?
Look at Figure B. How tall was the plume, top to bottom, at 1:30 a.m. on February 20?
If the data continued recording after 2:00 a.m. on Feb 20, what would it likely look like?
fjo3 shares a report from the AFP: The latest heatwave sweeping across Europe is a stark reminder that it is the world's fastest-warming continent, stretching into an Arctic that is heating at an even greater pace. Britain, France, Italy and Spain have issued red alerts and health warnings for much of their territory this week as the region endures its second heat episode since May.
Here is a look at why Europe is warming faster than elsewhere: The planet as a whole is around 1.4C warmer than in preindustrial times, defined as 1850-1900. By comparison, Europe is around 2.4C hotter than the preindustrial era, according to the EU's Copernicus Climate Change Service. The long-term rise in global average temperatures is mainly due to greenhouse gas emissions from burning oil, gas and coal, but it varies by regions due to a combination of factors. Land warms faster than the ocean as water can absorb more heat and cool through evaporation.
Shifts in atmospheric circulation have driven more frequent and more intense heatwaves in the European summer, according to Copernicus. High-pressure systems, which bring settled weather and higher temperatures, have become more common in Europe, Copernicus director Carlo Buontempo said. [...] Another major reason is geography as Europe is connected to the Arctic, which is 3.2C warmer than in preindustrial times. The region's rising temperatures are partly due to a process known as the albedo feedback. Bright snow and ice reflect much of the sun's heat back into space, but as they melt they reveal darker, heat-absorbing surfaces such as land and the ocean.
In other parts of Europe, areas where snow was very frequent in winter have seen this coverage shrink, exposing dark land. Stricter air quality regulations have reduced aerosol emissions since the 1980s. But tackling the pollutant had the side effect of contributing to global warming, as these tiny airborne particles have a cooling effect by reflecting sunlight and making clouds more reflective.
Earth's oldest known impact crater formed when a meteorite slammed into what is now Australia about 3 billion years ago — 470 million years later than scientists previously claimed, a new study suggests.
The impact crater, known as the North Pole Dome crater, is located in Western Australia's Pilbara region, which is home to some of the planet's oldest rocks. It remains a record-breaking structure, beating the world's next-oldest known meteorite impact crater — the Yarrabubba impact structure, also in Western Australia — by roughly 800 million years.
"While the site had previously been identified as an ancient impact structure, its exact age remained uncertain," study first author Chris Kirkland, a professor in the School of Earth and Planetary Sciences at Curtin University in Australia, said in a statement. "The impact left a 'mineral clock' behind. By dating minerals that were remade or newly grown in the damaged rocks, we can now pin down when this extraordinary event happened."
For the new study, Kirkland and his colleagues used advanced mineral dating techniques to estimate the ages of zircon, apatite, calcite and muscovite in shatter cones from the North Pole Dome crater. The researchers analyzed two samples of shatter-cone-bearing rocks, as well as a shocked quartz vein — a sheet-like deposit that typically forms when superhot, mineral-rich water circulates in the cracks between shocked rocks.
Researchers analyzed zircon and other minerals in North Pole Dome rocks. (Image credit: Curtin University)
"The key evidence comes from zircon, a tiny but extraordinarily resilient mineral that can keep geological time for billions of years," Kirkland said. "Some zircons at North Pole Dome have unusual branching, skeletal shapes. We interpret these as impact-modified crystals, formed when older zircon was disrupted, partly recrystallised, and in places regrown during the intense heating caused by the impact."
The age recorded in zircon was the same as that locked inside apatite minerals, giving the researchers confidence that the impact occurred a little more than 3 billion years ago. The younger shatter cones in the Science Advances study may have formed subsequently due to tectonic and thermal activity, the team wrote in the new paper, which was published Tuesday (June 23) in the journal Geology.
"Ancient impact craters are incredibly difficult to date because over billions of years, rocks are altered by heat, pressure and fluids, which can obscure or reset the original impact signals," Kirkland said. "The new age places the North Pole Dome structure as Earth's oldest known impact crater and the only recognised example from the Archean eon [4 billion to 2.5 billion years ago], a time when the planet's earliest continents were forming."
Planet Earth quiz: What do you know about our planet's most amazing features?
A massive wave of warm water is making its way across the Pacific Ocean as the newly declaredEl Niño gets into full swing, satellite images show.
The band, called a Kelvin wave, marks a swell of higher-than-average sea levels that stretches hundreds of miles along the equator. The anomaly is caused by warmer waters linked to El Niño — the warm phase of a natural climate pattern whose current iteration could become one of the strongest ever recorded.
The Sentinel-6 Michael Freilich satellite captured the deviations from average sea surface height on June 8. Red areas indicate higher sea surfaces than usual, while blue areas mark areas with lower surface heights.
Developed and launched in 2020 by NASA and the European Space Agency and operated by the European Organisation for the Exploitation of Meteorological Satellites (EUMETSAT), Sentinel-6 Michael Freilich measures changes in sea surface height down to fractions of an inch every 10 days.
The data complements measurements of sea surface temperature that have shown Pacific waters warming at unpreceded rates over the past several months, leading scientists to declare thestart of a new El Niño on June 11. When ocean water warms, it expands and takes up more space. That translates to an increase in the height of the water relative to the satellite and the center of Earth, which is then picked up by the satellite's sensitive equipment. At some points along the equator, sea surfaces are now more than 6 inches (15 centimeters) higher than usual.
Kelvin waves like this one form when winds in the western Pacific near the equator weaken and temporarily reverse, blowing from west to east instead of east to west. That lets warm water gradually build up in the east, deepening the layer of warm surface waters and preventing colder waters from rising from below. The wave has now reached the western coast of South America.
NASA hadalready observed a few other Kelvin waves this year, suggesting an El Niño event was soon to follow. In January, Sentinel-6 Michael Freilich detected one near Micronesia that dissipated around mid-February. Another emerged in March and elevated sea levels near Peru by mid-May.
Changes in sea surface temperature or height can alter atmospheric circulation patterns and affect the weather. El Niño often increases rainfall in the southwestern U.S., Colombia, Peru and Ecuador, while rainfall in the western Pacific tends to decrease. The most recent El Niño, which lasted from June 2023 to April 2024, boosted global mean temperatures that made 2024 the hottest year on record and the first to breach the 1.5 degrees Celsius (2.7 degrees Fahrenheit) warming limit — a guardrail set by the Paris Agreement beyond which the effects of climate change become more and more catastrophic.
The June 8 conditions in the western Pacific were similar to those that occurred 1997 during a particularly strong El Niño, according to astatement from NASA. 2026 has seen fewer Kelvin waves so far than 1997, but this year’s El Niño is still ramping up.
"For now, it looks like it's going to be a big one — more so than I would have said last week — but we still need more observations to know what's going to happen," Severine Fournier, a sea level researcher at NASA’s Jet Propulsion Lab, said in the statement.
How much do you know about our blue planet? Test your terran knowledge with our Earth quiz!
Taming Nature: Inside China's efforts to control the region's water
China is facing water scarcity that affects millions of people, so the country is embarking on water projects on a scale the planet has never seen. This three-part series investigates three elements of this effort: the world's biggest dam, a doomed effort to create a "river in the sky," and a colossal water transfer project.
China controls some of the largest rivers in Asia, experiences heavy rain and has vast stores of water locked in glaciers in the west. But despite these abundant resources, China has a water problem. While central and southern regions are quenched by massive rivers like the Yangtze, the northeastern megacities like Beijing and Tianjin have endured serious water scarcity as agriculture, industry and population size rapidly increased.
To address the imbalance, China has undertaken one of the biggest engineering projects in the world: rerouting the flow of one of the world's mightiest rivers and its tributary, and ferrying the water thousands of miles from the center and south of the country to the thirsty north.
Called the South-to-North Water Transfer Project (SNWTP), the vast system of canals, pipes, dams, reservoirs and pumps moves staggering amounts of water via two routes through central and eastern China.
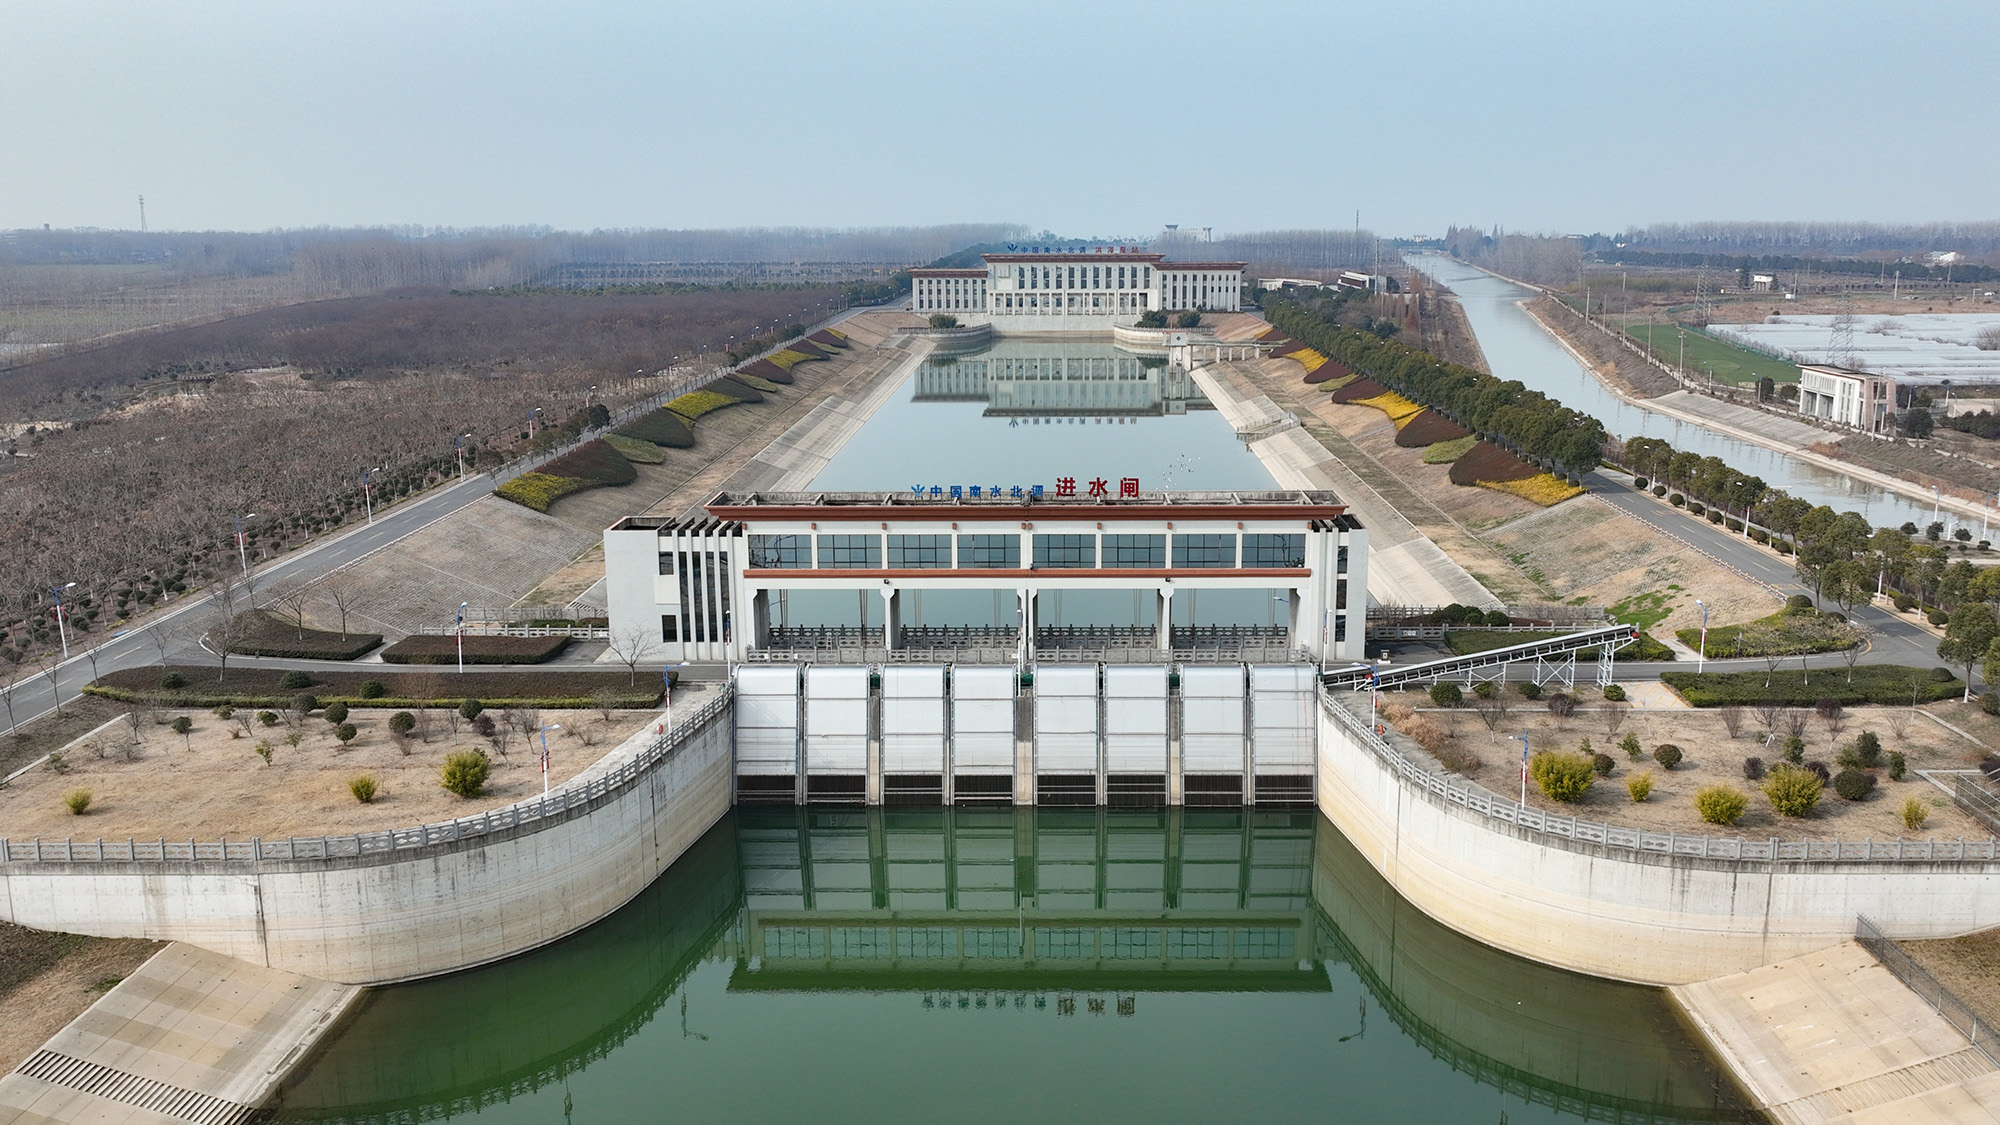
The Hongze Station on the eastern route of the South-North Water Transfer Project in Huai 'an City, China. (Image credit: CFOTO via Getty Images)
"It binds into a single network four major river basins, six provinces, three megacities, myriad bureaucracies, and more than 700 million people," Michael Webber, a professor emeritus in the School of Geography, Earth and Atmospheric Sciences at the University of Melbourne who specializes in regional economic development in China, wrote in a 2023 journal article.
But even this is not enough to satisfy the water needs in the North: China is currently expanding these routes and is planning a third, western route for the project, which would snake through the Tibetan Plateau before feeding the water-parched north and east. The route is attractive to Chinese officials because the river-and-glacier-threaded plateau, dubbed the Water Tower of Asia, has abundant water resources and is the source of numerous major rivers.
However, experts say the routes could worsen conditions in parts farther south that provide the water. What's more, the Tibetan portion of the project has stoked fears and suspicion in neighbors, as unofficial plans swirl suggesting major transboundary rivers could be diverted away from other countries and further into China.
The huge plan is "unbelievable," Mark Wang, a professor of human geography at the University of Melbourne, told Live Science. "The proposals [have] underestimated the negative impacts — environmental, earthquakes, evaporation and economic cost," as well as the international impacts, Wang added.
Water imbalance
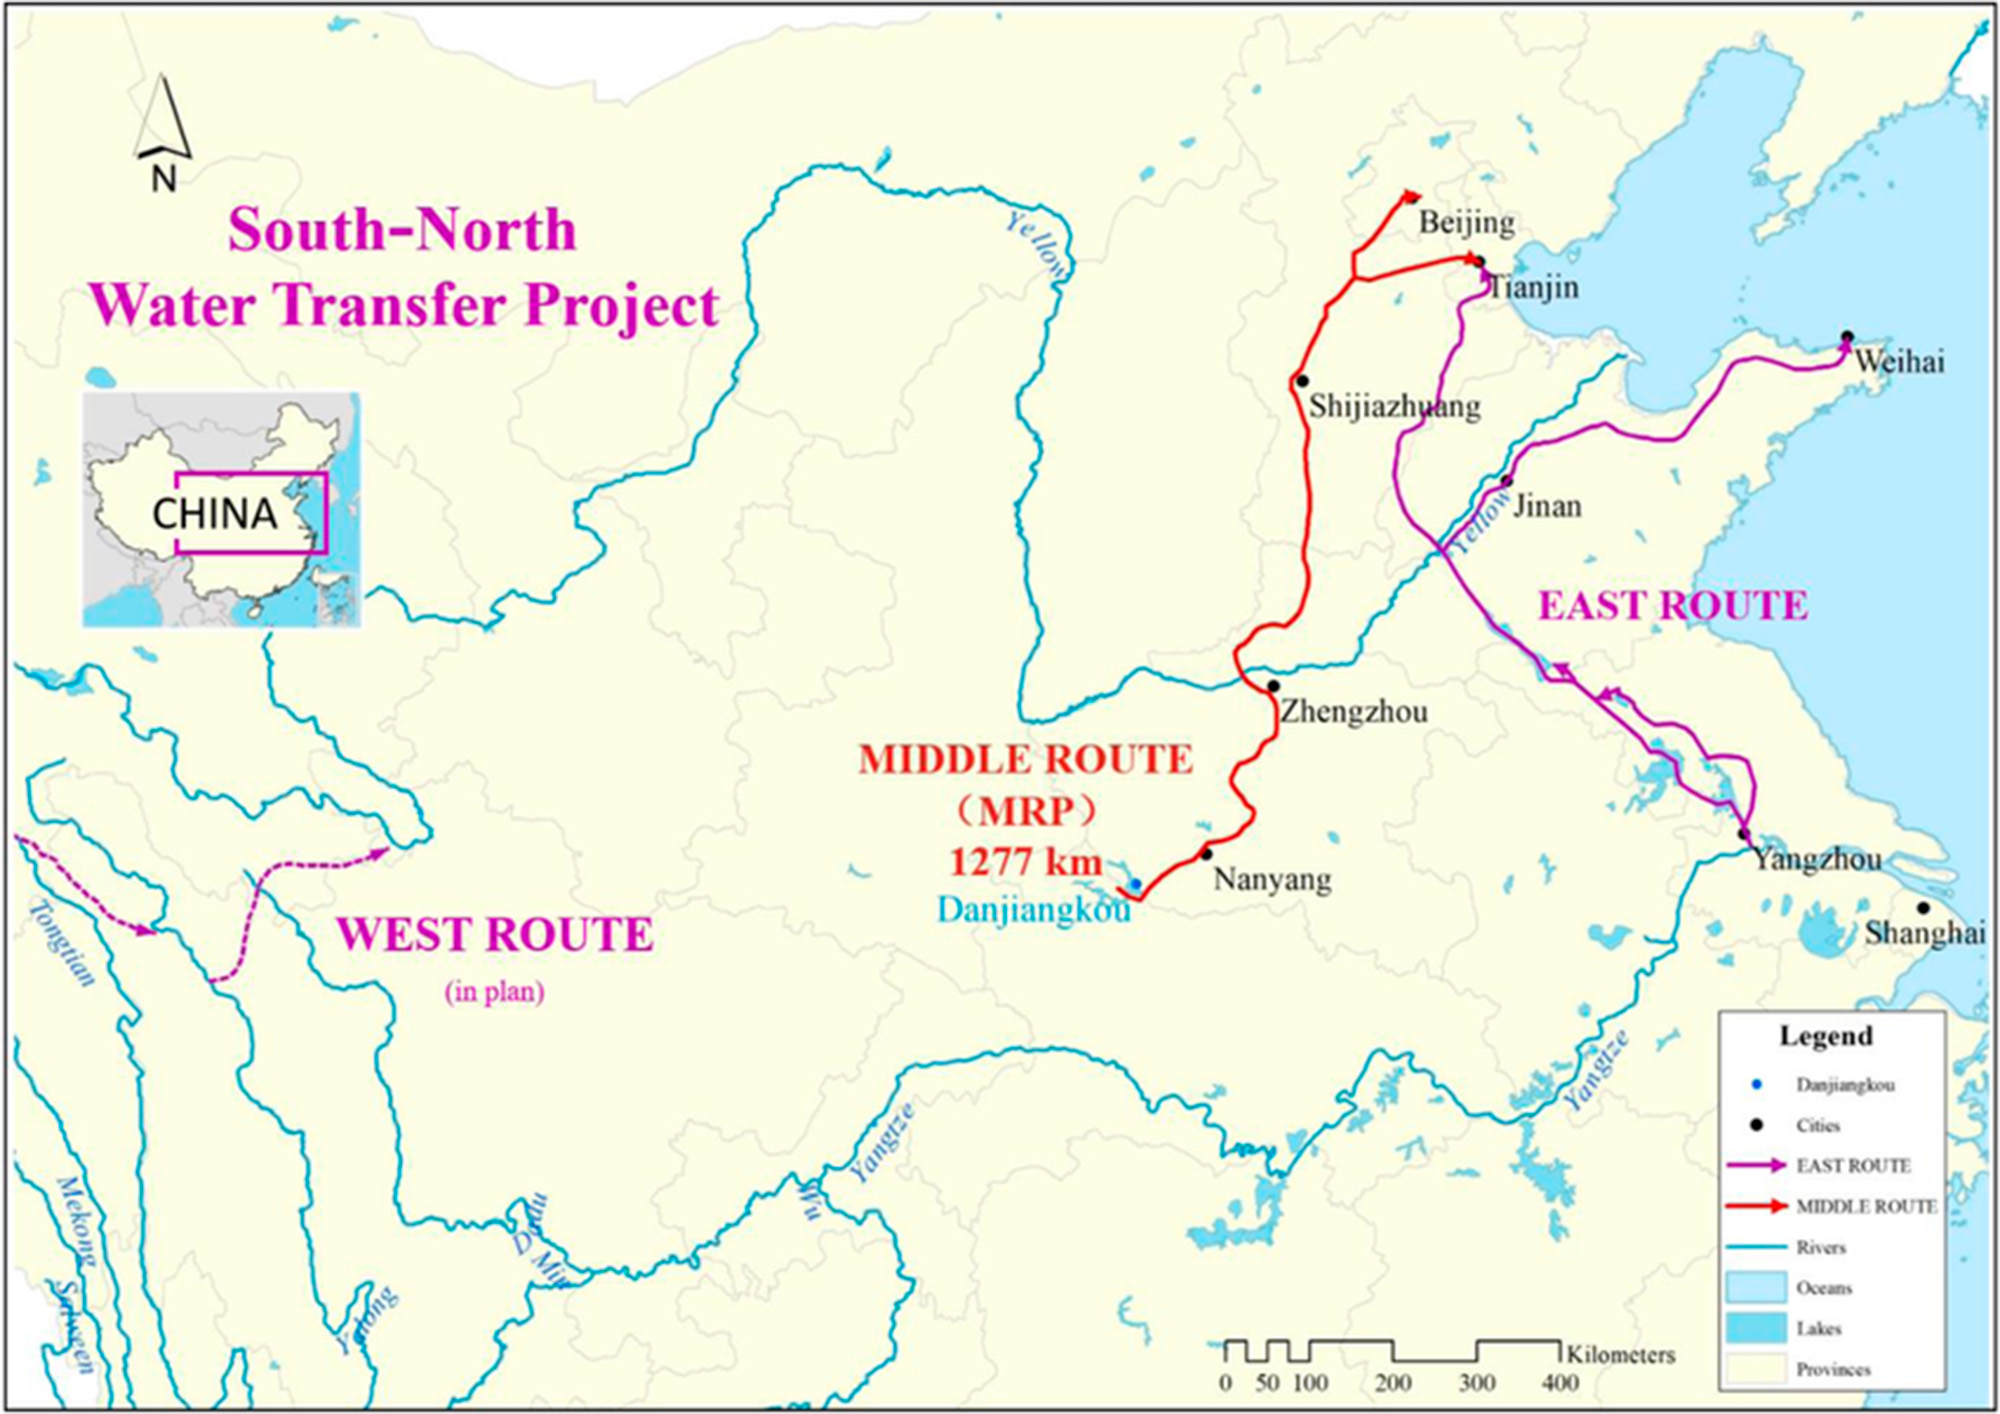
Construction of the SNWTP began in 2002. The eastern route has operated since 2013 and transports water from the mighty Yangtze from Yangzhou, near Shanghai, to the megacity Tianjin, which has a population of 15 million people. The central route, which goes from Danjiangkou to Beijing and Tianjin, began flowing the following year, carrying water from the Han River, or Hanjiang. Together, they have moved 21 cubic miles (88 cubic kilometers) of water more than 1,800 miles (2,900 kilometers) since they began operating, according to the Chinese government — more than double the maximum amount of water held in Lake Mead.
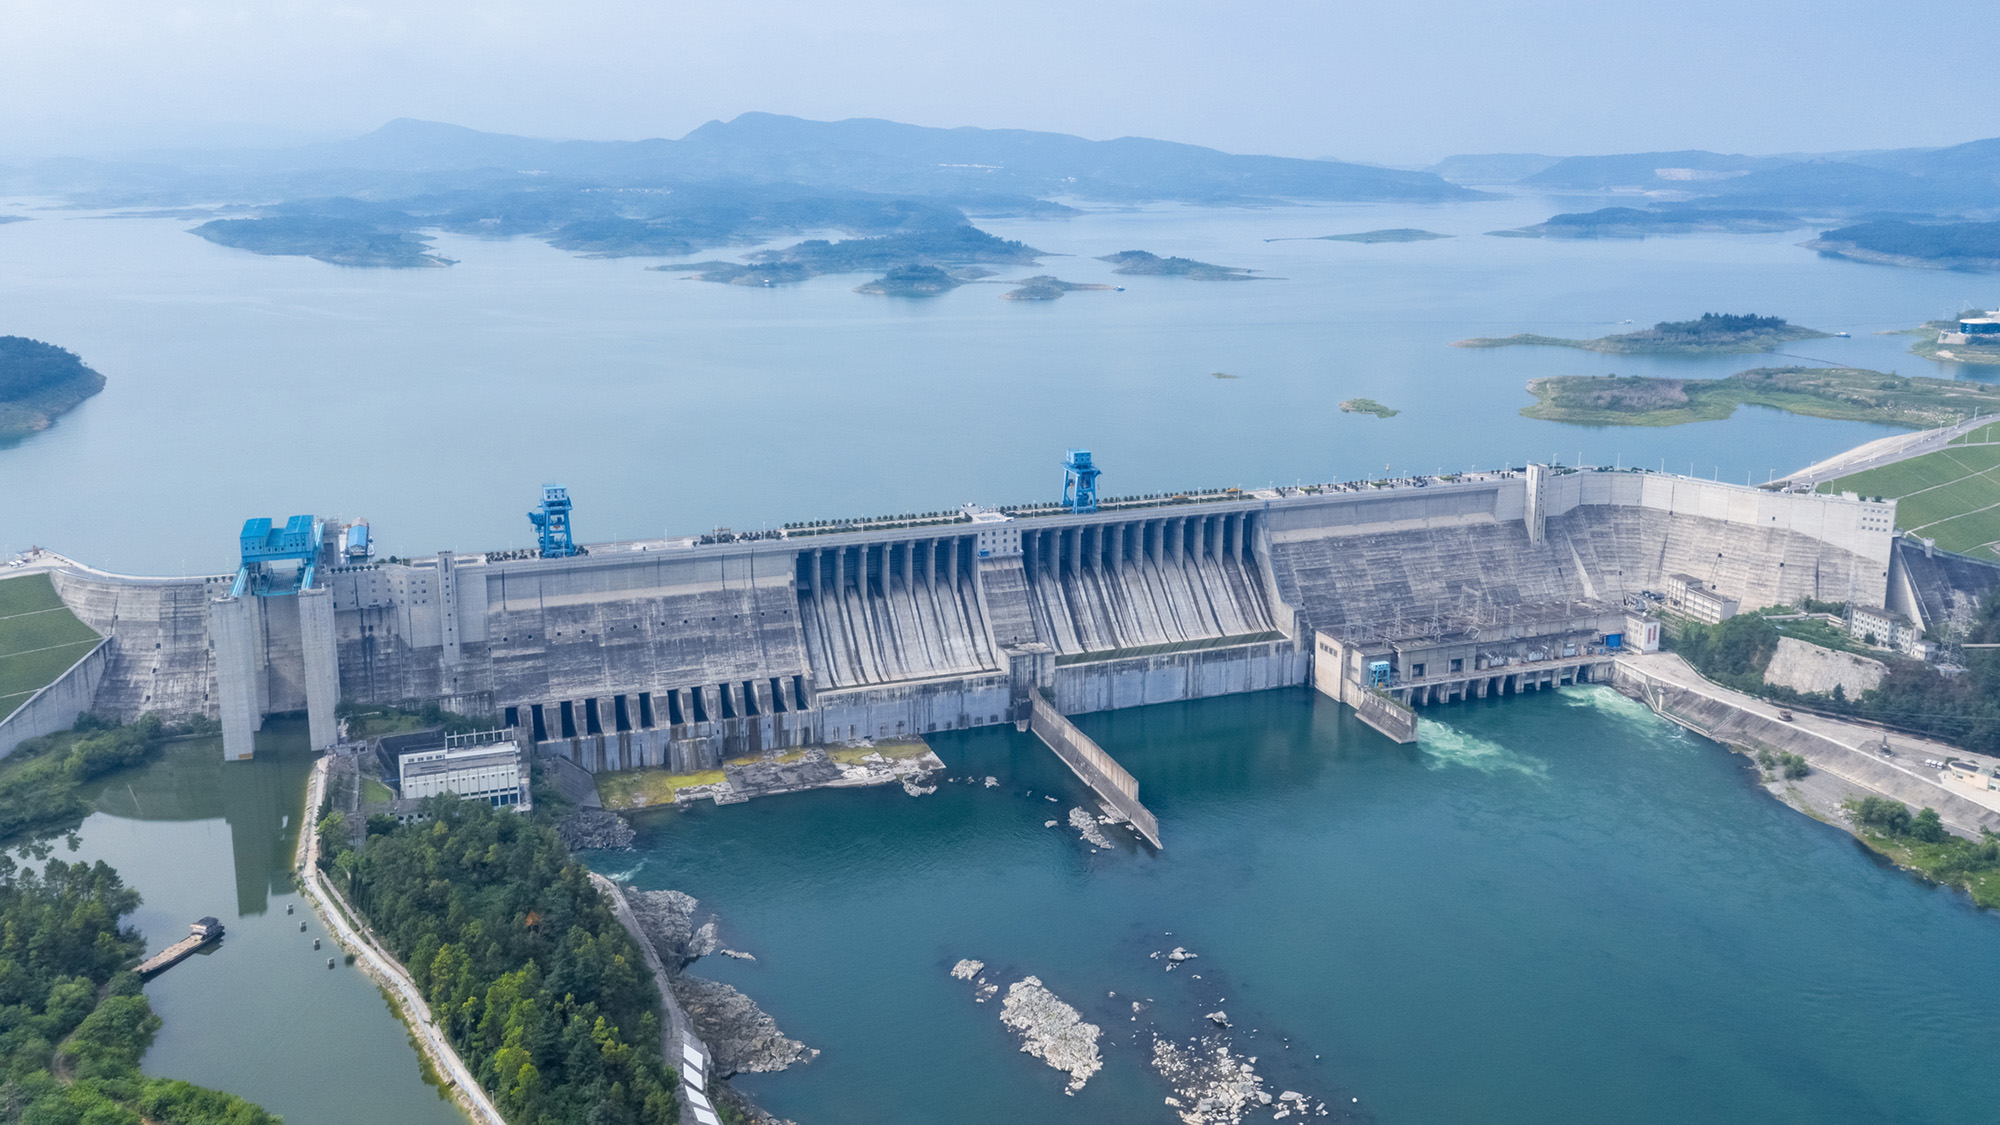
The Danjiangkou reservoir was expanded to supply the Central route, which flows to Beijing. (Image credit: silkwayrain via Getty Images)
The motivation for this project is obvious: China must support nearly 20% of the world's population with just 6% of its freshwater reserves. And this water is not distributed evenly across the country. Northern China has nearly half of the country's population and more than half of its agriculture but just one-fifth of the country's freshwater reserves.
In some places, the imbalance is even more dramatic. Tibet, in the west, has 4.8 million cubic feet (136,800 cubic meters) of water per person, while Tianjin, in the Northeast, has just 3,990 cubic feet (113 cubic m) per person. The United Nations considers less than 1,000 cubic m (35,000 cubic feet) of fresh water available per person water scarcity and less than 500 cubic meters (18,000 cubic feet) per person as "absolute water scarcity." The average in the U.S. is 314,300 cubic feet (8,900 cubic m).
Water transfer
China has a long history of rerouting water to serve its needs. Parts of the eastern route, for instance, use the Grand Canal, which was first built in the fifth century B.C.
"Control of water has been a key theme in Chinese history and mythology," Tom Harper, a lecturer at the University of East London specializing in Chinese foreign policy and international relations, told Live Science.
Map showing the two completed routes and the official plan for the western route. (Image credit: Zhang et al. (2022): CC BY 4.0)
Currently, the eastern route, which stretches 715 miles (1,150 km) from the Yangtze River to eventually reach Tianjin, transfers around 4 cubic miles (15 cubic km) of water per year.
This water needs to travel 213 feet (65 m) uphill, meaning pumping stations have to raise the water along the route.
The central route, meanwhile, relies on gravity to channel around 3 cubic miles (13 cubic km) of water 790 miles (1,270 km) from Danjiangkou Reservoir, on the Han River in Hubei province, to eventually reach Tianjin.
The Danjiangkou Reservoir already existed before the commencement of the project, but it was significantly expanded to raise the water level — and required 350,000 people to be relocated as a result.
The routes are now key to providing water to Beijing and Tianjin. For example, around 70% of Beijing's water comes from the route, experts told Live Science.
Fixing the fixes
The Chinese government and many Chinese scientists have boasted that the project has increased the water supply to people in northern China, raised the groundwater table in northern regions, and increased economic activity and agriculture in the region.
A major part of the project also focused on improving water quality: Freshwater supplies in China are heavily polluted, which reduces the amount of drinkable water.
"These were reservoirs, these were rivers, these were groundwater resources that had severe pollution impacts," Darrin Magee, a dam expert at Western Washington University, told Live Science. "So in the south where we had abundant water resources, the quality tended to be very bad in some areas."
To rectify this, the SNWTP installed water-cleaning stations along the route and the government implemented measures to reduce water pollution, including shutting down or relocating hundreds of manufacturing businesses that dumped their waste into waterways along the routes.
Along the eastern route, "pollution was terrible," Wang noted. "The central government put in a lot of effort… and they have control of the pollution again in a short period of time," he noted, adding that the water quality has significantly improved along the routes.
However, experts have said that the massive project has damaged ecosystems, displaced hundreds of thousands of people and fueled saltwater intrusion into underground reserves in water-providing areas, as the Yangtze River's freshwater flow is reduced.
"When the South-North Water Transfer was being proposed, many, many Chinese scientists were also against it because you just create lots and lots of new problems, whatever you fix," Emily Yeh, a professor of geography at the University of Colorado Boulder who specializes in Tibet, told Live Science. "Why not conserve water instead?"
Other experts agreed. "The water problem in China, it's not just physical water scarcity, it's the structural problem," Wang said. The biggest driver of water consumption is farming irrigation, which is water-intensive and leads to significant water loss. Conserving that water would go a long way to alleviating water scarcity, Wang added.
If China's "first priority is conservation, you won't need a large-scale, world's largest mega project," Wang said. Chinese authorities seem to be realizing this. They're also attempting large-scale water conservation policies, Wang said.
But the country is forging ahead with engineering projects.
The SNWTP's sources, particularly along the Han River, have less water per capita than the world's average, so siphoning off large amounts of the river's water could severely strain local areas. This has become such a problem that Chinese authorities are now undertaking even more engineering projects to alleviate the problem caused by the SNWTP. For instance, a new, smaller diversion is being added near the Danjiangkou reservoir, because people downstream are not getting sufficient water, Wang said.
The project is "a fix to fix the fix to fix the fix," environmental researcher Stevan Harrell wrote in the Made in China Journal — emphasizing the ever-growing number of engineering projects to deal with poor water governance.
Western route
Even though the two existing routes provide vast amounts of water to the North, and other water-conservation measures are being rolled out, Chinese authorities say the supply to the North is still not enough to meet demand, and that more water diversion is necessary.
The SNWTP's planned western route through the Tibetan Plateau won't start operations until at least 2050, but since its earliest planning stages, it has been mired in controversy.
The western route's official path would take 4 cubic miles (17 cubic km) of water per year from the Tongtian, Yalong and Dadu rivers — all tributaries that eventually feed into the Yangtze. The route would cross about 190 miles (300 km) of the Tibetan Plateau to the Yellow River, which then flows to the water-scarce north and east. The government has commissioned more feasibility studies for this route as part of the country's newly announced five-year plan.
The Tibetan Plateau's high, rugged and earthquake-prone landscape creates numerous challenges to potential infrastructure projects (Image credit: primeimages via Getty Images)
The construction of such a massive project is fraught with difficulty. The Tibetan Plateau rises 10,000 to 15,000 feet (3,000 to 4,500 m) above sea level. These high altitudes present several problems, such as challenges in construction and maintenance, and difficulties in preventing water from freezing.
To transfer water across the plateau, the route would require pumping stations, along with a series of 300- to 1,000-foot-tall (100 to 300 m) dams, which would rank among the tallest dams in the world. The project would also require cutting 200 miles (300 km) of tunnels through the mountains, including the Bayan Har Mountains, which separate the upper Yangtze and Yellow River drainage basins.
In 2018, Chinese scientists attempted to overcome the difficult terrain by transferring water through the air. But the "Sky River," or Tianhe project, ultimately proved unfeasible and has been effectively cancelled.
But China has not been deterred by these obstacles. The ongoing construction of the Dianzhong Water Diversion Project, in Yunnan province in southwest China, provides a test case for transferring water across mountainous, earthquake-prone landscapes. The damless design relies on a 380-mile-long (610 km) series of 58 tunnels, as well as pumps, to carry water through the mountainous and seismically active terrain. It is the "the world's longest water tunnel that could fit two high speed trains" and is "seen as a pilot demonstration project that will inspire and inform the design for the Western Routes," according to the Hong Kong-based think tank CWR. The first stage of the Dianzhong project is due for completion later this year, with a second phase recently announced.
Red flag
While the official western route has yet to break ground, alternative proposals have caused serious concern in neighboring countries. One unofficial plan developed in the 1990s, which politicians and academics subsequently considered completely unworkable, suggested funneling 48 cubic miles (200 cubic km) of water (four times the flow of the Yellow River) away from the Brahmaputra River, which flows into India and Bangladesh, and diverting the water toward the Yellow River basin, which serves the North and East of China.
A second controversial proposal, known as the Red Flag River project, suggests diverting 14 cubic miles (60 cubic km) of water 3,700 miles (6,000 km) from the Lancang, Nu and Yarlung Tsangpo rivers (called the Mekong, Salween and Brahmaputra rivers when they leave China) across the Tibetan Plateau to the northern Xinjiang region, which has high water stress and is facing desertification. Officials suggested the plan could turn Xinjiang into China's "California." The diverted water could also potentially be rerouted toward Beijing, experts told Live Science.
Some experts have called these "semi-official" proposals, as they have no official government backing but have been discussed openly by researchers with heavy government backing and support in China, which the government wouldn't allow if these people were truly speaking out of turn, Wang said.
Science Spotlight
(Image credit: Marilyn Perkins / Future)
Science Spotlight takes a deeper look at emerging science and gives you, our readers, the perspective you need on these advances. Our stories highlight trends in different fields, how new research is changing old ideas, and how the picture of the world we live in is being transformed thanks to science.
Despite no official government backing, the plans have worried neighboring countries, particularly India, due to fears that any water diversions on international rivers could significantly reduce vital downstream supplies. Massive water engineering projects are already being built in Tibet, such as the upcoming Motuo megadam on the Yarlung Tsangpo — close to the proposed starting point for the Red Flag River project.
"There's a lot of concern that there might be water diversion, because China has been talking about this for many, many years," Tenzin Norgay, a researcher at the nonprofit organization International Campaign for Tibet, told Live Science. "If it happens, it's going to be a huge risk to downstream countries."
Researchers have calculated that the Red Flag project would likely siphon around 20% of the rivers' upstream flows, though the overall water loss for the whole of each river is less than that. Regardless of the actual amount of diversion, the lack of international consultations and transparency is exacerbating suspicions, experts told Live Science.
A changing climate
While China is forging ahead with attempts to redistribute China's water and reduce water scarcity via the SNWTP, climate change could scramble those plans. An increased risk of droughts over the coming decades could compromise the SNWTP's ability to move water.
"Short to medium term, [we'll] see an increase in runoff as melting begins earlier each year," Magee said. "But over the long term, decreased snowpack means less secure water resources for most of China."
Taming nature
The government is really imagining Tibet as a source of ecological service for the rest of the country
Emily Yeh, professor of geography at the University of Colorado Boulder
China's water management approaches include vast dam-building projects, cloud seeding, monumental tree-planting schemes and water-transfer projects, all of which rely on technological and engineering solutions to control the natural world, experts told Live Science.
When it comes to megaprojects, "If there's any country that will do it, it's China," Magee said. "The People's Republic of Engineers."
Other experts agreed. "It is part of this idea that you can engineer your way out of these problems, even if it's with trees rather than with machines," Yeh said. "A large-scale engineering approach to the natural world has been a characteristic of Chinese approaches to perceived or real environmental problems."
This is particularly true for the Tibetan Plateau. "The government is really imagining Tibet as a source of ecological service for the rest of the country," Yeh said.
Other experts agreed that Chinese authorities typically take an engineering approach to attempt to manage nature.
But Wang noted that China faces big pressures, which is why its government is looking for big solutions.
"If you understand China's energy issues, you understand why China is doing this. If you understand the water and food security issues, you understand so many things China has done," Wang said.
The eruption, the first on La Palma in 50 years, began Sept. 19, 2021, when a fissure opened up on the western flank of Cumbre Vieja — a volcanic ridge that runs through the southern half of the island — and spewed massive lava fountains into the air. The violent outburst created a 660-foot-tall (200 meters) vent, dubbed Tajogaite, which continued to slowly pump out lava until Dec. 13, 2021.
The concentric cloud rings in this image are made up of steam, smoke and ash — known as an eruption plume — that rose above Tajogaite for weeks.
Normally, such a plume would continue to climb into the cold air of the stratosphere — the second layer of the atmosphere, which extends from around 6 to 31 miles (10 to 50 kilometers) above Earth's surface. However, when this image was captured, a rare "temperature inversion" created a layer of elevated warm air that acted as a lid, preventing the plume from rising and forcing it to spread outward, according to NASA's Earth Observatory.
At the start of the eruption, giant fiery fountains shot out of the ground near the town of Todoque, which was destroyed by the resulting lava flows. (Image credit: DESIREE MARTIN/AFP via Getty Images)
The trapped plume created concentric rings that formed from the natural ebb and flow in the intensity of volcanic activity. This pulse in the emissions given off by the volcano is visible in time-lapse footage captured by the Izaña Atmospheric Research Center on Tenerife, another Canary Island.
The official name for this type of concentric cloud formation is a "gravity wave," according to the National Weather Service. However, the formation has nothing to do with gravity, and it's completely separate from the ripples in space-time called gravitational waves.
"River of fire"
During the 85-day eruption, around 7.1 billion cubic feet (200 million cubic meters) of lava — reaching temperatures of up to 2,000 degrees Fahrenheit (1,100 degrees Celsius) — seeped from the ground.
This molten rock traveled around 4 miles (6.4 kilometers), destroying around 3,000 buildings in the town of Todoque, before falling into the Atlantic Ocean in a fiery waterfall. The estimated damage exceeded 700 million euros ($780 million), according to the Spanish newspaper El País.
This photo, also captured Oct. 1 by the European Space Agency's Copernicus satellite, shows the infrared heat radiating from the lava flow as it flows into the sea to create new land. (Image credit: ESA/Copernicus)
Where lava fell into the sea, around 4.6 million square feet (430,000 square meters) of new land was created. The reaction between the molten rock and the water also released high levels of volcanic gases, such as sulfur dioxide and hydrogen cyanide.
At least one person, a 72-year-old man who returned to his home prematurely, is believed to have died from inhaling these toxic fumes, according to AFP. Thousands of wild and agricultural animals are also thought to have been killed by the gases.
The damage was "truly terrible," Marie Edmonds, a volcanologist at the University of Cambridge, told Live Science at an event on La Palma in April 2025. "Most shocking to me is the closeness of the vent to the communities," she added when describing what it was like to visit the area. "It must have been absolutely terrifying to see the eruption so close."
A false-color satellite photo from 2023 shows a devilish pair of lava flows and an enormous plume of smoke spewing from Klyuchevskoy, the tallest volcano in Europe and Asia.
A 2014 astronaut photo shows a pair of volcanic lakes appearing to stare up into space from the Chiltepe Peninsula of Nicaragua's Lake Managua. These "eyes" and "skull" were created by violent eruptions thousands of years ago.
A new study suggests Antarctic ice loss may be reliably projected over the next several decades. Scientists say the next 30 to 50 years could be a crucial period for understanding and preparing for Antarctic ice loss and its impact on rising sea levels. A new study published in Nature and led by Monash University [...]
Coastal farmland in the Mid-Atlantic is being overtaken by rising seas faster than forests, revealing an overlooked rural front in climate-driven marsh migration. Ghost forests, the eerie stands of dead trees left behind when saltwater moves inland, have become a stark sign of sea level rise along the Mid-Atlantic coast. Yet a new Nature Sustainability [...]
A decade-long search through Taiwan’s remote forests led to the discovery of East Asia’s tallest tree and hundreds of other towering giants. An 84-meter-tall tree is surprisingly easy to miss. Hidden within Taiwan’s steep mountains and dense old-growth forests are some of the tallest trees on Earth, including giant conifers that rise higher than a [...]
The weather forecast can get extreme in the land of Hyrule, found in the Nintendo series The Legend of Zelda. A downpour in the coastal province of Faron, for instance, prevents Link, the game’s hero, from reaching Calora Lake. And constant lightning and rain threaten the skybound Thunderhead Isles. These storms only end once Link completes a series of quests, all while dodging lightning.
Never-ending storms make for moody gameplay. But real storms “can’t last forever,” says Stephanie Spera. Storms result from imbalances between moisture and temperature. “A storm kind of fixes a temporary imbalance,” she says. This physical geographer at the University of Richmond in Virginia uses satellite data to study changes to the landscape.
“The whole purpose of anything in weather is to get the atmosphere back in balance,” explains Chris Vagasky. He directs the Wisconsin Environmental Mesonet. It’s a network of weather stations. Physical features such as mountains and oceans, even buildings, often keep that from happening, he says. Though violent at times, thunderstorms help balance and redistribute heat, moisture and electrical charges.
For constant thunderstorms like those seen in Faron, those imbalances would have to remain out of whack. But on Earth, atmospheric physics ensures that even the strongest storms eventually fade away.
No storm lasts forever
Thunderstorms form when warm, moist air rapidly rises and meets cooler air in the atmosphere. This creates the instability needed for a storm. Such moisture often comes from the evaporation of ocean water. As this moisture-filled, warm air rises, it creates updrafts — upward air movements. Water vapor in this air condenses into droplets, forming a cumulus cloud. This cloud formation, in turn, releases energy as heat. That heat fuels stronger updrafts, which power the storm.
Within the clouds, water droplets collide with ice crystals. This creates static charges and, in turn, lightning. As a cloud grows, water droplets become heavy enough to fall through it. The resulting rain and ice create cooler downward winds, or downdrafts. They cool the cloud and eventually overpower the warmer updrafts. As the atmosphere now regains its balance, the storm ends.
Most thunderstorms only last an hour at most. For constant thunderstorms, such as those seen in Faron, you’d need to maximize a storm’s ingredients, says Vagasky. For moisture, there would need to be a “persistent conveyor belt of warm, moist air.” This air would most likely be heated by 24-hour sunlight. And the Thunderhead Isles would likely need to hug mountains that could help condense that moist air into clouds.
In 2017, Hurricane Harvey stalled over Houston, Texas, for about four days. During that time, some areas received more than 127 centimeters (50 inches) of rain.Jesse Allen/NASA
Keeping things moving
Even if a storm could sustain its own internal energy, it couldn’t stay in the same place forever. That’s because Earth’s atmosphere is in constant motion. Large belts of wind blow in particular directions (based on their latitude). Some storms get an extra boost from fast, narrow bands of wind called jet streams. Like conveyor belts, these streams move weather across continents. Clocking in at up to 320 kilometers (200 miles) per hour, jet streams “really help to push all of that activity from one place to another,” Vagasky says.
Sometimes these wind patterns can increase how long storms last. High-pressure systems or the jet stream can make Earth’s longest-lasting storms — tropical cyclones — sort of stall out in one place for a bit. In August 2017, for instance, weak prevailing winds let two high-pressure systems hover over the United States. In turn, Hurricane Harvey stalled over Houston, Texas, for about four days. Fueled by warm coastal waters, some areas received more than 127 centimeters (50 inches) of rain before the storm moved inland and broke up.
Like Houston, Faron lies along a coast. Depending on where Hyrule is located on the planet, it may be at risk for cyclones. But a cyclone couldn’t last year-round unless the oceans stayed consistently warm. On Earth, cyclones die when they make landfall, face windshear or reach colder water in higher latitudes. “They need to be refueled, which is why they die over land,” says Spera. “There’s no energy source.”
Learn about the basic ingredients of every thunderstorm and how weather satellites watch for developing storms.
Earth’s flashiest storms
Thanks to physics, perpetual storms like those in Faron are impossible on Earth. But certain scenarios come close.
The storm plaguing the Thunderhead Isles looks similar to a region called the Intertropical Convergence Zone (ITCZ), says Spera. This solid band of clouds encircles the globe near the equator. Here, prevailing winds from the northern and southern hemispheres meet. This lifts warm, humid air heated by the intense sunlight found in the tropics.
But the ITCZ isn’t a single, massive thunderstorm, Spera adds. Instead, a series of intense but short-lived events develop here. This zone also moves back and forth across the equator, leading to seasonal monsoon rains like those found on the Indian subcontinent. If the Thunderhead Isles were under the ITCZ, they wouldn’t have the relentless lightning storms seen in The Legend of Zelda games. Instead, it would just “be really rainy for a really long time.”
For flashier storms, the Catatumbo lightning phenomenon is truly unrivaled. This mass of thunderstorms occurs over Lake Maracaibo in coastal Venezuela. Here, lightning flashes up to 300 days per year and can last for nine hours at a stretch! Catatumbo holds the world’s record for the most concentrated lightning.
The key to Catatumbo lightning is geography. The nearby Caribbean Sea offers huge amounts of warm, humid air. Lake Maracaibo sends in added moisture. Winds whisk this moist air up the northern end of the Andes Mountains. There it meets colder air. The bowl-shaped mountains hugging the lake prevent the resulting cumulonimbus clouds from moving. This can lead to stagnant thunderstorms, ones similar to those of the Thunderhead Isles. Says Vagasky, “Catatumbo is one of the closest things that we might see to that.”
The term “snow line” is used in both earth science and astronomy. It has similar, but slightly different, meanings in each field.
On Earth, a snow line is the boundary between snow-covered and bare ground.
Imagine you are hiking up a craggy, white-capped mountain. When you reach the edge of the snowpack, you’ve reached the snow line. This is an elevation-based snow line. Likewise, if you were to march toward one of Earth’s poles, you would eventually pass a point beyond which the ground remains snow-covered. This is a snow line based on latitude.
It is important to note that a snow line does not mark a place where snowmelt never occurs. It just marks a point at which the snow falls at least as fast as it melts and evaporates.
Some snow lines are permanent. Others are seasonal. They move as snow melts faster during warmer months and builds up faster during colder months.
Many factors determine the elevation or latitude where a snow line occurs. For example, it’s easier for snow to build up on mountains closer to Earth’s poles. So here, snow lines often occur at lower elevations — sometimes as low as sea level. But near the equator, it’s warmer and harder for snow to build up. There, a mountain’s snow line may occur over 6,000 meters (19,700 feet) above sea level.
Snow lines can even vary on two different sides of the same mountain. Intense sunlight on one side can raise a snow line. Harsh wind also makes it harder for a mountain to hold onto snow. So a wind-swept mountainside usually has a higher snow line.
In astronomy, a snow line refers to the distance from a star where it’s cold enough for a certain type of molecule to freeze. For example, water freezes the closest to a star. Carbon dioxide freezes farther out than that. Methane, carbon monoxide and other chemicals become solid farther and farther out.
But the Amazon rainforest is also disappearing, with 17% of it already cut down or destroyed and largely replaced with agriculture. Other grave threats, such as oil drilling and illegal mining, continue to whittle it down. The next century may have outsize importance, as the forest could reach a "tipping point."
The answer depends on a number of compounding threats, Bernardo Flores, a researcher with the EqualSea Lab at the University of Santiago de Compostela in Spain, told Live Science.
Encroaching farmland and organized crime are a couple of the problems chipping away at the Amazon. But those work in tandem with what he considers the three main threats: climate change, which can lead to extreme weather events, "like wetter wet seasons and drier dry seasons," deforestation and fire.
As the Amazon loses more of its forest, it triggers a feedback loop. "You have less rainfall; then you have less forest, [then] less rainfall, less forest," Flores explained. "That ultimately leads to "a global scale feedback involving the Amazon: More forest loss [leads to] more global warming. More global warming, more forest loss."
As forests get drier, it becomes easier for wildfires to burn more areas. Roads also degrade the forest, and "wherever you have roads, you have people doing illegal activities, illegal logging … then this leads to [more] forest fires," Flores said.
The "arc of deforestation" — a roughly 310,000-square-mile (800,000 square km) border along the Amazon considered the largest deforestation frontier in the world — offers a preview of what much of the Amazon could ultimately look like, according to Flores. The forests that remain there have higher tree mortality and more canopy gaps, and they are often "covered with lianas," or woody vines, that become an ecological problem, he said. Lianas compete with trees for light and nutrients in the soil, and significantly reduce not only a tree's chance of survival but also the overall diversity of trees in a forest. "When the whole forest is covered in lianas, you don't see the forest anymore," he added.
Invasive grasses introduced by cattle farmers will likely proliferate in the decades ahead, but "only a few parts" of the Amazon could become "a savanna, because a savanna is a native, biodiverse ecosystem," he said. Invasive grasses "exclude native species, reduce biodiversity" and would not allow native savanna grasses to replace the forest, Flores said. Instead, one possibility is a "degraded open-canopy ecosystem," where native, naturally fire-tolerant trees, combined with invasive grasses, vines and ferns, proliferate, Flores told Live Science.
Deforestation poses a grave threat to the longevity of the Amazon rainforest. (Image credit: Bloomberg Creative via Getty Images)
Wildlife would quickly be affected as well. Aquatic species are especially vulnerable, Flores said. "When you start having these droughts that will simply last for one, two, three years," wetlands will dry out and become flammable, he explained. That could lead to "very quick extinctions in those areas."
The destruction of the Amazon rainforest would be disastrous for the Indigenous people living there, Christian Poirier, program director of Amazon Watch, an environmental and Indigenous rights advocacy group, told Live Science. "Imagine having your backyard bulldozed and your water source poisoned," he said. "You probably need to move from where you live, and that's exactly what's happening in the Amazon."
A devastated Amazon would also lead to "a more chaotic global climate system," Flores said. There could be less rainfall across parts of South America, and global warming will worsen. Earth could eventually reach a tipping point where ice sheets melt, ocean currents malfunction and the collapse of the Amazon accelerate warming all at once, pushing the planet to "cross the tipping point and transition to a much warmer climate," he said, leading to potentially irreversible consequences.
Unlike other major climate risks, such as the potential of the Greenland Ice Sheet melting and contributing to sea level rise, deforestation can in theory be reversed more easily by reforestation, said Arie Staal, an assistant professor of ecosystem resilience at Utrecht University in the Netherlands.
"That gives us a knob to turn that we don't have for other possible tipping points on Earth," he told Live Science. "It is clear that we really need to stop deforestation in the Amazon. And there's hope."
Editor's note: This article was updated at 6:23 p.m. EDT on June 22 to fix the conversion of roughly 310,000 square miles to 800,000 square kilometers.
Rainforest quiz: Can you sort the largest rainforests on Earth?
Roughly five billion. That is the number of Hiroshima-sized bombs it would take to match the energy of a single morning 66 million years ago.
Yes, according to a Physics Today summary of recent impact modelling, “The collision energy was 3 × 10²³ J, which is equivalent to about 5 billion Hiroshima-sized atomic bomb explosions.” The figure is a model-derived estimate, and the Hiroshima comparison is illustrative rather than exact but it still does the work of making an unimaginable event somewhat graspable.
The asteroid was about 10 to 15 kilometres in diamater. It struck the northern Yucatán Peninsula and left the Chicxulub crater, a buried scar some 180 kilometres wide. What followed was not a single catastrophic instant but a chain of consequences that played out over hours, months, and years. The story worth telling is less about the strike itself than about how a brief collision became a planetary reset.
The first hours
The immediate physics were brutal. Simulations summarised in the same Physics Today piece indicate that “Within seconds, the impact excavated a hole more than 20 km deep into Earth’s surface and threw bedrock and sediment into the upper atmosphere.” Again, that depth is a simulation result, not a measurement, but it captures the scale of the excavation.
Material did not just fall back where it came from. A 2022 review in Nature Reviews Earth & Environment, led by researchers at Imperial College London, synthesised the modelling this way: “Several thousand gigatonnes of asteroidal and target material were ejected at velocities exceeding 5 kilometres per second, forming a fast-moving cloud that transported dust, soot and sulfate aerosols around the Earth within hours.” A regional event became a global one before the day was out.
The long winter that did the killing
The strike was survivable for a great many organisms. The aftermath was not. The Nature Reviews synthesis frames the central mechanism plainly: “These impact ejecta and soot from global wildfires blocked sunlight and caused global cooling, thus explaining the severity and abruptness of the mass extinction.” That cooling likely explains why the extinction was so sharp, though the relative contributions of dust, soot, and sulfate aerosols remain debated.
How long the dark lasted is genuinely unsettled. The same review notes carefully that “it remains uncertain whether this impact winter lasted for many months or for more than a decade.” That uncertainty matters, because the duration is the difference between a lean season and the collapse of nearly every food web on the planet.
The debate over what drove the cooling is still live. A 2016 study in Scientific Reports proposed that soot ejected from the oil-rich rock at the impact site, spread globally through the stratosphere, drove much of the cooling and darkening, placing soot from the impact site itself, not just wildfires, near the front of the killing sequence. More recently, a 2025 Nature Communications paper by Katerina Rodiouchkina and colleagues revised the sulfur estimate sharply downward, suggesting a less prominent role for sulfur emission and a milder impact winter, with implications for which species pulled through the first years after the strike. It is one study, and it conflicts with other modelling that treats sulfur as the main early driver. The precise recipe of the winter is still being worked out.
Who slipped through
The pattern of survival is the part that tends to surprise people. Size was close to a death sentence. The Scientific Reports analysis notes that only about 12% of land-dwelling forms survived, with large-bodied land animals probably almost entirely wiped out. The contrast with the water is striking: around 90% of species in the freshwater assemblage survived, buffered because they relied on detritus rather than the living plants and plankton that the darkness destroyed much of.
Finding the crater, decades later
For years the impact was a hypothesis without a smoking gun. The crater was first detected in the late 1970s by petroleum geophysicists Glen Penfield and Antonio Camargo, but its connection to the extinction was only confirmed around 1990 and 1991, after Alan Hildebrand tied iridium-rich boundary deposits to the buried structure beneath the Yucatán.
The rock record has since been read directly. In 2016, an international drilling project bored into the crater’s peak ring, recovering shocked minerals and impact rocks that confirmed long-modelled details of the collision. As a summary of that work records, the drilling confirmed the peak ring was built from granite ejected within minutes from deep in the Earth.
What the record shows, followed to the end, is quietly disorienting. The event erased three-quarters of life on Earth.
An anonymous reader quotes a report from The Guardian: In May, the federal government announced without warning that it would take apart a network of ocean monitoring systems that it had spent over $350 million to build. No reason was given for the decision to shut down the Ocean Observatories Initiative (OOI), but suspicion immediately focused on the network's role in tracking climate change. But the OOI also provides data that's useful for weather forecasting and fisheries management, leading to widespread opposition. Today, it appears that the opposition has won, as the government will announce that it's reversing the decision. The big remaining question is how much damage the OOI took during the intervening month.
[...] The OOI is a federally supported resource that provides ocean data for use by academic researchers, government planners, and private companies. It consists of arrays of monitoring systems in several locations in both the Atlantic and Pacific Oceans that can track things like currents, salinity, chemical levels, temperatures, and tectonic activity. (There are over 100 individual entries on the page that display the data gathered by the system.) Obviously, there are many potential uses of that data. The fact that it has been gathered continuously for a decade means it can help track changes in how carbon dioxide and heat enter the oceans. This is probably what made it a target for the climate change denialists who helped set the Trump administration's policy.
Those policymakers are perfectly happy to annoy people with environmental concerns, but they apparently neglected to consider how upset everyone else would be about losing access to the other data. The ensuing public backlash led the Senate on Wednesday to unanimously agree with a measure that would block the government from taking down the OOI. Today's decision may indicate that the administration recognized it had gotten itself into a fight it knew it was losing. The National Science Foundation formally announced the decision, stating: "effective immediately, [it] will not proceed with further removal or descoping of equipment from the remaining arrays and will continue operations including planned maintenance." The agency added that it "appreciates the concerns raised by the range of stakeholders that have informed us they rely on data" from the OOI.
The NSF also said it would "issue a Dear Colleague Letter to collect input from stakeholders and convene an expert panel to assess observational needs, evaluate available data sources, consider responses ... and help the agency identify a sustainable path for NSF's ocean observing systems."
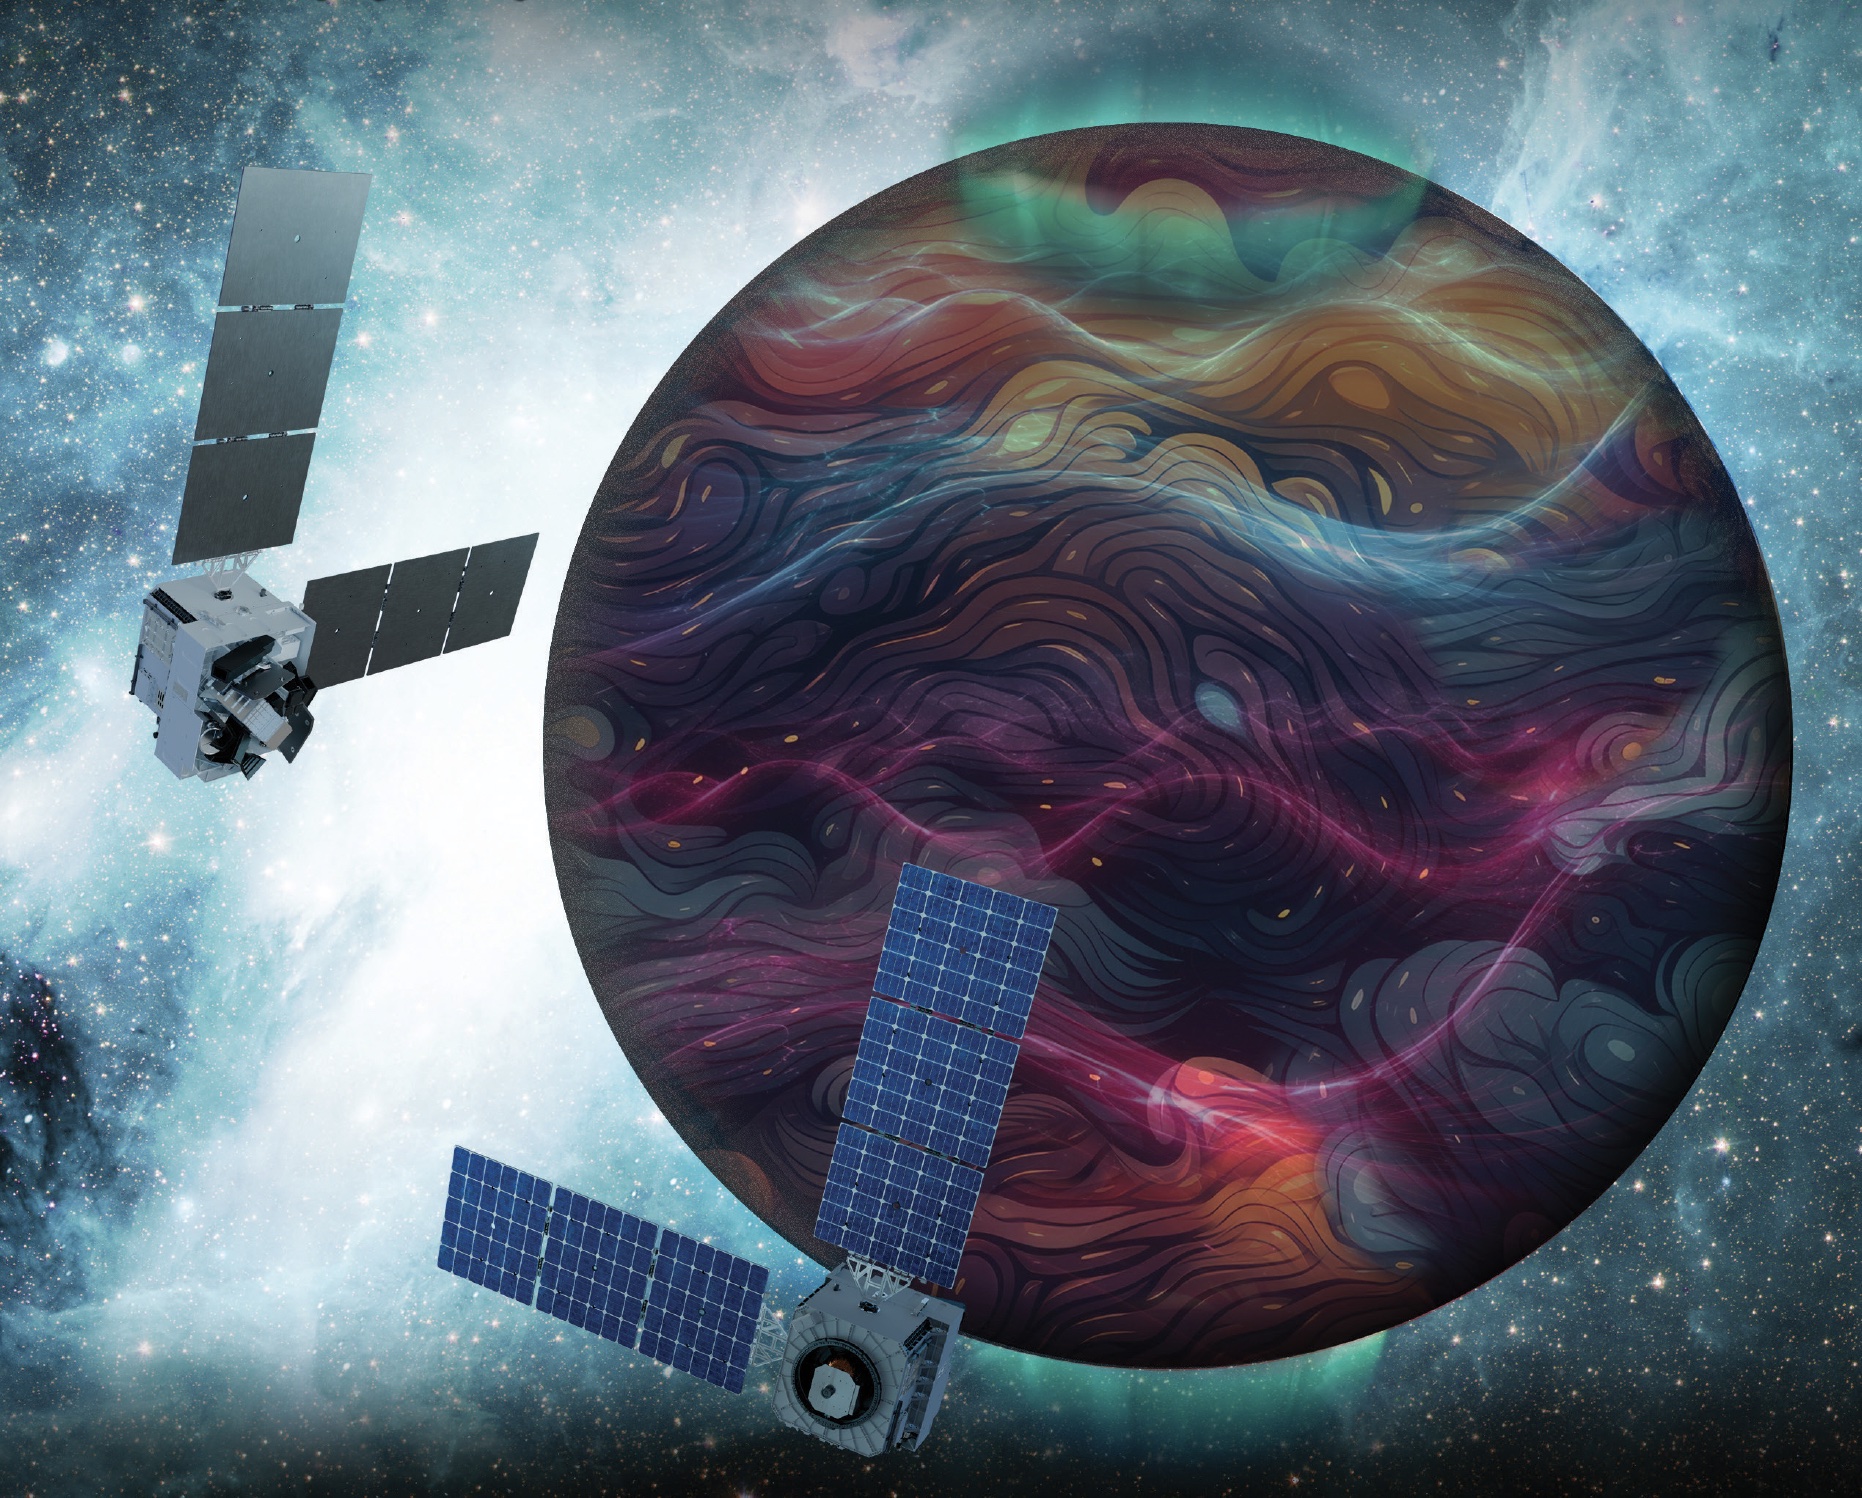
Artist’s rendition of the DAPHNE (Dynamic Atmosphere-Ionosphere Explorer) mission concept. The coloring represents auroras and atmospheric waves in Earth’s atmosphere.
Credit: Laboratory for Atmospheric and Space Physics/Mary Tostanoski
NASA selected a mission concept to research how space weather and dynamics within Earth’s atmosphere influence the space environment and help improve prediction capabilities for impacts on crucial technology, such as GPS and low Earth orbit satellites, as well as astronauts in space.
The DAPHNE (Dynamic Atmosphere-Ionosphere Explorer) mission will enter Phase B of development, which includes planning and design for flight and mission operations. It will use identical twin satellites to study how changes in Earth’s lower atmosphere influence our planet’s upper atmosphere, where space weather is manifested.
“NASA is advancing the United States’ leadership as a space weather-ready nation, and by providing new insights into Earth’s atmosphere we can better predict and prepare for impacts in our daily lives on Earth and in space,” said Nicky Fox, associate administrator, Science Mission Directorate, NASA Headquarters in Washington. “As NASA sends astronauts beyond Earth’s magnetic protection to the Moon, Mars, and beyond, DAPHNE will join the NASA science fleet strategically located across the solar system to provide data that will help mission planners predict and mitigate the effects of space weather for the benefit of all.”
The DAPHNE mission’s low-risk high-return concept will provide coordinated, multi-point measurements of neutral winds, temperature, and composition in the thermosphere. The ionosphere and thermosphere regions are where Earth’s neutral atmosphere transitions into the ionized plasma of space. In this thin shell that surrounds the planet, the atmosphere is in constant motion, shaped by the influence of solar activity and changes in the lower atmosphere and in near-Earth space.
Fundamental observations and physical insights from the DAPHNE mission will incorporate lower-atmospheric energy data to advance space weather predictive capabilities. The mission is led by Aimee Merkel from the Laboratory for Atmospheric and Space Physics at the University of Colorado, Boulder.
The mission will be subject to a confirmation review in 2027, which will assess the progress of the mission and the availability of funds. If confirmed, the total estimated cost of the mission, excluding launch, will not exceed $250 million in fiscal year 2023 dollars, with a mission launch date of no earlier than 2029.
The DAPHNE mission was proposed as a concept study in response to the DYNAMIC (Dynamical Neutral Atmosphere-Ionosphere Coupling) mission announcement of opportunity. Funding and management oversight for this mission is provided by the Solar Terrestrial Probes program at NASA’s Goddard Space Flight Center in Greenbelt, Maryland.
For more information on NASA’s heliophysics missions, visit:

 Login