After testing Dreo’s new smart misting fan, I couldn’t imagine my life without it — here’s why
As the world continues to witness unprecedented growth in air travel, a groundbreaking study published in Communications Earth & Environment reveals alarming insights into the global repercussions of accelerating aircraft emissions on air quality and human health. This landmark research meticulously quantifies how expanding aviation activities contribute to deteriorating atmospheric conditions and exacerbate public health crises worldwide, underscoring an urgent need for global policy interventions and technological innovation.
The aviation sector, responsible for a substantial portion of anthropogenic greenhouse gas and pollutant outputs, has long been scrutinized for its environmental footprint. Yet, the intricate dynamics linking aircraft emissions to widespread air quality degradation and subsequent health implications have remained largely underexplored until now. Quadros, Nelen, Snellen, and colleagues harnessed sophisticated atmospheric modeling techniques combined with epidemiological data to elucidate these complex pathways with unprecedented precision.
Aircraft engines emit a cocktail of pollutants, including nitrogen oxides (NOx), particulate matter (PM), volatile organic compounds (VOCs), and carbon dioxide (CO2). These emissions initiate a cascade of atmospheric chemical reactions, creating secondary pollutants such as ozone and fine particulate matter, which profoundly impair air quality. The study’s simulation results reveal that aircraft emissions alone contribute significantly to elevated ground-level ozone concentrations, particularly in densely populated and heavily trafficked air corridors.
One of the study’s pivotal findings focuses on the spatial distribution of pollution burdens. Regions adjacent to major airports and common flight routes exhibit air quality dips notably beyond local vehicular and industrial contributions. The researchers found that the transboundary nature of aircraft emissions facilitates the transport of chemically reactive species across continents, linking aviation activities not only to local but also to regional and global air pollution episodes.
In terms of human health, the implications are disturbing. The researchers applied integrated exposure-response functions to estimate the morbidity and mortality attributable to aviation-induced pollution. Their assessments suggest a substantial increase in respiratory ailments, cardiovascular diseases, and premature deaths attributable to aircraft emissions. Particularly vulnerable populations, such as urban dwellers, children, elderly individuals, and those with preexisting conditions, face disproportionate risks.
Moreover, the study highlights the synergistic effects of aircraft emissions with other urban pollutants, exacerbating harmful synergistic interactions that amplify health risks. For instance, the NOx and VOCs emitted interact under sunlight to generate ozone, a potent respiratory irritant, and exacerbate asthma symptoms. The authors stress the importance of recognizing these nonlinear effects for robust public health policy formulation.
Climate feedback mechanisms linked to aviation emissions emerge as a critical concern in the report. The authors delineate how nitrogen oxides released at high altitudes not only affect surface-level ozone but also perturb the radiative balance of the atmosphere. This creates complex feedback loops that potentially accelerate climate warming, indicating that the environmental cost of aviation extends beyond conventional pollutants to include broader climatic impacts.
Technology advances and mitigation strategies receive thorough evaluation in the study. The authors discuss current emission reduction technologies such as lean-burn engines, sustainable aviation fuels (SAFs), and operational measures like optimized flight paths and altitude adjustments. Despite their promise, the research cautions that without comprehensive adoption and scaling, these technologies alone may fall short of offsetting the forecasted growth in emissions.
The aviation sector is projected to expand considerably over the coming decades, driven by economic growth and increasing globalization. The study’s projections indicate that without stringent regulatory frameworks and aggressive emission reduction commitments, the global burden of aviation-induced air pollution and related health impacts will escalate dramatically, particularly in emerging economies with rapidly growing air traffic.
Policy recommendations form a cornerstone of the researchers’ conclusions. They advocate for coordinated international efforts to tighten emission standards, mandate SAF usage, and invest in next-generation propulsion technologies such as electric and hydrogen-powered aircraft. Furthermore, integrating aviation sector goals into broader air quality management and climate policies is deemed essential to maximize health and environmental benefits.
In addition to technological and regulatory measures, the report emphasizes the role of real-time monitoring networks and data-sharing frameworks. Enhanced surveillance of aircraft emissions and their atmospheric transformations can enable dynamic policy responses, better inform public health advisories, and foster transparency and accountability among stakeholders ranging from airlines to regulators.
The health economics dimension discussed in the study reveals enormous societal costs tied to aviation-related air pollution. Hospitalizations, lost productivity, and long-term healthcare expenditures attributed to pollution-induced diseases impose substantial financial burdens on governments and communities alike, reinforcing the public health imperative for aggressive mitigation.
Further research priorities identified in the report call for improved characterization of ultrafine particles emitted by aircraft engines, nuanced understanding of population exposure patterns near airports, and exploration of co-benefits arising from simultaneous air quality and climate interventions. Interdisciplinary collaboration combining atmospheric science, epidemiology, engineering, and policy studies is championed as the pathway to innovative solutions.
In light of this new research, the aviation industry stands at a crossroads. Balancing the undeniable economic and social advantages of air travel with its adverse environmental and health externalities necessitates transformative thinking and collaborative global action. The study’s revelations provide an indispensable scientific foundation for stakeholders to forge a sustainable aviation future.
This comprehensive investigation serves as a clarion call for urgent recognition of the aviation sector’s hidden consequences, urging policymakers, industry players, and the public to engage in proactive, science-informed strategies that safeguard air quality and human health on a planetary scale.
Subject of Research:
The study focuses on evaluating the global impact of increasing aircraft emissions on air quality and related human health outcomes, analyzing both direct and indirect effects through sophisticated atmospheric and epidemiological modeling.
Article Title:
Global air quality and human health impacts of growing aircraft emissions
Article References:
Quadros, F.D.A., Nelen, R., Snellen, M. et al. Global air quality and human health impacts of growing aircraft emissions. Commun Earth Environ (2026). https://doi.org/10.1038/s43247-026-03732-4
Image Credits: AI Generated
DOI: 10.1038/s43247-026-03732-4
Keywords:
Aircraft emissions, air quality, human health, nitrogen oxides, particulate matter, ozone formation, aviation pollution, atmospheric modeling, public health impact, sustainable aviation fuels



More than 35 million people live along the New York–Washington corridor and breathe the region’s air. While air quality has improved significantly in recent decades, outbreaks of ground-level ozone remain common, particularly in the warm summer months, when the chemical reactions that produce the pollutant accelerate and stagnant air allows ozone to accumulate.
A reminder of this seasonal phenomenon came earlier than usual in 2026, when a mid-May heat wave prompted the New York State Department of Health and the New York Department of Environmental Conservation to issue a health advisory on May 17 over concerns about ozone. The code orange advisory warned young people, older adults, and those working or exercising outdoors to limit activity due to ozone’s respiratory and cardiovascular health impacts.
As expected, ground-based air-quality sensors operated by state and federal agencies showed ozone reaching unhealthy levels for sensitive groups on May 18, something that typically happens several times per year. Meanwhile, NASA’s TEMPO (Tropospheric Emissions: Monitoring of Pollution) instrument observed the event from geostationary orbit 22,000 miles (35,000 kilometers) above the equator, a unique vantage point that allows the sensor to collect frequent observations of air pollution.
TEMPO detects nitrogen dioxide (NO2), a gas emitted by burning fuels, particularly by motor vehicles, that contributes to ozone formation. “There’s often a clear and interesting pattern in TEMPO’s nitrogen dioxide data during ozone alert days,” said Hazem Mahmoud, an atmospheric scientist at NASA’s Atmospheric Science Data Center at Langley Research Center. “We see high concentrations of nitrogen dioxide during the early morning commute that drop off sharply in the late afternoon as ozone increases.”
The decline occurs as sunlight fuels photochemical reactions involving nitrogen dioxide, volatile organic compounds, and oxygen that lead to ozone formation. By late afternoon, these reactions deplete much of the available nitrogen dioxide, slowing ozone production until the cycle begins again the next day.
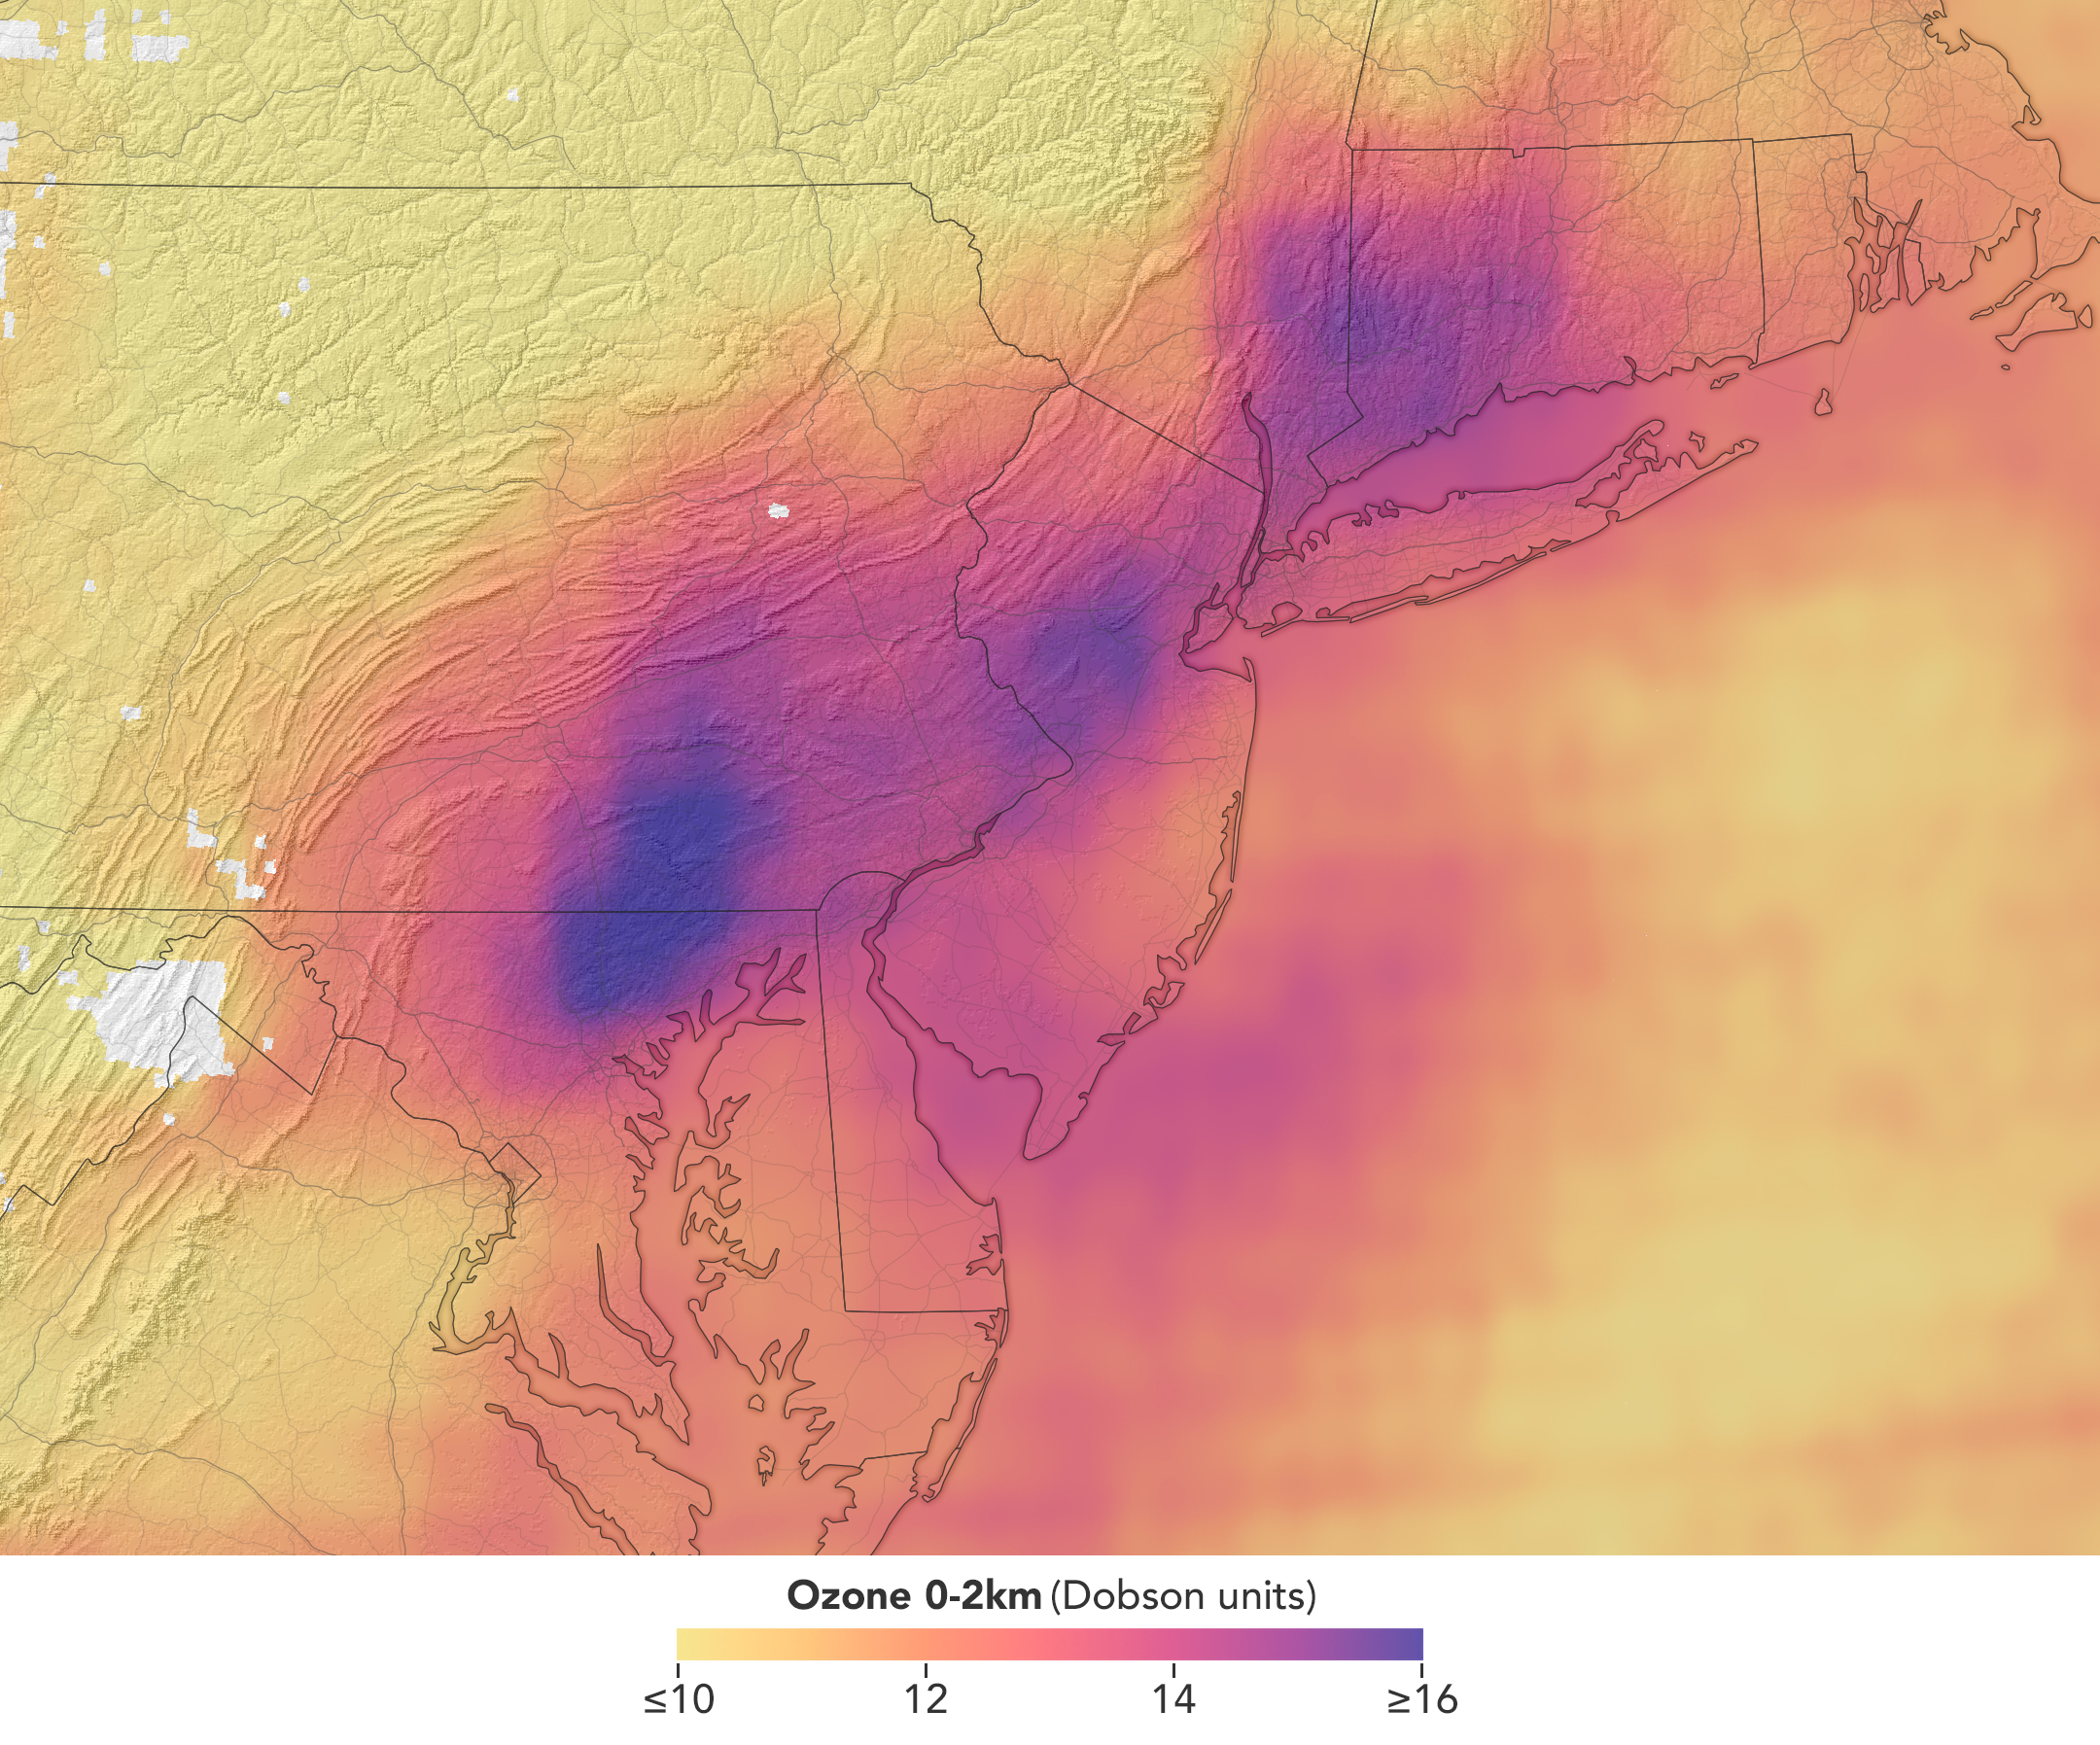
The pair of images above underscores the pattern. The image on the left was acquired at 7:05 a.m. local time when nitrogen dioxide concentrations were high during the morning commute. By 3:05 p.m. (right), most of the nitrogen dioxide had declined substantially, and surface ozone levels were elevated (below). Meanwhile, afternoon sea breezes appear to have transported the remaining nitrogen dioxide slightly to the west. Note that the data shown is provisional, and processing methods are still being refined.
Sensors on earlier polar-orbiting satellites, such as OMI (Ozone Monitoring Instrument) and TROPOMI (Tropospheric Monitoring Instrument), sampled nitrogen dioxide over New York once per day. After its launch in 2023, TEMPO began providing data every hour, allowing researchers to track the evolution and dispersion of air pollution at much finer time scales.
“TEMPO is helping fill data gaps between ground stations and allowing us to ask new questions,” Mahmoud said. The mission provides data that can improve not only air quality forecasts during crisis situations, such as wildfires, but also the atmospheric models used to forecast the daily rhythms of urban pollution. Such models help researchers understand how natural factors such as winds, humidity levels, and air temperatures influence pollution plumes over the course of a day.
TEMPO also detects ozone directly, but determining how much of that ozone is near the surface versus higher in the atmosphere can be challenging. Most of Earth’s ozone resides in the stratosphere, well above the troposphere, where people live and breathe. At times, however, stratospheric ozone can be transported downward into the troposphere. During events known as stratospheric intrusions, it can even descend far enough to affect air quality at the surface and add to the ozone produced at ground level.
By combining TEMPO observations with other sources of information, researchers are studying the processes that influence the distribution of ozone vertically in the atmosphere. On May 18, NASA’s ground-based tropospheric lidar network (TOLNet) in New York City recorded high concentrations of ozone near the surface, indicating that TEMPO was detecting mostly surface-level ozone associated with urban emissions and not ozone aloft, said Mahmoud.
However, on May 19, the same sensor observed a layer of ozone descending from above 5 kilometers (3 miles), he added, a clue that some of the ozone TEMPO detected that day may have originated in the stratosphere. “This is the type of information that leads to better air quality forecast models and more accurate alerts,” Mahmoud said. “Alerts can affect tens of millions of people and lead to disruptions in school, sports, and other activities, so it’s essential that they be as accurate as possible.”
On June 6, New York authorities issued another health advisory for ozone. People interested in following the event can access daily near-real-time TEMPO observations of ozone, nitrogen dioxide, and other gases on NASA’s Worldview browser, on an interactive Harvard & Smithsonian Center for Astrophysics browsing tool, and on NASA’s Earthdata portal.
NASA Earth Observatory images by Michala Garrison, using TEMPO data from NASA Earthdata. Story by Adam Voiland.
Stay up-to-date with the latest content from NASA as we explore the universe and discover more about our home planet.

Seasonal fires have darkened skies over Southeast Asia.

As winter turned to spring, the skies over the Gulf of Alaska displayed textbook examples of numerous cloud formations.

Following a significant winter storm, frigid temperatures lingered in late January 2026 across a vast swath of the U.S.
Subscribe to the Earth Observatory and get the Earth in your inbox.

NASA's Earth Observatory brings you the Earth, every day, with in-depth stories and stunning imagery.

Explore Earth Science

Open access to NASA’s archive of Earth science data

The post Air Pollution’s Daily Pulse Over the Northeast appeared first on NASA Science.


More than 35 million people live along the New York–Washington corridor and breathe the region’s air. While air quality has improved significantly in recent decades, outbreaks of ground-level ozone remain common, particularly in the warm summer months, when the chemical reactions that produce the pollutant accelerate and stagnant air allows ozone to accumulate.
A reminder of this seasonal phenomenon came earlier than usual in 2026, when a mid-May heat wave prompted the New York State Department of Health and the New York Department of Environmental Conservation to issue a health advisory on May 17 over concerns about ozone. The code orange advisory warned young people, older adults, and those working or exercising outdoors to limit activity due to ozone’s respiratory and cardiovascular health impacts.
As expected, ground-based air-quality sensors operated by state and federal agencies showed ozone reaching unhealthy levels for sensitive groups on May 18, something that typically happens several times per year. Meanwhile, NASA’s TEMPO (Tropospheric Emissions: Monitoring of Pollution) instrument observed the event from geostationary orbit 22,000 miles (35,000 kilometers) above the equator, a unique vantage point that allows the sensor to collect frequent observations of air pollution.
TEMPO detects nitrogen dioxide (NO2), a gas emitted by burning fuels, particularly by motor vehicles, that contributes to ozone formation. “There’s often a clear and interesting pattern in TEMPO’s nitrogen dioxide data during ozone alert days,” said Hazem Mahmoud, an atmospheric scientist at NASA’s Atmospheric Science Data Center at Langley Research Center. “We see high concentrations of nitrogen dioxide during the early morning commute that drop off sharply in the late afternoon as ozone increases.”
The decline occurs as sunlight fuels photochemical reactions involving nitrogen dioxide, volatile organic compounds, and oxygen that lead to ozone formation. By late afternoon, these reactions deplete much of the available nitrogen dioxide, slowing ozone production until the cycle begins again the next day.
The pair of images above underscores the pattern. The image on the left was acquired at 7:05 a.m. local time when nitrogen dioxide concentrations were high during the morning commute. By 3:05 p.m. (right), most of the nitrogen dioxide had declined substantially, and surface ozone levels were elevated (below). Meanwhile, afternoon sea breezes appear to have transported the remaining nitrogen dioxide slightly to the west. Note that the data shown is provisional, and processing methods are still being refined.
Sensors on earlier polar-orbiting satellites, such as OMI (Ozone Monitoring Instrument) and TROPOMI (Tropospheric Monitoring Instrument), sampled nitrogen dioxide over New York once per day. After its launch in 2023, TEMPO began providing data every hour, allowing researchers to track the evolution and dispersion of air pollution at much finer time scales.
“TEMPO is helping fill data gaps between ground stations and allowing us to ask new questions,” Mahmoud said. The mission provides data that can improve not only air quality forecasts during crisis situations, such as wildfires, but also the atmospheric models used to forecast the daily rhythms of urban pollution. Such models help researchers understand how natural factors such as winds, humidity levels, and air temperatures influence pollution plumes over the course of a day.
TEMPO also detects ozone directly, but determining how much of that ozone is near the surface versus higher in the atmosphere can be challenging. Most of Earth’s ozone resides in the stratosphere, well above the troposphere, where people live and breathe. At times, however, stratospheric ozone can be transported downward into the troposphere. During events known as stratospheric intrusions, it can even descend far enough to affect air quality at the surface and add to the ozone produced at ground level.
By combining TEMPO observations with other sources of information, researchers are studying the processes that influence the distribution of ozone vertically in the atmosphere. On May 18, NASA’s ground-based tropospheric lidar network (TOLNet) in New York City recorded high concentrations of ozone near the surface, indicating that TEMPO was detecting mostly surface-level ozone associated with urban emissions and not ozone aloft, said Mahmoud.
However, on May 19, the same sensor observed a layer of ozone descending from above 5 kilometers (3 miles), he added, a clue that some of the ozone TEMPO detected that day may have originated in the stratosphere. “This is the type of information that leads to better air quality forecast models and more accurate alerts,” Mahmoud said. “Alerts can affect tens of millions of people and lead to disruptions in school, sports, and other activities, so it’s essential that they be as accurate as possible.”
On June 6, New York authorities issued another health advisory for ozone. People interested in following the event can access daily near-real-time TEMPO observations of ozone, nitrogen dioxide, and other gases on NASA’s Worldview browser, on an interactive Harvard & Smithsonian Center for Astrophysics browsing tool, and on NASA’s Earthdata portal.
NASA Earth Observatory images by Michala Garrison, using TEMPO data from NASA Earthdata. Story by Adam Voiland.
Stay up-to-date with the latest content from NASA as we explore the universe and discover more about our home planet.

Seasonal fires have darkened skies over Southeast Asia.

As winter turned to spring, the skies over the Gulf of Alaska displayed textbook examples of numerous cloud formations.

Following a significant winter storm, frigid temperatures lingered in late January 2026 across a vast swath of the U.S.
Subscribe to the Earth Observatory and get the Earth in your inbox.

NASA’s Earth Observatory brings you the Earth, every day, with in-depth stories and stunning imagery.

Explore Earth Science

Open access to NASA’s archive of Earth science data

By Erica McNamee of NASA’s Goddard Space Flight Center in Greenbelt, MD
As a kid, you were always taught to hold tight to balloons—tie them around your wrist, even, to keep them close. This week, a group of a dozen undergraduate students participating in NASA’s 2026 Student Airborne Research Program (SARP), unlearned old balloon-wrangling habits—and let go.
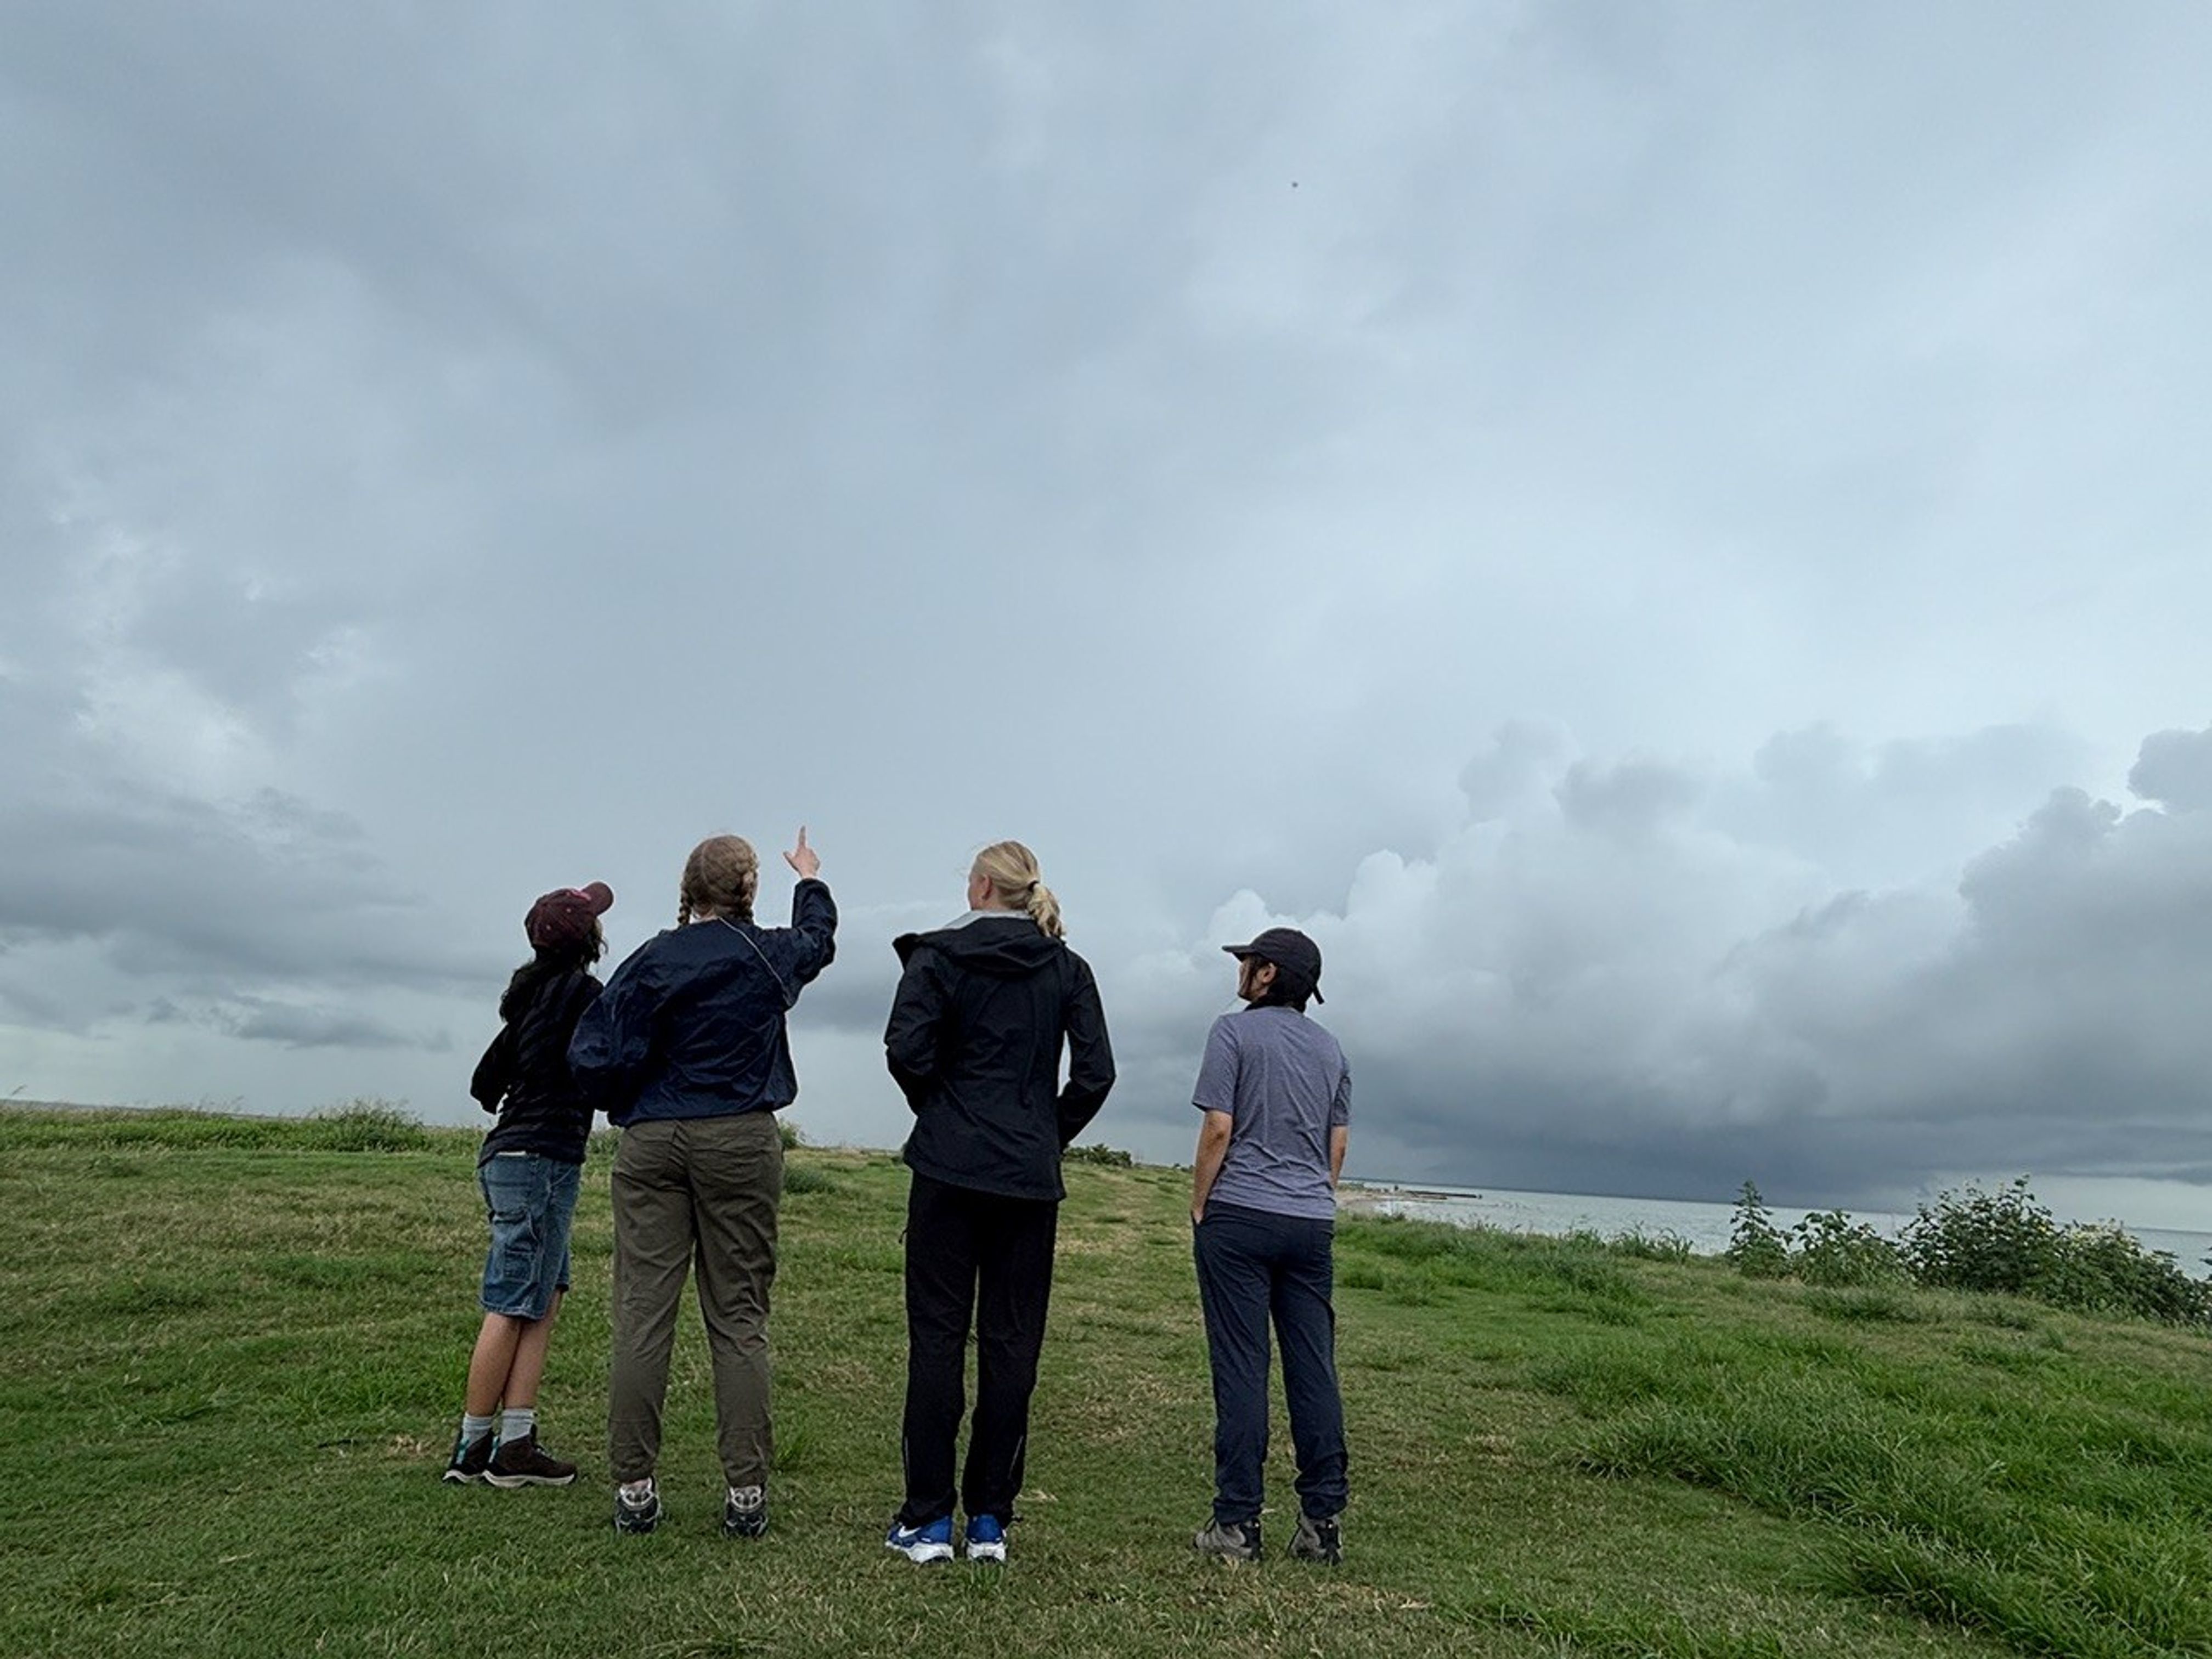
Their purpose: to collect data about the atmosphere with the help of a weather balloon. For this fieldwork day, in a windy area on the Texas Gulf Coast, the group released an ozonesonde, a small instrument attached to a weather balloon that measures ozone concentrations as it rises through the atmosphere.
“I’ve never done any atmospheric fieldwork outside like this, so this has been an awesome new opportunity for me,” said Marin Stevens, SARP intern and chemistry student from the University of Colorado at Colorado Springs.
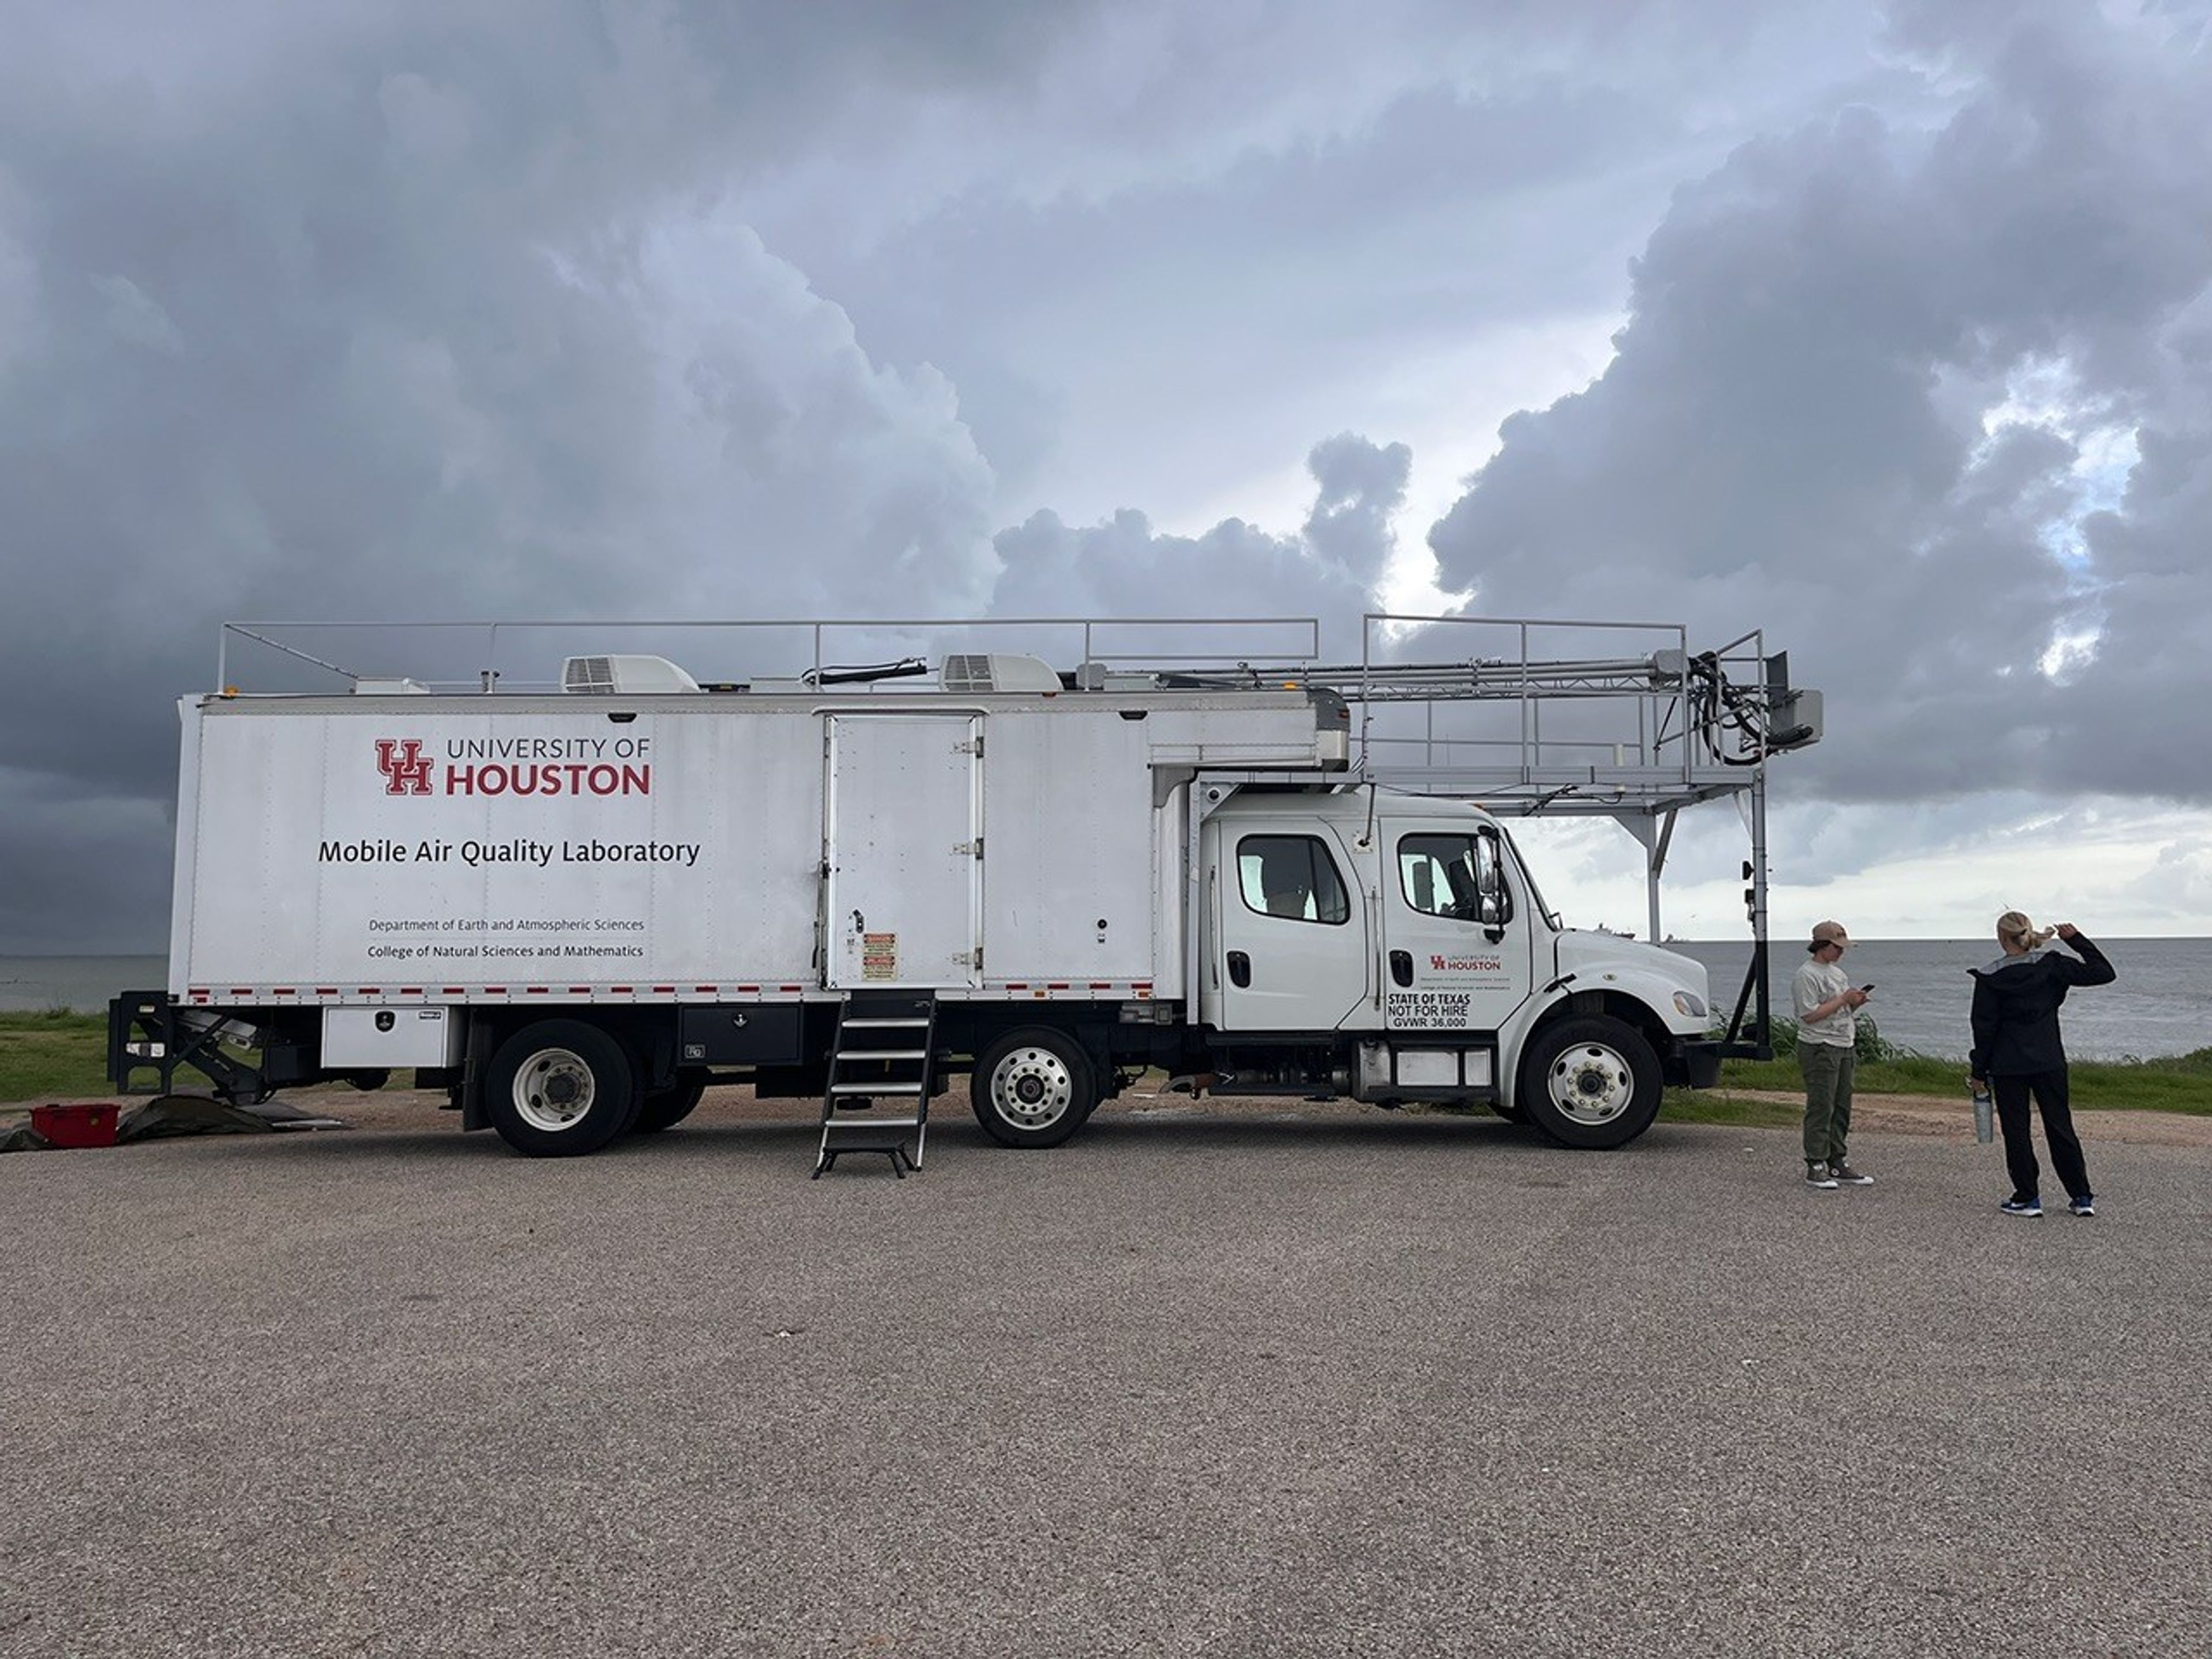
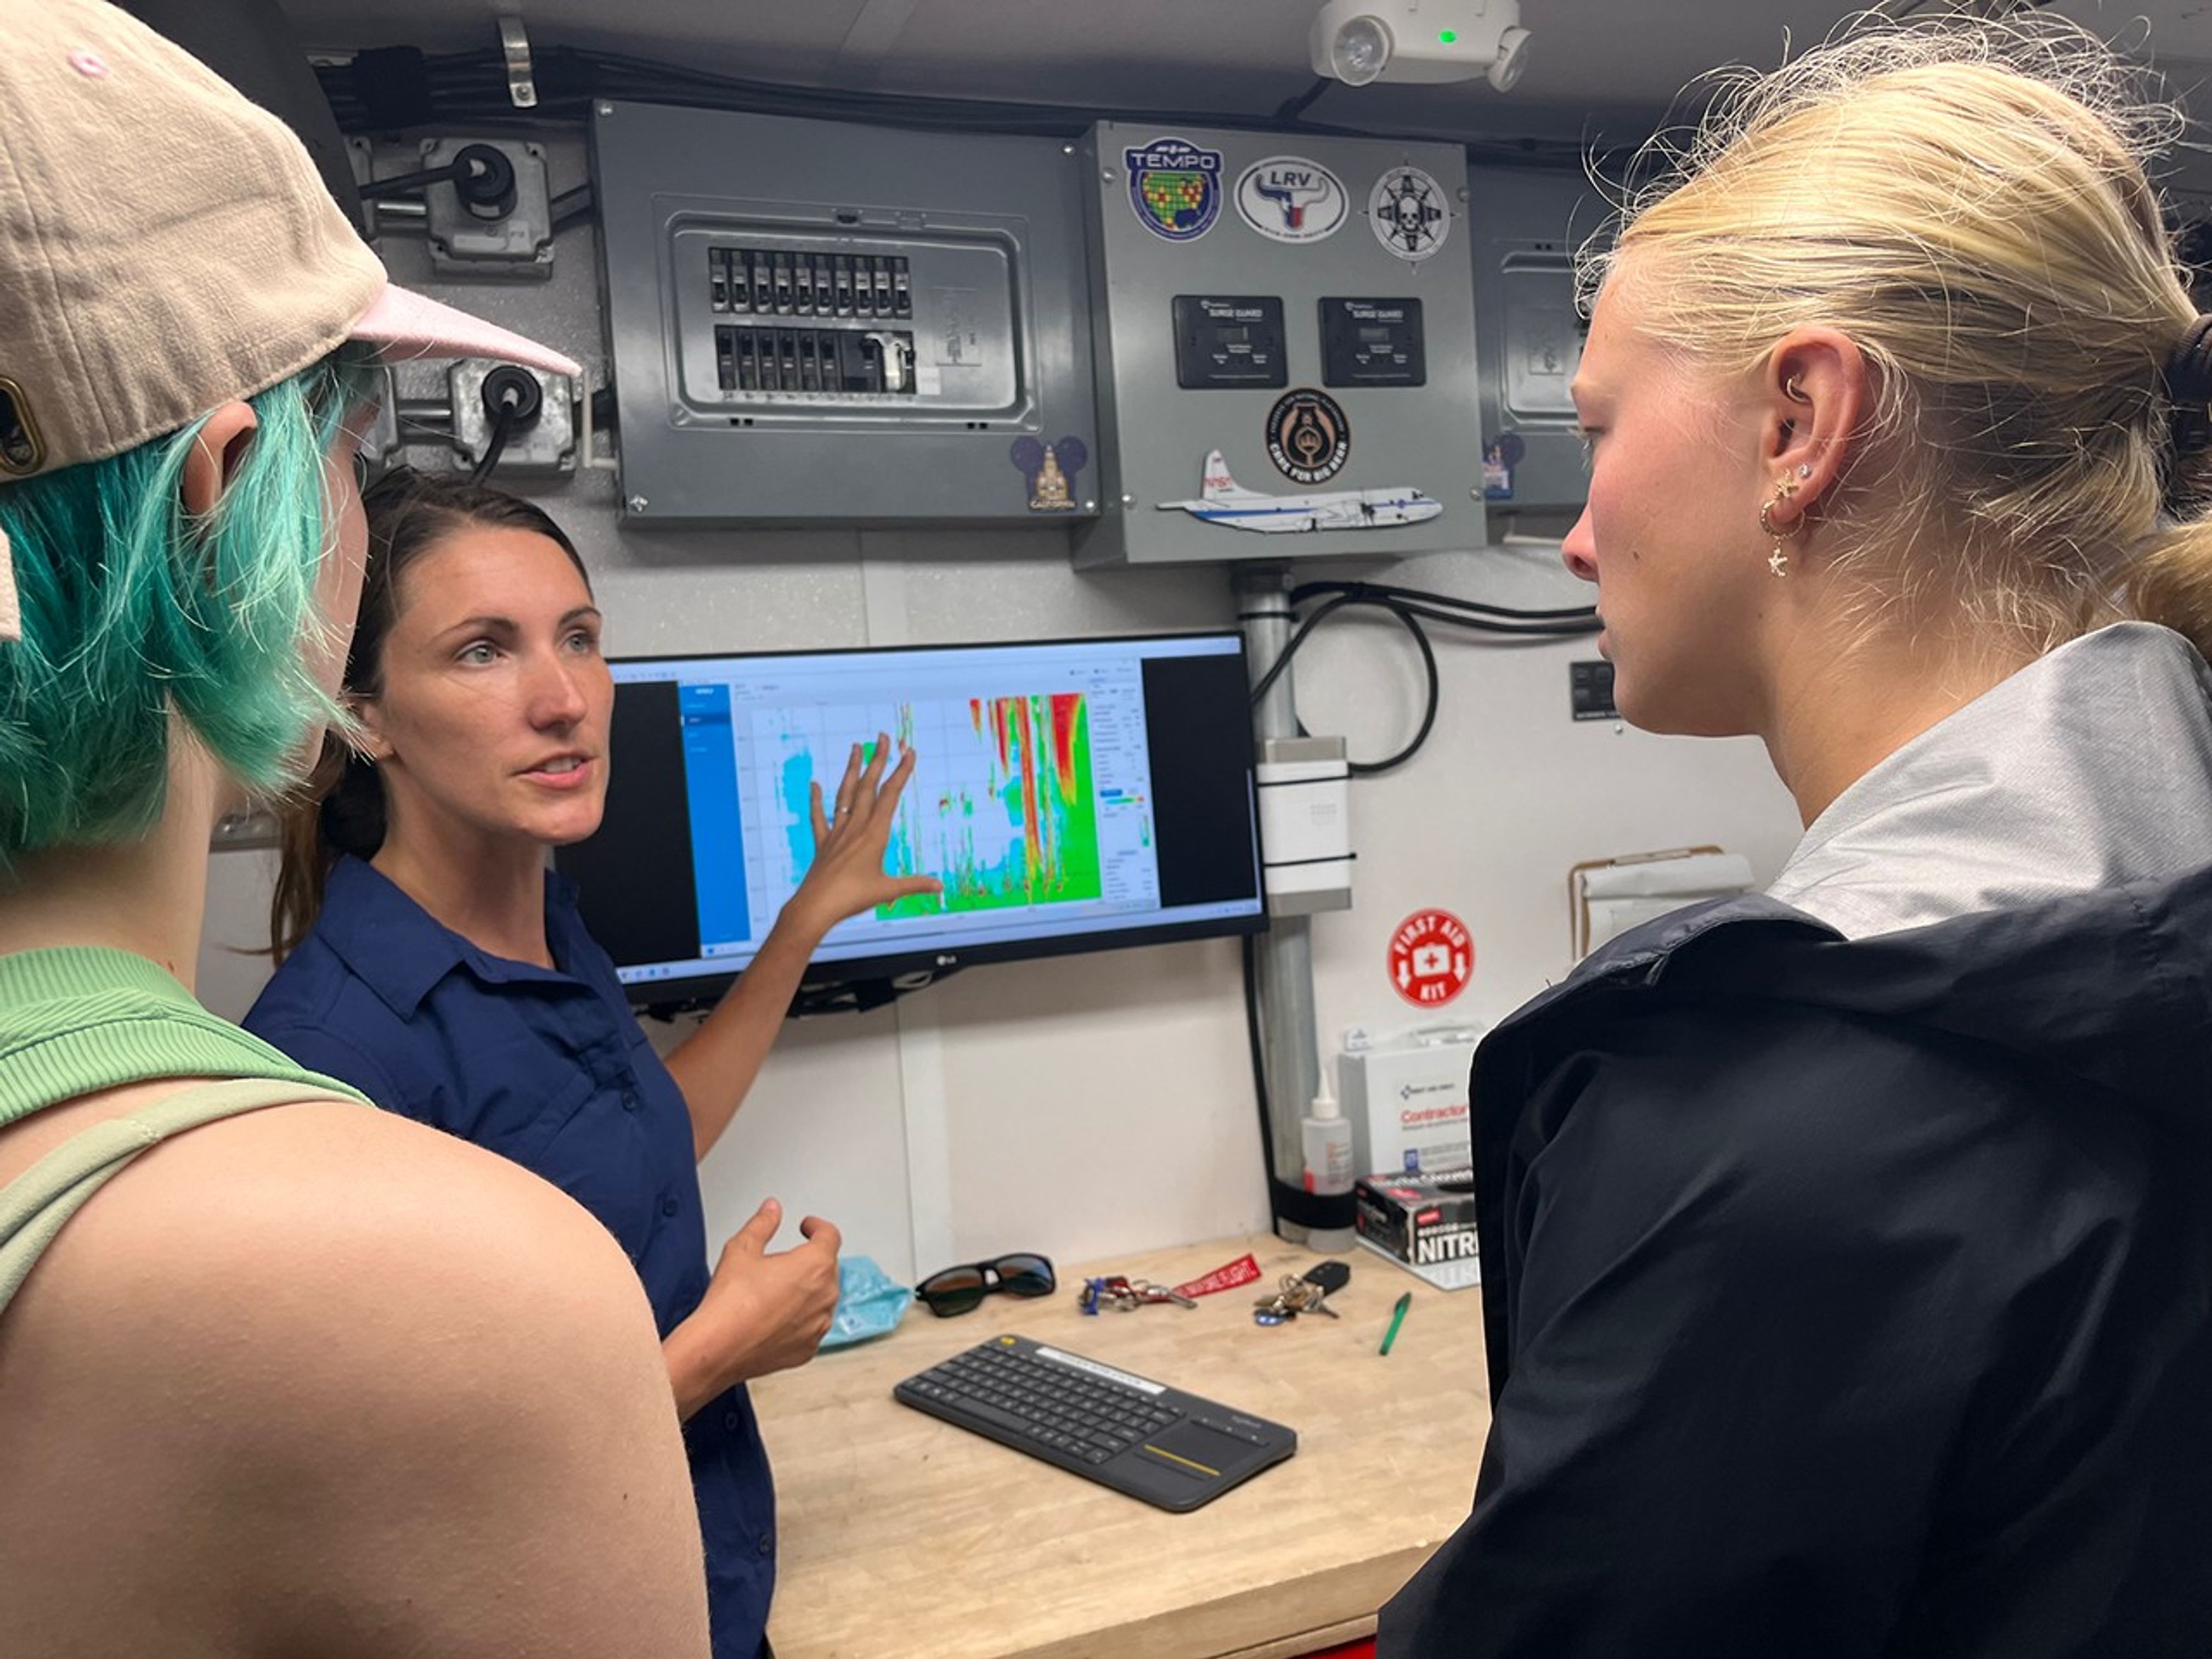
With the support of program mentors and faculty, and aboard the University of Houston’s Mobile Air Quality Laboratory (MAQL), the SARP interns participated in every step of the process.
Let’s set the scene: About 45 minutes away from this year’s SARP home base at the Lone Star Flight Museum in Houston, the MAQL drove down the Texas City Dike, a long strip of land jutting into the Texas Gulf Coast—an open space perfect for releasing the weather balloon. Among the 45 total students in the program, this group was assigned to meet the mobile lab at the balloon release location at 8 a.m. Central Time, just after a rainstorm rolled through.
Inside the lab, the students prepared ozonesondes for takeoff, completing the final steps that include measuring and pipetting cathode and anode solutions into the instrument cells attached to the sensor and testing each instrument’s response and baseline.
Outside the mobile laboratory, gusts of wind made it difficult to keep the balloon still while it was being filled with helium. Four students donned leather gloves to minimize oils from their fingers touching the balloon, which can make it pop faster after deployment. They wrangled the balloon while faculty advisor Travis Griggs, instructional assistant professor of atmospheric science from the University of Houston, filled it.
Five students worked together to keep the balloon from flying away as they strung it to the ozonesonde, protected in a small foam container.
After confirming the launch location, time, and expected flight path with the Federal Aviation Administration (just a phone call away), it was time to set the weather instrument free.
“It was like a fight to stay on the ground, with the balloon whipping around in the wind,” said Zayna Haider, SARP intern and atmospheric and climate science student from the University of Washington. “It just flew away as soon as we let it go.”
But the work had only just begun. The students huddled back inside the MAQL, monitoring data as long as the balloon kept sending it—until it popped or landed, whichever came first. Throughout the day, they repeated this process with two other balloons.
This day gave many SARP participants, just starting their science careers, their first glimpse at hands-on fieldwork that reached the edges of the atmosphere. Next, they would use this data and what they learned from the experience for their end-of-internship research presentation.
“This is beyond what I ever thought it could be,” Stevens said. “I’m super excited for the next seven weeks.”
The post Up, Up, and Away With Weather Balloons appeared first on NASA Science.

Wildfire smoke is stoking a new challenge for cleaner air. A NASA-supported study published Thursday found that, over the last decade, wildfires have worsened ground-level ozone pollution across much of the contiguous United States, creating unhealthy air far from active flames.
Wildfires have become an increasingly important contributor to ground-level ozone, or smog, across much of the United States, researchers report June 4 in the journal Science. Nationally, fires offset nearly four years’ worth of ozone-control gains, with larger setbacks in the West and Midwest.
Smoke often is associated with the soot, ash, and other fine particles that make the air look hazy. But wildfires also emit gases such as carbon monoxide, which can help form surface ozone in sunlight when other pollutants are present. Surface ozone is an invisible pollutant harmful to human health, plants, and crops. As smoke plumes travel and mix with other pollution, those reactions can drive ozone increases hundreds or even thousands of miles from active fires.
“NASA Earth observations, along with ground monitoring networks, help reveal air quality risks from wildfires that can cross state lines, giving air quality managers better decision-making information as wildfire smoke affects more communities,” said John Haynes, manager of NASA Earth Action’s Health and Air Quality program at the agency’s Headquarters in Washington. “This is a strong example of NASA science serving communities here in the U.S.”
High in the atmosphere, ozone shields Earth from harmful ultraviolet radiation. Near the ground, however, ozone can irritate lungs, worsen asthma and other respiratory diseases, and increase health risks for children, older adults, outdoor workers, and people with existing health conditions.
To track surface ozone changes, researchers turned to deep learning, a form of artificial intelligence that finds patterns across large datasets. They used it to build a first-of-its-kind dataset estimating daily surface ozone from 2003 to 2024 on a kilometer-by-kilometer grid — about 0.6 miles on each side — across the contiguous U.S. The work received support from NASA’s Health and Air Quality program and other NASA grants.
The scientists combined data from about 1,000 ground-based air quality stations with atmospheric model data, weather information, wildfire pollution data, and satellite-derived information, including products from the Visible Infrared Imaging Radiometer Suite (VIIRS) and the Moderate Resolution Imaging Spectroradiometer (MODIS) instruments.
Their analysis revealed two distinct periods. From 2003 to 2015, U.S. ground-level ozone generally declined as emissions of ozone-forming pollutants decreased. After 2015, however, those gains slowed or reversed in many places. By comparing estimated ozone levels with scenarios that removed wildfire influence, the researchers found that pollution from wildfires was a main factor in that shift.
Without the wildfire contribution, ground-level ozone in the Midwest, for example, would likely have continued to decline. Instead, wildfires erased about 5.3 years’ worth of ozone-control progress since 2015.
“People in the Midwest may think fires burning far away will not affect them,” said the study’s corresponding author Jun Wang, an atmospheric scientist at the University of Iowa in Iowa City. “But once wildfire pollution is in the air, it can move across regions. Pollution from one place can affect air quality in another.”
The study also found that wildfire-driven ozone increased exposure to unhealthy air and likely contributed to premature deaths. Premature deaths associated with long-term wildfire-related ozone exposure in the U.S. increased by an estimated 318 deaths per year after 2013, with the post-2013 average 46% higher than in the previous decade. The researchers calculated premature deaths using average lifespan, ozone exposure estimates, and population density.
The 2023 Canadian wildfires showed how widely those risks can spread, with smoke-driven ozone increases stretching across the Midwest and into parts of the Northeast and South. Overall, from 2022 to 2024, wildfires exposed an additional 43 million people in the U.S. to conditions that did not meet current federal air quality standards for ozone, the researchers estimated.
Capturing that national picture is difficult from ground monitors alone. Ground monitors remain the backbone of U.S. air quality tracking, but they do not cover every community. NASA’s scientifically validated satellite observations and models help researchers and agencies see air quality patterns across states, regions, and fire seasons.
That broader air quality work includes newer missions such as TEMPO (Tropospheric Emissions: Monitoring of Pollution). Launched in 2023, TEMPO is NASA’s first mission to use a space-based spectrometer to provide hourly daytime measurements of air quality over North America. Its view is sharp enough to distinguish pollution patterns, including surface ozone, across areas only a few square miles wide, a major improvement over earlier satellites.
Together, these capabilities help researchers and agencies see smoke-related ozone patterns that might otherwise be harder to detect, especially in rural and remote areas.
The work also points toward a practical use of NASA science during fire season. Wang’s team has used NASA support to develop FireAQ, a decision-support system that brings satellite observations, model forecasts, and fire and aerosol products into weekly briefings with state and local air quality officials. The goal is to help officials see where smoke-related pollution may move next and give communities better information.
Air pollution is a significant threat to human health and our environment. Instruments on NASA satellites, along with airborne and…

Landsat satellites monitor wildfire extent, burn severity, and post-fire recovery since the 1970s, helping managers assess damage, improve safety, estimate…

NASA Earth Science helps Americans respond to challenges and societal needs — such as wildland fires, hurricanes, and water supplies…

This is the story of the hole in Earth’s protective ozone layer: what it is, how it formed, and the…