❌

Normal view

NASA’s James Webb Space Telescope Spots a Hidden ‘Galaxy Killer’ Lurking in the Early Universe

13 June 2026 at 16:48


The James Webb Space Telescope (JWST) has revealed a cosmic catastrophe, as winds extinguished a star-forming galaxy in the early universe, offering new insight into earlier strange observations.

Cosmic winds may destroy entire galaxies, according to new JWST research exploring the lingering mystery of why certain parts of the universe are unexpectedly devoid of growth.

The findings were published in a recent paper in the Monthly Notices of the Royal Astronomical Society, revealing galactic-scale death in a universe just one billion years old, and potentially answering questions about previous troubling JWST observations.

James Webb Space Telescope Observation

Observations made by the JWST revealed cold gas, an essential star-forming material, blowing out of the CRISTAL-2 galaxy in a massive plume, severely degrading its ability to produce new stars. According to the researchers, it would take less than 50 million years for the galaxy to be completely dead if this activity keeps up, a mere blink in the scheme of a 13.8 billion-year-old universe.

Astronomers consider galaxies to be “dead” if they are no longer capable of producing fresh stars. Traditionally, astronomers expected that it would take billions of years for an old galaxy to slowly run out of fuel and burn out. However, JWST observations have continually captured events in the early universe that were not expected to occur until much later.

One of these was finding a host of dead galaxies in the early universe shortly after it first became operational in 2022. How galaxies could die so close to the beginning of the universe, without sufficient time to burn through their cold gas supplies, has long perplexed scientists.

Explaining Galaxy Death

As researchers began considering various explanations for the phenomenon, they initially settled on dark energy, essentially explaining one unknown with another. Dark energy is a theoretical substance that scientists believe drives the expansion of the universe and was once a stronger force than it is now. While the Dark Energy Spectroscopic Instrument survey revealed last year that dark energy appears to be weakening over time, an exotic galaxy-killer is not required, according to this latest research.

Instead, researchers offer a much simpler explanation of powerful cosmic winds in the remote past. Conventional thinking has it that such powerful winds could only be generated by a supermassive black hole, yet these new observations challenge that assumption.

JWST Reveals the Culprit

CRISTAL-02 is a galaxy still in the making, composed of several smaller galaxies in the final stages of merging into a single system. Because the early universe was far denser than it is today, such collisions were much more common. During these mergers, gravitational forces funnel vast amounts of gas toward the galactic centers, triggering intense bursts of star formation.

Observations of CRISTAL-02 by the James Webb Space Telescope and the Atacama Large Millimeter/submillimeter Array (ALMA) revealed a star formation rate roughly twice that of similar galaxies. Ironically, this extraordinary burst of stellar activity is also generating a powerful cosmic wind that is stripping away the very gas needed to form new stars.

Compounding the effect, many of the newly formed stars rapidly exhaust their fuel and end their lives as supernovae, producing additional outflows that further deplete the galaxy’s star-forming material.

Together, these processes appear capable of shutting down star formation far more quickly than astronomers previously believed possible. Going forward, ongoing JWST observations are likely to continue challenging astronomers’ assumptions, as more evidence indicates that nearly half of the early universe’s massive galaxies were interacting—a finding which also suggests early “galactic deaths” like these may not be all that rare, after all.

The paper, “Multiphase Images of a Powerful Supernova-Driven Wind in the Early Universe,” appeared in Monthly Notices of the Royal Astronomical Society on June 10, 2026.

Ryan Whalen covers science and technology for The Debrief. He holds an MA in History and a Master of Library and Information Science with a certificate in Data Science. He can be contacted at ryan@thedebrief.org, and follow him on Twitter @mdntwvlf.

Playing Pool with Planets

22 May 2026 at 17:00

artist's impression of hot Jupiter exoplanets

Each Jupiter-size planet in the galaxy falls into one of three distinct categories: hot, warm, or cold. A new study suggests that despite the apparent differences between these populations, they may have all formed from the same underlying dynamical process: a game of pool played at planetary scales.

A Diversity of Jupiters

Though our solar system has only one Jupiter-size planet, elsewhere in the galaxy we have found three different species of these massive gas giants. Cold Jupiters closely resemble their namesake and orbit far from their host stars; hot Jupiters are the opposite and are found whipping around their stars on extremely close-in orbits. In between these are the warm Jupiters, which tend to orbit in the intermediate space between 0.1 and 1.0 au.

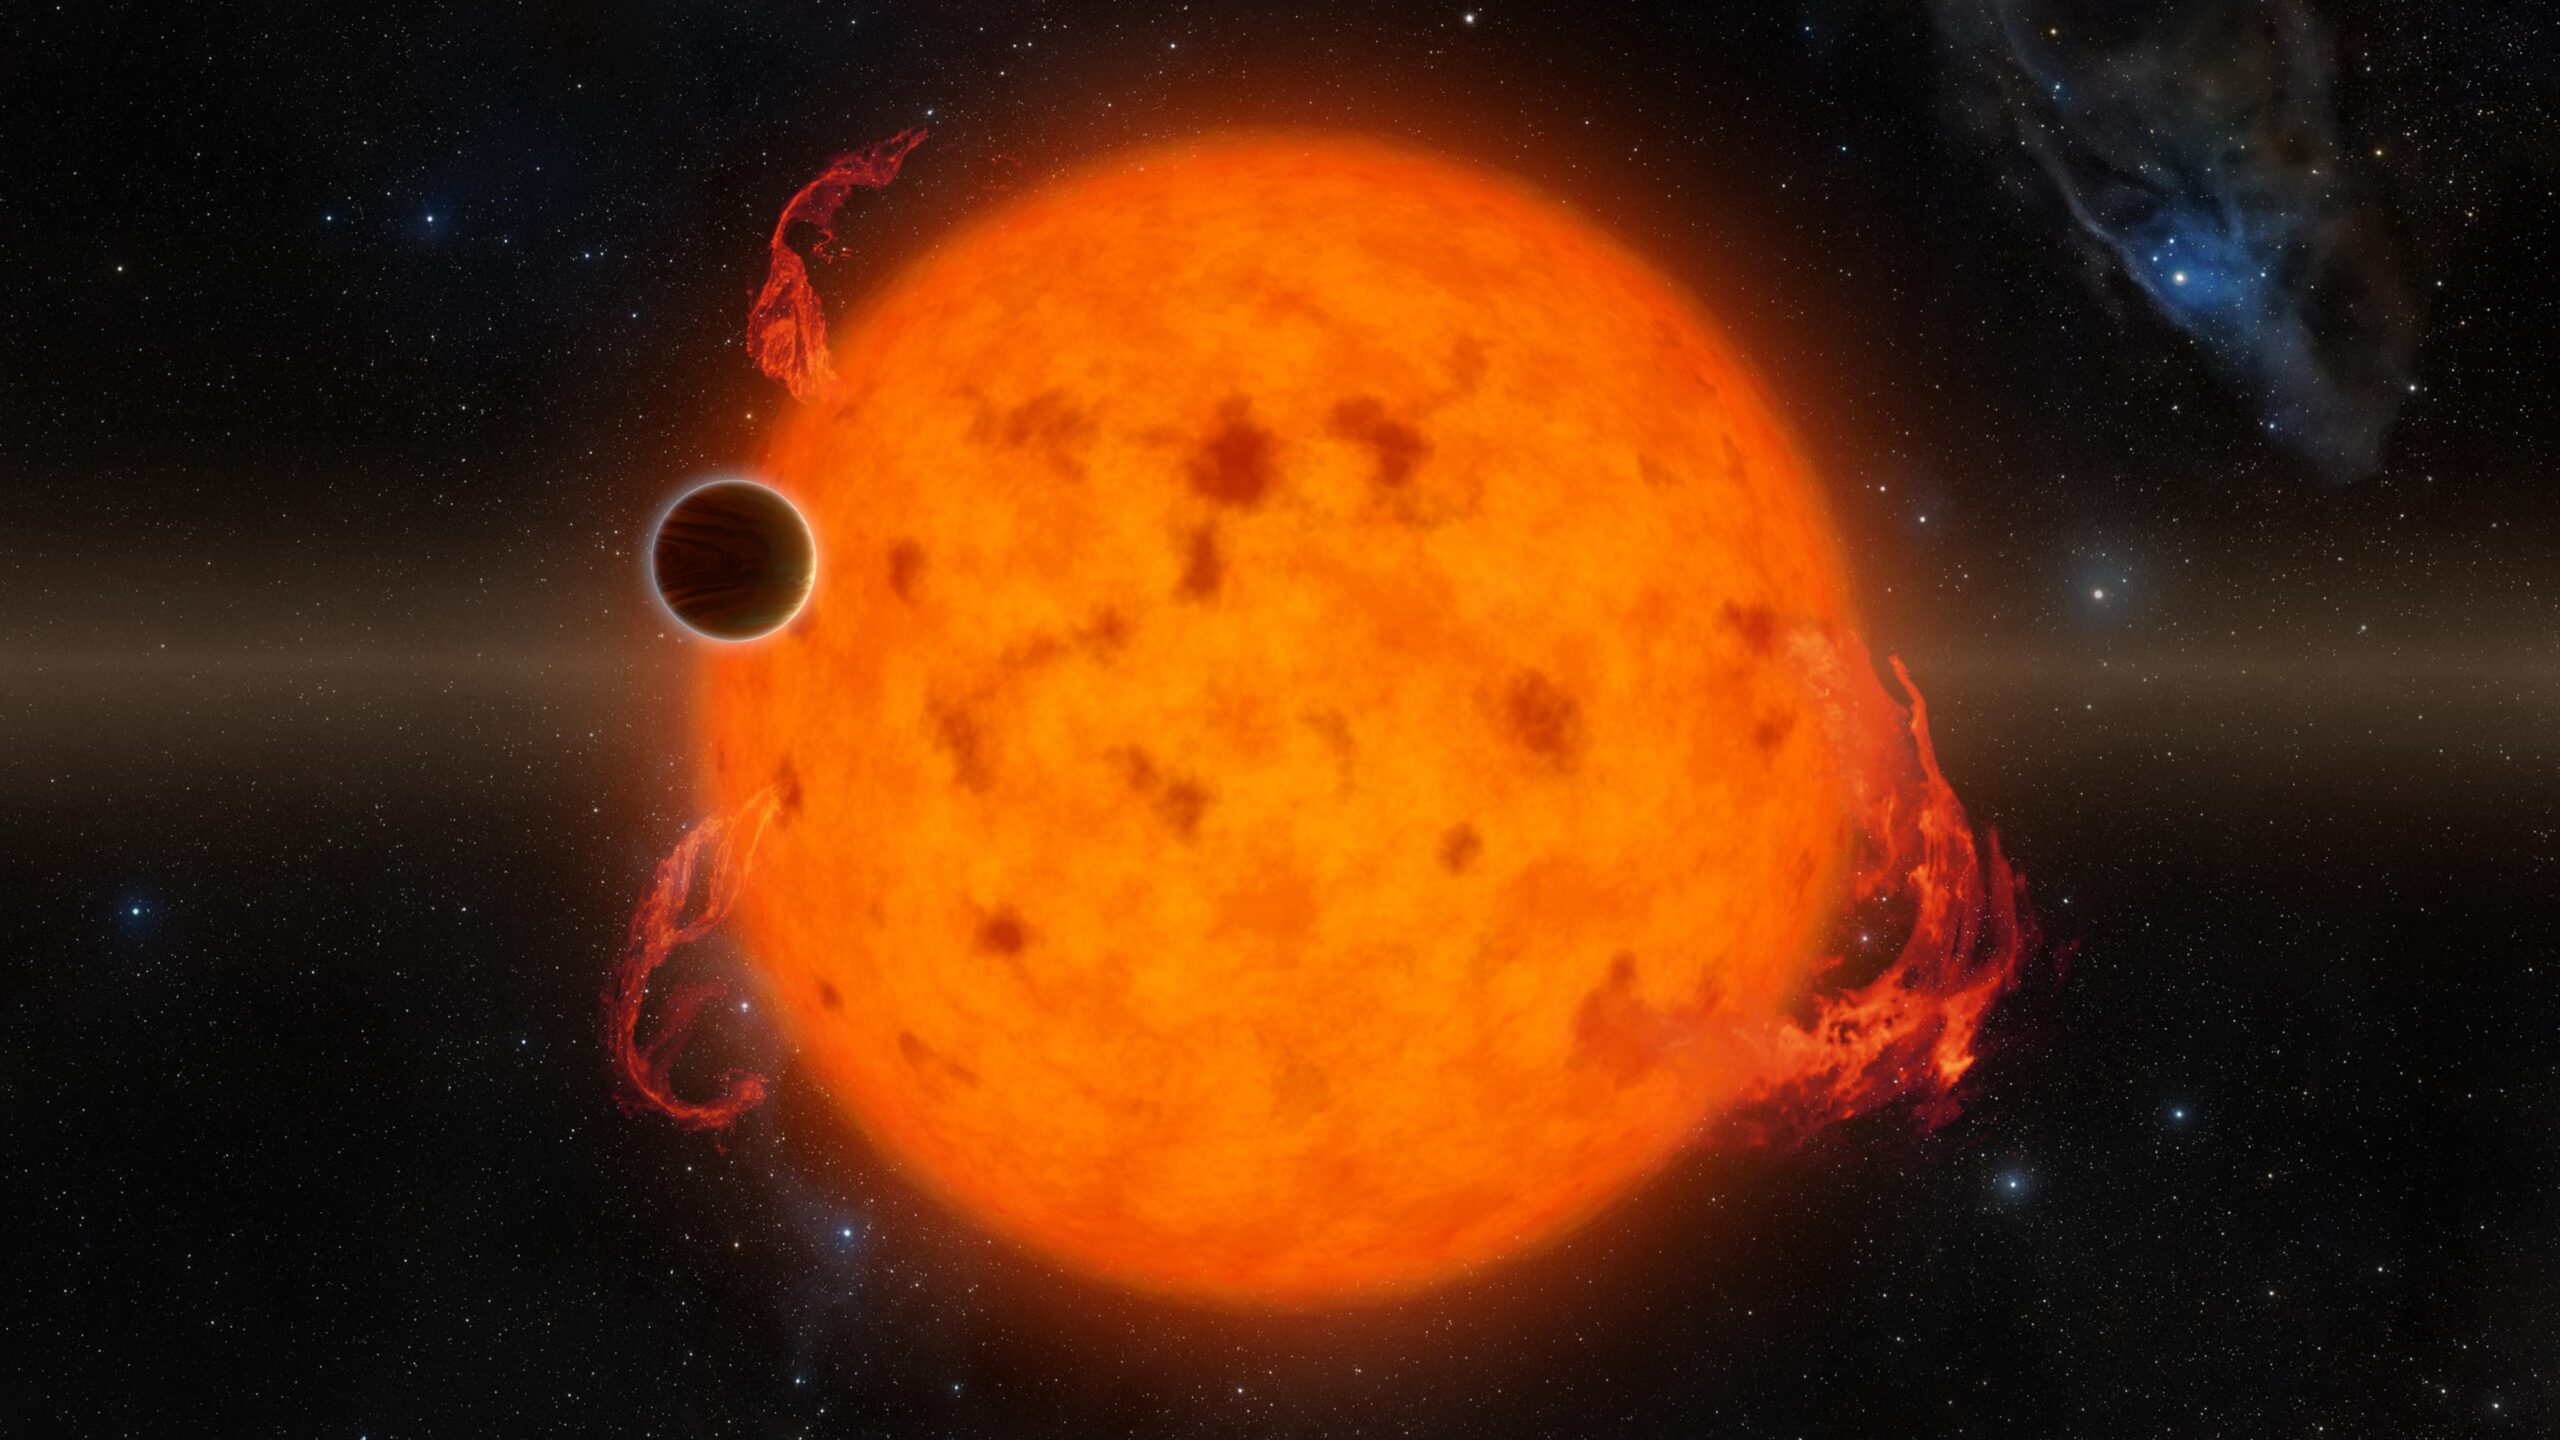
A rendering of a star with lots of spots and flares with a planet in the foreground.

An artist’s depiction of a hot Jupiter. These planets orbit extremely close to their host stars, but likely got to their locations by scattering inward from more distant orbits. [NASA/JPL-Caltech]

Though these three populations are defined by their orbital distances, they differ from each other in other ways as well. For example, hot Jupiters almost never have nearby companions; if there are any other planets circling the same star, they’re usually far-out cold Jupiters. They can also orbit in pretty much any direction, including opposite the direction of their star’s spin, and are usually on perfectly circular orbits. In contrast, warm Jupiters often have friends nearby, are much more aligned with their stars’ spins, and can have modest eccentricities.

Given these differences, it’s often thought that each of these populations arrived at its current location through different dynamical processes and that the history of the warm Jupiters is likely quite different from the history of the hot Jupiters. However, a new study led by Julia Esposito (Georgia Institute of Technology) has proposed an alternative view. Maybe these populations, though they appear different now, were all created by the same process: planet–planet scattering.

Virtual Planetary Billiards

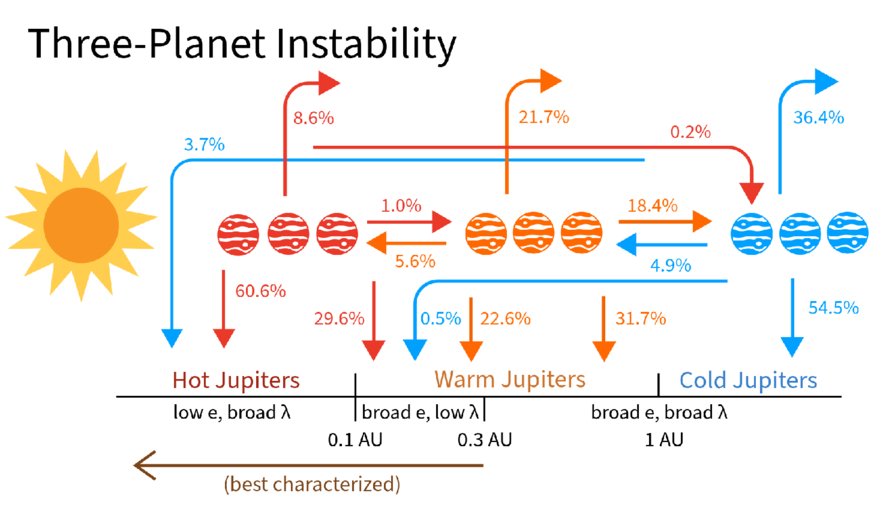
A cartoon of Jupiters at different distances from the sun with labelled arrows flowing inwards and outwards from each.

A schematic showing where different planets ended up as a function of where they scattered from during their evolution. Click to enlarge. [Esposito et al. 2026]

Esposito and collaborators set up 1,500 virtual planetary systems with three massive planets each, then simulated how the orbits evolved before probing the final configurations. In crucial contrast to previous simulation studies, the team initialized their Jupiters across a range of different distances and included the effects of tides sapping energy from orbits of planets that got too close to their host stars.

At the end of the simulation, the team surveyed the digital carnage. Almost every virtual system ended with only two planets after either ejecting one away from the star or having two planets collide. But, remarkably, the remaining two-planet systems looked tantalizingly similar to what we actually observe, with a mix of hot, warm, and cold Jupiters. Even more exciting, the end populations were highly correlated to where the violent scattering event took place.

For example, the warm Jupiters were almost all produced by “warm scattering” simulations, where the scattering took place between 0.1 and 1.0 au. The planets that survived the simulations and ended up as warm Jupiters matched all of the properties of the real warm Jupiter population: they had nearby companions, were moderately eccentric, and were mostly aligned with their stars. The hot Jupiters, meanwhile, were almost all produced by “cold scattering” events where the flybys happened far from the star and resulted in one planet hurtling inwards. These also matched all of the observed properties of real hot Jupiters.

The researchers concluded that planet–planet scattering can produce both the warm and hot Jupiter populations so long as you let the planets scatter from a variety of different distances. This exciting theoretical insight, if correct, would mean that astronomers could stop searching for different pathways to create each population. Happily, this model also provides testable predictions, and the authors lay out how the theory could be supported or disproven with additional data. Through virtual experiments like these, astronomers continue to build up an understanding of how the wide range of planetary architectures observed across the galaxy came to be.

Citation

“Unified Formation Channel of Hot and Warm Jupiters via Planet–Planet Scattering,” Julia Esposito et al 2026 ApJL 1003 L3. doi:10.3847/2041-8213/ae61b0

The post Playing Pool with Planets appeared first on AAS Nova.

Hints for Massive Galaxy Evolution from Dusty Star-Forming Galaxies

15 May 2026 at 17:00

NGC 972

How do massive galaxies form and evolve? A recent study traces the stellar and dust distributions across evolutionary phases of massive galaxies to better understand how massive dusty star-forming galaxies fit into the picture.

Dusty Massive Galaxies

Massive galaxies, like the Milky Way or even larger, undergo phases of active star formation and quiescent phases of inactivity, but exactly how these galaxies evolve through these stages is not yet fully understood. Dusty star-forming galaxies, which are undergoing a period of intense star formation and shrouded in dust, might be the missing evolutionary step between star-forming and quiescent phases of massive galaxy evolution. 

Currently, the leading explanation for massive galaxy formation and evolution is inside-out growth — star formation and quenching start in the inner regions of a galaxy and progress outward. However, it’s not clear whether dusty star-forming galaxies also follow the favored inside-out pathway, or if they instead proceed outside-in, first growing their disks and then assembling a central bulge.

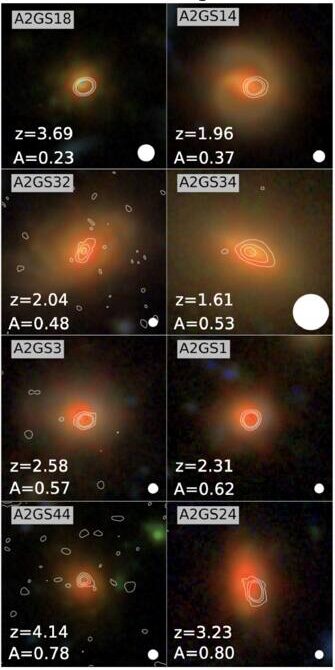
JWST NIRCam images

Example of JWST NIRCam images with ALMA contour lines overlaid for select dusty star-forming galaxies in the sample. [Modified from Bodansky et al 2026]

The spatial distribution (or morphology) of the stars and dust within dusty massive galaxies can help us trace their evolution. Thanks to high-resolution observations from JWST and the Atacama Large Millimeter/submillimeter Array (ALMA), researchers can now directly compare the morphologies of distant star-forming, quiescent, and dusty galaxies during the height of our universe’s star formation. Filling this gap will reveal how dusty star-forming galaxies may connect star-forming and quiescent galaxies in massive galaxy evolution.

Multiwavelength Morphological Comparisons

To directly compare the star and dust morphologies across massive galaxies, Sarah Bodansky (University of Massachusetts, Amherst) and collaborators selected a sample of 33 dusty star-forming galaxies from the GOODS-ALMA 2.0 survey that searched the sky for 1.1-mm dust emission as well as star-forming and quiescent comparison samples drawn from JWST observations. Combining the ALMA survey data with JWST imaging, the authors studied the rest-frame optical (stars) and rest-frame near-infrared (dust) morphologies of dusty, star-forming, and quiescent galaxies at redshifts around cosmic noon (a few billion years after the Big Bang).

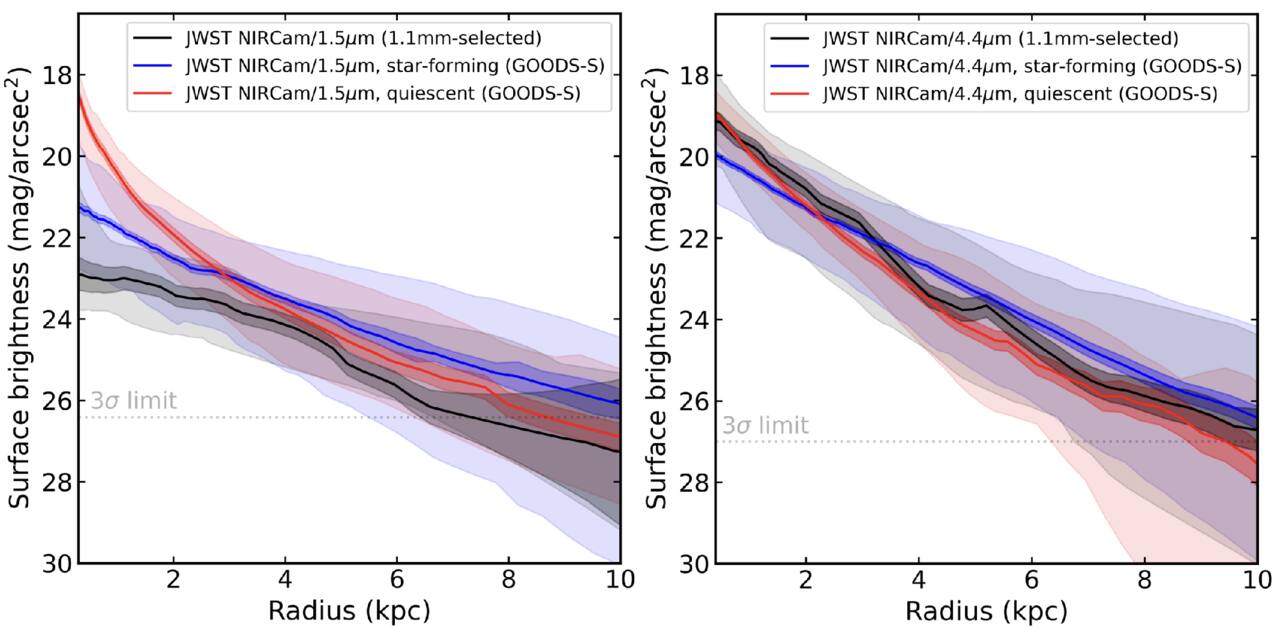
When comparing optical morphologies, the authors found that dusty star-forming galaxies and typical star-forming galaxies had similar distributions, but their near-infrared morphologies showed clear differences. Dusty galaxies tended to show more compact near-infrared emission, with dust tracing their stellar populations and more concentrated in the galaxies’ central regions. Though clearly different from star-forming galaxies, the authors noted striking similarities between the near-infrared morphologies of the dusty star-forming and quiescent galaxies, especially within their centers.

Surface brightness profiles

Average surface brightness profiles for the rest-optical (left) and rest-near-infrared (right) for the dusty (black), star-forming (blue), and quiescent (red) galaxies. In the near-infrared, the dusty star-forming galaxy profile appears very similar to the quiescent galaxy profile. [Bodansky et al 2026]

All of these properties suggest that dusty star-forming galaxies have built up stellar mass and dust in their cores, potentially forming a central bulge first and supporting an inside-out model of massive galaxy growth. This points to dusty star-forming galaxies as possible direct progenitors of early massive quiescent galaxies, hanging onto their last bit of star formation before becoming quiet as well. While this study morphologically distinguishes dusty galaxies from their star-forming and quiescent counterparts, future spectroscopic studies comparing the kinematics of these populations and investigations of molecular gas distributions are necessary to better pin down the evolutionary connection between star-forming, dusty, and quiescent massive galaxies.

Citation

“JWST+ALMA Reveal the Buildup of Stellar Mass in the Cores of Dusty Star-forming Galaxies at Cosmic Noon,” Sarah Bodansky et al 2026 ApJ 1001 235. doi:10.3847/1538-4357/ae4f64

The post Hints for Massive Galaxy Evolution from Dusty Star-Forming Galaxies appeared first on AAS Nova.

Feed the Fire, Fade the Metals

5 May 2026 at 17:00

galaxy cluster MACS J1149.5+2223

Editor’s Note: Astrobites is a graduate-student-run organization that digests astrophysical literature for undergraduate students. As part of the partnership between the AAS and astrobites, we occasionally repost astrobites content here at AAS Nova. We hope you enjoy this post from astrobites; the original can be viewed at astrobites.org.

Title: Metal-Poor Star-Forming Clumps in Cosmic Noon Galaxies: Evidence for Gas Inflow and Chemical Dilution Using JWST NIRISS
Authors: Vicente Estrada-Carpenter et al.
First Author’s Institution: Arizona State University
Status: Published in ApJ

If you want to reconstruct a galaxy’s life story, one of the best “fossil records” is its metallicity. In astronomy this refers to the abundance of elements heavier than helium, which are made in stars and returned to a galaxy’s gas through winds and supernovae. Over time, more star formation usually means more metals mixed into the gas.

Now zoom to Cosmic Noon (roughly when the universe was most actively forming stars). Many galaxies in this epoch look “clumpy”; their star formation is concentrated in several bright knots scattered across the disk. The big question is where those clumps come from. Do they form from the galaxy’s own gas via internal disk instabilities, or do they light up when fresh, metal-poor gas flows in and both fuels star formation and dilutes the local metallicity?

The authors try to answer that question with JWST by measuring the metallicity of each clump relative to its immediate surroundings, rather than comparing clumps to a single galaxy-wide number (which can be misleading if the galaxy has a metallicity gradient).

They use JWST/Near Infrared Imager and Slitless Spectrograph (NIRISS) slitless grism spectroscopy from the CAnadian NIRISS Unbiased Cluster Survey (CANUCS) to study 20 lensed galaxies at redshift 0.6 < z < 1.35. (Lensing effectively acts like a zoom lens, helping to resolve smaller structures.) They focus on emission lines that trace star-forming gas, especially Hα (a star formation tracer) and sulfur lines [SII] and [SIII] (needed for their metallicity method).

Slitless spectra come with a headache: because there is no slit, different parts of a galaxy can overlap in the dispersed image. To make reliable emission-line maps from slitless data, the authors use a forward-modeling code called Sleuth, which allows the continuum to vary across the galaxy.

The authors identify clumps using the Hα map together with rest-frame ultraviolet imaging because these tracers are sensitive to star formation on different timescales: Hα highlights gas ionized by the youngest massive stars, while ultraviolet light traces young stellar light over longer periods. As a result a clump can be bright in one and not the other, especially if dust is involved.

To estimate gas-phase metallicity, they use the “strong-line” method, which infers metallicity from ratios of bright emission lines calibrated using models and empirical samples. Their main diagnostic is S23 = ([SIII] + [SII]) / Hα. Because some line ratios also depend on the ionization state (how strongly the gas is being ionized by young stars), they also use the sulfur ratio S32 = [SIII]/[SII] as a check and iterate to a self-consistent solution.

So, Are Clumps Really Chemically Different from Their Surroundings?

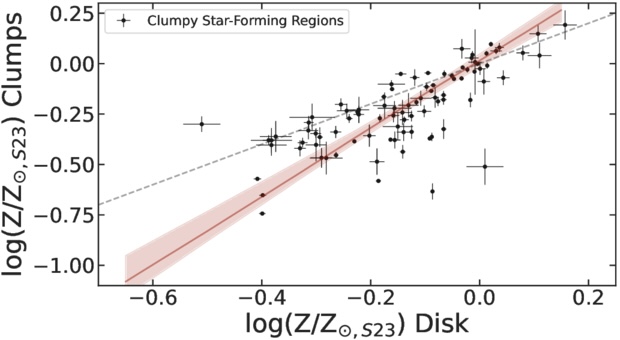
For each clump, the authors measure the metallicity inside the clump and compare it to an annulus just outside the clump (masking neighboring clumps to avoid mixing). When they plot “clump metallicity” versus “local disk metallicity,” most points fall below the 1-to-1 line, meaning the clumps are more metal poor than their surroundings (Figure 1). The mean offset is about 0.1 dex, which corresponds to roughly 20% dilution in the clump gas.

plot of gas-phase metallicity in star-forming clumps compared against metallicity of nearby disk regions

Figure 1: Each point compares a star-forming clump’s gas-phase metallicity to the metallicity of the nearby disk region immediately surrounding it. If clumps and disks had the same metallicity, they would lie on the dashed 1-to-1 line. Instead, most clumps sit below it, showing a typical ∼0.1 dex metallicity deficit, consistent with local chemical dilution. (The solid red line shows a best-fit linear trend to the clump measurement.) [Adapted from Estrada-Carpenter et al. 2025]

An extra wrinkle is that the galaxy medians hint at two populations: some galaxies have clumps with small offsets (near the 1-to-1 line), while others show larger offsets. The authors suggest this could mean two formation pathways, one dominated by internal gas reservoirs (smaller offsets) and another where inflow of metal-poor gas plays a bigger role (larger offsets). They are careful, though, as the sample is still small.

If inflow is really the driver, you should expect a link: the more strongly a clump is forming stars relative to its surroundings, the more diluted its metallicity should be. That is exactly what the authors find. The clumps that are most boosted in star formation are also the most metal diluted.

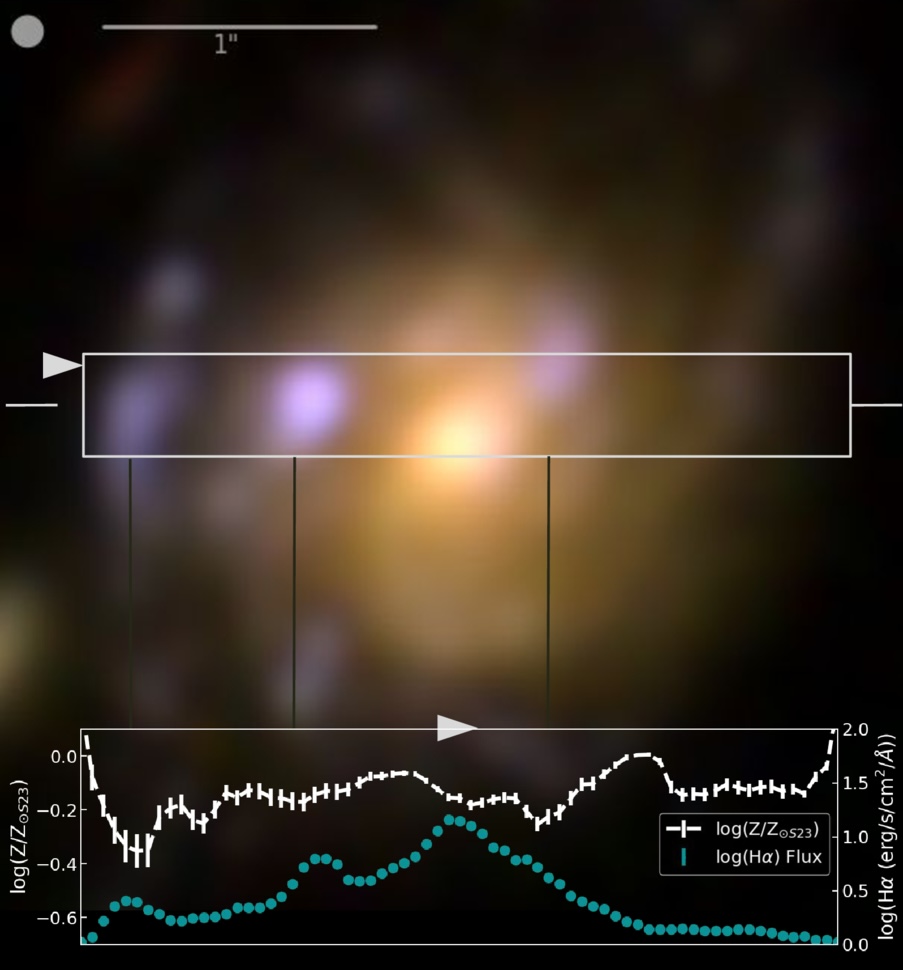
The article also emphasizes that clumps are not chemically uniform blobs. In at least one detailed example, the peaks in Hα (highest star formation) coincide with local minima in metallicity along a cut through the galaxy (Figure 2), suggesting internal star formation rate and metallicity gradients that reinforce the same story, intense star formation goes hand in hand with lower metallicity in the clump regions.

galaxy image showing spatial variation of H alpha and metallicity

Figure 2: Example galaxy from this study illustrating the clump-scale link between star formation and metallicity. The color image shows the galaxy with a rectangular strip marking the region used for a 1D cut. In the bottom panel, the turquoise line shows the Hα flux (a tracer of recent star formation), while the white line shows the metallicity along the same cut. Peaks in Hα flux line up with local dips in metallicity, showing that the brightest star-forming clumps are also the most chemically diluted compared to nearby regions. [Adapted from Estrada-Carpenter et al. 2025]

Are These Clumps Really “In Situ,” or Could They Be Small Satellites?

A reasonable alternative is that some clumps are actually small companion galaxies projected onto the disk. These could also look metal poor, because low-mass galaxies tend to be low metallicity. The authors look for evidence using face-on systems and find that more massive clumps tend to sit closer to galaxy centers, which is consistent with in-situ clumps that form in the disk and migrate inward, though it does not rule out satellites. They argue that kinematics from JWST/NIRSpec IFU will be needed for a definitive separation.

Why This Matters

Gas inflow, star formation, and feedback, together known as the baryon cycle, are key drivers of how galaxies grow. What this article adds is a spatially resolved view that compares each clump to its local environment, showing that regions of elevated star formation also tend to be locally metal poor. That pairing is hard to explain as a simple metallicity gradient or a galaxy-wide averaging effect, and it is exactly what you would expect if at least some clumps are being fueled by relatively metal-poor inflows. In short, these clumps may be snapshots of galaxies refueling in real time.

Original astrobite edited by Ryan White.

About the author, Niloofar Sharei:

I’m an astronomy PhD candidate at UC Riverside studying how galaxies grow through star-forming clumps. I track how these clumps emerge, evolve, and sometimes survive long enough to reshape their galaxies. When I’m not thinking about cosmic blobs, I’m reading, hiking, or listening to Bach.

The post Feed the Fire, Fade the Metals appeared first on AAS Nova.

Observing the End of Star Formation in Galaxies

14 April 2026 at 17:00

galaxy transitioning from star forming to quiescent

Editor’s Note: Astrobites is a graduate-student-run organization that digests astrophysical literature for undergraduate students. As part of the partnership between the AAS and astrobites, we occasionally repost astrobites content here at AAS Nova. We hope you enjoy this post from astrobites; the original can be viewed at astrobites.org.

Title: Searching Within Galaxies for the Earliest Signs of Quenching With Spatially Resolved Star Formation Histories in UVCANDELS
Authors: Charlotte Olsen et al.
First Author’s Institution: New York City College of Technology
Status: Published in ApJ

How and Why Do Galaxies Stop Forming Stars?

Galaxies serve as important laboratories for many subfields of astrophysics. As such, astrophysicists are interested in the full galactic life cycle, from how galaxies are born to the end of their formation. Whereas young galaxies in the distant universe are actively forming stars, many nearby galaxies are much quieter, with little or no ongoing star formation. Astronomers like to describe these galaxies as “red and dead” because their stars are older and therefore appear redder in color. The process by which galaxies shut down their star formation is known as quenching, and it causes galaxies to become quiescent. Understanding the origin of quiescent galaxies is a fundamental question in galaxy evolution. Studying this process is challenging, however, because star formation is intertwined with many other factors that shape galaxies, including their environments and supermassive black holes.

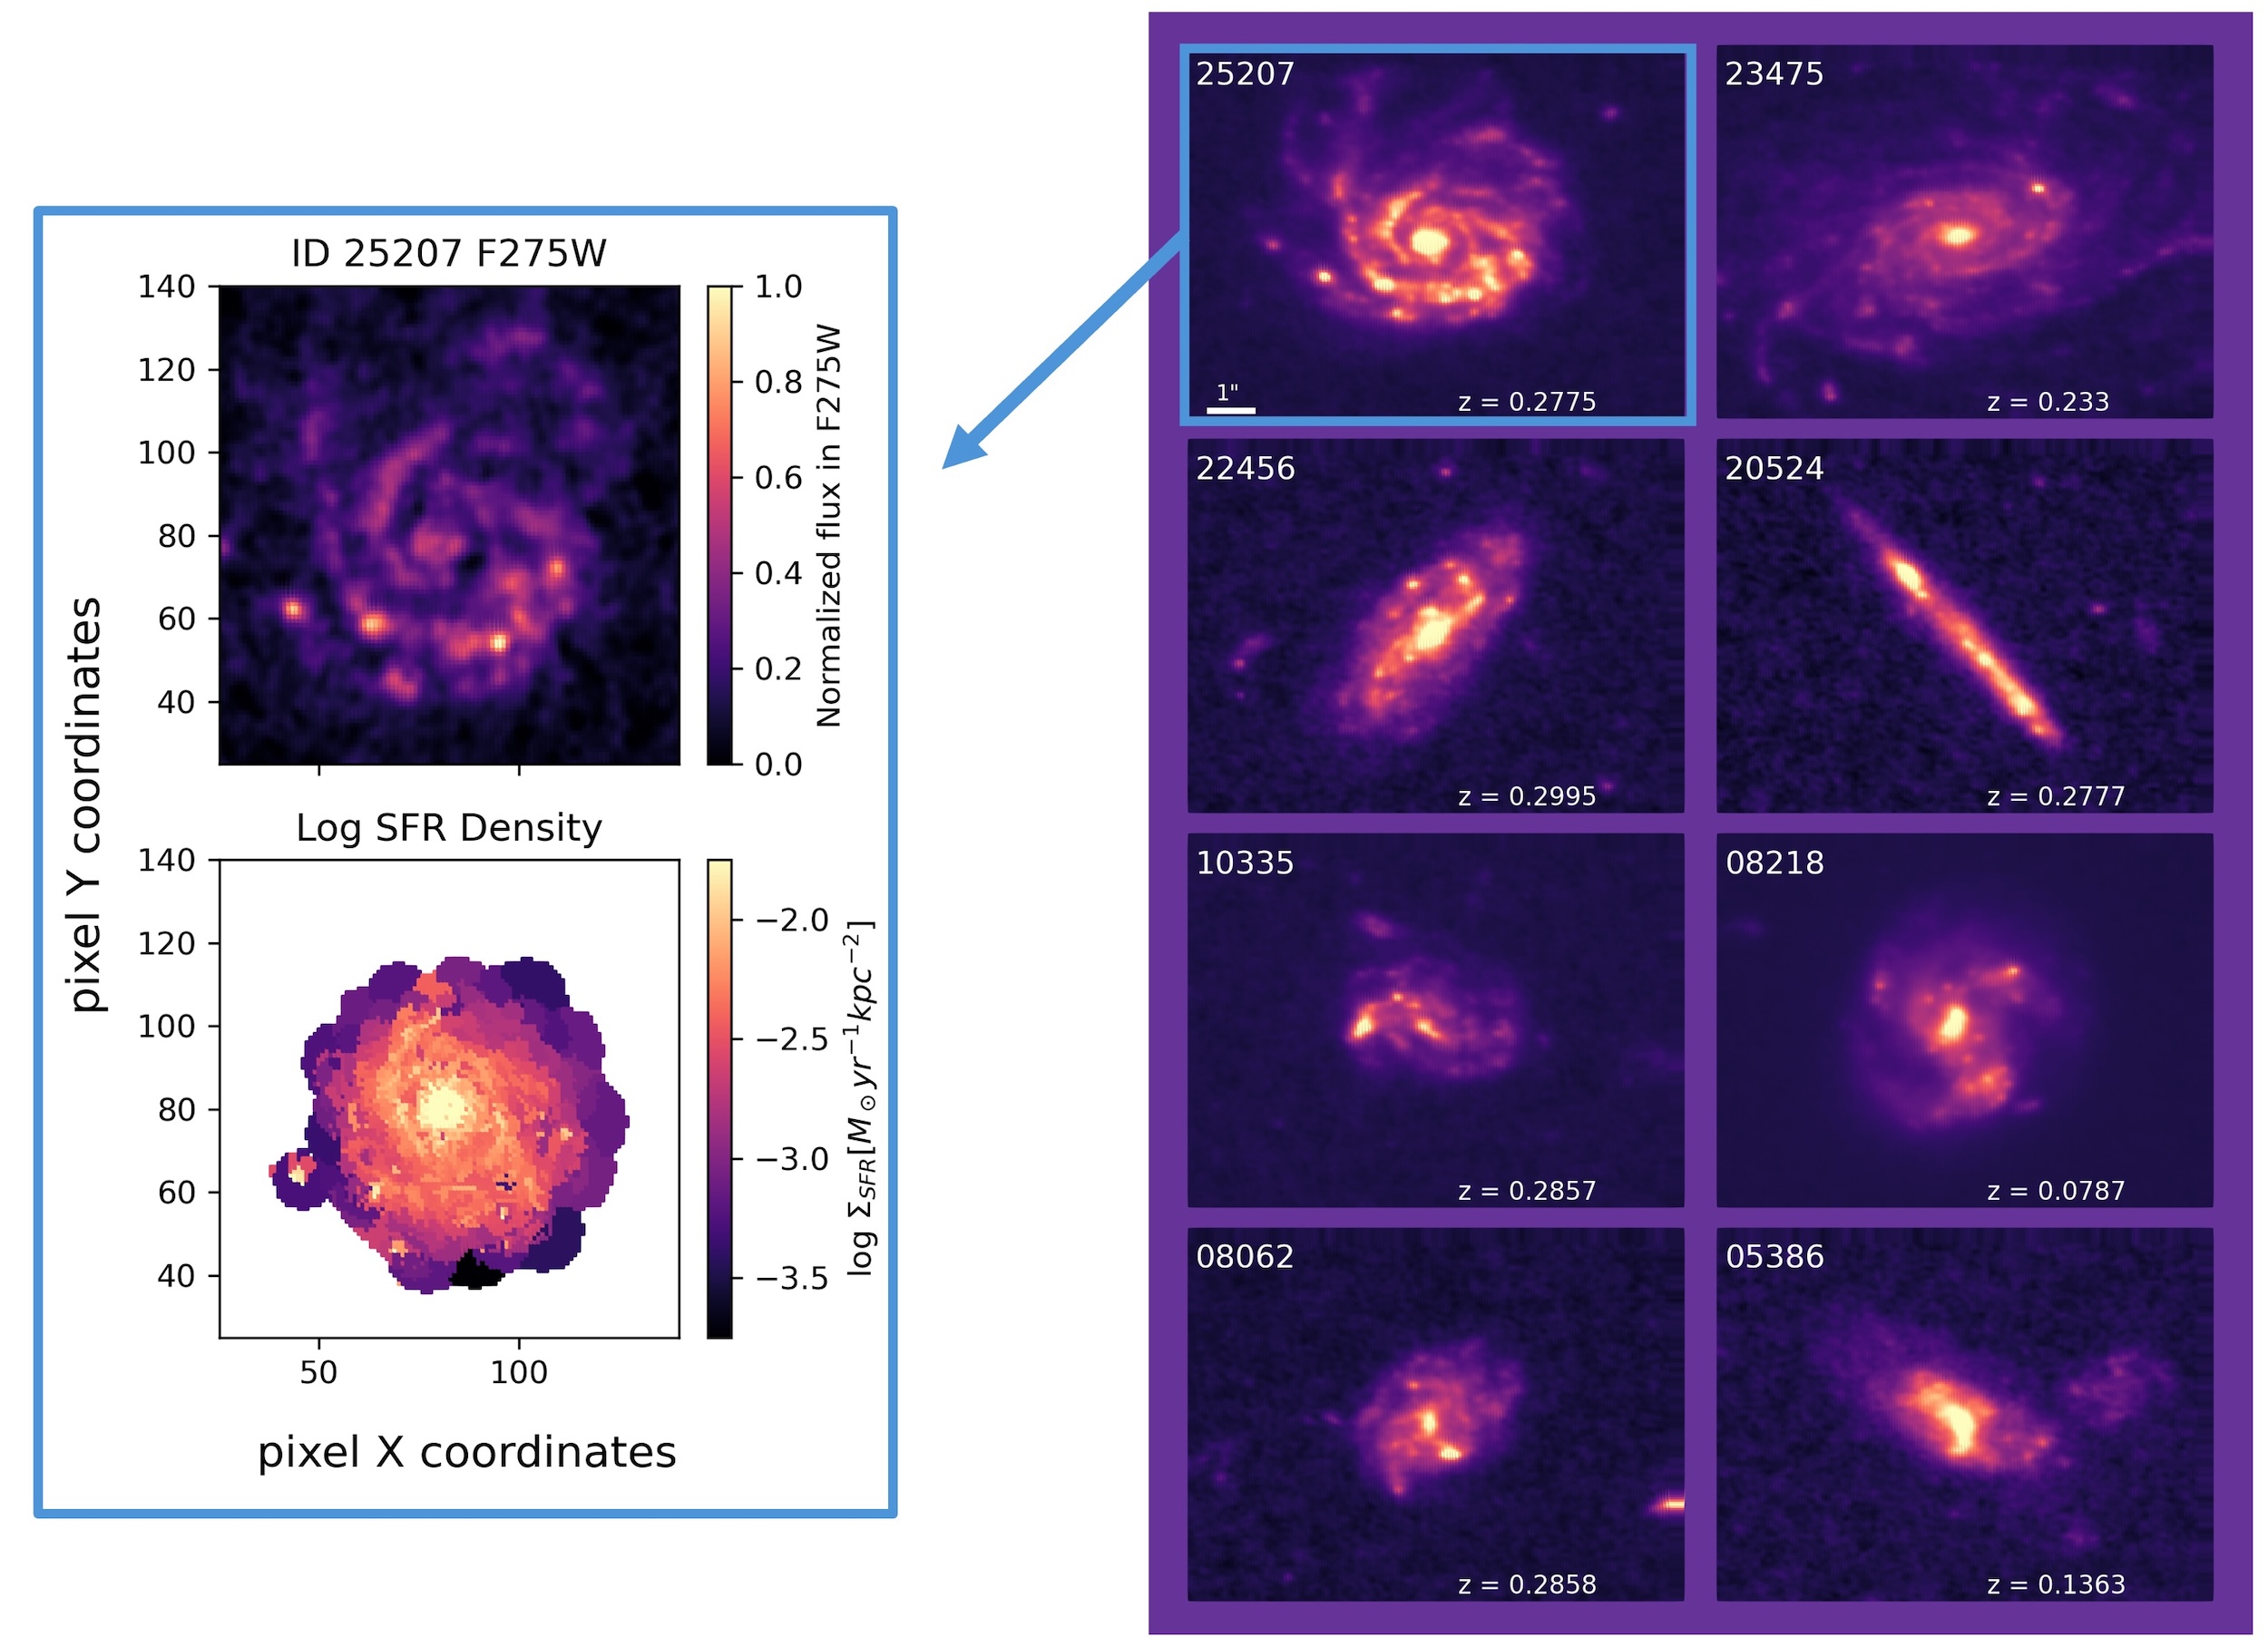
Star formation occurs on scales that are much smaller and over timescales much shorter than the global properties and overall lifetime of a galaxy. By observing star formation on these smaller scales over time, astronomers can gain a clearer picture of how star formation ceases in a galaxy, and they can determine whether this process is driven from the inside out — starting with the supermassive black hole in the galactic center — or from the outside in, influenced by environmental effects. In today’s article, the authors use the Cosmic Assembly Near-Infrared Deep Extragalactic Legacy Survey with high-resolution ultraviolet coverage (UVCANDELS) to examine eight “golden” galaxies, shown in Figure 1. They then reconstruct the star formation histories within small regions of each galaxy to detect the “earliest signs of quenching.”

galaxy sample from Olsen et al.

Figure 1: Images of the eight galaxies in the “Golden Sample” of galaxies studied in this work (right). These galaxies were chosen because of their clear detection, and they show a range of edge-on to face-on views as well as shapes. The authors divided each galaxy into small, resolved regions in which they measured the star formation (example shown on left). [Adapted from Olsen et al. 2026]

Characterizing the Star Formation Histories

To trace a galaxy’s star formation over cosmic time, today’s authors model its integrated light — which encodes the many episodes of past star formation — using spectral energy distribution (SED) fitting. By comparing a galaxy’s light across many wavelengths to computer models, SED fitting can estimate the ages of its stars and when they formed. This approach allows astronomers to study how a galaxy’s star formation rate evolves as a function of its stellar mass, known as the SFR – Mstellar relation. Note that the article considers the star formation rate and stellar mass in individual regions of each galaxy, so it analyzes these properties as surface densities, ΣSFR and ΣMstellar, instead of the total values.

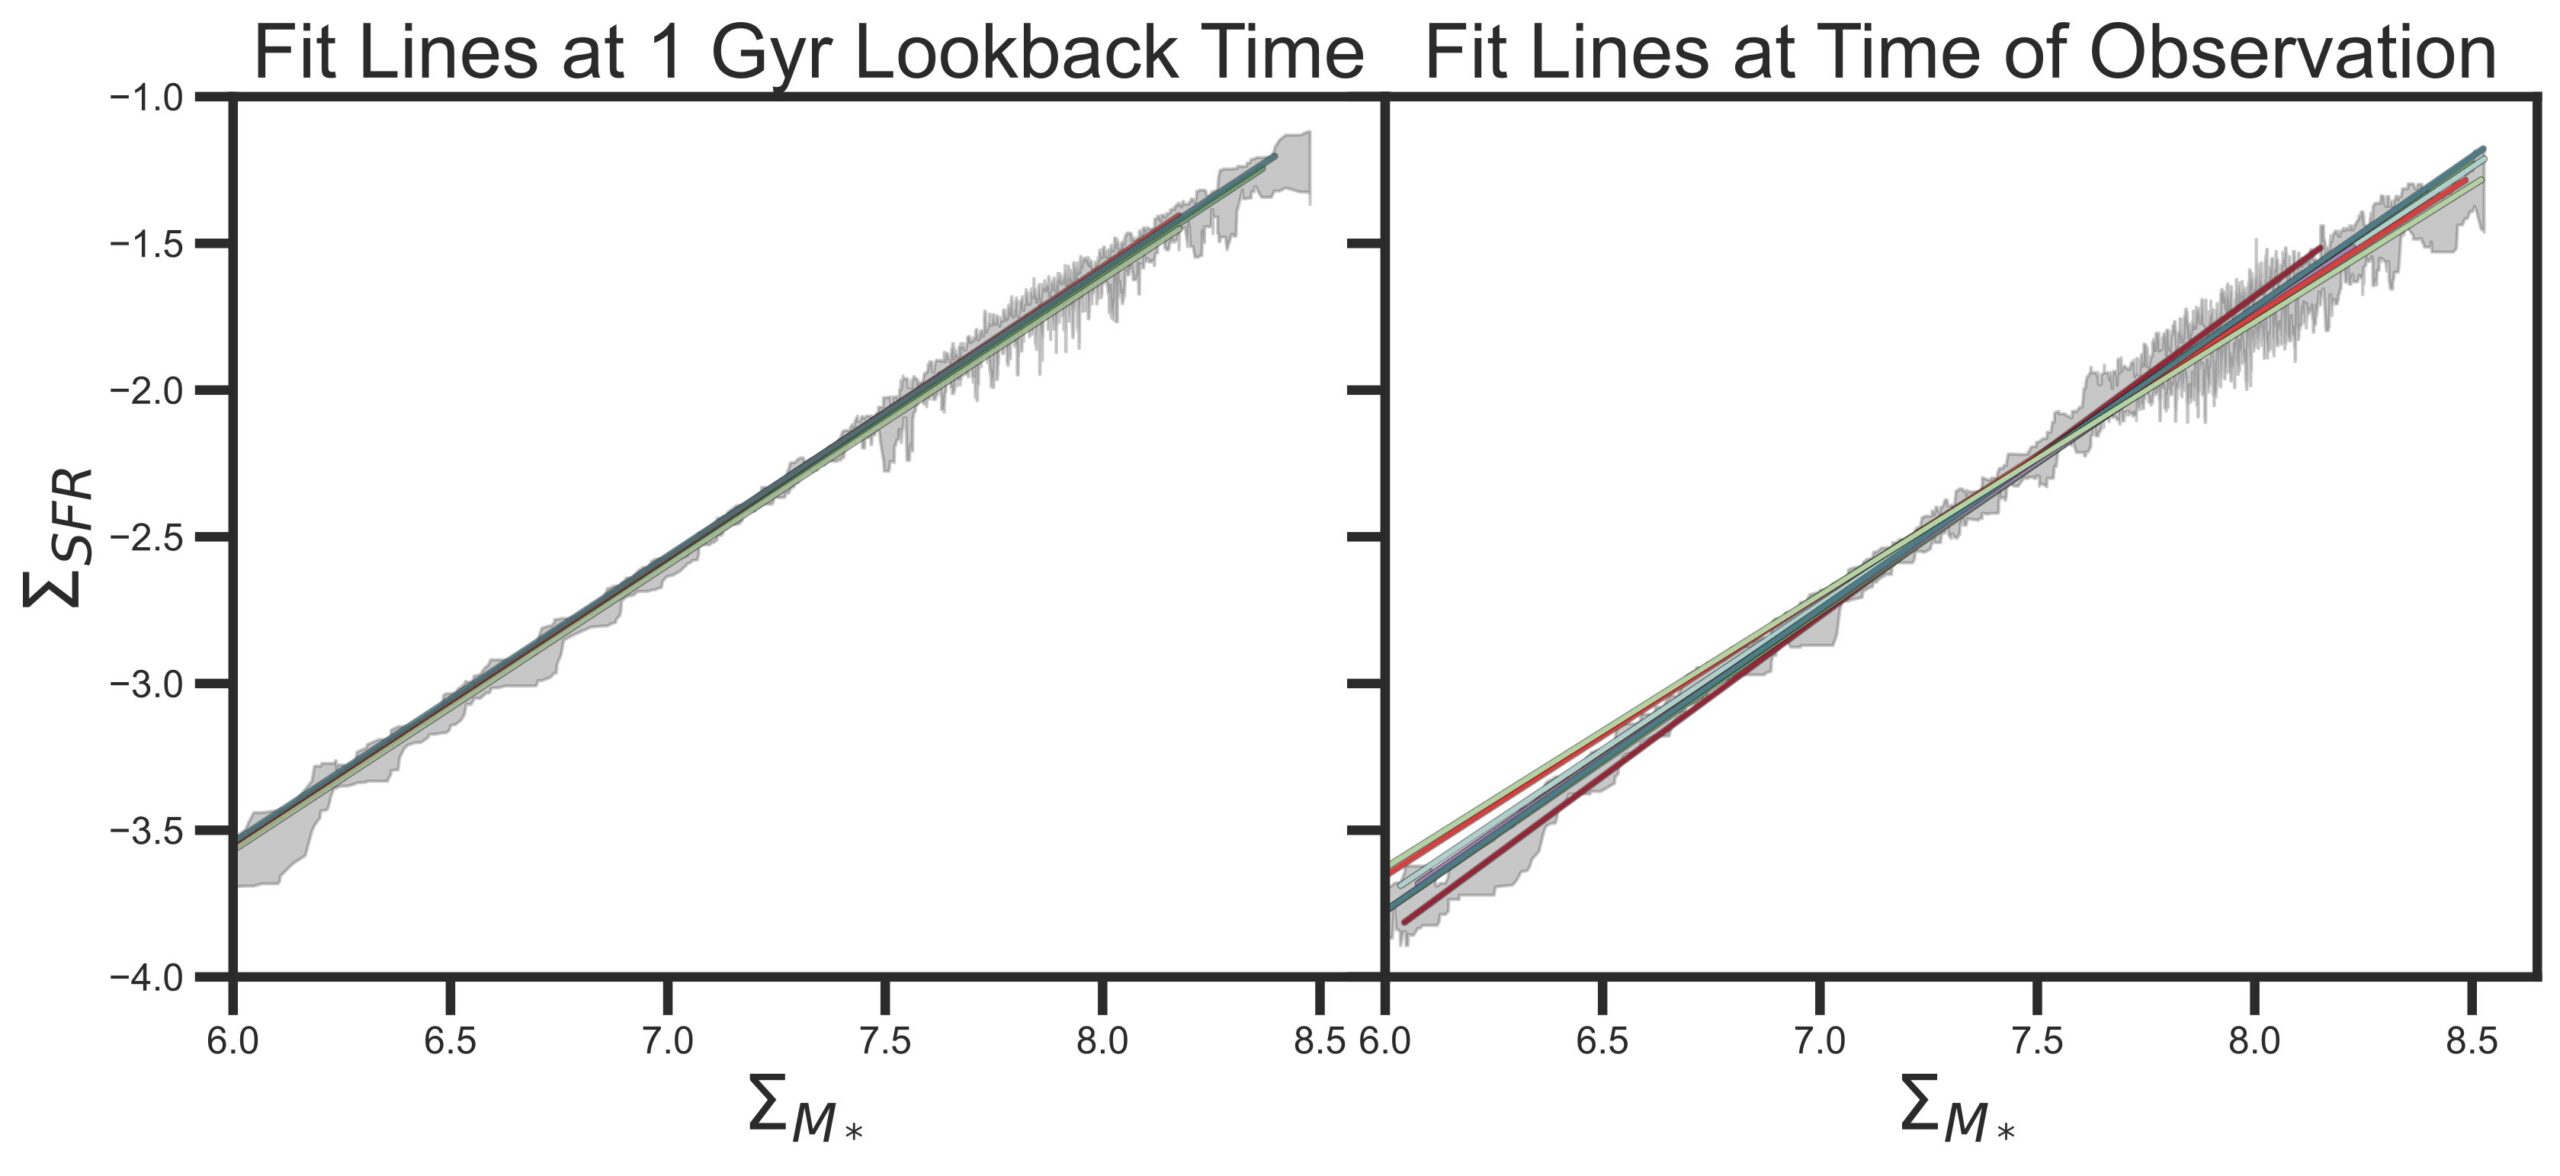
Using SED fitting, the authors determine the expected star formation rate and stellar mass of the regions from 250 million to 1 billion years before the time of observation. Figure 2 shows the line of best fit for the SFR – Mstellar relation of the regions for each galaxy, before and at the time of observation. The SFR – Mstellar relations are very similar across the sample 1 billion years before the observations; however, by the time of observation, the overall star formation rates have decreased slightly, indicating that the galaxies are beginning to quench. They also exhibit increased variation suggesting that each galaxy is quenching in a different way.

best-fit SFR – M stellar relation

Figure 2: The best-fit SFR – Mstellar relation of the regions for each galaxy, represented by the different colored lines, 1 billion years (1 Gyr) before and at the time of observation (left and right panels, respectively). At 1 billion years before the observation, the galaxies appear to have the same relation, but their variation at the time of observation suggests that the galaxies have begun quenching in different ways. [Olsen et al. 2026]

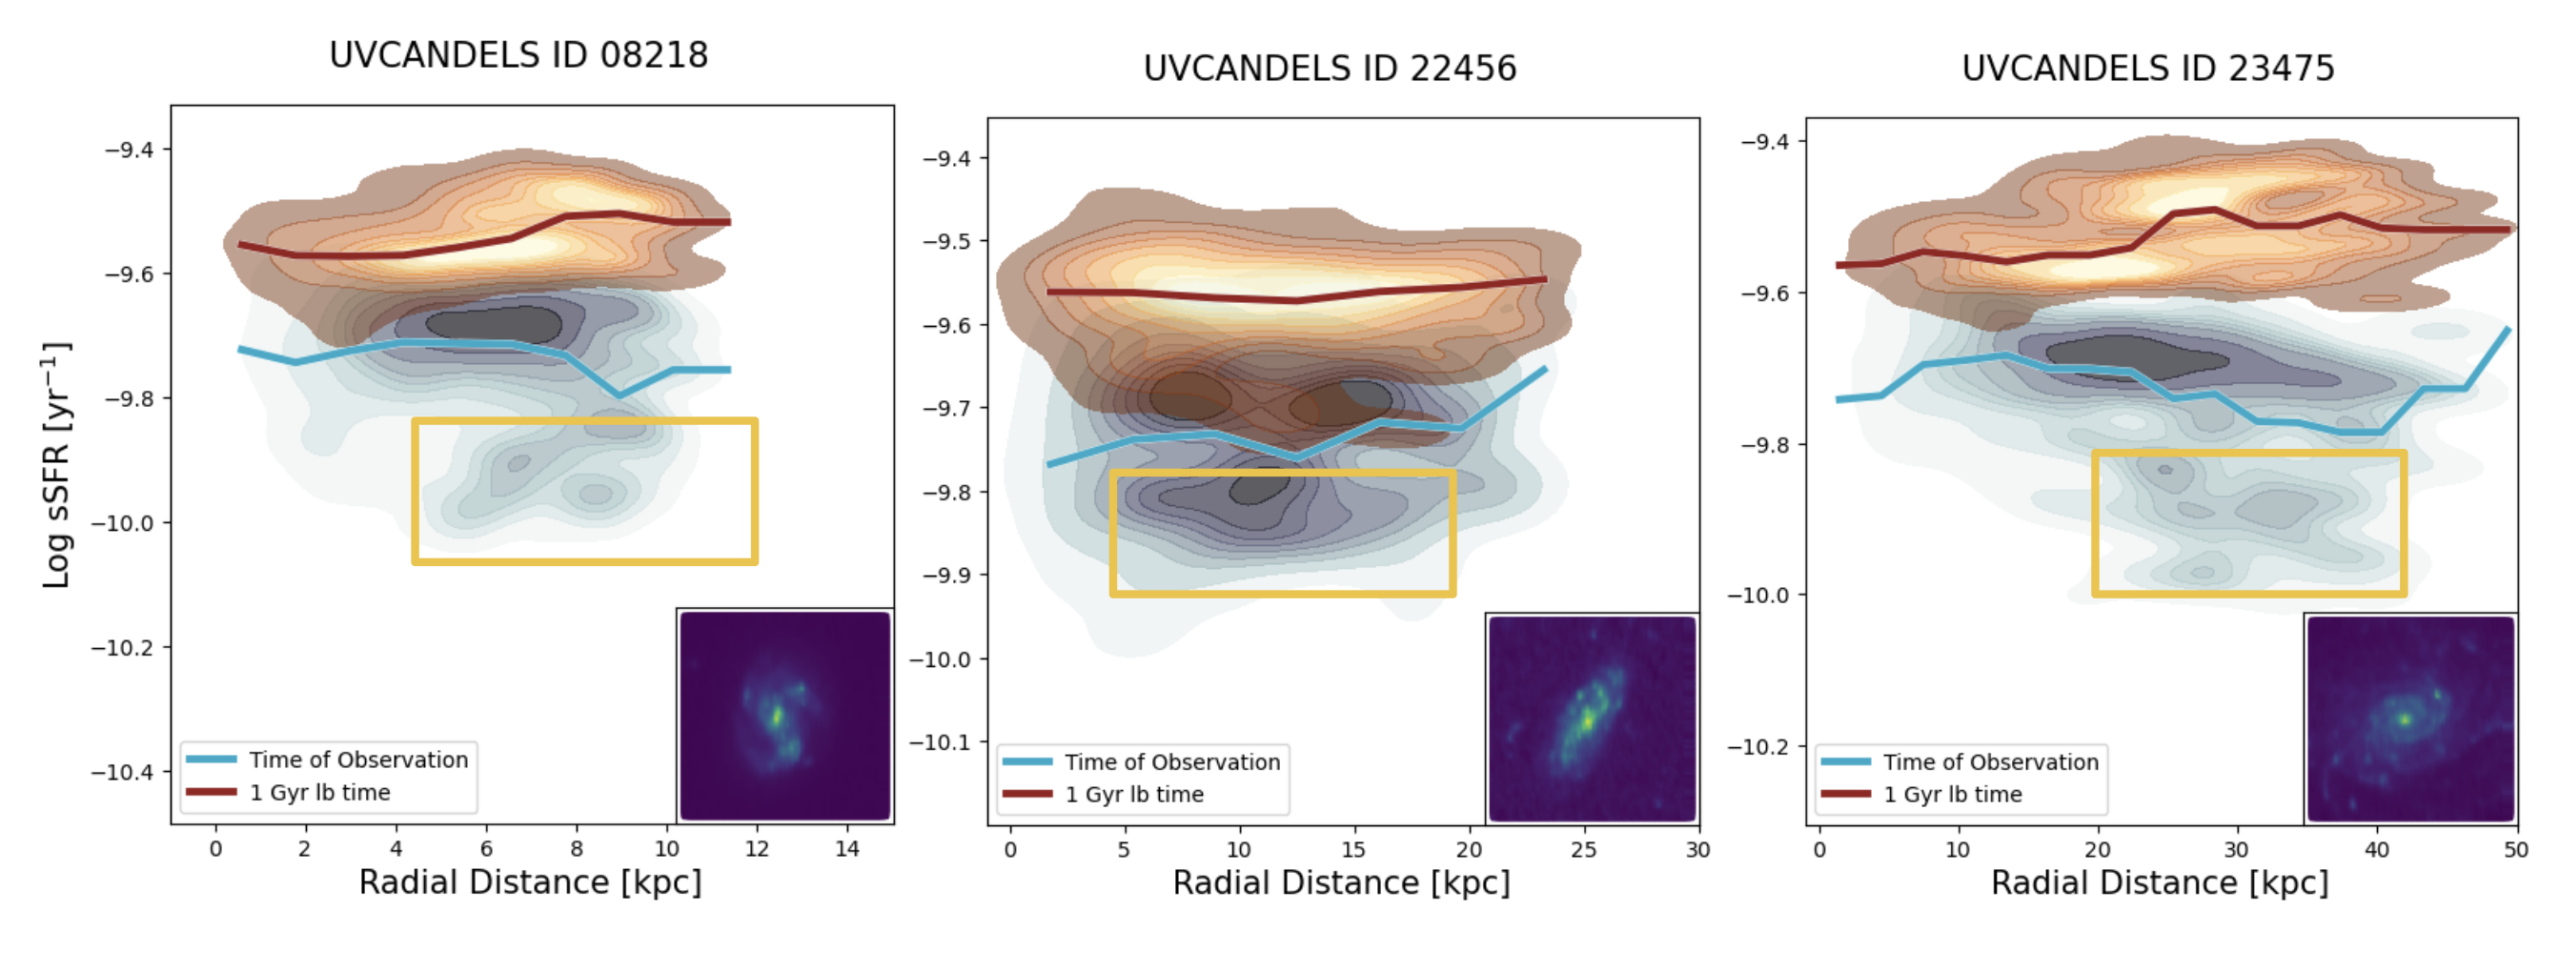
To further probe how these galaxies are starting to quench, the authors also measure the specific star formation rate (sSFR) of the regions as a function of their distance from the center of the galaxy. The sSFR can be thought of as the rate of new star formation relative to the amount of existing stellar mass: SFR /Mstellar. Figure 3 shows three examples from the galaxies studied in this work. Once again, the star formation rates of the regions decrease over the course of 1 billion years. However, the regions where the star formation rate has declined most rapidly differ from galaxy to galaxy — ranging from the central regions to the mid-disk to the outskirts — as each galaxy is undergoing a different quenching mechanism.
specific star formation rate of the regions as a function of their distance from the center of the galaxy

Figure 3: The specific star formation rate of the regions as a function of their distance from the center for three of the galaxies in the sample. Overall, the star formation rate decreases from 1 billion years before the observation (red) to the time of observation (blue). However, the regions where the star formation decreases most significantly (indicated with the yellow boxes) vary from galaxy to galaxy. [Olsen et al. 2026]

Detecting the Earliest Signs of Quenching

It should be noted that all of the galaxies in this study are still forming stars. However, they are on the verge of having their star formation suppressed, offering valuable insight into how quenching begins and how diverse the process can be. New telescopes are pushing the boundaries of what we can observe. On one hand, JWST can capture galaxies at exceptionally high resolution; on the other, the Vera C. Rubin Observatory and the Nancy Grace Roman Space Telescope will deliver vast datasets containing billions of galaxies. Future investigations leveraging these facilities could reveal more about the physical processes that quench galaxies on small scales, shedding light on the mechanisms that drive galaxy evolution.

Original astrobite edited by Catherine Slaughter.

About the author, Shalini Kurinchi-Vendhan:

After studying astrophysics and literature at Caltech, I moved onto a Fulbright Fellowship in Heidelberg, Germany. I’m passionate about using computer simulations to explore supermassive black holes and galaxy evolution — but I also love poetry and traveling.

The post Observing the End of Star Formation in Galaxies appeared first on AAS Nova.

Featured Image: Massive Stars in the Making

10 April 2026 at 17:00

W51A star forming region

W51A study region

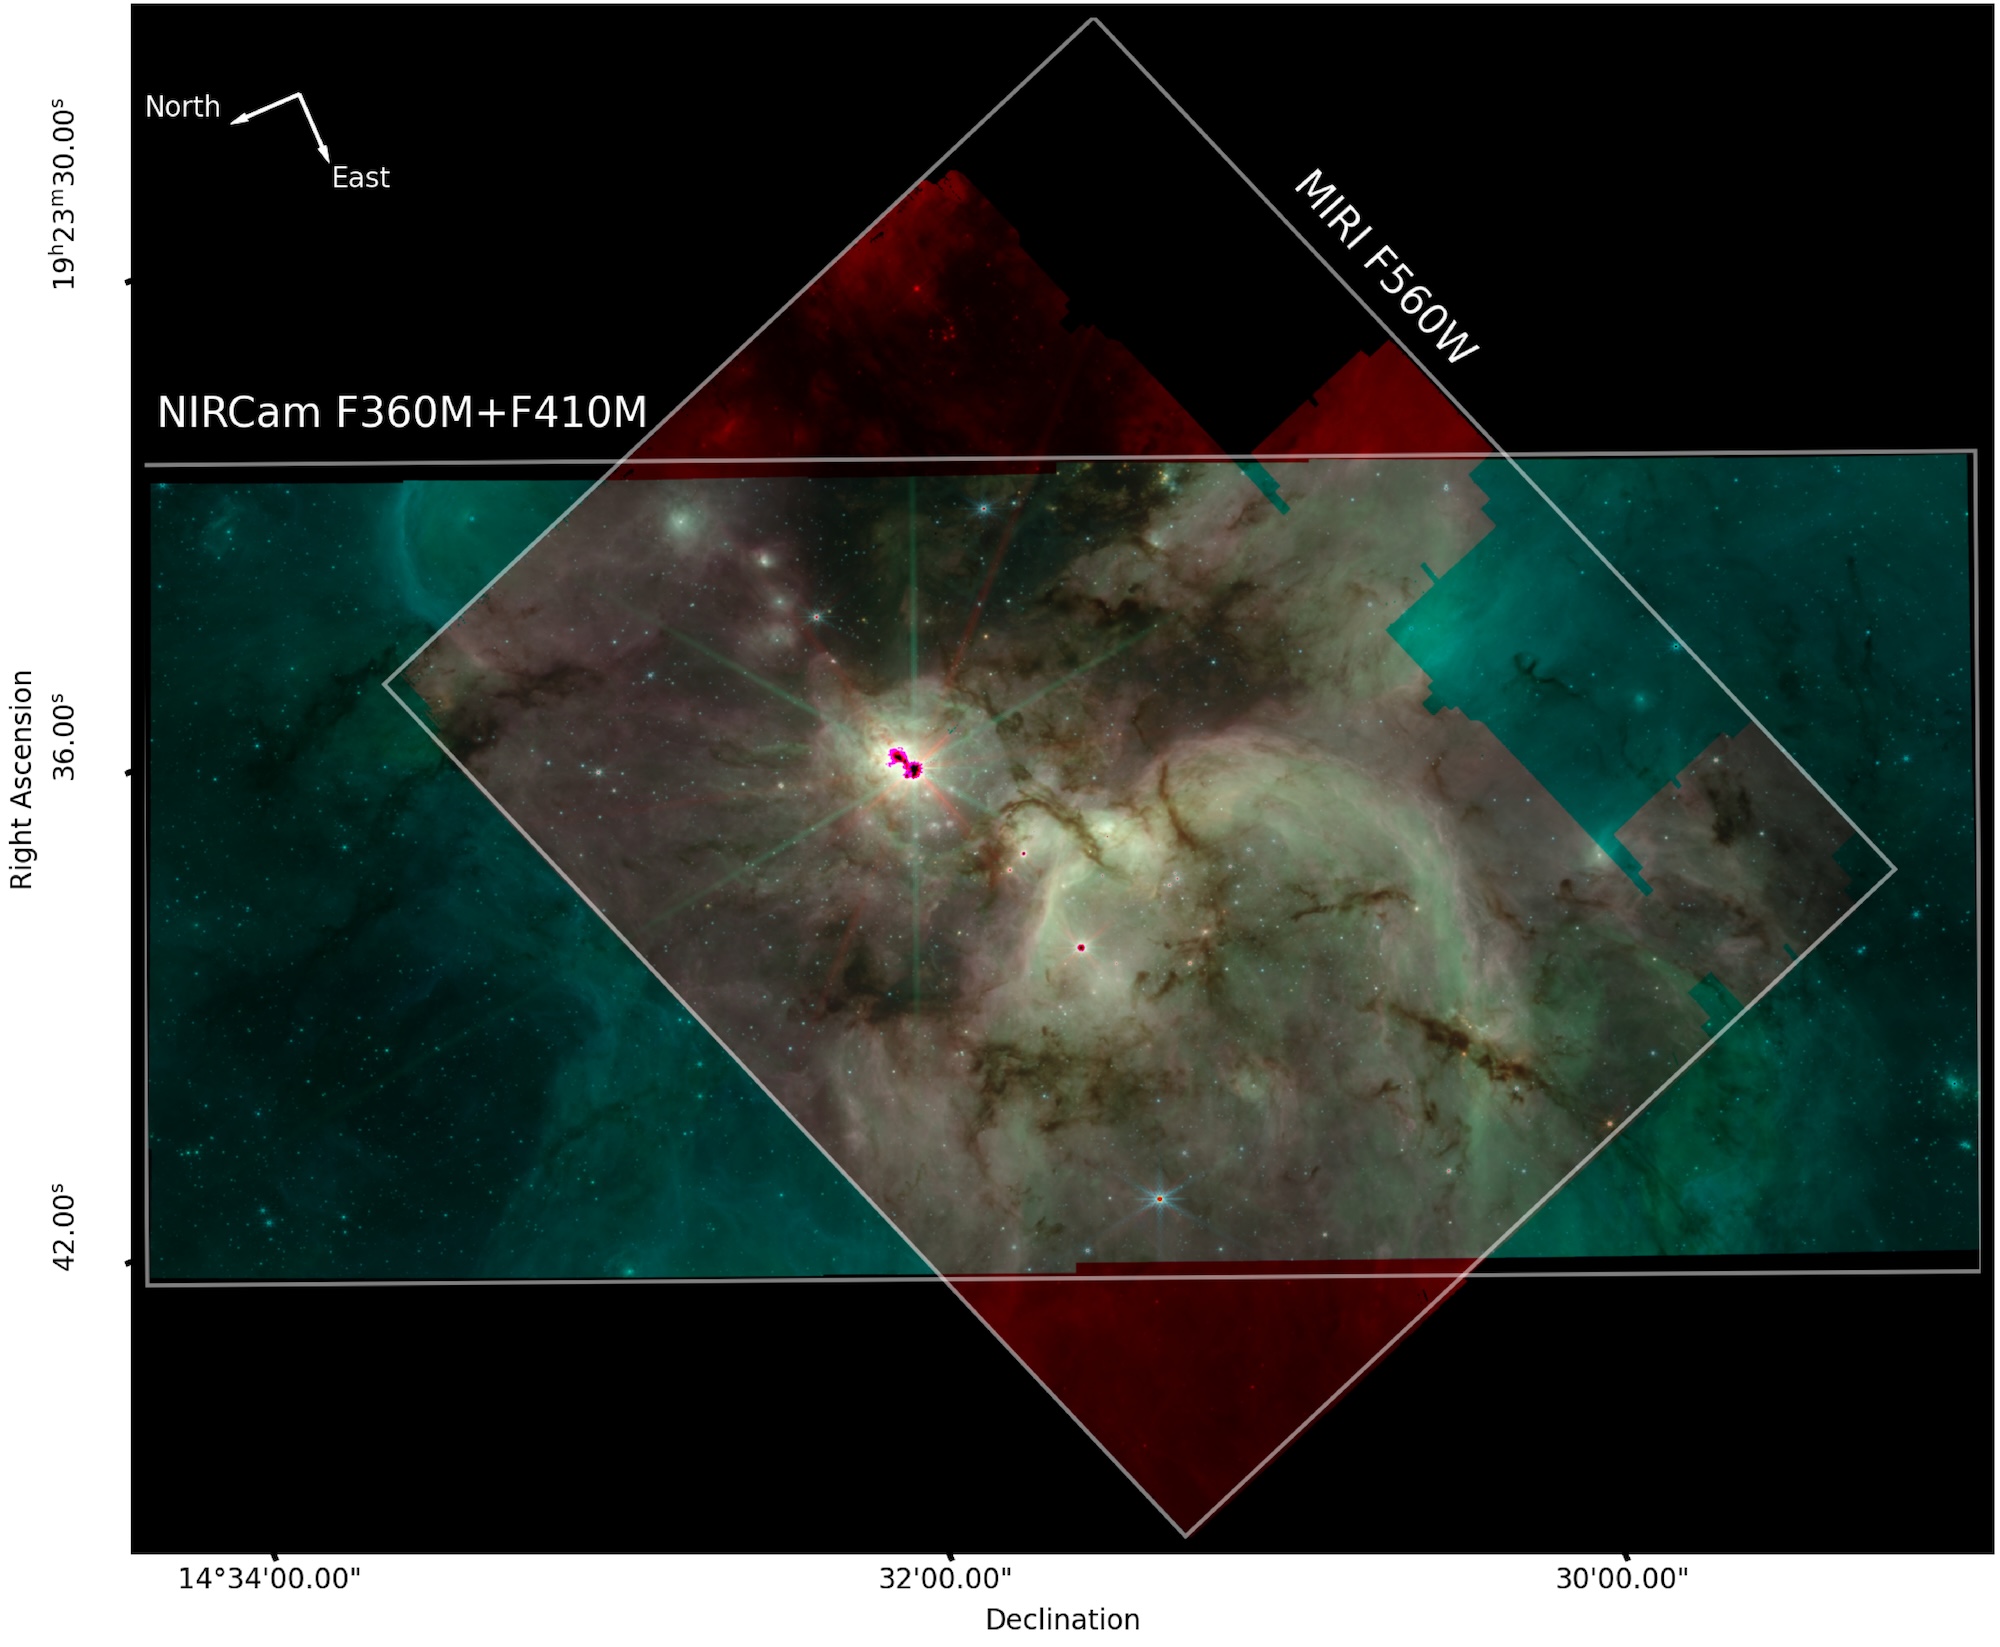
The full view of the study region, showing the NIRCam and MIRI footprints. [Yoo et al. 2026]

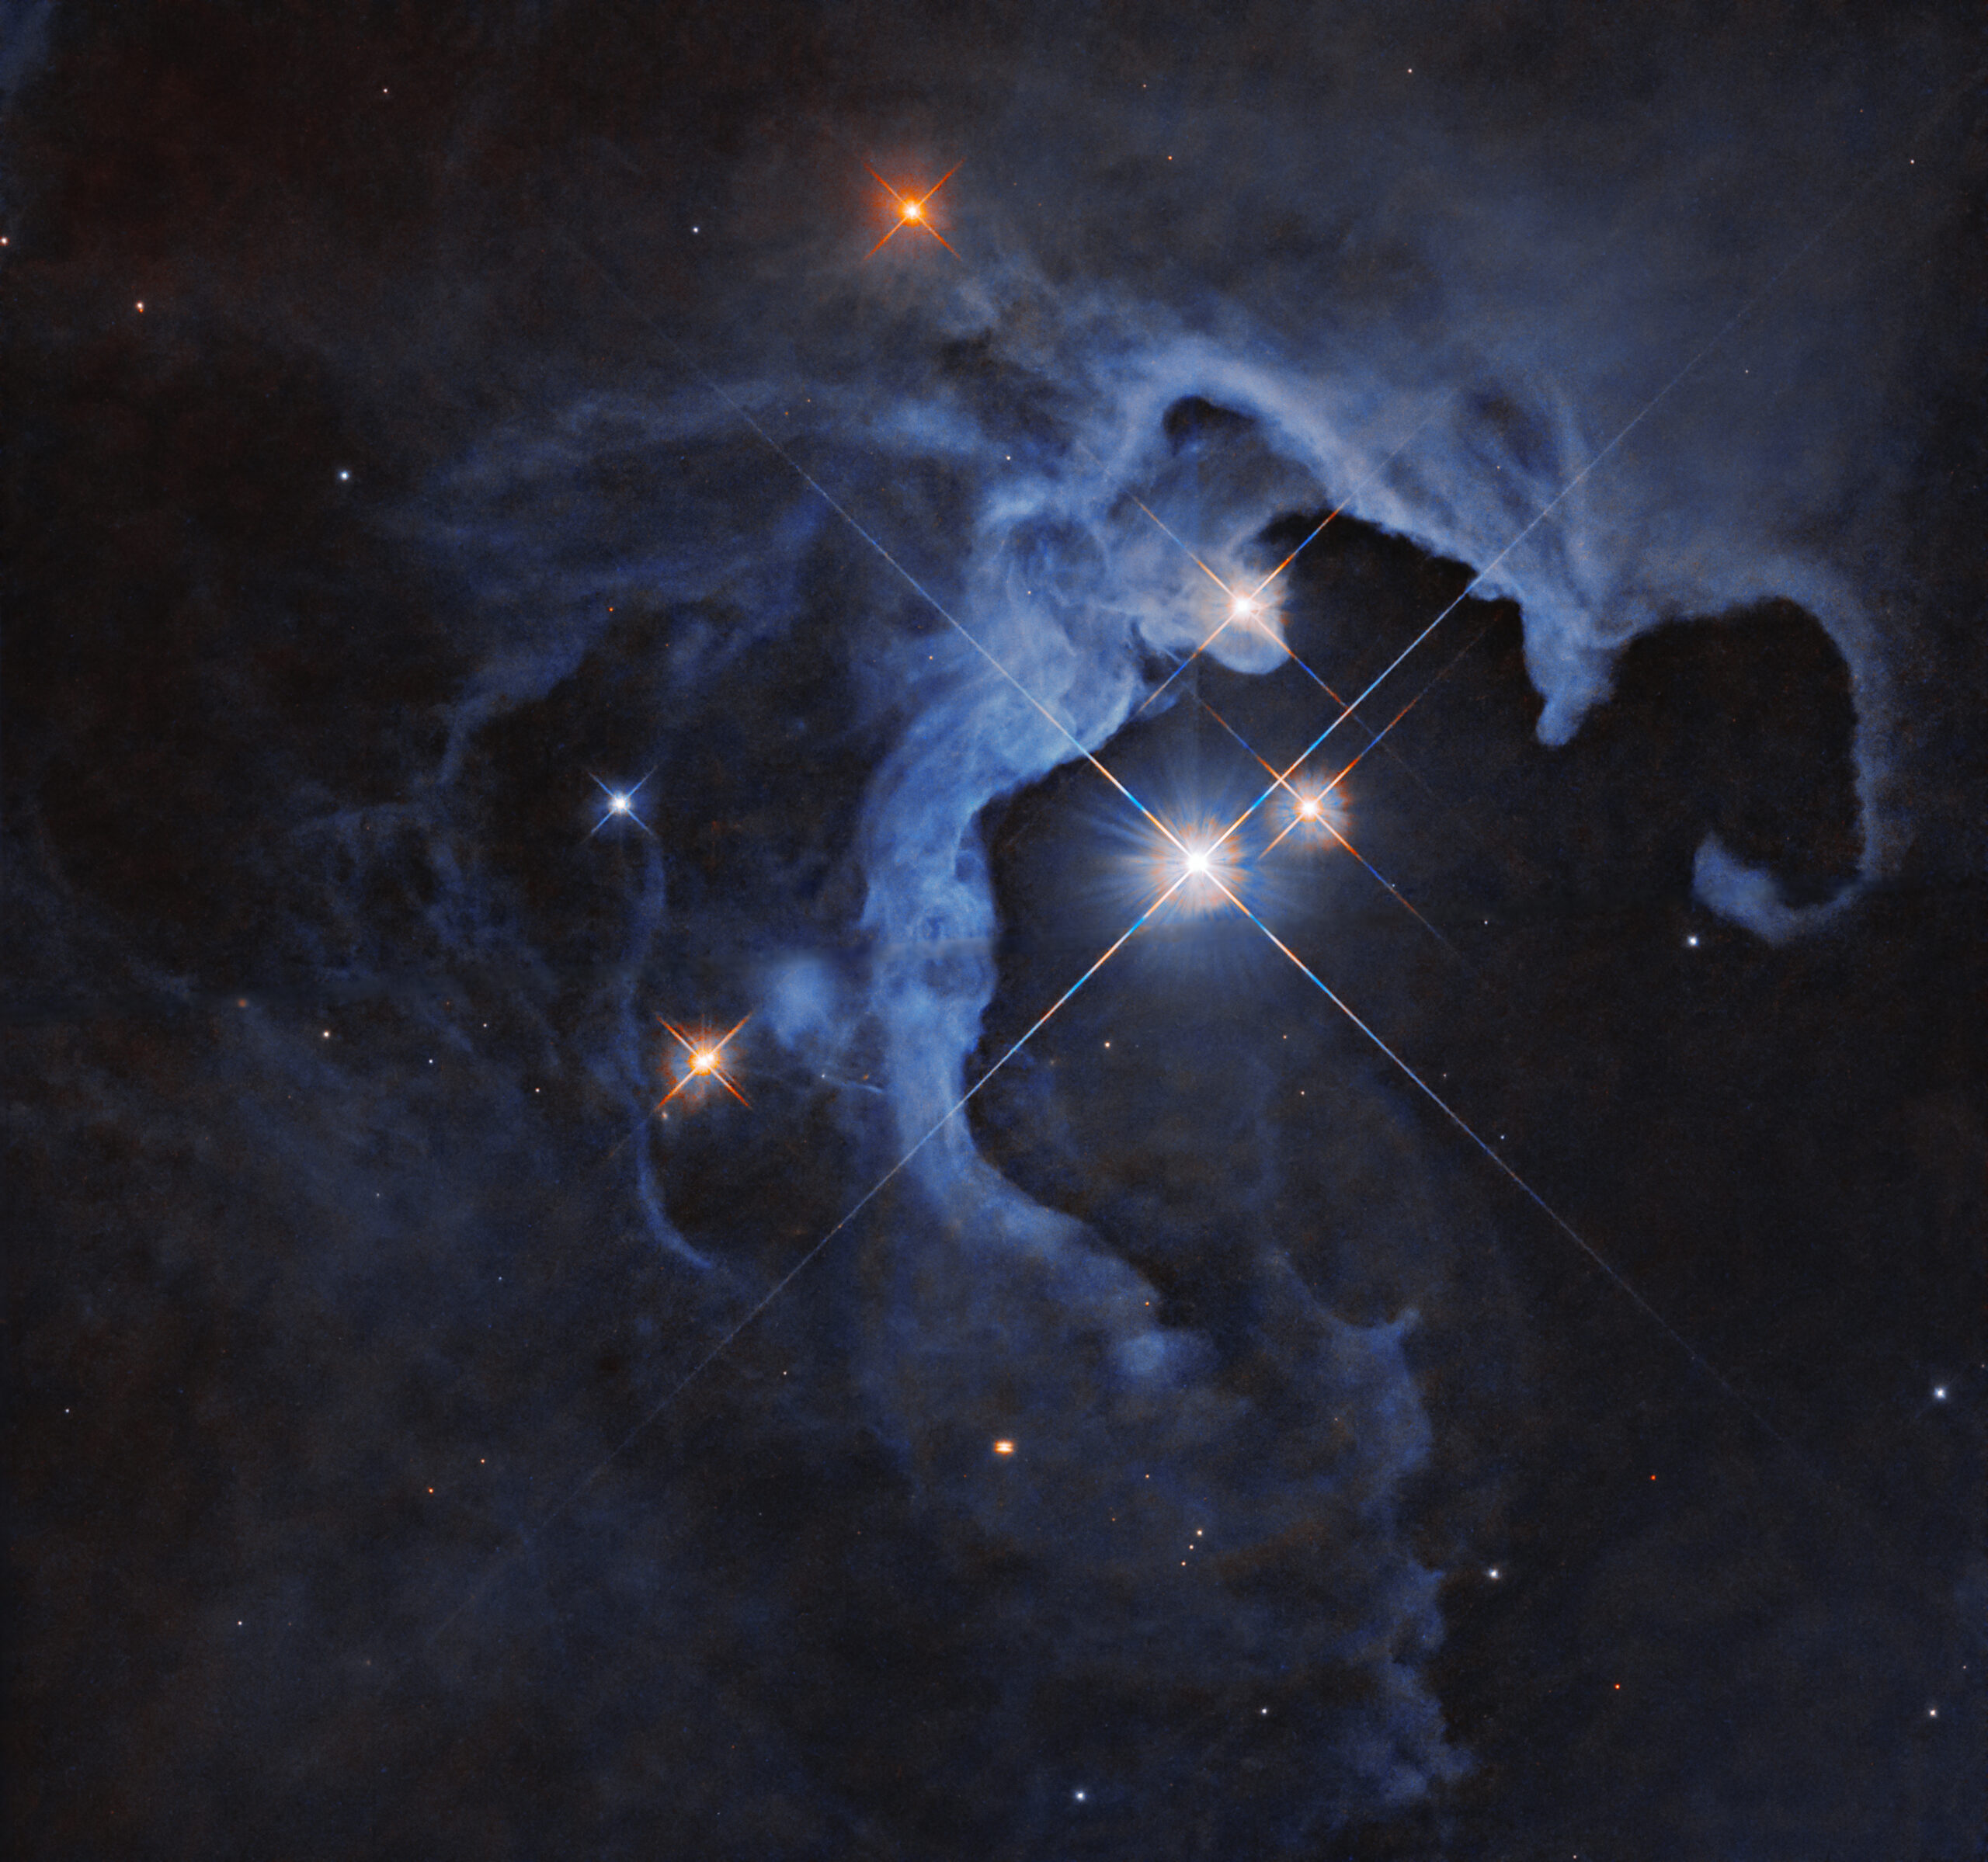
This image shows one W51A, of the most active star-forming regions in our galaxy. A research team led by Taehwa Yoo (University of Florida) recently observed this region with JWST, using the telescope’s Near-Infrared Camera (NIRCam) and Mid-Infrared Instrument (MIRI) to record fine structures in the swirling, dusty gas and reveal deeply embedded protostars. The JWST data enabled the team to study two protoclusters that are busily sculpting roughly 10,000 solar masses of gas — each! — into new stars. One protocluster, W51-IRS2 (containing the brightest source in the image above), has excavated a bubble around itself through intense stellar feedback, while the other, W51-E (down and to the right of W51-IRS2, where multiple dust lanes converge), is still being fed by dusty tendrils. For more details on this star-forming region, be sure to check out the full research article linked below.

Citation

“A JWST NIRCam/MIRI View of the W51A High-Mass Star-Forming Region,” Taehwa Yoo et al 2026 AJ 171 208. doi:10.3847/1538-3881/ae40b7

The post Featured Image: Massive Stars in the Making appeared first on AAS Nova.

Black Hole Baby Photos: JWST and Chandra Observe M31-2014-DS1

4 March 2026 at 17:00

illustration of M31-2014-DS1

One of the most luminous supergiant stars in the Andromeda Galaxy, M31-2014-DS1, has disappeared, potentially leaving behind a black hole shrouded in dusty gas. What do new infrared and X-ray observations tell us about this event?

Failure to Explode?

SN 2023ixf in Messier 101

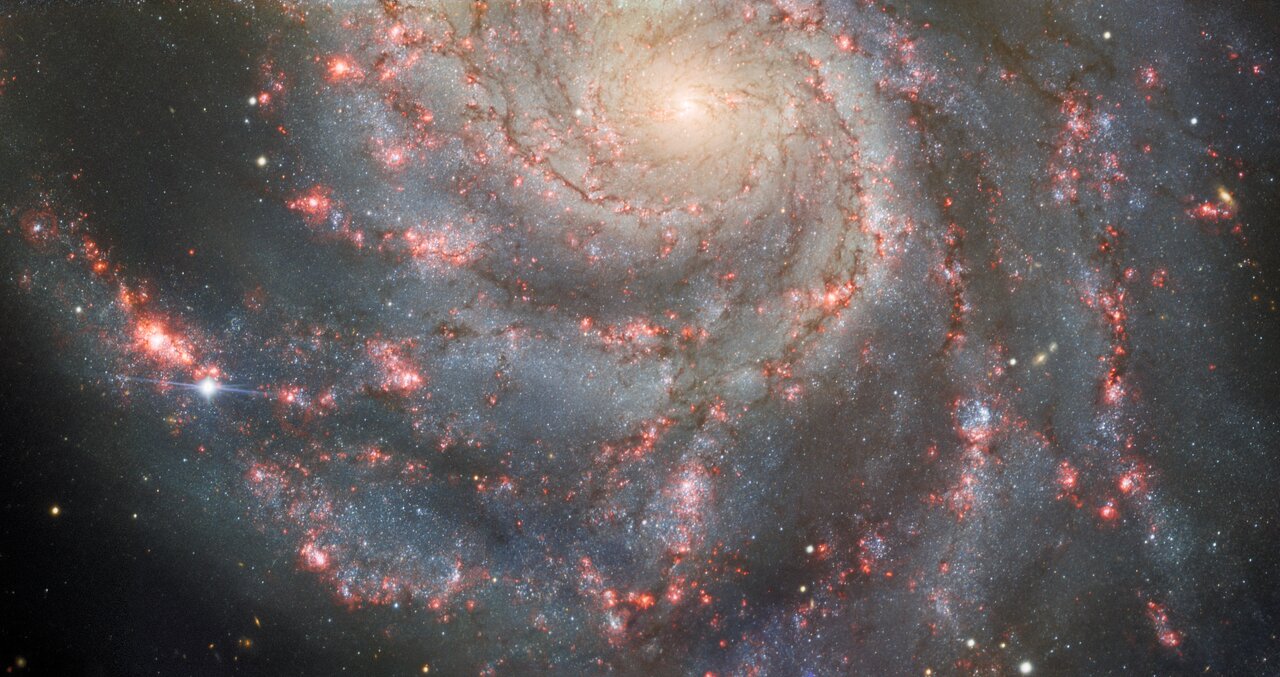
This image from Gemini North shows the supernova SN 2023ixf along one of the spiral arms of Messier 101. Though less showy than core-collapse supernovae, “failed” supernovae may be another way to form stellar-mass black holes. [International Gemini Observatory/NOIRLab/NSF/AURA; CC BY 4.0]

Massive stars are famous for going out with a bang. After swelling into supergiants, these stars bring their brief lives to a close in a cosmic fireworks show: a supernova explosion that creates a neutron star or a black hole.

But a splashy supernova explosion may not be the only way for a massive star to go out. As observations have begun to suggest, some massive stars may — for reasons not yet fully understood — quietly collapse in upon themselves, going out with a whimper rather than a bang. Though less spectacular and far harder to spot, these “failed” supernovae highlight a possible pathway for the formation of stellar-mass black holes.

A Newborn Black Hole in a Dense, Dusty Blanket

Just last month, researchers reported their discovery of a potential failed supernova. The supergiant M31-2014-DS1 suddenly brightened in 2014 before fading to obscurity, leading researchers to suspect that the star had experienced a failed supernova and created a black hole. The event shared similarities with another failed supernova candidate, NGC6946-BH1.

JWST data of M31-2014-DS 1

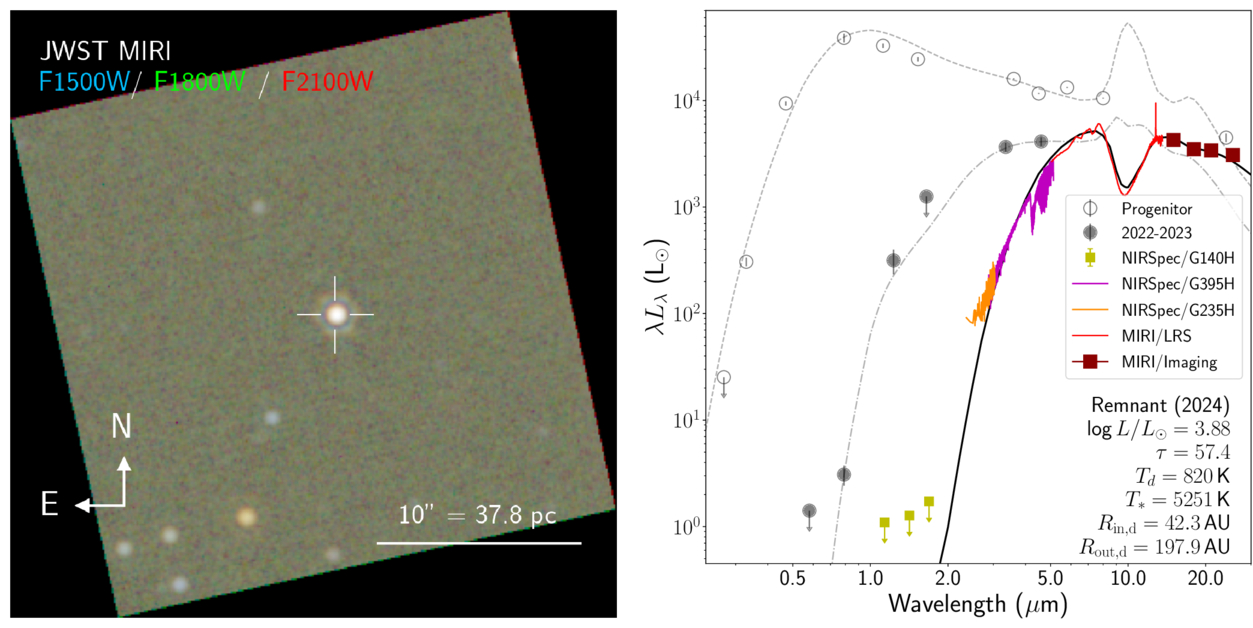
Left: A JWST image of M31-2014-DS 1. Right: Spectral energy distributions of the progenitor star/the remnant using data from 2005 to 2012 (empty circles), 2022 to 2023 (filled circles), and 2024 (colored lines). Click to enlarge. [De et al. 2026]

In a new article published in the Astrophysical Journal Letters, Kishalay De (Columbia University; Flatiron Institute) and coauthors have used JWST and the Chandra X-ray Observatory to learn more about what remained after M31-2014-DS1 disappeared. The JWST observations show an extremely red object that has faded considerably in just a few years, with a deep absorption feature from silicate dust and numerous narrow molecular absorption lines. Chandra did not detect any X-rays.

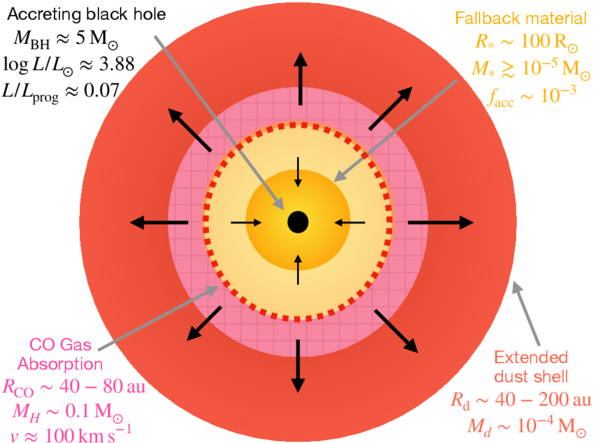
Together, these observations support a model in which the collapsing star ejected its outer layers in a relatively low-energy event (somewhere in the broad ballpark of one hundred-millionth to one ten-thousandth the energy of a typical core-collapse supernova) and formed a black hole. Some of the ejected material fell backward and fed the newborn black hole, while the remainder created a dense blanket that blocked the light from the accreting black hole from view.

Continued Evolution

schematic of the gas surrounding a newborn black hole

Cartoon showing the authors’ model and the model parameters inferred from the observations. Click to enlarge. [De et al. 2026]

In observations from 2024, the source had faded to just 7% of the progenitor star’s luminosity, supporting the conclusion that the star has disappeared and what lies beneath the dusty ejecta is a black hole. De’s team expects that as time goes on, the gas that obscures the accretion-powered luminosity of the newborn black hole will expand and become less dense along our line of sight. At some point — estimated to be no sooner than about 27 years from now — the X-ray emission from the accreting black hole should pierce the dusty shroud and become visible to sensitive X-ray observatories. In the infrared, JWST will be able to track the source’s evolution caused by continued dust creation in the expanding shell.

Thanks to its location in a neighboring galaxy, M31-2014-DS1 has granted astronomers a front-row seat to a poorly understood pathway for black hole formation. Going forward, we can expect further insights into M31-2014-DS1 and, hopefully, the discovery of many more sources like it.

Citation

“Fading into Darkness: A Weak Mass Ejection and Low-Efficiency Fallback Accompanying Black Hole Formation in M31-2014-DS1,” Kishalay De et al 2026 ApJL 999 L25. doi:10.3847/2041-8213/ae468d

The post Black Hole Baby Photos: JWST and Chandra Observe M31-2014-DS1 appeared first on AAS Nova.

Featured Image: Rare Giant Galaxies

23 February 2026 at 17:00

low-surface-brightness galaxies

Giant low-surface-brightness galaxies are rare and unusual members of the galactic menagerie. They host the largest galactic disks currently known, have baryonic masses of order 100 billion solar masses, and sport narrow, tightly wound spiral structures. The origins of these vast galaxies — they can be up to 10 times larger than the Milky Way — are unknown, though various theories involving mergers, accretion, and strange dark matter halos exist. Research also suggests that there may be a connection between these galaxies and compact ellipticals, which are small, dense, and contain old stars. In a recent article, a team led by Anna Saburova (Sternberg Astronomical Institute) investigated two giant low-surface-brightness galaxies with compact elliptical companions. In the image above, the colored circles represent the oxygen abundance at each location in AGC 192040 (left) and UGC 1382 (right). The red arrows point to the compact elliptical companions. Using the chemical abundance information to investigate possible formation mechanisms, Saburova and collaborators found that the two galaxies likely formed in different ways. UGC 1382 appears to be the result of multiple mergers, while AGC 192040 may have accreted gas from its halo or a galactic filament before undergoing a merger of its own. To learn more about this study of two rare galaxies, be sure to check out the full research article linked below!

Citation

“MUSE Study of Two Giant Low-Surface-Brightness Galaxies with Compact Satellites,” Anna S. Saburova et al 2026 ApJ 998 19. doi:10.3847/1538-4357/ae3139

The post Featured Image: Rare Giant Galaxies appeared first on AAS Nova.

Selections from 2025: The Formation of Massive Stars

22 December 2025 at 17:00

star-forming region AFGL 5180

Editor’s Note: For the remainder of 2025, we’ll be looking at a few selections that we haven’t yet discussed on AAS Nova from among the most-downloaded articles published in AAS journals this year. The usual posting schedule will resume January 2nd.

The SOFIA Massive (SOMA) Star Formation Survey. V. Clustered Protostars

Published June 2025

Main takeaway:

A team led by Zoie Telkamp (University of Virginia) used the Stratospheric Observatory for Infrared Astronomy, SOFIA, to study massive protostars and test theories of high-mass star formation. Contrary to the predictions of some star-formation models, the team found no evidence that massive protostars require a certain surface mass density to form. Formation in a cluster environment, however, may limit the formation of the most massive protostars.

Why it’s interesting:

Massive stars are rare, short-lived, and luminous. They influence their environments across a vast range of spatial and temporal scales, from advancing the epoch of reionization in the early universe to impacting the formation of individual planetary systems in the present-day universe. The fundamental question of how high-mass stars form is still unsettled. Theories of high-mass star formation range from scaled-up versions of low-mass star formation to scenarios involving collisions between protostars.

More about this massive-star study and the potential impact of a cluster environment:

infrared images of massive protostars

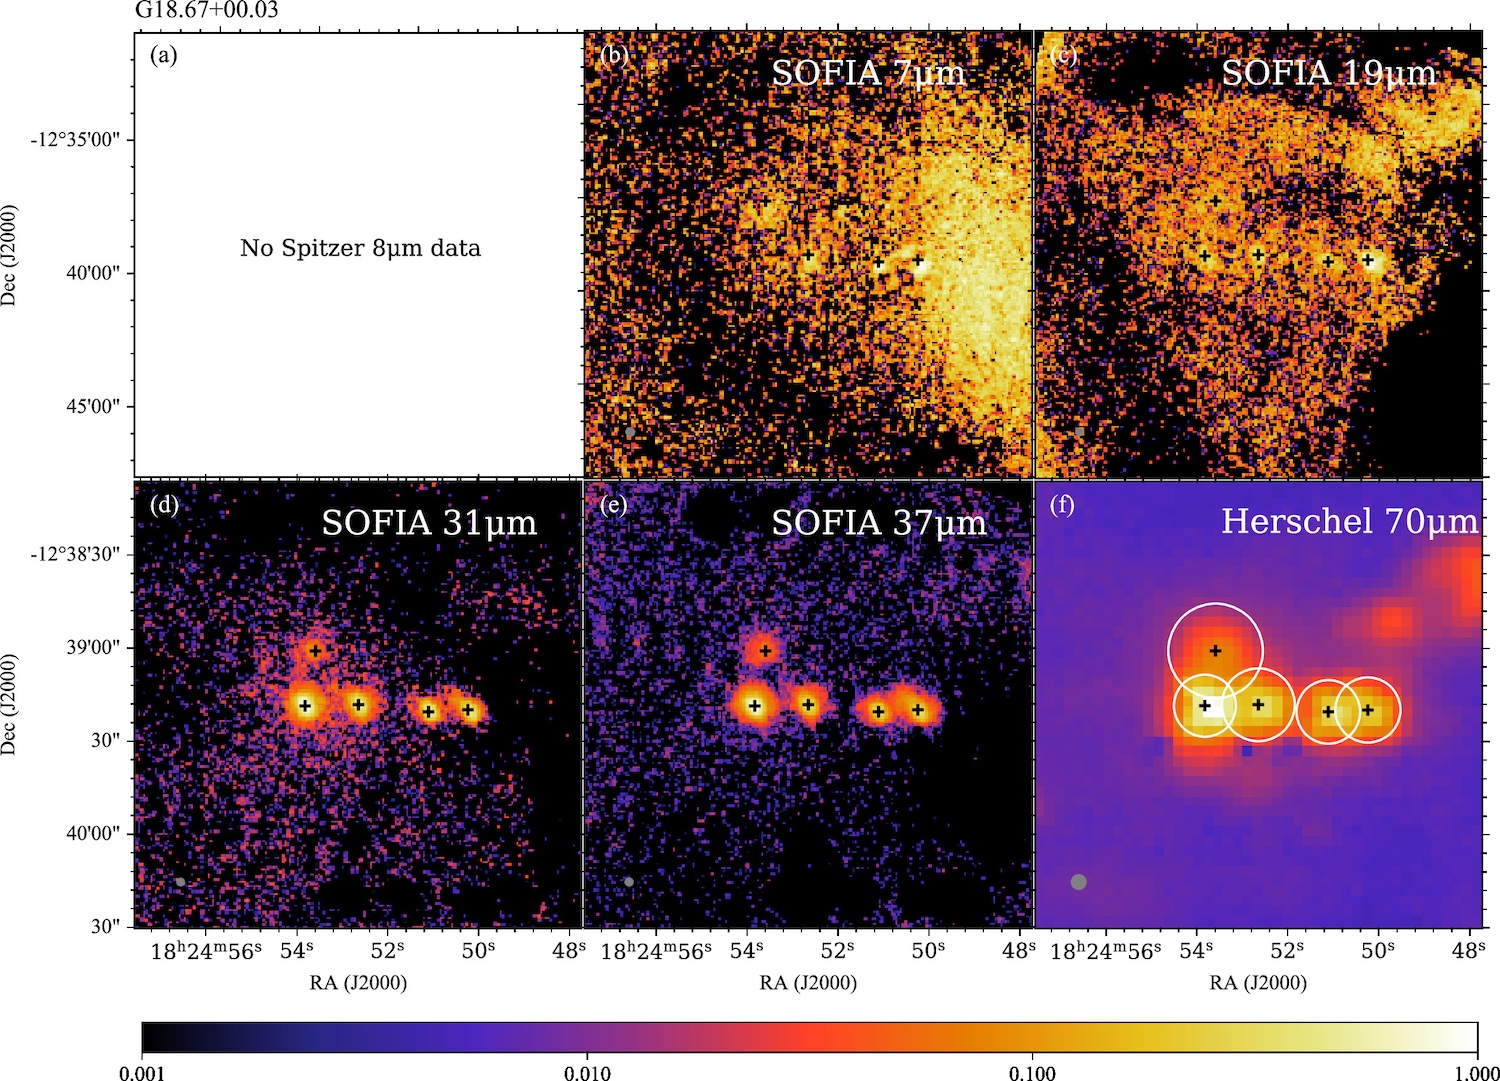
SOFIA FORCAST and Herschel Space Observatory images of protostars in the G18.67+0.03 star-forming region. Click to enlarge. [Telkamp et al. 2025]

Researchers developed the SOFIA Massive Star Formation Survey to investigate the origins of massive stars, targeting roughly 50 high-mass and intermediate-mass protostars in a wide variety of environments in our galaxy. This particular work, the fifth in a series of articles reporting the survey’s findings, described the team’s study of massive protostars forming in cluster environments. Using the Faint Object infraRed CAmera for the SOFIA Telescope (FORCAST), Telkamp and collaborators identified 34 protostars in seven star-forming regions and estimated their masses and other physical properties. The team noted a lack of protostars above 30 solar masses in these cluster regions, which might be evidence that competition for gas in dense environments can prevent the formation of more massive protostars. More work is needed to confirm this finding.

Citation

Zoie Telkamp et al 2025 ApJ 986 15. doi:10.3847/1538-4357/adcd79

The post Selections from 2025: The Formation of Massive Stars appeared first on AAS Nova.

Black Holes with a Shared Background

19 November 2025 at 17:00

A rendering of three white stars, two of which are very close together.

What if there was one process capable of creating every type of detectable stellar-mass black hole system? Recent research suggests there might be, and that it involves a triple-star system.

Three Separate Contexts

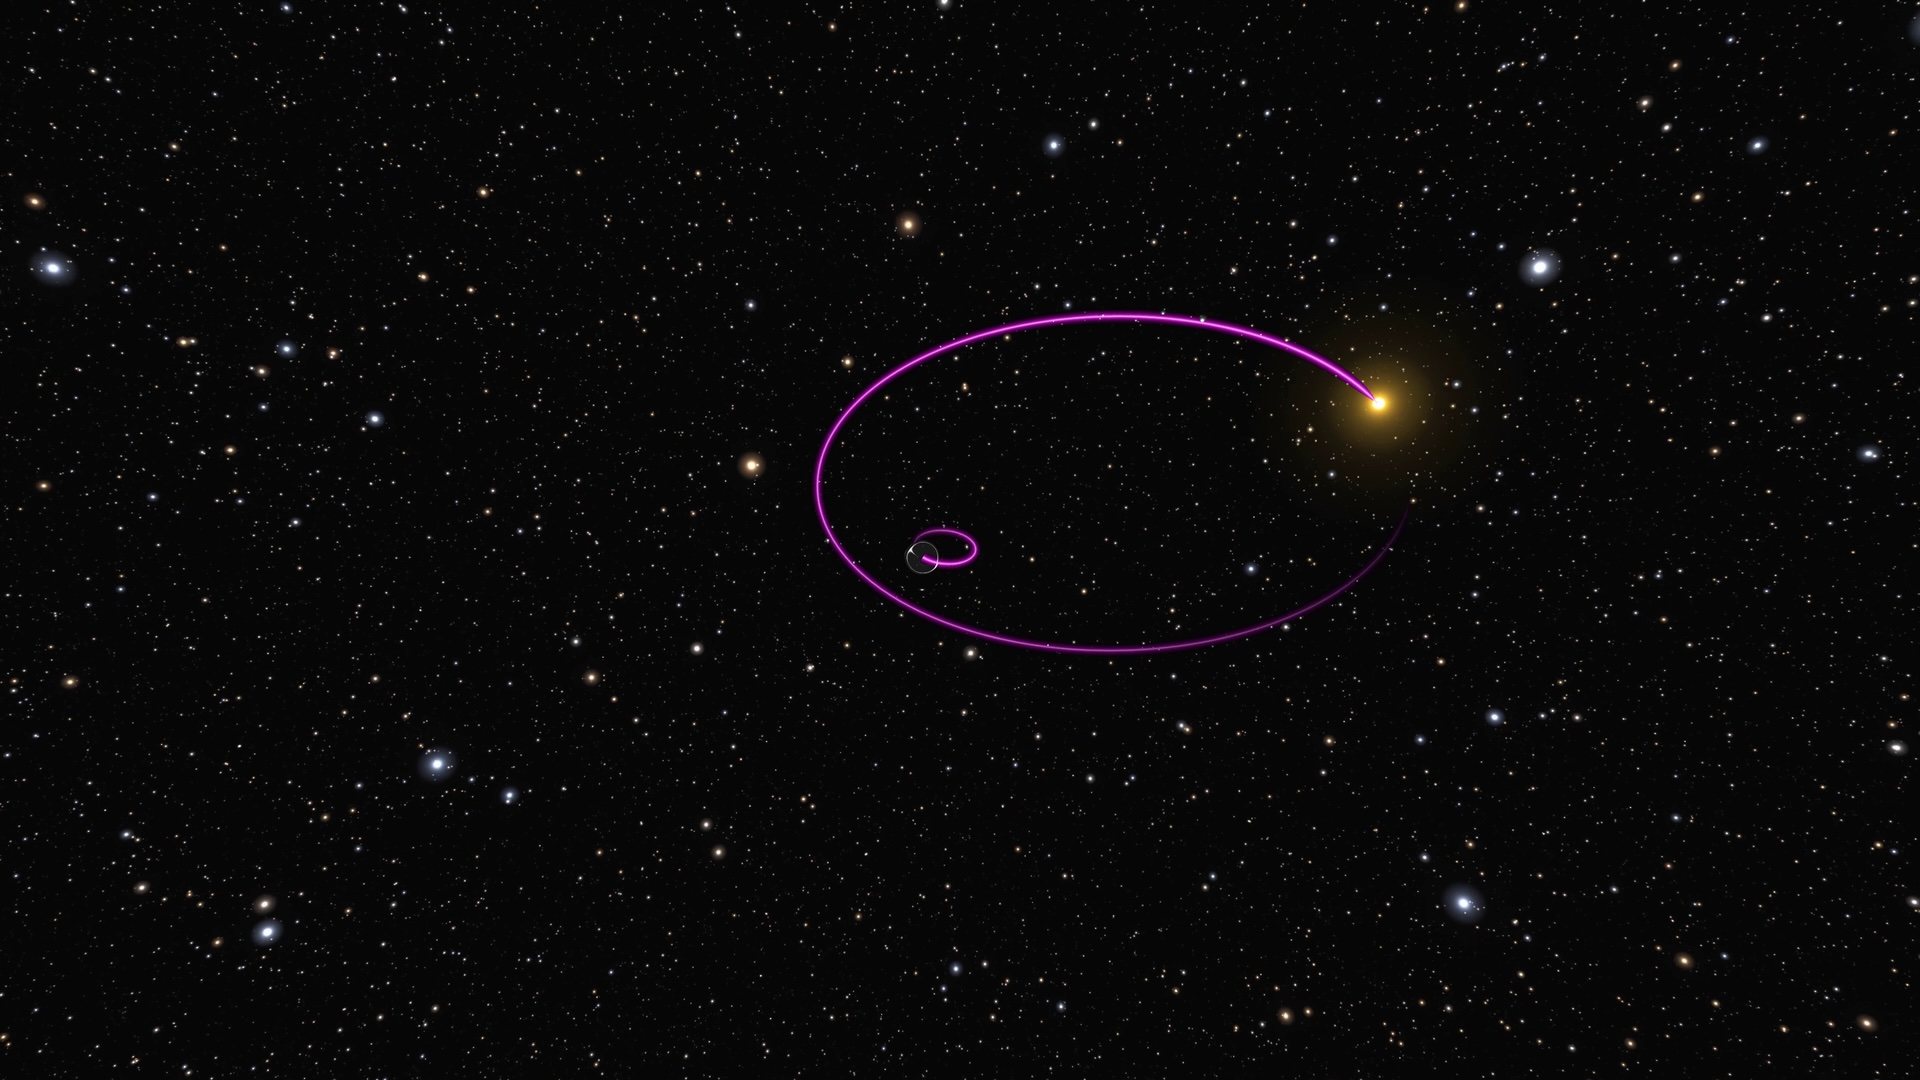
Stellar-mass black holes, or black holes that are at most a few hundred times the mass of the Sun, pop up in a number of different environments in the Milky Way. Astronomers have known since the 1960s that these black holes are the engines behind accreting low-mass X-ray binaries; more recently, researchers at gravitational wave observatories such as LIGO have found pairs of black holes orbiting each other just prior to merging; and, in just the past few years, scientists using the Gaia spacecraft have found black holes on wide, prowling orbits around still-burning stars.

A photograph of a patch of the night sky with two nested purple ovals overlaid.

An illustration of the first black hole discovered with a star on a wide orbit. The black hole moves along the smaller inner ellipse, while its companion star orbits along the wider outer one. [ESA/Gaia/DPAC]

Although each of these scenarios involves a black hole, it’s unclear how exactly these black holes are related to one another, or if they’re related at all. For instance, do low-mass X-ray binaries form the same way as the binary black holes observed with LIGO? Are the wide star–black hole binaries discovered by Gaia destined to eventually merge as two black holes, or are they a separate population altogether?

Recent research led by Smadar Naoz (University of California, Los Angeles) offers a potential answer to this question of relatedness — that each of these situations forms through the same underlying process.

Triples Systems

An illustration of multiple stars evolving along different pathways indicated by arrows.

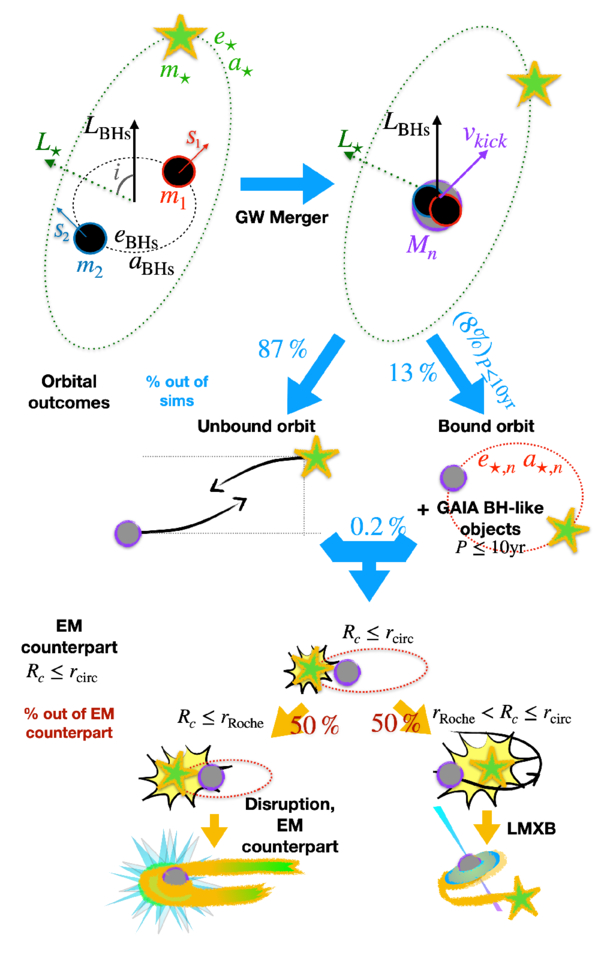
A schematic illustration of how triple-star systems can produce all three types of observable stellar-mass black hole systems. Click to enlarge. [Naoz et al. 2025]

The mechanism Naoz and collaborators describe would work as follows. First, three stars begin their lives all bound together via gravity. Two of these stars orbit each other fairly closely, but the third hangs back much farther away. After the two inner stars burn out and collapse into black holes, they undergo the kind of collision commonly observed by LIGO and merge together. This process gives the resulting larger black hole a “kick,” meaning it goes flying off away from the site of the impact with some new velocity.

What happens next depends on the geometry of the system and the direction of the kick. If the remnant black hole gets shot away from the third star, it might just drift off on its own and leave the star behind. If the kick isn’t too strong, the remnant will remain gravitationally bound to that third star, and the system will eventually look like the star–black hole pairs observed by Gaia. Finally, if the kick sends the remnant toward the third star, some dramatic outcomes become possible: either the black hole starts nibbling on the star and the system becomes a low-mass X-ray binary, or the black hole simply smashes into the star, destroying it completely in a large, flashy explosion paired with a gravitational wave signal.

The authors stress that this mechanism is almost certainly not the only way that these three stellar-mass black hole systems form. However, it is exciting to consider a common thread underlying such seemingly different scenarios, and with upgrades coming to gravitational wave observatories, we can hope for tests of its feasibility in the near future.

Citation

“Triples as Links Between Binary Black Hole Mergers, Their Electromagnetic Counterparts, and Galactic Black Holes,” Smadar Naoz et al 2025 ApJL 992 L12. doi:10.3847/2041-8213/ae0a20

The post Black Holes with a Shared Background appeared first on AAS Nova.

Do X-Rays Help or Hurt Massive Black Hole Formation?

17 November 2025 at 17:00

Illustration of a supermassive black hole enveloped in gas

Editor’s Note: Astrobites is a graduate-student-run organization that digests astrophysical literature for undergraduate students. As part of the partnership between the AAS and astrobites, we occasionally repost astrobites content here at AAS Nova. We hope you enjoy this post from astrobites; the original can be viewed at astrobites.org.

Title: Massive Black Hole Seed Formation in Strong X-Ray Environments at High Redshift
Authors: Kazutaka Kimura, Kohei Inayoshi, and Kazuyuki Omukai
First Author’s Institution: Tohoku University
Status: Published in ApJ

Environments of Massive Black Holes

Astronomers have found that nearly every observable galaxy hosts a central supermassive black hole (SMBH) — a black hole more than a million times more massive than the Sun. Using JWST, they have peered back into the early universe to observe some of the earliest galaxies, and these early galaxies also contain SMBHs. In fact, many of these galaxies seem to contain SMBHs that are more massive than we expected them to be this early in the universe.

We believe that most black holes form at the ends of the lives of massive stars, which collapse under their own gravity when they run out of fuel. We expect that this happened to the first stars too, forming “light” (as in “lightweight”) seeds of SMBHs with masses up to about 100 solar masses. Astronomers also think that the right conditions in the early universe could lead to the formation of a “heavy” seed with a mass on the order of 104 solar masses or more; this kind of black hole is called a direct-collapse black hole (DCBH).

In order to form a DCBH, a gas cloud needs to collapse without fragmenting to form star clusters and stars — if stars form, there won’t be enough mass funneled to the center of the cloud to form the DCBH. One important criterion for this to happen is the absence of coolants, like metals and molecular hydrogen (H2), which cause fragmentation. One way to eliminate H2 is with a particular type of ultraviolet light called Lyman-Werner radiation, which can destroy H2 molecules. However, recent results from the Hydrogen Epoch of Reionization Array (HERA) suggest that early galaxies emitted more X-rays than expected, which would increase the amount of H2 and make it less likely for DCBHs to occur. Today’s authors investigate the feasibility of forming DCBHs in these X-ray-bright environments.

Modeling Black Hole Formation

Today’s authors model the collapse of gas in dark-matter halos that have a nearby neighboring halo. This neighboring halo emits radiation like ultraviolet light and X-rays that impact the formation of molecules like H2, which affects the gas chemistry. This radiation is typically emitted by hot gas in star-forming regions. The authors also track quantities like the gas density and temperature as the gas collapses. Once the gas collapses enough, a star forms at the center and continues to accrete surrounding material. Once this star evolves and reaches the end of its life, it becomes a black hole.

The authors considered different intensities of X-ray radiation relative to a critical value of Lyman-Werner radiation believed to destroy enough H2 to form a DCBH, which is called J21. They explore values of the X-ray intensity Jx relative to J21, considering ratios of 0, 10-6, 10-5, and 10-4.

Another important consideration was the baryonic streaming velocity. This is the relative bulk velocity between baryonic (i.e., “normal”) matter and dark matter in the early universe. Higher streaming velocities can delay the collapse of gas in dark-matter halos, which affect gas properties like density, temperature, and chemistry. The streaming velocity depends on the redshift, z, which is given by σbsm = 30 km/s (1+z)/(1+z0), where z0 = 1,100. This “standard” relationship has been calibrated with measurements from observations. The authors consider two cases for the streaming velocity: vbsm = 0 and vbsm = 1σbsm, which are denoted in the figures below.

X-Rays and Seed Suppression

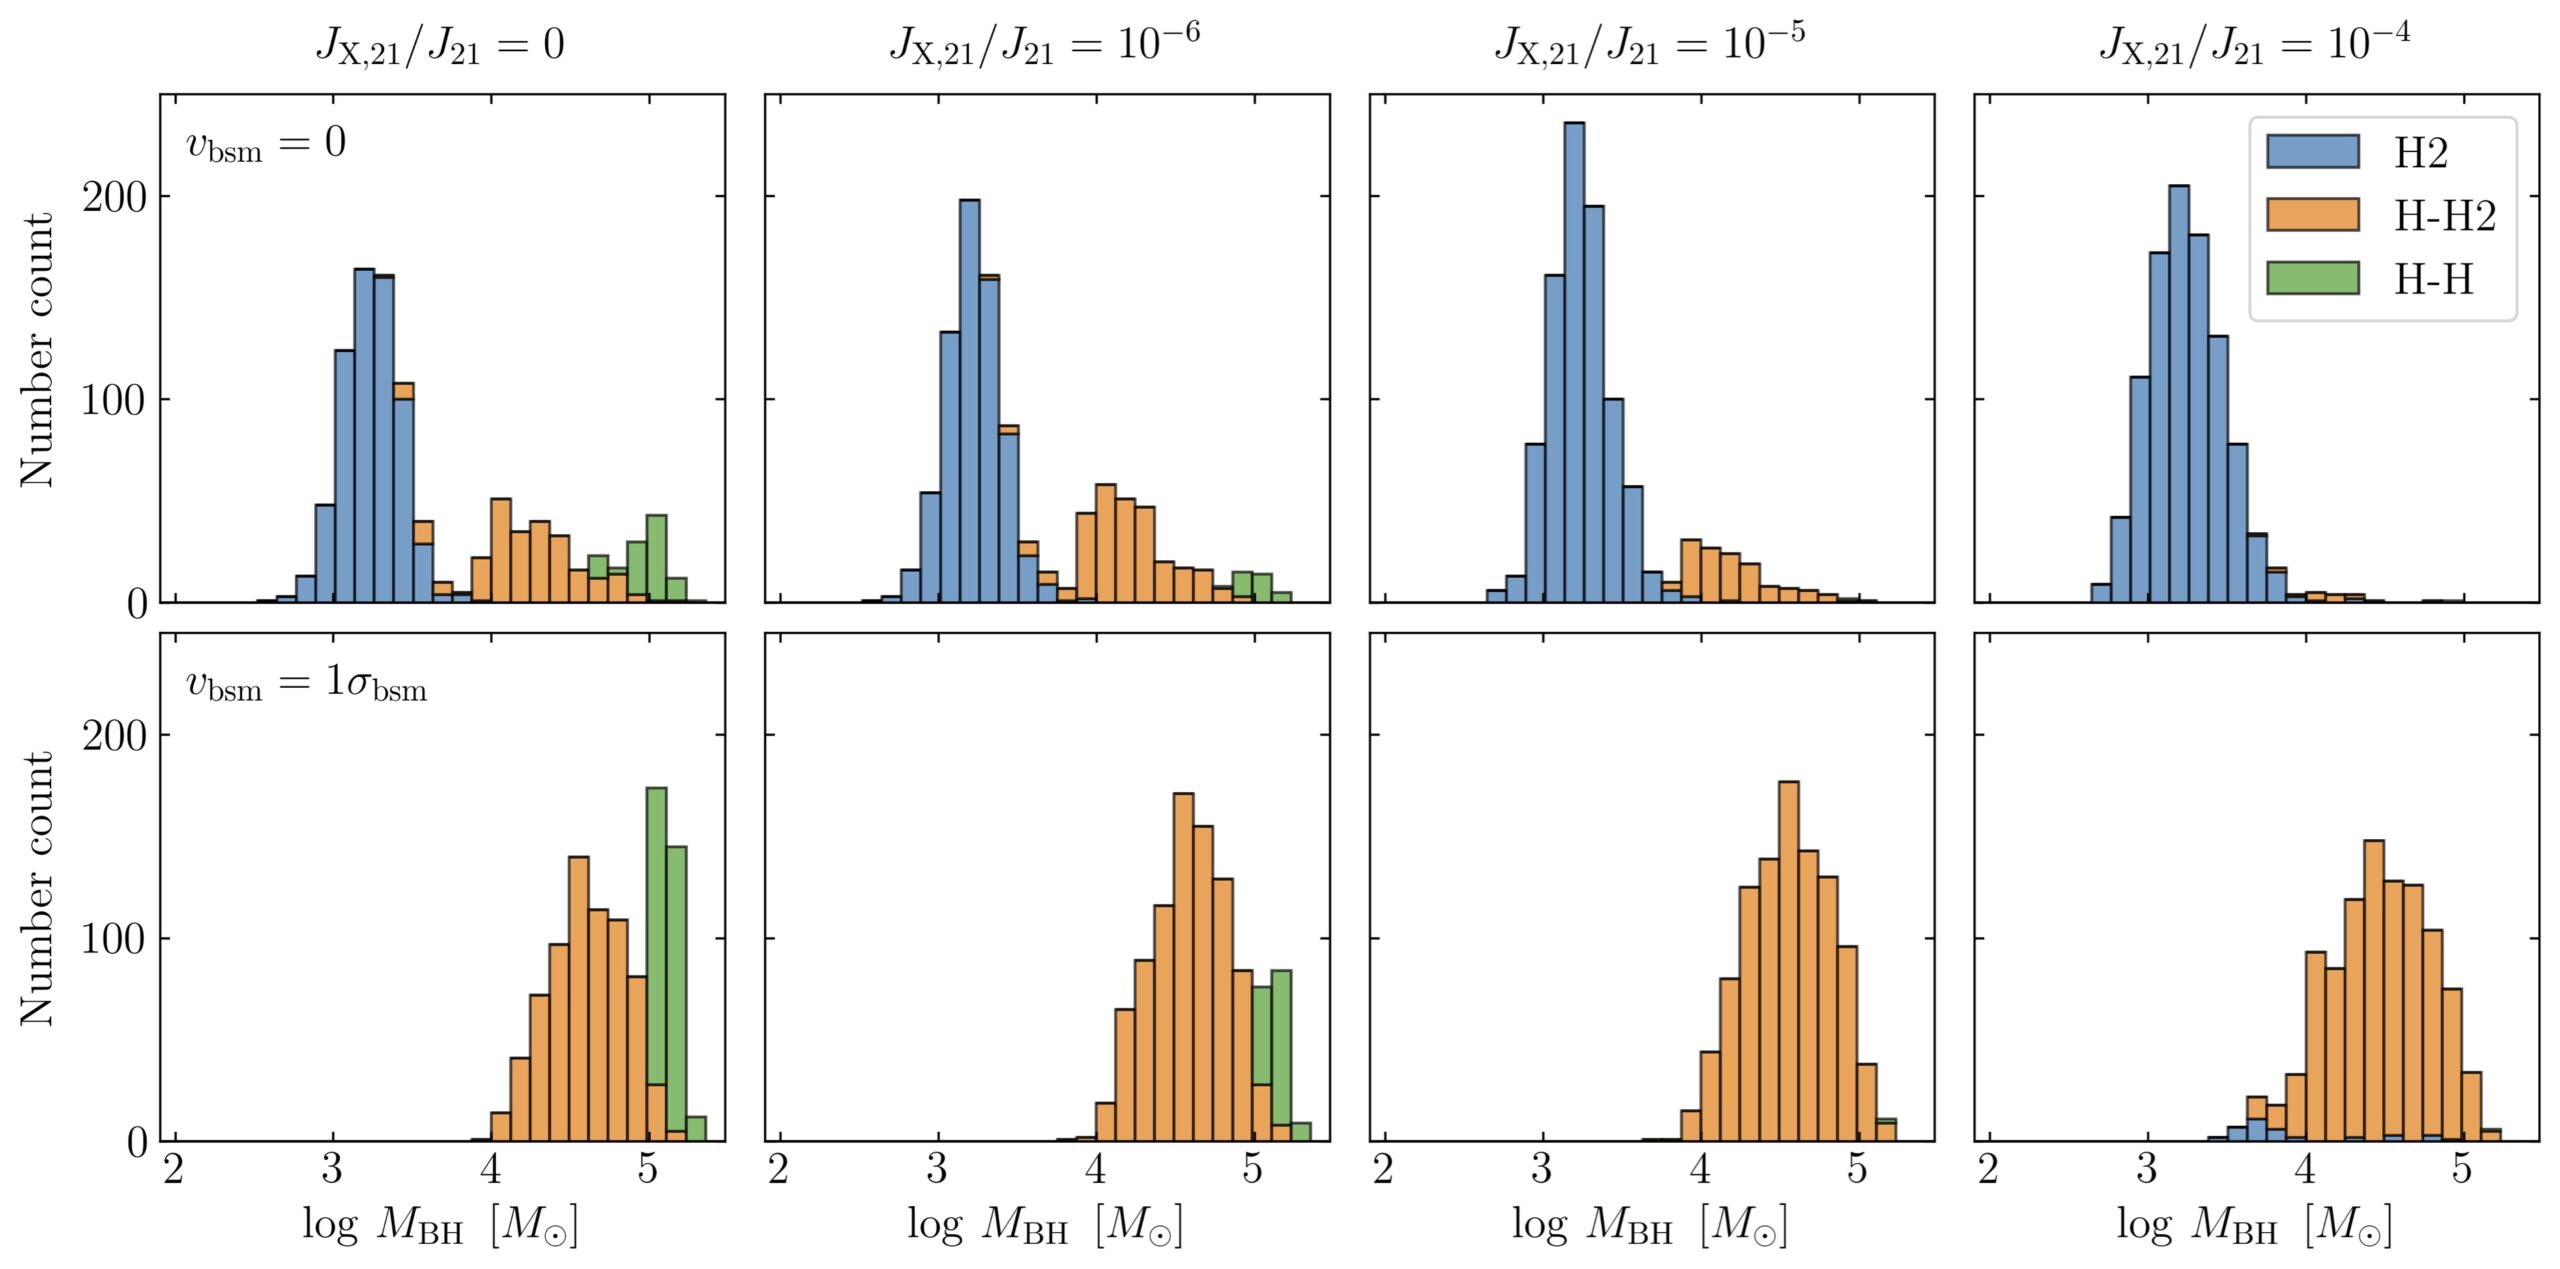
The first main results are shown in Figure 1. The authors find that a large number of intermediate-mass seeds form from H2 cooling, shown in blue, regardless of the X-ray intensity. A smaller number of higher-mass seeds form from H–H2 and H–H cooling, but these cooling processes become suppressed as the X-ray intensity increases. This is because the increased X-ray intensity converts more H to H2. Interestingly, accounting for the streaming velocity all but wipes out black hole formation via H2 cooling except at very high X-ray intensities.

histograms of seed black hole mass

Figure 1: Mass distributions of seed black holes. The top row uses a baryonic streaming velocity of 0 and the bottom row uses the standard streaming velocity. Columns represent increasing X-ray intensities (left to right). Colors represent the dominant cooling mechanisms: H2 (blue), atomic hydrogen H transitioning to H2 (orange), and solely H (green). [Kimura et al. 2025]

Another main set of results are the black hole mass functions (that is, the number density of black holes for a given black hole mass), shown in Figure 2. Note that this differs from Figure 1 because we are now accounting for the number density of black holes, not just the number, and we are no longer categorizing black holes based on their cooling mechanism. As before, we see that most massive black holes are eliminated with a high X-ray intensity and no streaming velocity, but a higher streaming velocity tends to produce more massive black holes regardless of the X-ray intensity. These black hole mass functions provide a useful comparison to observational results from telescopes like JWST.
histograms of seed black hole number density

Figure 2: Seed black hole mass functions for low and high X-ray intensities (left and right columns, respectively). Rows are the same as in Figure 1. [Kimura et al. 2025]

In summary, today’s authors find that a high X-ray intensity leads to less-massive black holes due to the increased amount of H2, but accounting for the baryonic streaming velocity can produce massive black holes even with a large amount of X-rays. The number densities of these black holes appear to agree with observations from JWST, meaning that this could be a promising formation mechanism for the observed SMBHs in the early universe.

Original astrobite edited by Sparrow Roch.

About the author, Brandon Pries:

I am a graduate student in physics at Georgia Institute of Technology (Georgia Tech). I do research in computational astrophysics with John Wise, using machine learning to study the formation and evolution of supermassive black holes in the early universe. I’ve also done extensive research with the IceCube Collaboration as an undergraduate at Michigan State University, studying applications of neural networks to event reconstructions and searching for signals of neutrinos from dark matter annihilation.

The post Do X-Rays Help or Hurt Massive Black Hole Formation? appeared first on AAS Nova.

The Sun Left Home in a Hurry

14 November 2025 at 17:00

A photograph of a dense knot of stars against a collection of more spread-out stars.

By simulating how the orbits of distant solar system objects were altered by close encounters with other stars early in the Sun’s life, astronomers have placed tight constraints on how long our home star stuck around its siblings after birth.

Born in Batches

Though our Sun currently travels on a solitary trajectory through the galaxy, its earliest childhood was not spent so lonely. Instead, the Sun was likely born as part of a litter of many other stars all collapsing out of the same cloud of precursor gas and dust. As a consequence, its early adolescence was spent in the company of dozens of other young stars, all zipping along on their own paths, destined to drift apart but initially packed close together.

A photograph of three bright stars within a circular cavity of gas.

The Hubble Space Telescope’s view of a collection of young stars still embedded within their natal nebula. [NASA, ESA, G. Duchene (Universite de Grenoble I); Image Processing: Gladys Kober (NASA/Catholic University of America)]

Despite their kinship, these young stars were not kind to one another when they passed nearby. When two stars grow close, the intense gravity of the encounter can severely disrupt their proto-planetary systems, scattering the objects orbiting farthest from their stars and potentially even ejecting some objects altogether. These early years likely left scars on the edges of our solar system that persist even today, billions of years after the early tussles.

Recent research led by Amir Siraj, Princeton University, leverages these scars or their apparent absence to ask the question: given the structure we observe in the outer solar system today, what limits can we place on the number of stars born near the Sun and the amount of time the Sun spent in its birth cluster?

Distance is Power

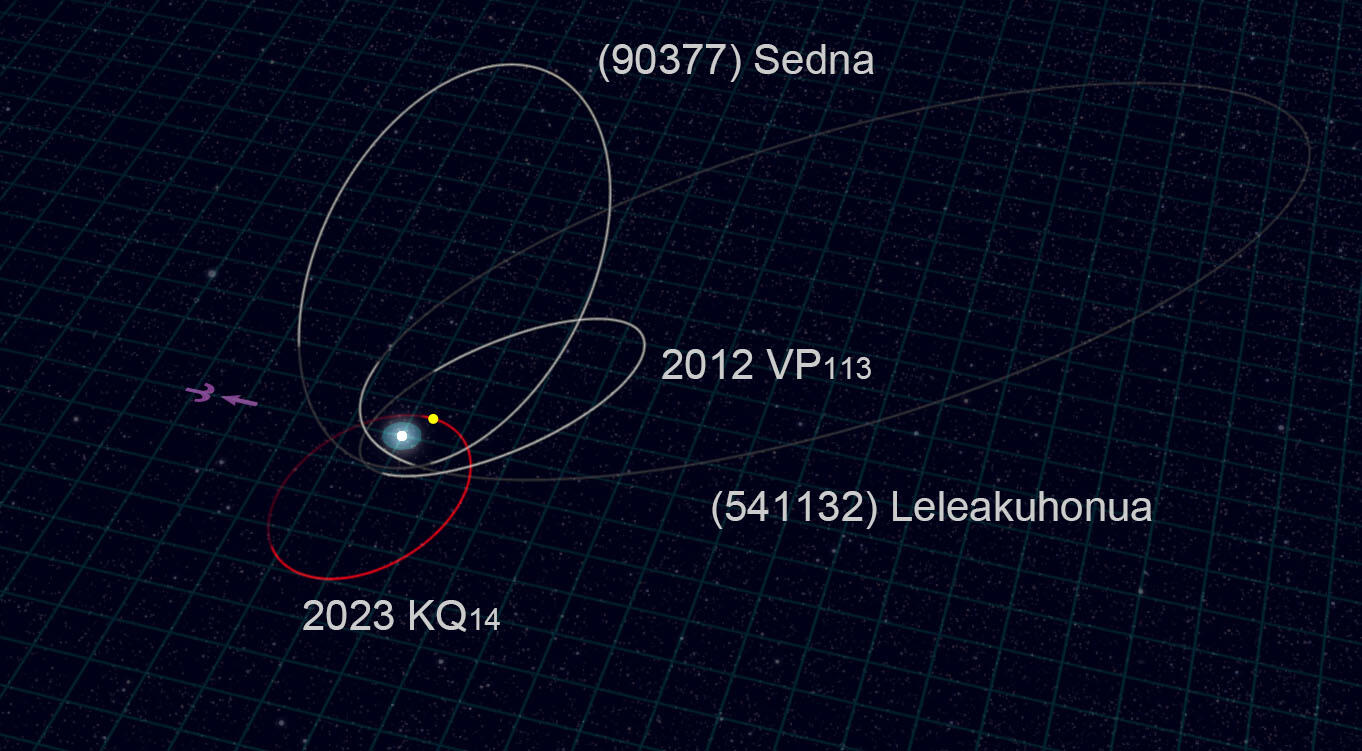
Several authors have asked this question over the past several decades, but Siraj and collaborators added a new twist: instead of studying either the giant planets or the cold classical Kuiper Belt, they instead focused exclusively on the “distant sednoids.” This rarefied collection of only nine known objects includes only the most distant minor planets in our solar system: the sednoids never come within 40 au of the Sun, and they spend much of their orbits beyond 400 au. Interestingly, however, all of them orbit on planes that are fairly aligned with that of the planets, and none ever strays farther than 20° from the ecliptic.

A black background with the sun at center surrounded by several large ovals, each labeled with the name of a minor planet.

An illustration of the orbits for some of the distant sednoids considered in this study. Click to enlarge. [NAOJ]

Through a suite of numerical simulations, Siraj and collaborators demonstrate that this relatively tight distribution of inclinations implies that the Sun couldn’t have been too roughed up on its way out of the cluster. By simulating many different close flybys and their influence on the distant sednoids, the researchers constrained the product of the number of stars in the Sun’s birth cluster and the time the Sun spent there to be less than or equal to 5 billion years per cubic parsec. Assuming a typical cluster density of 100 stars per cubic parsec, this suggests that the Sun cleared out of the densest and most dangerous part of the cluster within just 50 million years.

The authors stress that this conclusion leans on the assumption that the distant sednoids arrived on their extreme orbits essentially immediately, though in fact astronomers aren’t sure exactly how and when these objects ended up on the outskirts of the solar system. If the sednoids were in fact implanted onto their orbits early on, this limit on how long it took the Sun to leave its siblings is by far the strongest to date. With the Vera C. Rubin Observatory poised to discover thousands of new distant solar system objects, it’s likely that the bound will grow even more stringent in the next few years.

Citation

“Limits on Stellar Flybys in the Solar Birth Cluster,” Amir Siraj et al 2025 ApJL 993 L4. doi:10.3847/2041-8213/ae1025

The post The Sun Left Home in a Hurry appeared first on AAS Nova.

Supermassive Black Hole in a Super Tiny Galaxy Found with JWST

26 September 2025 at 17:00

ultracompact dwarf galaxy

With very small stellar masses and tiny radii, ultracompact dwarf galaxies raise questions about the dividing line between the highest-mass star clusters and the lowest-mass galaxies. A recently published article leverages JWST’s high resolution to target one tiny galaxy and investigate its origins.

UCD 736

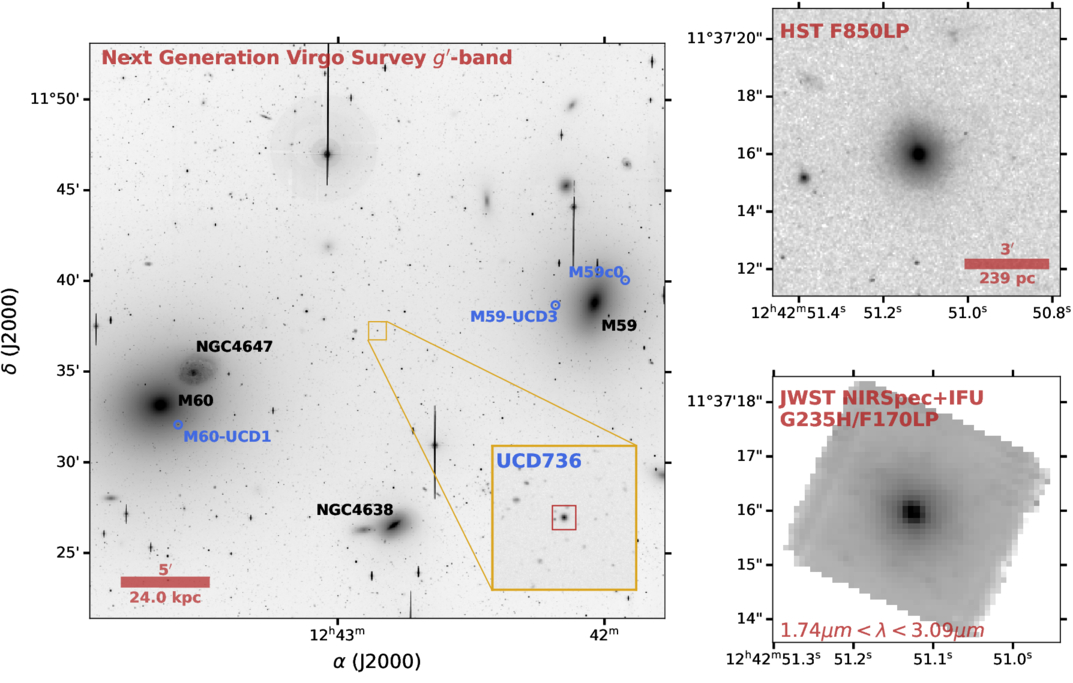
Location of UCD 736 in the Virgo Cluster with the other ultracompact dwarf galaxies with supermassive black hole detections labeled. Click to enlarge. [Taylor et al 2025]

Origins of Ultracompact Dwarf Galaxies

How tiny can a galaxy get? Discovered 20 years ago among the dense environments of the Virgo and Fornax clusters, ultracompact dwarf galaxies walk the line between the largest globular clusters and the smallest galaxies. Determining if these dwarfs are stellar in nature or actually of galactic origin is complex, but one sure way to get at this question is to determine if an ultracompact dwarf galaxy houses a supermassive central black hole. 

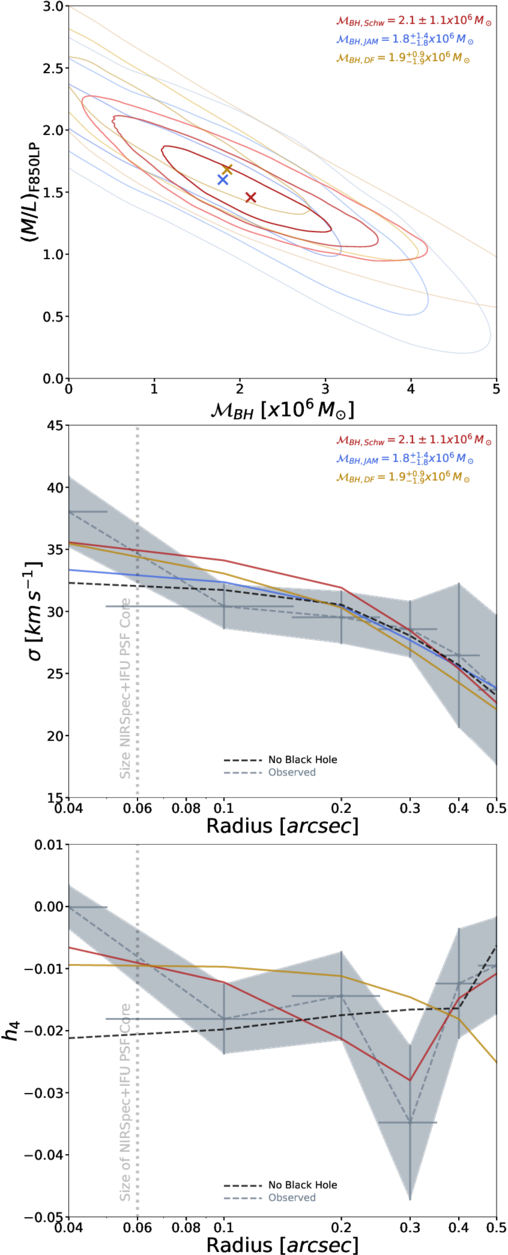
While astronomers have identified hundreds of these tiny dense galaxies, supermassive black holes have been detected in only five. Hoping to extend this sample, Matthew Taylor (University of Calgary) and collaborators targeted UCD 736, an ultracompact dwarf galaxy located in the Virgo galaxy cluster. If a massive black hole is found in this galaxy, it will be the smallest and least luminous ultracompact dwarf to have such a detection. Exploring galaxies at such small sizes will allow researchers to determine what fraction of ultracompact dwarfs have galactic or star cluster origins, which can provide insights into massive black hole seeding mechanisms in the early universe.

Modeling Black Hole Mass

Model results

Summary of results for the three black hole modeling methods for UCD 736, indicating the quality of the models and how the observed velocity dispersion and spatial distribution of the galaxy fit with the models. Click to enlarge. [Taylor et al 2025]

In order to search for a central black hole in UCD 736, Taylor and team obtained high-resolution spectroscopy from JWST and supplemental imaging from the Hubble Space Telescope. The authors used the stellar kinematics and light profile of the galaxy to estimate the mass of its central black hole with three independent modeling methods. Based on the expected impacts of a massive black hole on galaxy dynamics and the estimated stellar population of the galaxy, the authors found that UCD 736 likely hosts a central supermassive black hole with mass ~2.1 million times the mass of the Sun. 

However, the authors noted that the three models do not provide equivalent confidence levels in this estimate — while one model confidently rules out the possibility of no central black hole at 3σ significance, the other two models were less constraining, ruling out the possibility of there not being a black hole to only 1σ. Despite these differences, all three models agree on the central black hole mass within the first confidence interval, indicating a positive detection of a black hole in UCD 736.

Progenitor of UCD 736

From their observations and modeling, the authors presented the fifth positive detection of an ultracompact dwarf galaxy with a central supermassive black hole within the Virgo Cluster. Given the presence of this black hole, UCD 736 likely originated as a more massive galaxy that was tidally stripped as it interacted with other nearby cluster galaxies. Interestingly, though, other ultracompact dwarf galaxies with black hole detections in the Virgo Cluster are much closer to the massive galaxy that likely stripped them. UCD 736 sits about 160,000 light-years outside of the nearest giant galaxy Messier 59’s tidal radius, which does not rule out interactions but could indicate that Messier 59 is particularly good at stripping material from smaller galaxies. 

Continued searches for black holes in ultracompact dwarfs will further probe the differences between the highest-mass globular clusters and the lowest-mass galaxies. Revealing more within this parameter space will allow astronomers to test black hole seeding and galaxy formation theories.

Citation

“A Supermassive Black Hole in a Diminutive Ultracompact Dwarf Galaxy Discovered with JWST/NIRSpec+IFU,” Matthew A. Taylor et al 2025 ApJ 991 L24. doi:10.3847/2041-8213/ae028e

The post Supermassive Black Hole in a Super Tiny Galaxy Found with JWST appeared first on AAS Nova.

Astronomers Spot Possible Disk in Rubin Observatory First-Look Image

16 July 2025 at 18:33

Lagoon and Trifid Nebulae

Editor’s Note: Shortly after the publication of this article, we became aware that the disk described in this work was previously discovered by Wei-Hao Wang, as reported in the Astronomer’s Telegram in July 2024.

On 23 June 2025, the public got its first look at images from the NSF–DOE Vera C. Rubin Observatory — and the discoveries are already starting to roll in.

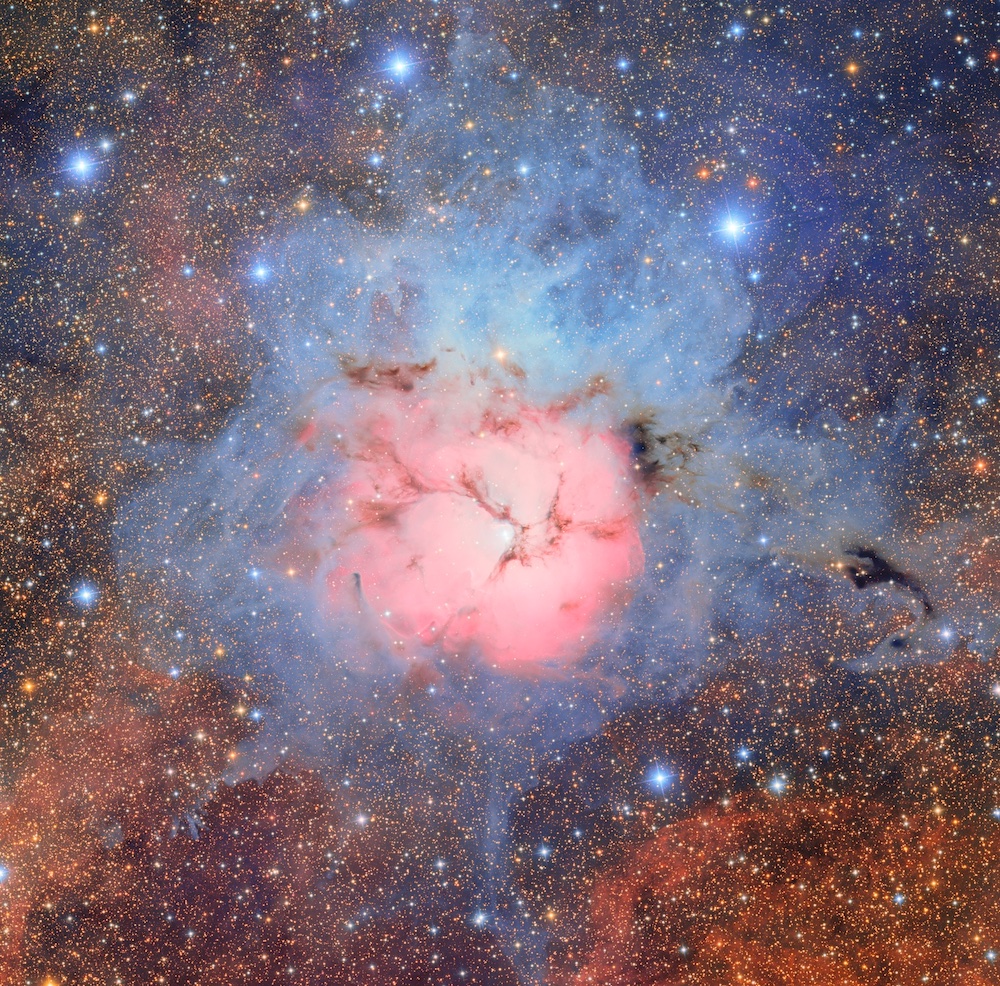
Trifid and Lagoon

Trifid Nebula closeup

A closeup of the Trifid Nebula from one of the Rubin Observatory first-look images. [Adapted from NSF–DOE Vera C. Rubin Observatory; CC BY 4.0]

One of the first-look images from Rubin features two photogenic star-forming regions in the Milky Way: the Trifid Nebula (Messier 20) and the Lagoon Nebula (Messier 8). The image, which was constructed from 678 exposures totaling 7.2 hours of observations, demonstrates Rubin’s ability to quickly cover large swaths of sky.

The Trifid and Lagoon nebulae are both HII regions, making them ideal places to search for circumstellar and protoplanetary disks, as well as proplyds — protoplanetary disks that are in the process of being evaporated by the intense radiation from nearby massive stars. The glowing gas of an HII region provides the background illumination needed to pick out the silhouettes of dark and dusty disks.

disk candidate

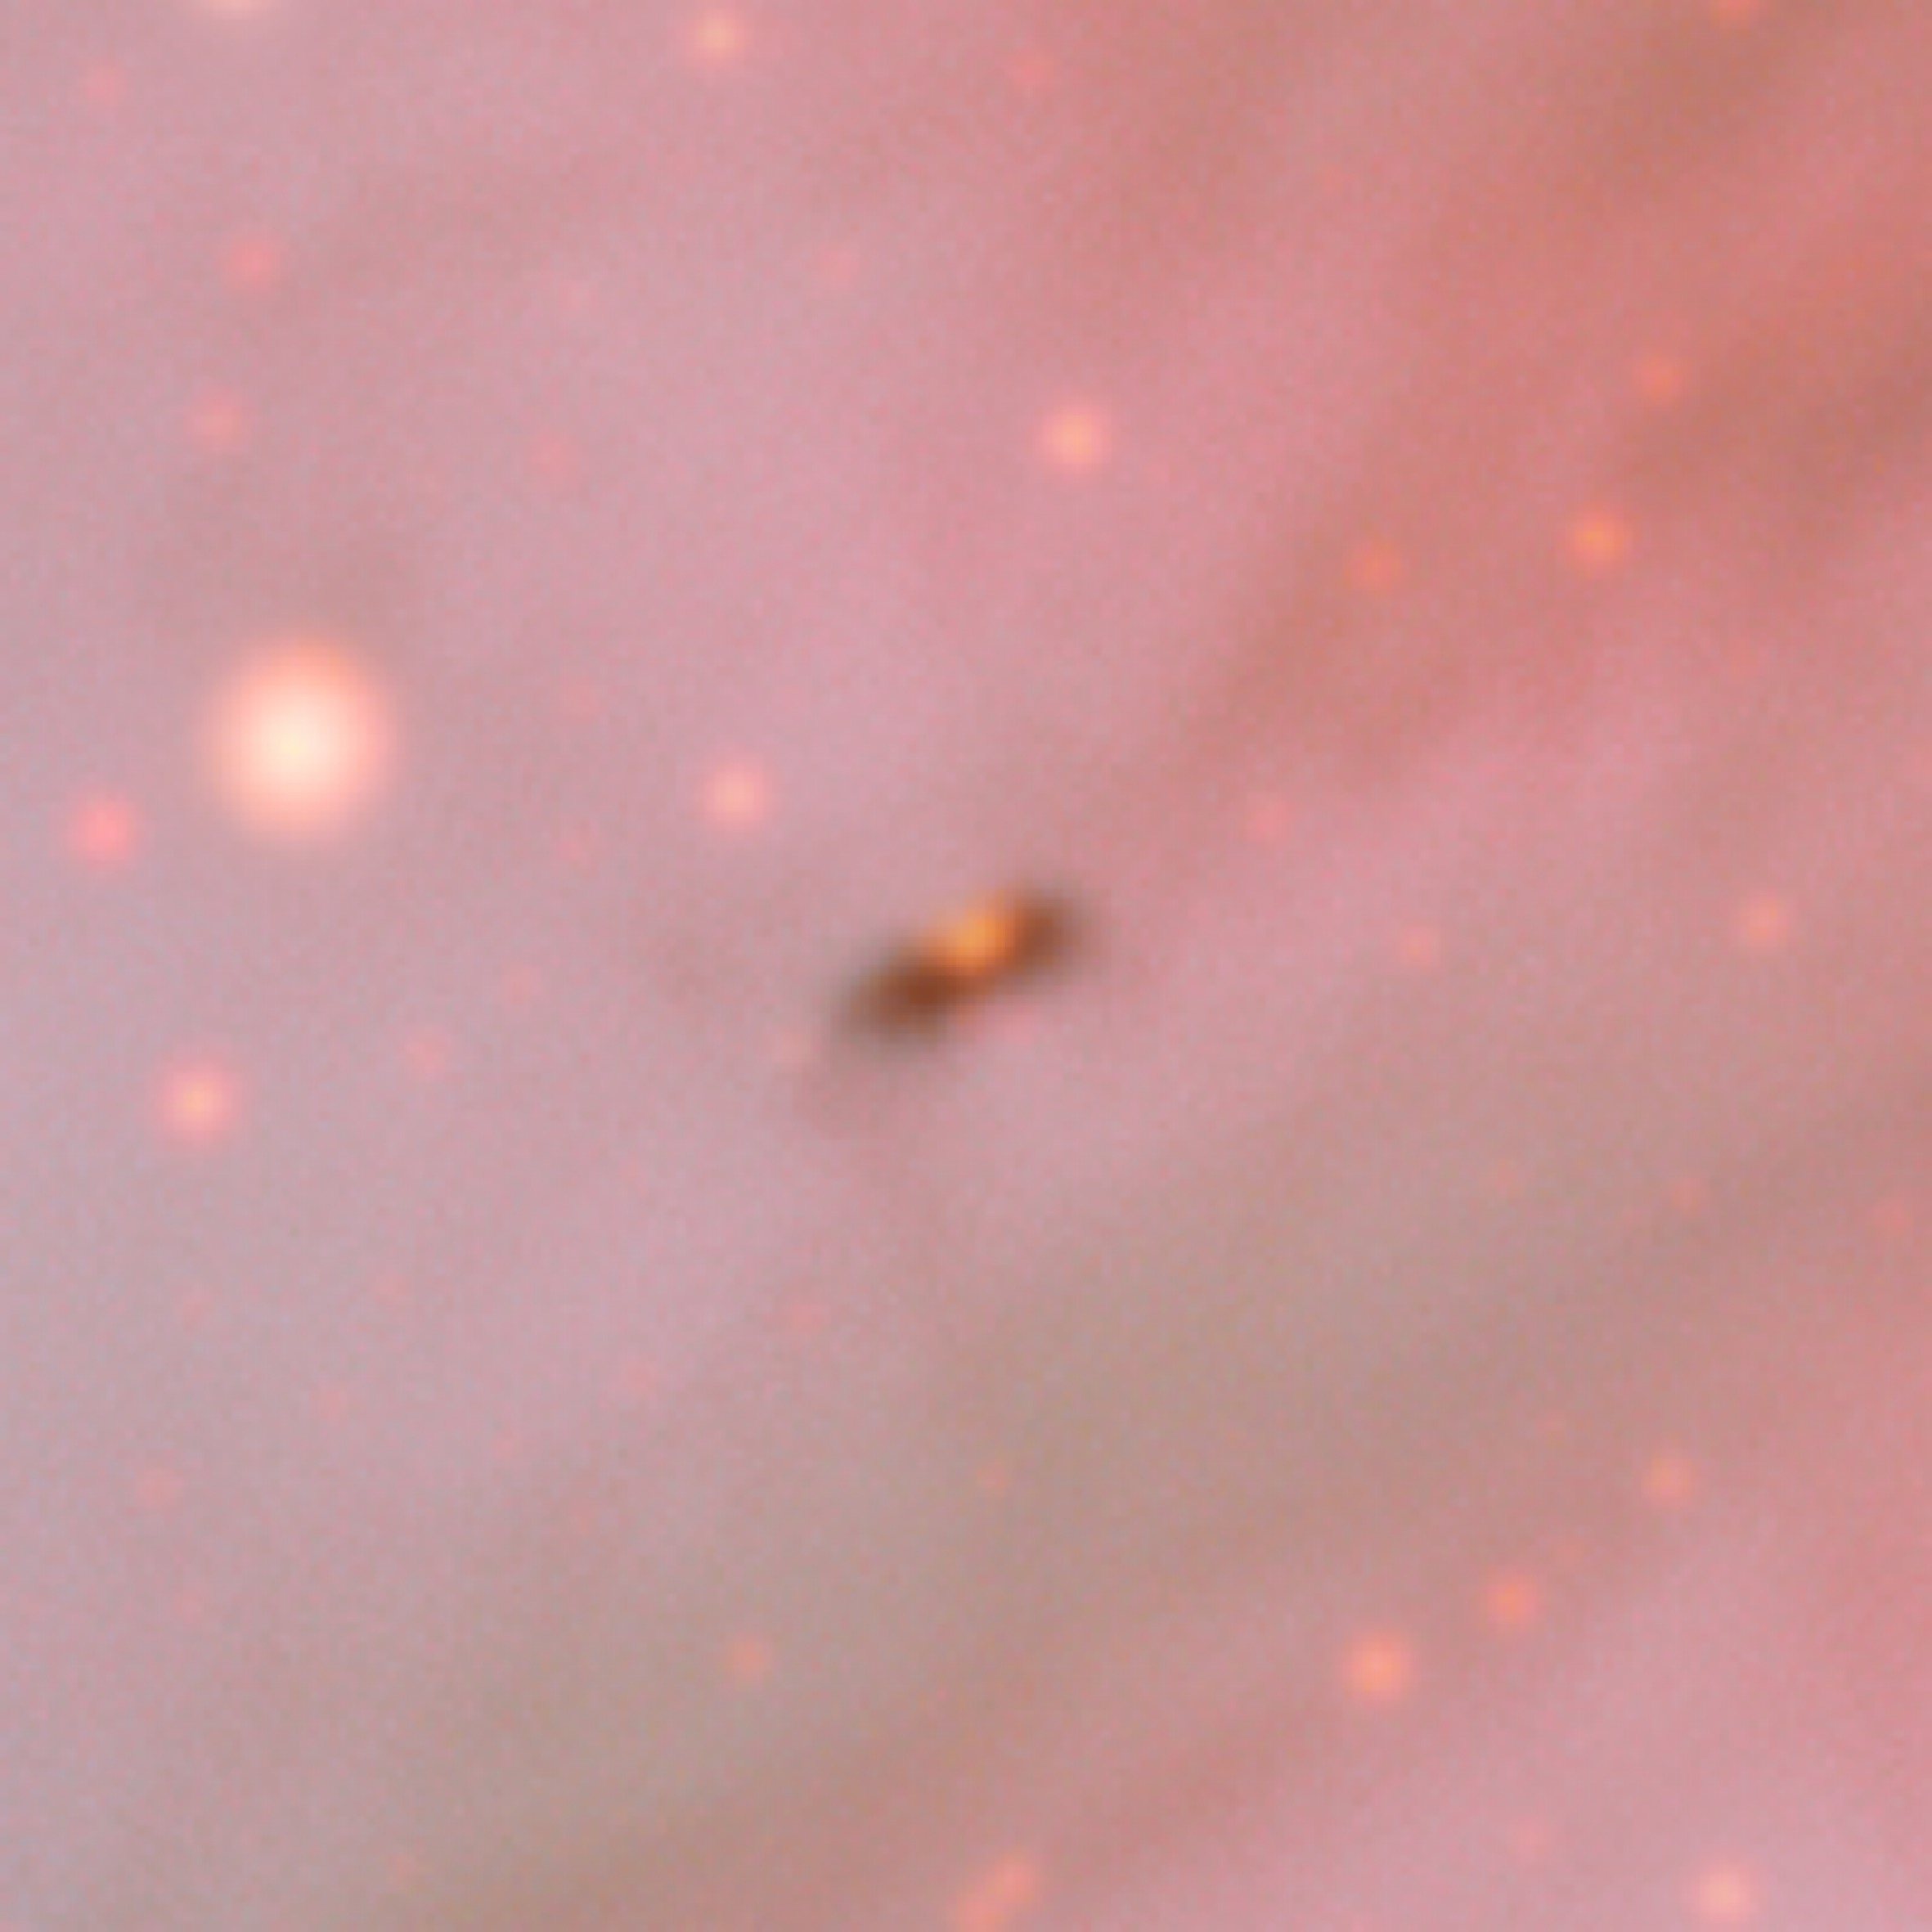
The Trifid Nebula disk candidate identified in this work. [Adapted from Zamani & Rector 2025]

Disk Detected

Published today in the Research Notes of the AAS, Mahdi Zamani (Zamani Scientific Visualizations & Imaging) and Travis Rector (University of Alaska Anchorage) reported the results of their search for proplyds in the Rubin image of the Trifid and Lagoon nebulae. The team detected one candidate circumstellar or protoplanetary disk on the edge of the Trifid Nebula, surrounded by tenuous, filamentary clouds of gas and dust.

The Rubin data don’t show evidence for ionized gas surrounding the disk, so it’s not yet clear if the object should be classified as a proplyd. The disk has a projected distance of 7.5 light-years from HD 164492A, the O-type star whose intense radiation is responsible for energizing the surrounding nebula, and may also be capable of ionizing the disk studied here.

Disk Detected

infrared image of the stars and protostars in the orion nebula

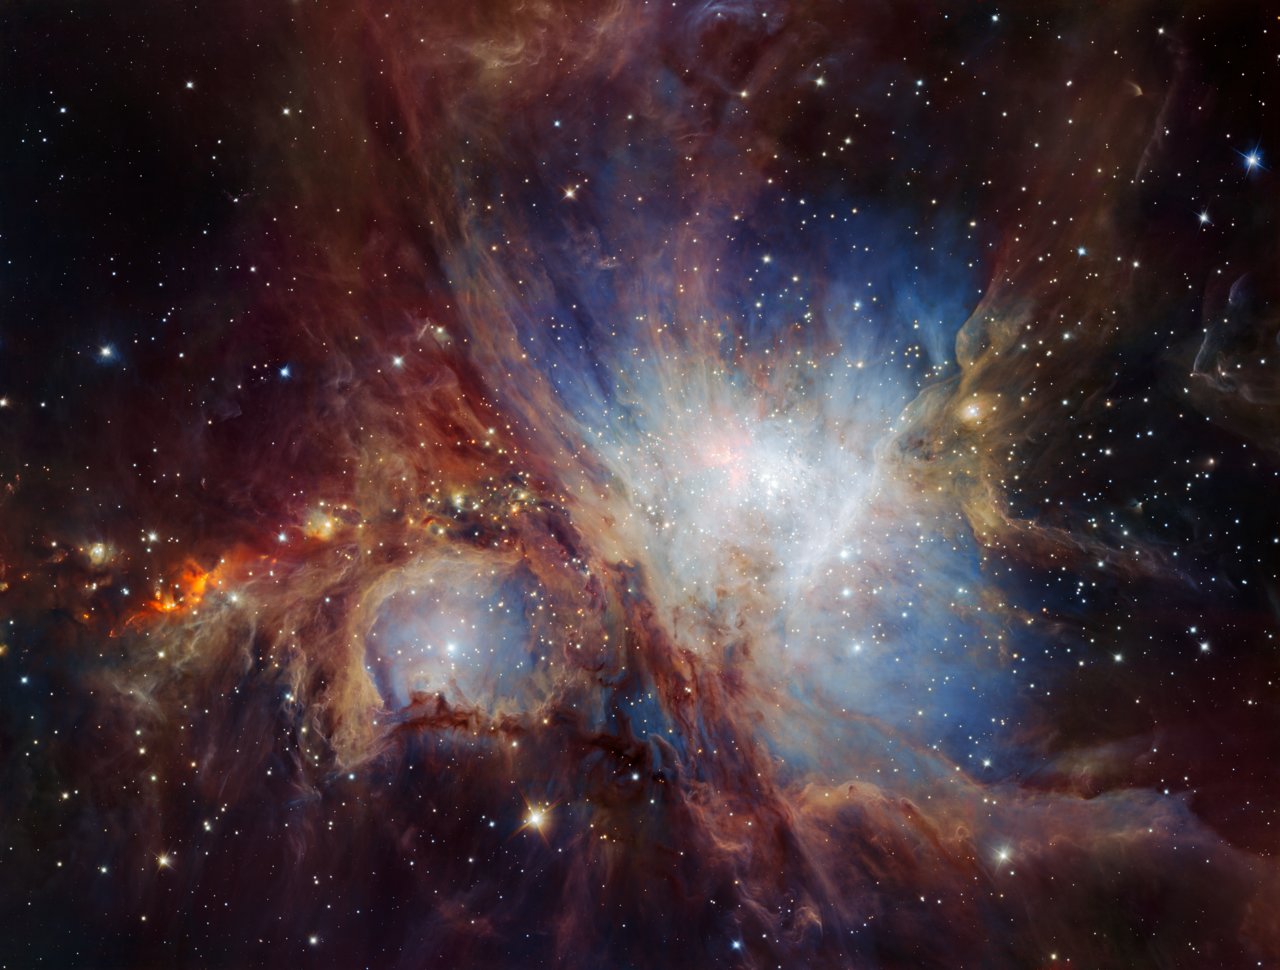
The Orion molecular cloud complex is among the most active star-forming regions in the Milky Way, home to hundreds of protostars and thousands of pre-main-sequence stars. [ESO/H. Drass et al.; CC BY 4.0]

This disk candidate is remarkable for both its size and location. With an estimated diameter of 4,000 au, it’s larger than most known circumstellar disks. Finding a disk outside the nearby Orion Nebula is also comparatively rare, since searches in more distant star-forming regions require finer resolution than the nearby Orion Nebula. (Orion is about 1,300 light-years away, and the Trifid Nebula is about 4,000 light-years away.)

Researchers have searched the Trifid Nebula previously for signs of protoplanetary disks, but while those searches found evidence for disks around hot stars near the center of the cluster, this particular disk candidate went undetected. Previous searches likely didn’t cover a large enough area of the nebula, or perhaps lacked the resolution needed to differentiate between the dusty disk and the nearby filamentary gas clouds. With Rubin’s broad field of view and precise resolution, the observatory was well-positioned to spot this disk candidate.

Citation

“The Potential Discovery of a Circumstellar Disk in M20 from Rubin First Look,” Mahdi Zamani and T. A. Rector 2025 Res. Notes AAS 9 172. doi:10.3847/2515-5172/ade982

The post Astronomers Spot Possible Disk in Rubin Observatory First-Look Image appeared first on AAS Nova.

Featured Image: Low-Mass Brown Dwarfs in a Class of Their Own?

14 July 2025 at 17:00

IC 348

The glowing green nebula in this JWST image surrounds the star cluster IC 348, which is the subject of a recent study by Kevin Luhman (Penn State University) and Catarina Alves de Oliveira (European Space Agency). Using JWST’s Near-Infrared Camera, Luhman and Alves de Oliveira searched the cluster’s young stellar population for free-floating brown dwarfs — objects that are less massive than stars but more massive than most planets — and discovered multiple candidates with masses down to just twice the mass of Jupiter. Follow-up JWST spectroscopy confirmed the masses of these objects, making them the lowest-mass brown dwarfs known to date. In addition to their mass, these newly discovered brown dwarfs are remarkable because their spectra show evidence of hydrocarbon molecules, the exact identities of which are not yet known. Luhman and Alves de Oliveira proposed that low-mass brown dwarfs bearing this chemical signature be inducted into a new spectral class called “H” for “hydrocarbon.” To add to the intrigue of these objects, the authors also discovered signs of circumstellar disks around two of them, suggesting that they may be capable of forming and harboring planets. To learn more about the low-mass brown dwarfs in IC 348, be sure to check out the full research article linked below.

Citation

“A New Spectral Class of Brown Dwarfs at the Bottom of the IMF in IC 348,” K. L. Luhman and C. Alves de Oliveira 2025 ApJL 986 L14. doi:10.3847/2041-8213/addc55

The post Featured Image: Low-Mass Brown Dwarfs in a Class of Their Own? appeared first on AAS Nova.

Monthly Roundup: A Deep View of Planet-Forming Disks with ALMA

28 May 2025 at 17:00

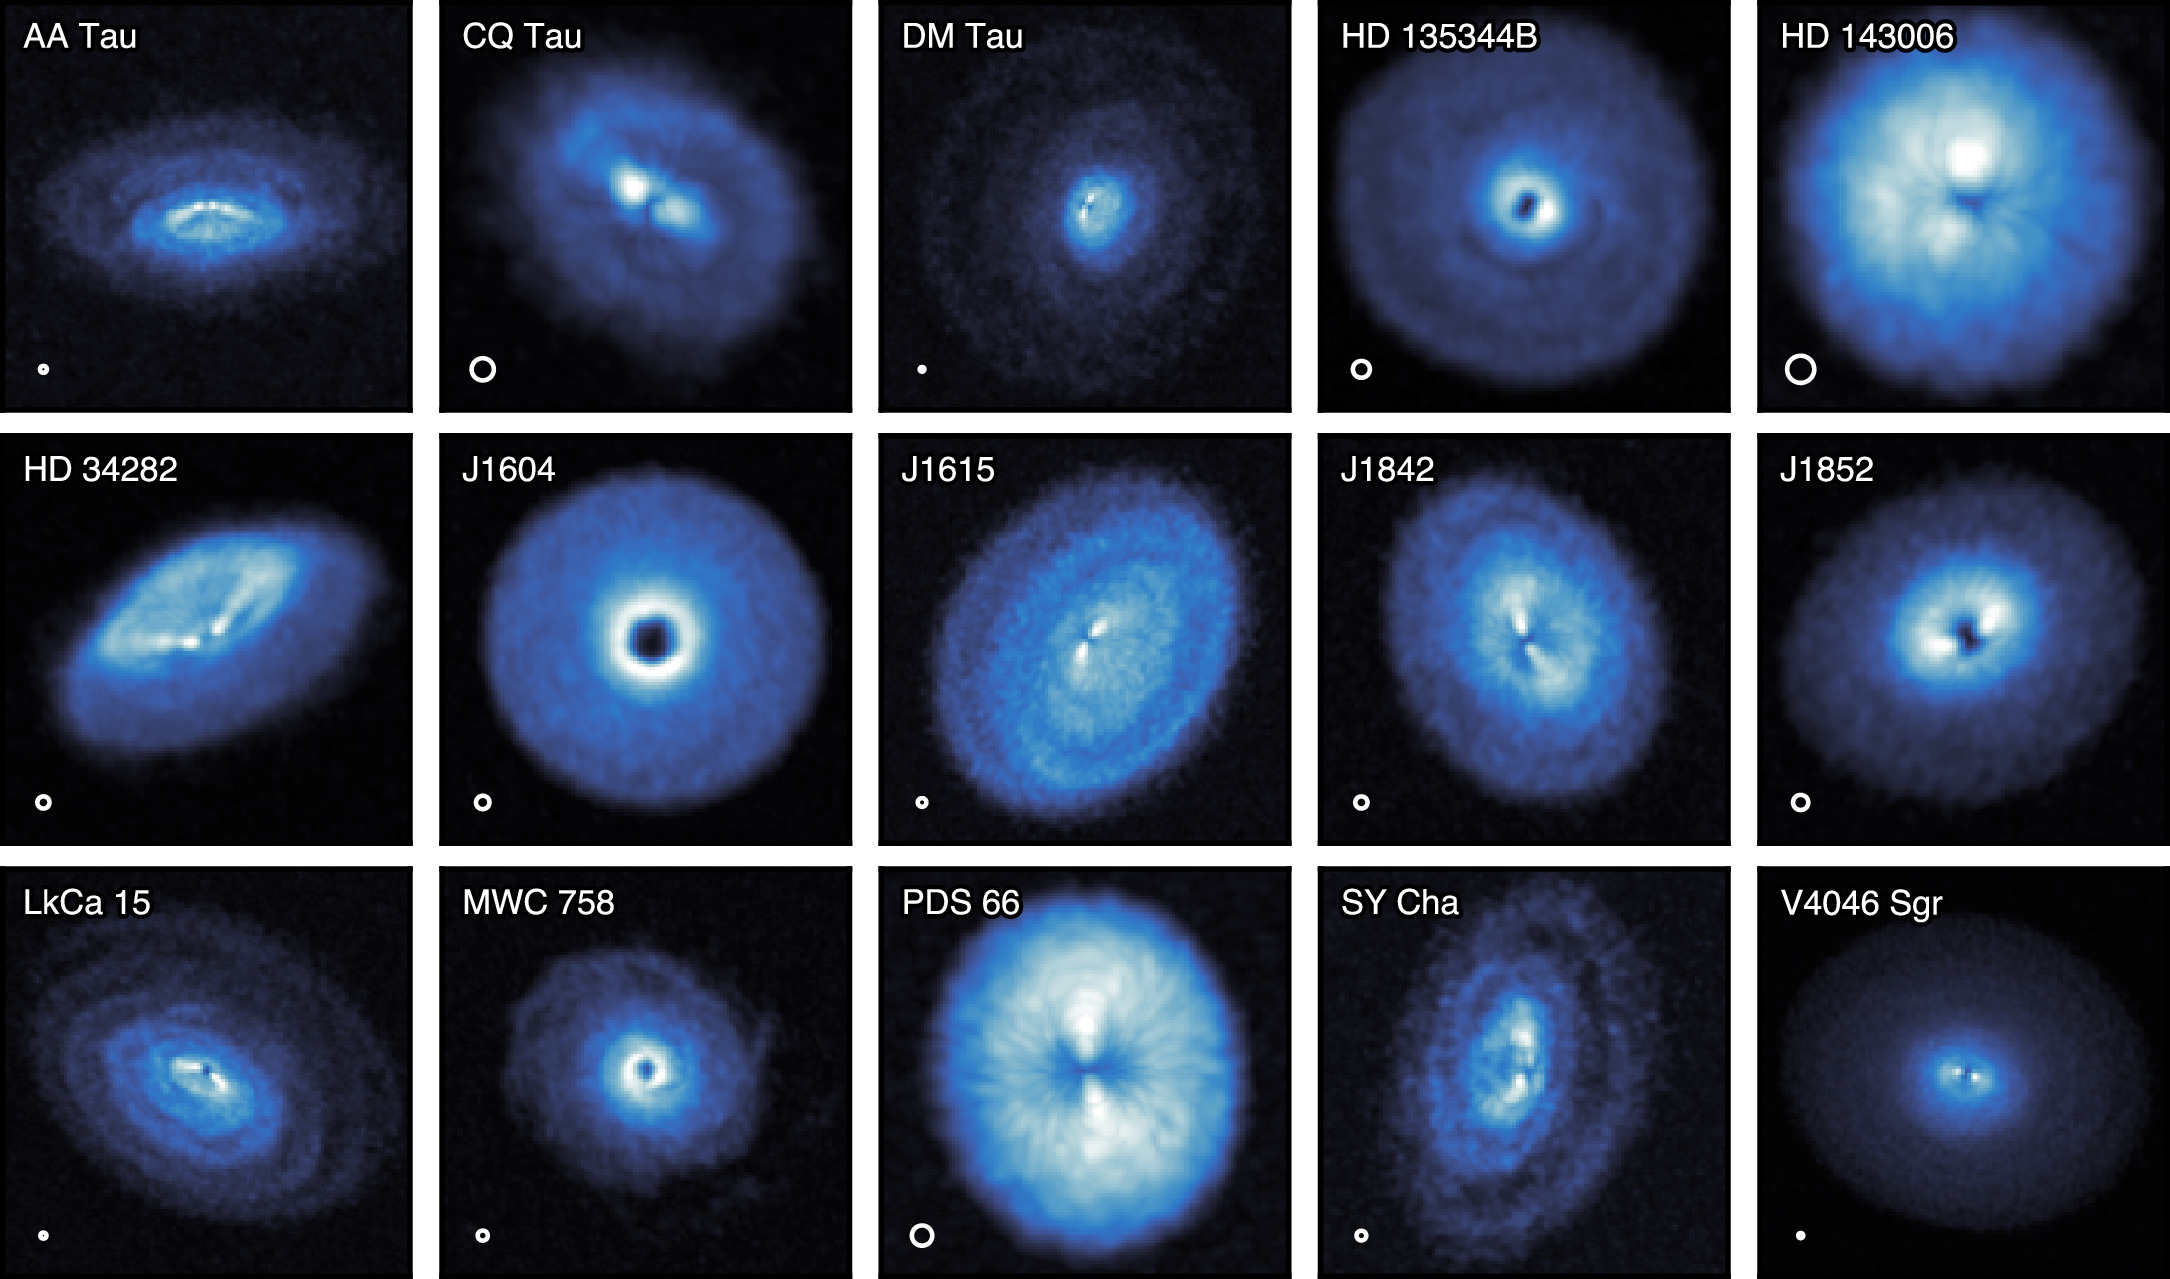
radio images of eight protoplanetary disks

Protoplanetary disks, the sites of planet formation around young stars, are rich and complex objects. An in-depth investigation of 15 protoplanetary disks has recently been published in a Focus Issue of the Astrophysical Journal Letters. This investigation leveraged the exquisite resolution and sensitivity of the Atacama Large Millimeter/submillimeter Array (ALMA), a moveable network of 66 radio dishes in the Atacama Desert in Chile.

Featuring high-resolution observations of multiple gas species, updated image processing techniques, and state-of-the-art modeling, the exoALMA project examines the early stages of planet formation, when protoplanets embedded within dusty disks induce rings, gaps, spirals, and other structures.

This Monthly Roundup consists of quick snippets describing each of the currently published research articles in the exoALMA Focus Issue of the Astrophysical Journal Letters. Each snippet links to the corresponding research article, and the Focus Issue landing page is linked at the bottom of this post.

Introducing exoALMA

exoALMA disks

The full exoALMA sample. All 15 disks show evidence of substructure in their gas emission. [Teague et al. 2025]

First up, exoALMA project PI Richard Teague (Massachusetts Institute of Technology) and collaborators introduced the survey, the disk sample, and the science goals. The team mapped the dust and gas distributions of 15 protoplanetary disks that were selected for their brightness, large size, lack of obscuration, and low inclination angles. The three key science goals were to 1) detect protoplanets hidden within the disks, 2) study the disks’ dynamical structures, especially as these structures relate to instabilities that can perturb the disks and determine their lifetimes, and 3) determine the disks’ density and temperature structure.

Interpreting interferometric data from ALMA requires special care, as Ryan Loomis (National Radio Astronomy Observatory) and coauthors show in their overview of the data calibration and imaging pipeline. The team described their methods of processing the data, including a recently developed alignment method that greatly reduces the number of artifacts that could be mistaken for planet-induced velocity perturbations.

plot of emitting surface of J1615

Emitting height from images processed using the standard method (CLEAN) and using regularized maximum likelihood (RML). [Adapted from Zawadzki et al. 2025]

Although extreme care was taken not to introduce spurious signals through the calibration process, it’s critical to perform additional tests to confirm that detected signals are real, rather than artifacts. To that end, Brianna Zawadzki (Wesleyan University) and coauthors presented exoALMA images processed with a procedure called regularized maximum likelihood. The regularized maximum likelihood–processed images showed the same non-Keplerian features as the images processed with the standard algorithm, suggesting that these features are real.

Analysis Methods and Toolkit Testing

Analyzing observations of protoplanetary disks is challenging, motivating Thomas Hilder (Monash University) and collaborators to take the first step toward addressing issues like beam smearing, the creation of probabilistic data products, and incorporating a realistic noise model. Using their newly developed methods, the team analyzed several disks in the exoALMA sample, finding velocity substructures at greater velocities than existing methods.

Vertical structure and Keplerian rotation of the exoALMA sample

Vertical structure and Keplerian rotation of the exoALMA sample as inferred from modeling. Click to enlarge. [Izquierdo et al. 2025]

Andrés Izquierdo (University of Florida; Leiden University; European Southern Observatory) and collaborators described their methodology for investigating gas structure in the exoALMA sample. The team’s fitting method allowed them to separate the contribution of a disk’s front and back sides from the rest of its emission, leading to estimates of the orientation and vertical profile of each disk.

Jaehan Bae (University of Florida) and collaborators drew attention to the tools astronomers use to interpret observations of protoplanetary disks — namely, forward models. Bae’s team used five different hydrodynamics models to simulate a protoplanetary disk harboring an embedded giant planet. Then, they used two radiative transfer models to simulate carbon monoxide channel maps and calculate the temperature of the disk. Finally, they extracted the location of the synthetic planet. This investigation ultimately showed good agreements between the model outputs, showing that any combination of the models tested in this work is suitable.

plots of nonaxisymmetry of the exoALMA sample

Residual signal-to-noise ratio for the exoALMA sample, ordered from least to most nonaxisymmetric. Rings and gaps are marked with solid and dashed ellipses, respectively. Click to enlarge. [Curone et al. 2025]

Seeking Structure

A team headed by Pietro Curone (University of Milan; University of Chile) examined the rich ALMA dataset for signs of structure within the disks. The team modeled each disk with an axisymmetric model, then subtracted off the best-fitting model to reveal substructures and asymmetries in the disks. Several features were revealed, including shadows, offsets between inner and outer disks, spiral structures, and crescent-shaped asymmetries. Though one disk, PDS 66, was apparently without any internal structure, this investigation showed that structures are common in this sample of large, bright disks. Further work is needed, however, to explore whether these features are common in the disk population as a whole.

Maria Galloway-Sprietsma (University of Florida) and collaborators identified the disk surfaces that emit particular spectral lines. The team found that 12CO traced the upper atmosphere of the disks, while 13CO — an isotopologue of the more common molecule 12CO — and CS (carbon monosulfide) probed deeper regions. In addition, nearly all of the disks showed evidence of localized substructure, highlighting the need for theoretical work to explain the wide variety of disk structures and behaviors.

Evidence for Planets

exoALMA images of disks with velocity kinks due to the presence of a planet

From top to bottom: velocity kinks associated with an embedded planet; 12CO observations with the identified velocity kinks; filtered ALMA observations, showing the location of the planetary wake; exoALMA continuum emission; and polarimetric images. The blue circles show the locations of the purported planets. Click to enlarge. [Pinte et al. 2025]

Christophe Pinte (University Grenoble Alpes; Monash University) and collaborators analyzed substructures revealed by 12CO emission. These images revealed arcs, spiral arms, and kinks in 13 out of the 15 disks in the sample. Of these, six were consistent with wakes forming due to planets with masses between 1 and 5 Jupiter masses orbiting at 80–310 au.

Charles Gardner (Rice University; Los Alamos National Laboratory) and coauthors focused on LkCa 15, a disk that appears markedly different in dust and gas emission. The disk’s dust continuum emission shows a 40-au-wide region depleted of dust, while the gas emission, traced by CO, shows no depletion of gas in the same region. Though previous infrared observations have suggested that this dust-depleted region could host massive planets, Gardner’s team concluded that a chain of small planets or processes unrelated to planet formation likely excavated the region instead.

A team led by Jochen Stadler (Côte d’Azur University) searched for deviations from Keplerian rotational velocity — potential evidence for embedded protoplanets. The team discovered deviations up to 15% from the background velocity, with deviations appearing at both large and small radial scales. Rings and gaps visible in the dust emission tended to align with gas pressure maxima and minima, respectively. However, the team also found gas pressure structures in the outer disk that were beyond the dust emission and were not accompanied by rings or gaps.

Comparison of kinematic and emission-line-derived masses for the exoALMA sample

Comparison of kinematic and emission-line-derived masses. Click to enlarge. [Trapman et al. 2025]

Masses and Abundances

A team led by Cristiano Longarini (University of Cambridge; University of Milan) put the disks of the exoALMA sample on the scale. By modeling the rotation curves of 12CO and 13CO, the team constrained the masses of 10 disks and their central stars. Leon Trapman (University of Wisconsin-Madison) and collaborators also considered the problem of disk masses. The team used CO and N2H+ emission to measure the gas masses of 11 disks in the exoALMA sample and compared the results to previous kinematic measurements. The two sets of measurements tend to agree within a factor of three.

Giovanni Rosotti (University of Milan) and collaborators introduced a new model that connects the emitting height of CO molecules to the gas surface density and temperature. Unlike existing models, the team’s new model can be applied to optically thick observations. Comparing the results of this new method with dynamical estimates relying on interstellar medium abundances of CO yields lower gas masses, suggesting that the CO abundance in the protoplanetary disks studied is depleted relative to the interstellar medium.

Turbulence, Traps, and Vortices

Protoplanetary disks are expected to experience turbulence, large-scale gas motions, and instabilities. Marcelo Barraza-Alfaro (Massachusetts Institute of Technology) and collaborators investigated whether a program like exoALMA could detect signs of these processes at work. The team used 3D numerical simulations to explore the observational signatures of the vertical shear instability, the magnetorotational instability, and the gravitational instability. They found that rings, arcs, and spirals can arise from instabilities. While spirals present in the disks in the exoALMA sample could feasibly be due to the magnetorotational instability or the gravitational instability, ring-like and arc-like features due to the vertical shear instability were not detected.

Tomohiro Yoshida (National Astronomical Observatory of Japan; The Graduate University for Advanced Studies) and collaborators reported on their detection of pressure-broadened emission-line wings in RX J1604.3−2130 A. This detection allowed the team to constrain the disk’s gas surface density — a critical property related to the mass available to form planets. They also clearly showed a dust ring coinciding with a gas pressure maximum, proving that gas pressure maxima can create dust traps. The gas-to-dust surface density ratio at the location of this dust trap suggests that the disk has already birthed protoplanets or the dust trapping efficiency is low.

dust crescents in four protoplanetary disks

Locations of crescent-shaped dust clumps in the four disks from this study. Click to enlarge. [Adapted from Wölfer et al. 2025]

Vortices are theorized to shepherd dust grains into crescent-shaped traps, providing an environment for dust grains to clump together and grow into planetesimals and eventually planets. Lisa Wölfer (Massachusetts Institute of Technology) and collaborators searched for kinematic signatures of dust-trapping vortices in CO line emission from four disks that exhibit crescent-shaped concentrations of dust. None of the four disks exhibited the clear signature of a vortex, and higher-resolution data or observations of emission lines that trace motions closer to the midplane of the disk may be necessary to probe this signal further.

The full list of articles in this Focus Issue can be found here.

Citation

“exoALMA. I. Science Goals, Project Design, and Data Products,” Richard Teague et al 2025 ApJL 984 L6. doi:10.3847/2041-8213/adc43b

The post Monthly Roundup: A Deep View of Planet-Forming Disks with ALMA appeared first on AAS Nova.

❌