❌

Normal view

Breaking the Ice: Origins of Carbon Oxides on Uranian Moons

11 September 2026 at 22:06

Uranus close-up

For decades, astronomers have tried to decipher the source of carbon oxides on Uranus’s largest moons from ground-based telescopes. A recent study has leveraged JWST spectroscopy and laboratory experiments to identify carbon oxides and their origins for Ariel, Umbriel, Titania, and Oberon.

Unknown Origins of Carbon Oxide Enrichment

Forty years ago, the Voyager 2 spacecraft flew past Uranus and its twenty-seven moons, sending back prized portraits of the planet’s large and tidally locked satellites Miranda, Ariel, Umbriel, Titania, and Oberon. These images revealed extensive valleys, smooth plains, deep canyons, and possible icy volcanic (cryovolcanic) activity across the surfaces of the icy moons — the telltale signs of intense geologic activity. While Voyager 2 could take spectacular pictures, the spacecraft was not capable of identifying the molecules and materials making up these active surfaces.

Six largest moons of Uranus

Voyager 2 images of Uranus’s six largest moons. Click to enlarge. [NASA / JPL-Caltech / Ted Stryk; CC BY-NC-ND 4.0]

In the decades that followed, astronomers have used ground-based near-infrared spectroscopy of these moons to investigate their chemical compositions. These observations have detected weak carbon dioxide and hints of carbon monoxide ice features on the moons with clear spatial trends across the moons’ surfaces, but the origins of these carbon oxides remain unknown. There are two potential explanations for the presence of these molecules: 1) carbon oxides are native to the Uranus system, present from formation, or 2) they formed via radiolysis, in which charged particles trapped in Uranus’s magnetic field interact with water ice and carbon-bearing molecules on the moons’ surfaces.

Ground-based detections are limited due to contamination from Earth’s atmosphere as well as the overall weakness of the carbon dioxide spectral features, thus space-based near-infrared observations of the Uranian moons are necessary to better constrain the carbon oxides on the satellites. Luckily, JWST’s Near-Infrared Spectrograph (NIRSpec) now offers astronomers unimpeded access the moons’ carbon oxide spectral features.

Chemical Clues from Space and in the Lab

In 2024, a study acquired NIRSpec observations of Uranus’s moon Ariel, revealing prominent carbon dioxide features and confirming the presence of carbon monoxide ice hinted at by ground-based studies. Expanding on these observations to include Umbriel, Titania, and Oberon alongside Ariel, Richard J. Cartwright (Johns Hopkins University) and collaborators obtained JWST NIRSpec spectroscopy of Uranus’s four largest moons in hopes of disentangling the origin story of their carbon oxides.

Leading and trailing diagram

Diagram illustrating the leading and trailing sides of a moon orbiting Uranus. Click to enlarge. [AAS Nova/Kerry Hensley]

In addition to the JWST spectra, Cartwright and team performed laboratory experiments measuring the spectral properties of carbon dioxide ice over a range of very low temperatures (tens of kelvin). These experiments provided a better understanding of the spectral properties and nature of carbon dioxide on the surfaces of the Uranian moons. Comparing the JWST spectra with the laboratory spectra, the authors found that Ariel, Umbriel, Titania, and Oberon exhibit a variety of spectral features resulting from carbon dioxide ice, carbon monoxide ice, and other carbon-bearing molecules. The presence of these molecules varies between the leading and trailing hemispheres of the moons, these variations appearing strongest in Ariel and Umbriel. The carbon dioxide and carbon monoxide spectral features are stronger on the trailing hemispheres, decreasing with increasing distance from Uranus for all four moons.
spectral ratios

Spectral ratios of the trailing and leading hemispheres for each moon, labeling spectral features of multiple carbon-bearing molecules. Click to enlarge. [Cartwright et al 2026]

Carbon Oxide Origins

What does this mean for the origins of the carbon oxides on the Uranian moons? Spectral features of carbonate minerals and the widespread presence of carbon dioxide throughout the Uranus system suggest that these compounds exist natively. On the other hand, the concentration of carbon oxide features on the trailing hemispheres supports radiolytic production as these hemispheres are bombarded with more ionizing particles from Uranus’s magnetosphere.

Based on these results, the authors have postulated that both origin scenarios, native presence and radiolysis, are required to fully explain the presence of carbon oxides. Future laboratory studies and JWST observations will continue to reveal the nature and composition of bodies in the Uranus system, furthering our understanding of our solar system siblings.

Citation

“Tracing the Source of Carbon Oxides on the Large Moons of Uranus,” Richard J. Cartwright et al 2026 Planet. Sci. J. 7 199. doi:10.3847/PSJ/ae8818

The post Breaking the Ice: Origins of Carbon Oxides on Uranian Moons appeared first on AAS Nova.
Primordial Planetesimals from the Guts of Population III Stars

2 September 2026 at 21:45

Protoplanetary Disk

While previous investigations of planet formation across the universe’s history suggest that planets trickled into the picture, a recent study has found that primordial planetesimals could have formed much earlier from the insides of the first stars in the universe.

First Stars, First Planets?

When the first stars flickered on, the universe was filled with pristine gas, containing only hydrogen, helium, and a little lithium. This gas, though great at making massive stars known as Population III (Pop III) stars, was not yet enriched with the heavy elements necessary for planet formation and, of course, life. Past studies have suggested that planet formation in the universe was gradual, taking several billion years to peak after billions of stars created and spilled the needed metals into the universe. However, local pockets of enriched gas from Pop III stars could have created the right conditions for planet formation earlier in the universe’s history.

Pop III stars burned bright and fast, exploding violently in pair-instability supernovae that completely shredded the progenitor, ejecting over 100 solar masses of metals into their previously pristine surroundings. Cosmological simulations suggest that oxygen from these supernovae could have produced significant water fractions within the dense cores of the supernova remnant. This may have set the stage for planet formation in water-rich disks around subsequent generations of stars as early as 150–200 million years after the Big Bang — does numerical modeling support this planet formation hypothesis?

Protoplanetary disk growth

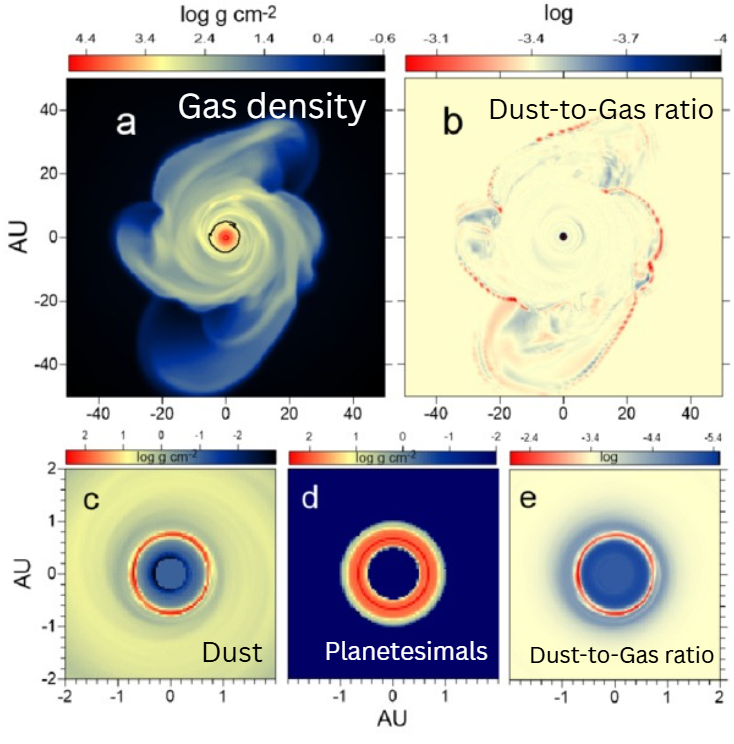
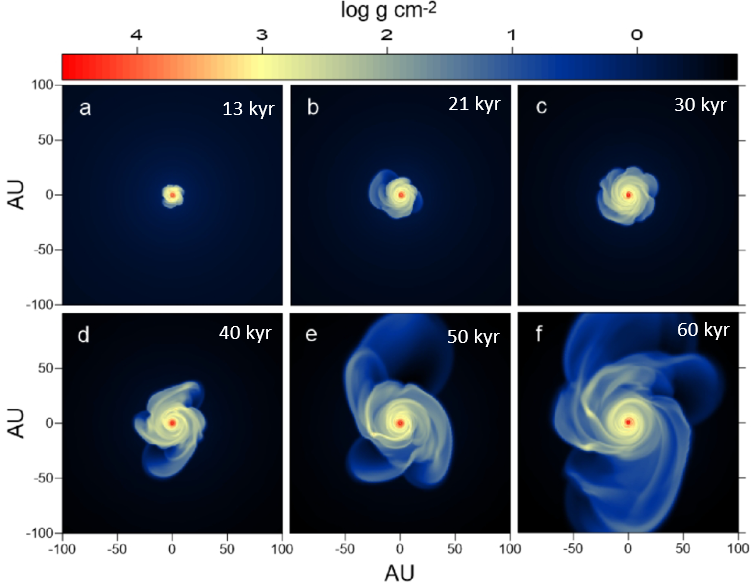
Simulation snapshots showing the formation and evolution of the protoplanetary disk for 13, 21, 30, 40, 50, and 60 thousands of years after protostellar birth. Click to enlarge. [Modified from Vorobyov et al 2026]

Primordial Planetesimals in Simulated Water-Rich Disks

To test if these water-rich dense cores within Pop III supernova remnants could form planetesimals, the building blocks of terrestrial planets, Eduard I. Vorobyov (University of Innsbruck; Southern Federal University) and collaborators performed numerical simulations tracing the collapse of one such gas core into a protoplanetary disk around a protostar. The simulations begin from the gravitational collapse of a 1-solar-mass gas cloud core, with a protostar emerging 24 thousand years after the initial cloud collapse. As the protostar’s gravity pulled in material from its surroundings, a rotating disk formed around the growing star.

Protoplanetary disk evolution and planetesimal growth

Simulation snapshot 40 thousand years after the formation of the protostar showing the gas, dust, and planetesimal surface densities and the dust-to-gas ratio. Click to enlarge. [Modified from Vorobyov et al 2026]

Tracking the gas and dust evolution in the disk, the authors found that several Earth masses of planetesimals formed within 0.5–1.0 au of the 0.4-solar-mass protostar. While the simulations did not trace the disk all the way to planet formation (this requires complex multi-body modeling and lots of computing power), enough planetesimals formed to create a Mars- or Earth-mass planet in the future. Luckily, unlike their live-fast and die-young predecessors, low-mass stars born from Pop III supernova remnants would still be burning hydrogen in their cores today, and ancient metal-poor stars in the Milky Way’s halo may be home to the universe’s first planets that could be detected in future exoplanet surveys. This study showed, for the first time, that water-rich protoplanetary disks with planetesimals could pop up billions of years earlier than previously thought, changing our understanding of planet formation in the universe.

Citation

“Planet Formation at Cosmic Dawn: Planetesimals in H2O-rich Disks around Low-mass Stars,” Eduard I. Vorobyov et al 2026 ApJL 1007 L51. doi:10.3847/2041-8213/ae907c

The post Primordial Planetesimals from the Guts of Population III Stars appeared first on AAS Nova.
A Lyman-Leaking Galaxy Merger Confirmed with JWST

14 August 2026 at 19:43

Epoch of Reionization

Exactly how the universe became reionized after cooling to form stars and galaxies remains an open question. A recent study investigates how a merging set of galaxies may have spurred an onslaught of ionizing photons into the intergalactic medium.

Lyman Continuum Leakers and Merging Galaxies

After its chaotic and blistering beginning, the universe cooled and began to coalesce, stars and galaxies flickering on to set the universe alight. From a few hundred million to about a billion years after the Big Bang, galaxies pumped high-energy ionizing Lyman continuum (LyC) photons into the intergalactic medium during what is known as the epoch of reionization. The exact mechanisms that produced and allowed LyC emission to escape galaxies during this era remain elusive.

Galaxy Merger

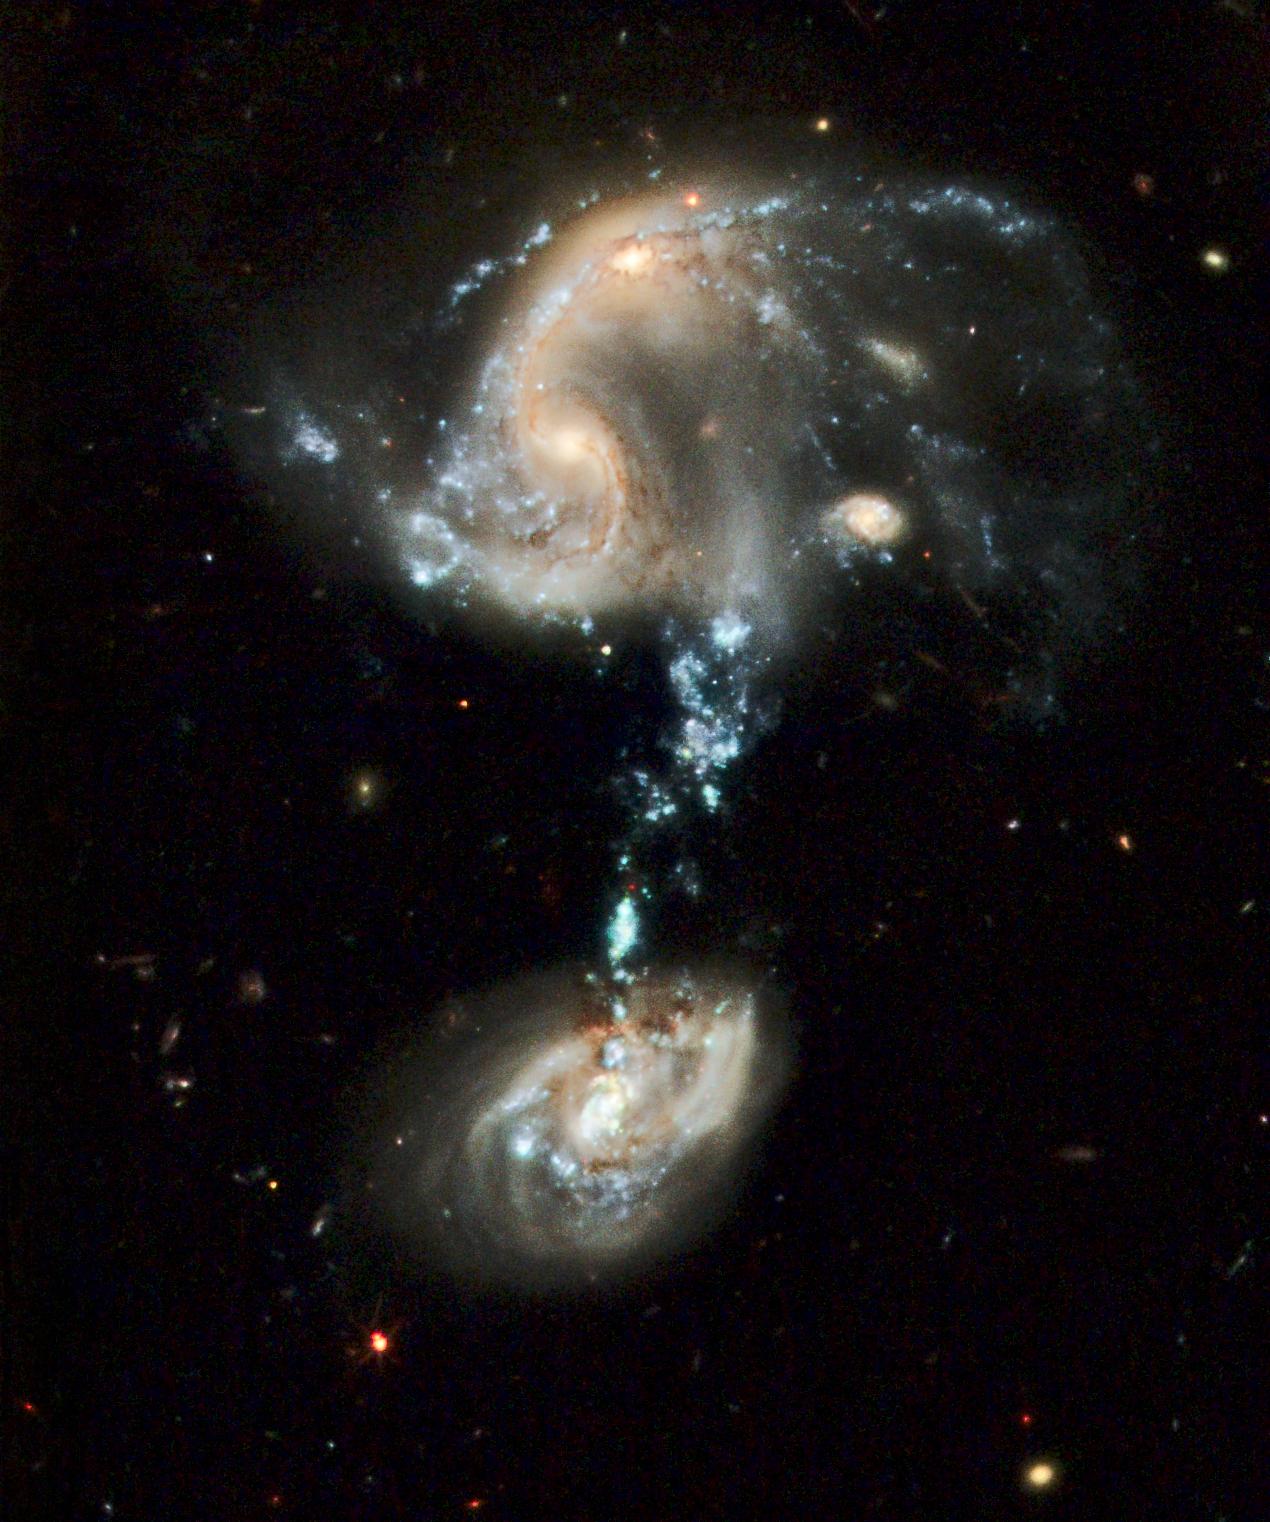
Hubble Space Telescope image of the interacting galaxy group Arp 194. The blue stream connecting the galaxies is where tidally stripped gas formed millions of new stars. [NASA, ESA, and the Hubble Heritage Team (STScI/AURA)]

One promising driver of LyC leakage is galaxy mergers — strong gravitational interactions and interstellar medium mixing can induce bursts of star formation, creating the hot, young stars that emit LyC photons. In particular, galaxy mergers can create tidal tails, streams of wispy gas, that can sustain brief but intense bouts of star formation that quickly use up surrounding gas. With no interstellar gas left to absorb radiation, the fresh stars in these streams can easily pump their high-energy photons into the intergalactic medium, contributing to cosmic reionization.

While observational studies have increasingly pointed to galaxy mergers as considerable drivers of LyC escape, only a small number have explicitly considered the role of mergers in the epoch of reionization due to spectral and spatial resolution limitations. Leveraging the high-resolution capabilities of JWST, Shengzhe Wang (University of Chinese Academy of Sciences; National Astronomical Observatories, Chinese Academy of Sciences) and collaborators performed detailed analyses of two LyC-leaker candidates to better understand the role of galaxy mergers in heating up the universe.

Confirming (and Refuting) Merger-Driven Leaks with JWST

Using candidate LyC leakers first identified in the LymAn Continuum Escape Survey (LACES) carried out with the Hubble Space Telescope, Wang and team obtained high-resolution JWST spectroscopy for two galaxies at redshift z = 3.1 (about 2 billion years after the Big Bang), LACES94460 and LACES104037. After carefully identifying and measuring emission lines in each candidate, the authors confirmed LACES104037 as a merger-driven LyC leaker. However, the apparent LyC emission from LACES94460 was determined to be contamination from a low-redshift object.

LACES 104037

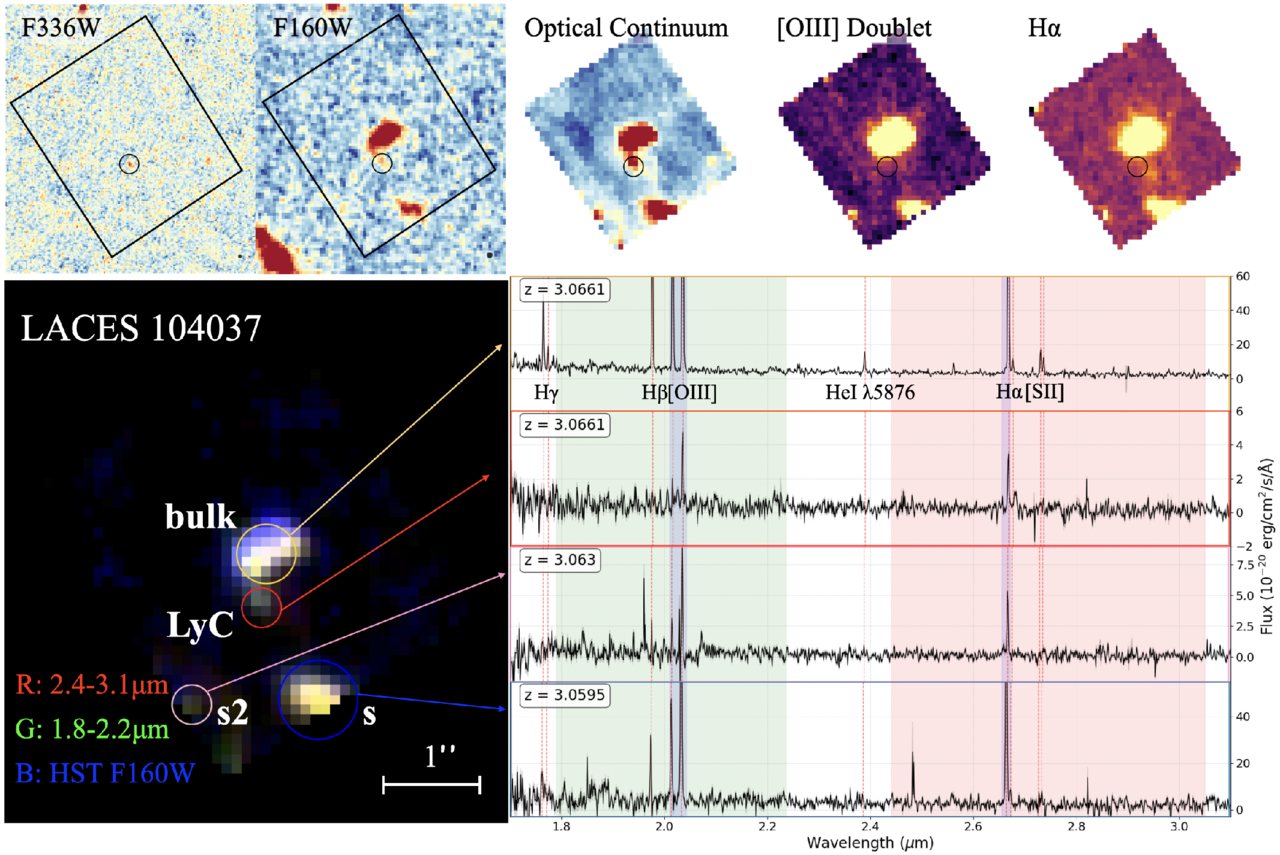
Hubble and JWST observations of LACES104037. The top panels show the Hubble images (first two panels) and the JWST spectral observations (last three panels). The bottom panel shows a composite three-color image marking the location of two primary interacting galaxies and the LyC emission along with the associated spectra. Click to enlarge. [Wang et al 2026]

Based on the JWST spectroscopy, LACES104037 is an early-stage merger system with two primary interacting galaxies (LACES104037-bulk and LACES104037s) with a tidal-tail structure connecting them (LACES104037-LyC) where the LyC emission originates. Using model predictions based on the JWST spectroscopy and photometry from previous studies, the team found that LACES104037-LyC is a star-forming clump in a tidal tail with a stellar age of about 5 million years and an extreme LyC photon escape fraction of approximately 0.99. This points to merger-induced star formation being an extremely efficient way to dump ionizing photons into the intergalactic medium.

LACES104037-LyC represents the first confirmed LyC leaker of its kind: an external clump of star formation in a tidal tail. This discovery aids in our understanding of how mergers can drive high-energy photon emission, and highlights the critical role galaxy mergers may play in the epoch of reionization. Future high-resolution observations will hopefully reveal more knots of LyC-leaking stars within merging galaxies and provide a deeper understanding of this important evolutionary phase of the universe.

Citation

“Confirmation and Refutation of Lyman Continuum Leakers at z ~ 3 with JWST NIRSpec IFU,” Shengzhe Wang et al 2026 ApJL 1006 L17. doi:10.3847/2041-8213/ae8523

The post A Lyman-Leaking Galaxy Merger Confirmed with JWST appeared first on AAS Nova.
Diving into the Darkest Corners of the Universe with Fast Radio Bursts

5 August 2026 at 18:25

The cosmic web

Even the darkest corners of the universe are not completely empty. A recent study has used fast radio bursts to provide the first estimate of the baryon content in cosmic voids.

What’s in a Void?

Cosmological studies have revealed the large-scale filamentary structure of the universe known as the cosmic web. Chains of galaxies and galaxy clusters fall into spindly strands (or filaments) of matter overdensities, opening up cavernous cosmic voids that comprise the darkest corners of the universe. These seemingly vacant voids serve as critical test beds for cosmology, allowing researchers to constrain things like the nature of dark energy and the matter density of the universe.

Despite their name, voids are not completely empty but are instead underdensities with considerably less matter compared to the bustling filaments they border. The baryon (normal matter) content of cosmic voids has important implications for cosmological models and large-scale galactic feedback processes, but assessing how many baryons actually occupy voids has only recently become observationally accessible.

FRB and void sky maps

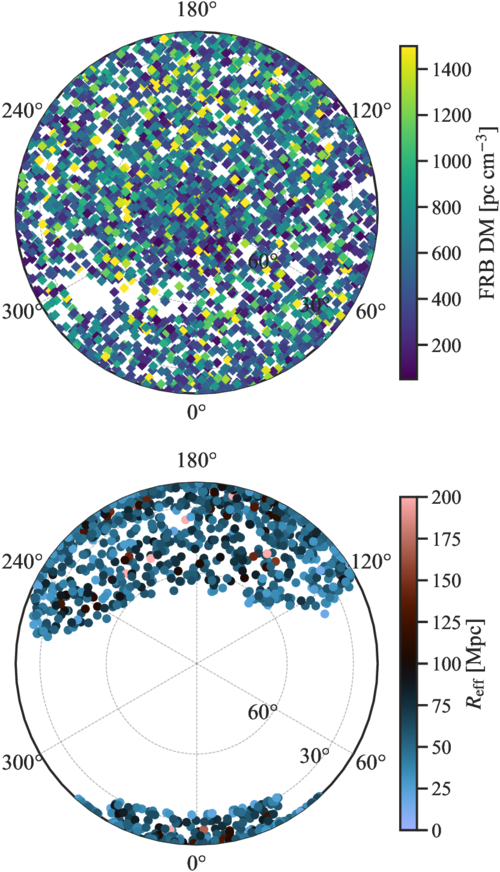
Sky maps centered on the north celestial pole showing the CHIME fast radio burst sample (top) and the SDSS void catalog (bottom). [Sharma et al 2026]

Fast radio bursts — brief, intense flashes of radio waves emitted by compact objects — have proven to be versatile tools for measuring both underdensities and overdensities throughout the universe. The dispersion measure of fast radio bursts, which tells us how many free electrons fall between the radio emitter and observer, can be directly used to map the baryon content along the lines of sight. Fast radio burst sight lines passing through overdensities will produce a dispersion measure excess, and those passing through underdensities will produce a dispersion measure deficit relative to the cosmic mean. Thus far, fast radio bursts have been used extensively to study overdense galaxy and cluster filaments, but their sensitivity to underdense regions like voids has yet to be explored.

Chiming In on the Baryon Search

In concept, directly stacking fast radio burst sight lines that coincide with the positions of known cosmic voids provides a direct measurement of the baryon underdensity inside voids. With no previous observational exploration of this quantity, Kritti Sharma (California Institute of Technology) and collaborators leveraged the second catalog of the Canadian Hydrogen Intensity Mapping Experiment Fast Radio Bursts (CHIME/FRB) sample in conjunction with the Sloan Digital Sky Survey (SDSS) Baryon Oscillation Spectroscopic Survey (BOSS) void catalog to provide the first observational assessment of the baryon underdensity in cosmic voids.

Anticorrelations between FRB dispersion measures and void positions

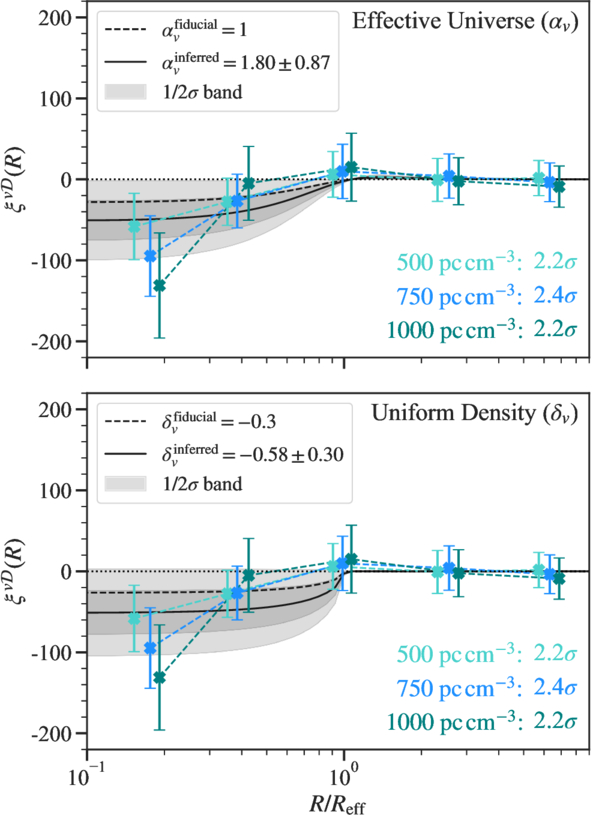
Anticorrelations between fast radio burst dispersion measures and void positions. There is a clear dispersion measure deficit closer to voids centers. [Sharma et al 2026]

Stacking thousands of fast radio burst sight lines that spatially align with thousands of known voids, the authors measured a statistically significant dispersion measure deficit toward void centers. This deficit indicates that, as theory predicts, baryons inhabit cosmic voids at a suppressed level. The team used cosmological models to quantify the electron density contrast between the interior and exterior of voids, finding an approximate baryon underdensity of 60% ± 30% relative to the cosmic mean. Combining this result with existing thermal scattering measurements of the cosmic microwave background, the authors estimated a mean void gas temperature of about 1.1 million kelvin — voids are occupied by a suppressed amount of warm-hot diffuse gas.

This study provides a unique approach to baryon mapping and opens up the door for future investigation of cosmic voids. While not physically containing much, voids hold vast astrophysical and cosmological significance. With the astronomical stage primed with galaxy-mapping powerhouses like the Dark Energy Spectroscopic Instrument, Vera Rubin Observatory, Nancy Grace Roman Space Telescope, and Euclid Space Telescope, cosmic voids will become a cornerstone of cosmological studies.

Citation

“Baryons in the Darkest Sites of the Universe,” Kritti Sharma et al 2026 ApJL 1006 L3. doi:10.3847/2041-8213/ae81ac

The post Diving into the Darkest Corners of the Universe with Fast Radio Bursts appeared first on AAS Nova.
Spying on a Split Comet

31 July 2026 at 17:00

240P

Traversing through the solar system, a comet split in two, and a recent study used six months of observations to investigate when and why.

A Split Comet

Orbit map

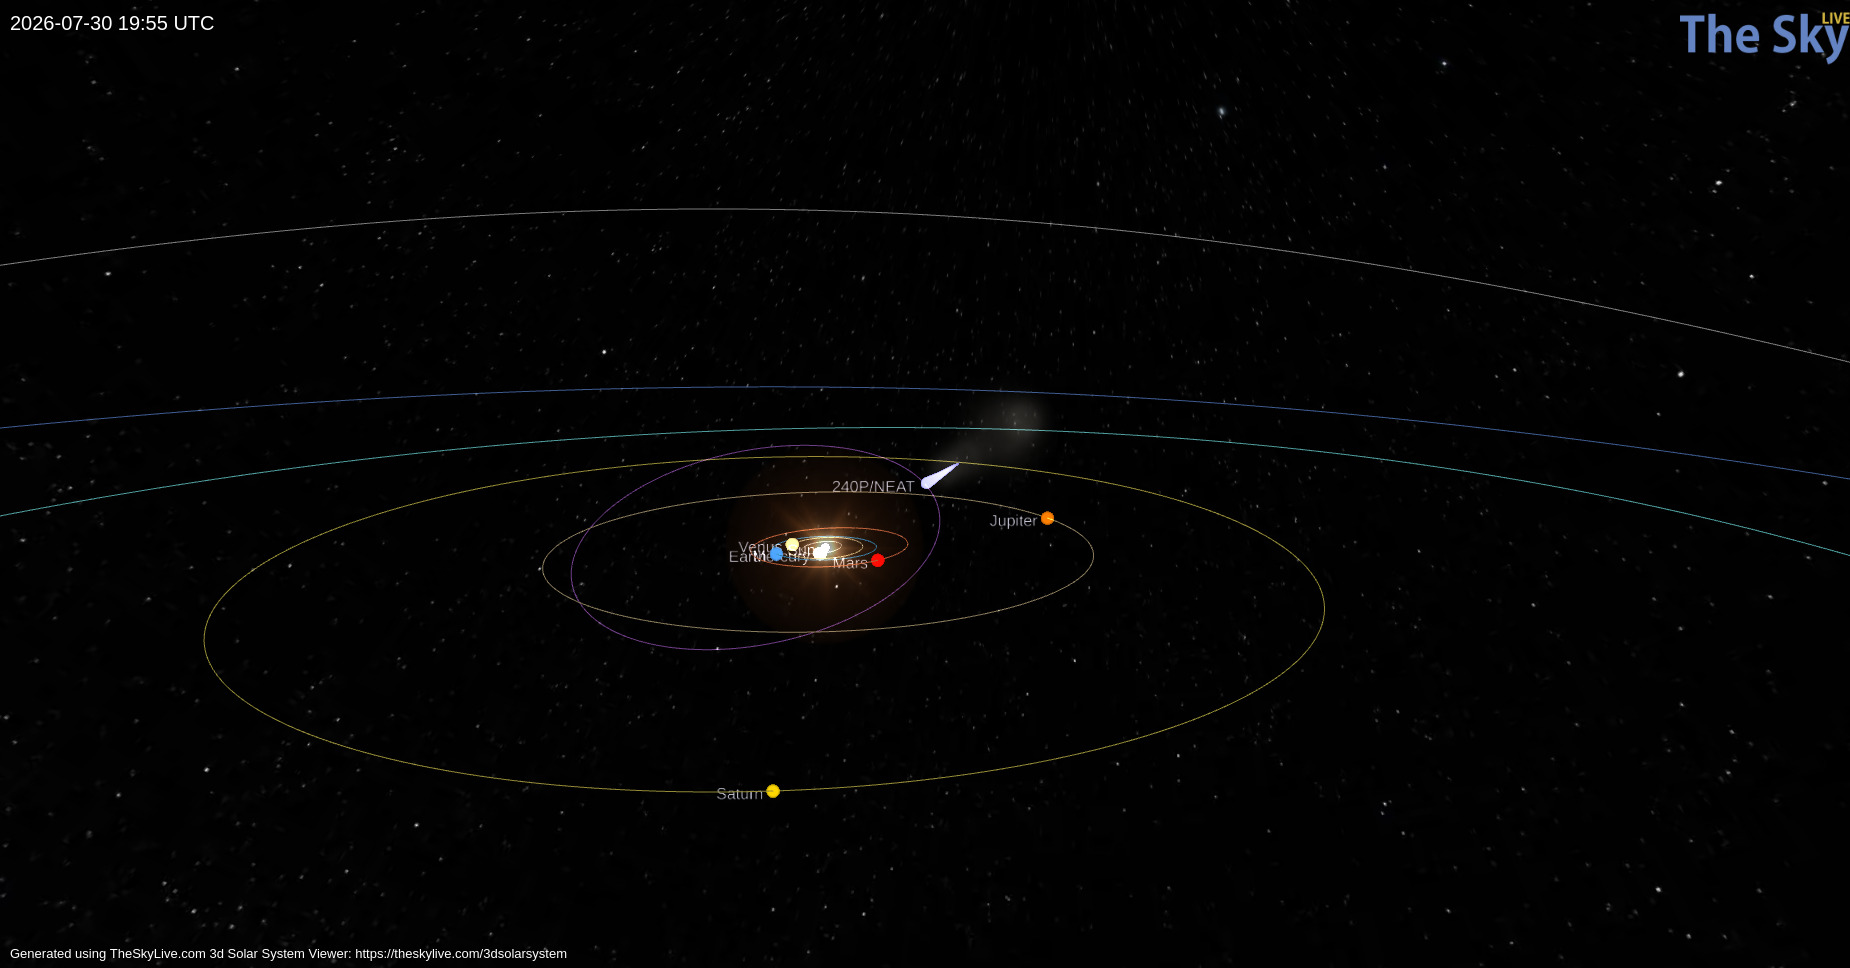
Orbital path of 240P/NEAT (purple) and the position of the comet on 30 July 2026 (light blue teardrop). Click to enlarge. [TheSkyLive]

While we often think of comets as icy remnants of the solar system’s formation that populate the Kuiper Belt and Oort Cloud, some comets make their homes closer to the Sun. One such class, known as Jupiter-family comets, traveled from the Kuiper Belt to short orbital periods (less than 20 years) whose paths through the solar system are shaped by Jupiter’s gravity. Discovered in 2002, 240P/NEAT is a Jupiter-family comet that loops between Jupiter and Mars on a 7.6-year orbit. Making close approaches to Jupiter, 240P experiences frequent, strong interactions with the gas giant that can alter the comet’s orbit and cause sudden bursts in brightness as ice and dust are heated and outgassed from the comet’s surface.

Most recently, 240P swept closest to Jupiter in July 2007, shifting the comet’s perihelion distance (closest approach to the Sun) from 2.5 to 2.1 au, and several long-lived bursts in brightness in 2018/2019 could have been spurred by this orbital shift. Excitingly, a fainter comoving object, 240P-B, was first reported in June 2025 as the comet headed toward perihelion — at some point recently, 240P had split in two!

Over the last century, numerous split comets have been recorded, but detailed physical studies of these objects are rare. With growing evidence suggesting splitting and disintegration are the primary mechanisms of comet destruction, understanding the properties and cause of 240P’s split is imperative.

Observing 240P

With 240P on the move to perihelion, David Jewitt (University of California, Los Angeles) and collaborators monitored the comet from October 2025 to April 2026 to establish the likely cause of its split. Employing the Alhambra Faint Object Spectrograph and Camera on the 2.56-meter Nordic Optical Telescope, the authors obtained detailed imaging of the comet from two months before to four months after perihelion to characterize both components.

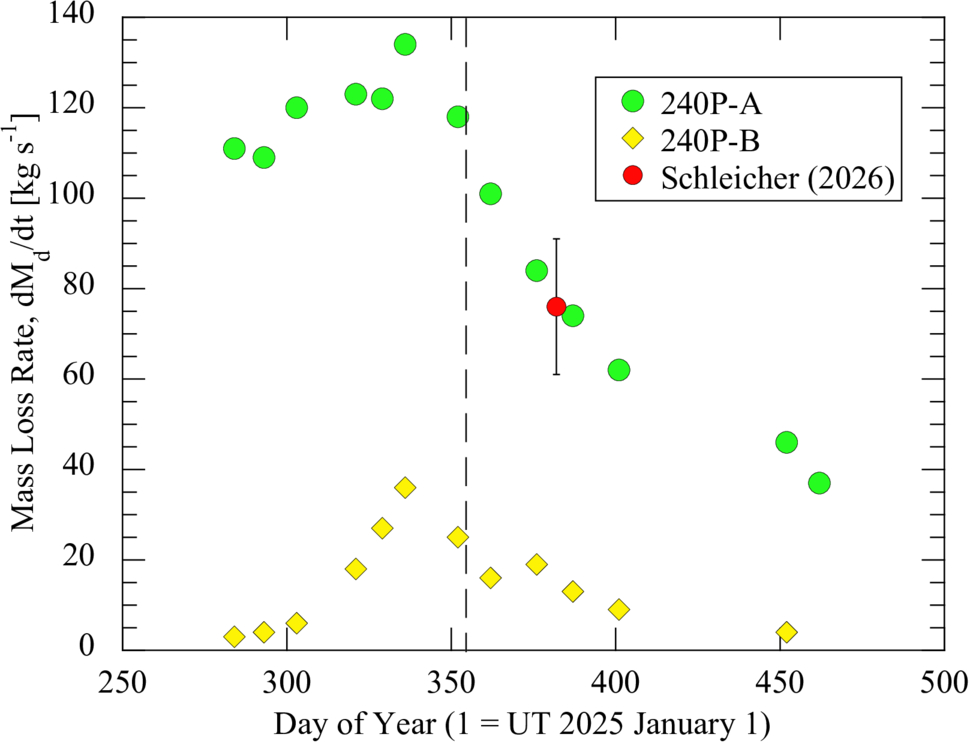
Tracking both photometric and morphological changes across their observations, the authors estimated the dust-loss rates, physical sizes, and separation speed of 240P-A and 240P-B. The brighter component, 240P-A, has an estimated radius between 400 and 600 meters and a dust-loss rate almost four times higher than 240P-B. Because 240P-B is fainter, its radius is harder to constrain observationally. From its lower dust-loss rate and lower brightness, the authors estimated a radius around 300 meters (and no smaller than 50). Based on how the separation of the two comet pieces changes over time, the authors determined that the split of 240P occurred at least three years before their observations.

dust mass-loss

Dust mass-loss rates for 240P-A (green circles) and 240P-B (yellow diamonds) over the course of the observations. Both components peak shortly before perihelion (dashed vertical line). Click to enlarge. [Jewitt et al 2026]

Source of the Split

How exactly did this fragmented comet get this way? The authors considered a number of comet-splitting mechanisms: tidal forces, asteroid impact, pressure buildup below the comet’s surface, thermal stresses, and rotational instability. Given the comet’s orbit, it has not had close enough encounters with the Sun or other planets for tidal forces to be the culprit, and it traverses well above the asteroid belt, avoiding collisions. Pressure buildup and thermal stresses can fracture comets, but both are unlikely to launch such a large fragment as seen in this system.

This leaves rotational instability as the likely source of 240P’s split. Outgassing torques lead to rotational instability, especially in subkilometer comets like 240P, and 240P has exhibited recent outgassing. In addition, the separation speed between the 240P components is comparable to the escape speed of the primary comet, which is expected for rotational breakup. To confirm this hypothesis, future observations measuring the rotation period of 240P are necessary, but this study adds to the small number of split-comet observations that aid in understanding comet destruction.

Citation

“Investigation of Split Comet 240P/NEAT,” David Jewitt et al AJ 172 113. doi:10.3847/1538-3881/ae83ac

The post Spying on a Split Comet appeared first on AAS Nova.
Dating the Dawn of the Milky Way Disk

17 July 2026 at 18:56

Messier 64

The iconic disks of spiral galaxies are well known across the local universe and now far beyond. A recent study looks at the Milky Way to determine when its own disk emerged.

Spinning into Spirals

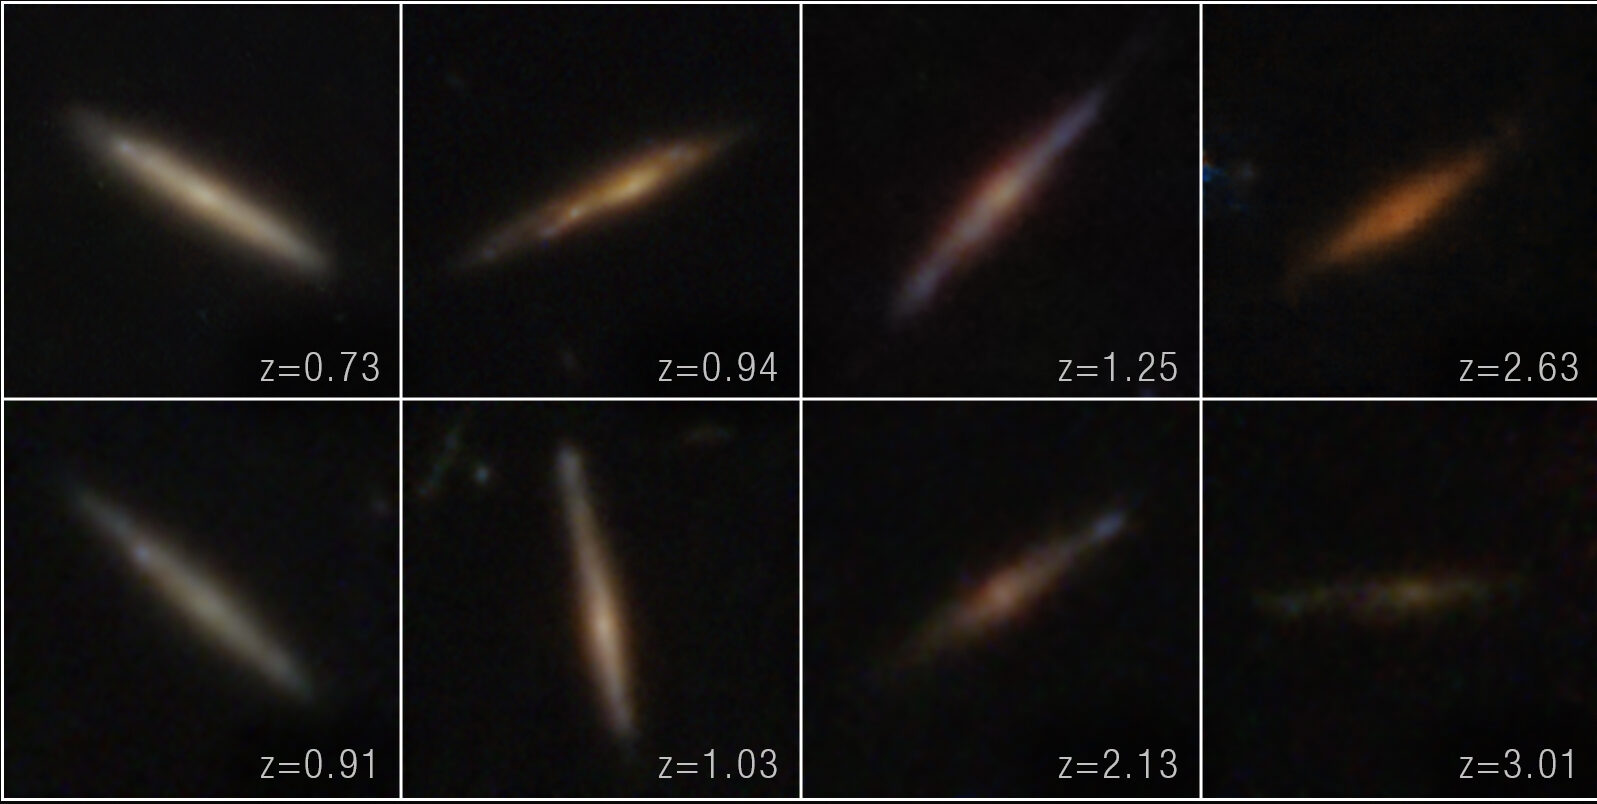
The Milky Way, a grand spiral galaxy with stars and gas rotating in a disk, did not always look this way. Galaxies begin as chaotic clumps of gas and stars inside a knot of dark matter, and at some point in time, spiral galaxies must transform into the flat rotating disks we observe them as today. Recent JWST observations have uncovered disk galaxies emerging much earlier in the universe than previously thought, shifting our understanding of how quickly spiral galaxies come together and settle into disks. While we cannot study the detailed assembly history of these very distant galaxies, we can dissect galaxies in the local universe to build a better timeline of galaxy evolution.

disk galaxies

JWST images of distant edge-on galaxy disks [NASA, ESA, CSA, STScI, Takafumi Tsukui (ANU)]

Looking as close to home as possible, astronomers have used the kinematics and chemical makeup of stars in our own Milky Way to trace the moment when the galaxy started to host a rotating stellar disk. This period, known as the “spin-up,” marks when the bulk kinematic signature of the galaxy transitioned from one dominated by random motions to one dominated by a rotating disk.

Stars hold on to the kinematic and chemical information they are born with, so stars of different ages and metallicities across the galaxy should trace the development of the disk. Because stellar ages have been difficult to constrain observationally, studies of galactic spin-up have typically relied on readily available metallicity measurements as a proxy for age; however, metallicity is not a clear-cut age indicator, making it difficult to truly distinguish different stellar populations across the Milky Way’s disk. Luckily, new major surveys have recently provided stellar databases adding the stellar age measurements necessary to pin down when the Milky Way spun up.

Dawn of the Galactic Disk

Plots showing stellar age and rotational velocity versus metallicity, [Fe/H].

Plots showing stellar age and rotational velocity (Vϕ) versus metallicity, [Fe/H]. The metallicity range where the age–[Fe/H] relation stalls coincides with the point when the Vϕ–[Fe/H] relation rapidly increases, indicating the age of the spin-up in the Milky Way. Click to enlarge. [Modified from Feltzing et al 2026]

Sofia Feltzing (Lund Observatory) and collaborators used a catalog of over 300,000 subgiant stars from the Large Sky Area Multi-Object Fiber Spectroscopic Telescope with metallicities, kinematics, and crucial stellar ages to determine when the Milky Way began to host a stellar disk. After making quality cuts to ensure they included only the most robustly measured stars, the authors divided the sample into two distinct stellar populations that settled into the Milky Way’s disk differently: older stars with a high abundance of α elements (like oxygen, magnesium, and silicon) relative to iron and younger stars with low α-element abundances.

With these star samples, Feltzing and team analyzed how both stellar rotational velocity and age varied with metallicity to determine when the Milky Way spun up. They found that high-α stars clearly move from having random motions to being rotationally supported over a short range of metallicities about 12.5 billion years ago, while the low-α stars seem to begin in a rotating disk and stay there. When varying their selection criteria and looking at the full sample, the authors determined that the Milky Way spin-up happened between 12.1 to 12.5 billion years ago — the first time Milky Way spin-up has been age-dated in this way.

These results imply a rapid chemical evolution and change in kinematic properties as stars went from randomly orbiting to rotating in an ordered disk in the Milky Way. The authors suggest that future studies should focus on lower-metallicity stars to better disentangle stars in the disk from stars in the halo, which will lead to a more precise determination of the Milky Way’s spin-up. Upcoming large-scale surveys will make this possible and allow astronomers to build a better picture of galaxy formation in the early universe.

Citation

“Dawn of the Milky Way Disk: Determination of When a Rotationally Supported Disk Appears and Dating the Spin-up of the Disk,” Sofia Feltzing et al 2026 ApJL 1004 L28. doi:10.3847/2041-8213/ae6f14

The post Dating the Dawn of the Milky Way Disk appeared first on AAS Nova.
A New Catalog of Stellar Rotation Periods for Over a Million Stars

1 July 2026 at 18:22

TESS in space

Stellar rotation is a crucial aspect of not only stellar evolution but also exoplanet science, and a recent study has built the largest catalog of stellar rotation periods to date.

Stellar Opportunities with TESS

Since its launch in 2018, the Transiting Exoplanet Survey Satellite (TESS) has scoured the sky, searching for the signature recurring dip in starlight caused by planetary companions. While the primary goal of TESS is to discover exoplanets, the satellite’s mapping of the entire sky has created a rich database of high-quality photometry for millions of stars. These observations offer ample opportunity for scientists to study stellar properties and behavior across the Milky Way.

In particular, stellar rotation is a key property that traces a star’s age, magnetic activity, and internal structure. For exoplanet science, stellar rotation is both a help and a hindrance: it allows us to study how exoplanets may evolve over time with their host stars, but stellar activity can mimic or drown out planet signals, making them harder to detect. A few studies have investigated stellar rotation periods with TESS, looking at specific star clusters and known planet hosts. To date, however, no existing study has produced a larger catalog of TESS rotation periods — a product that would provide a wealth of information for both exoplanet and stellar evolution science.

Creating a Catalog

TESS All-Sky Rotation Survey

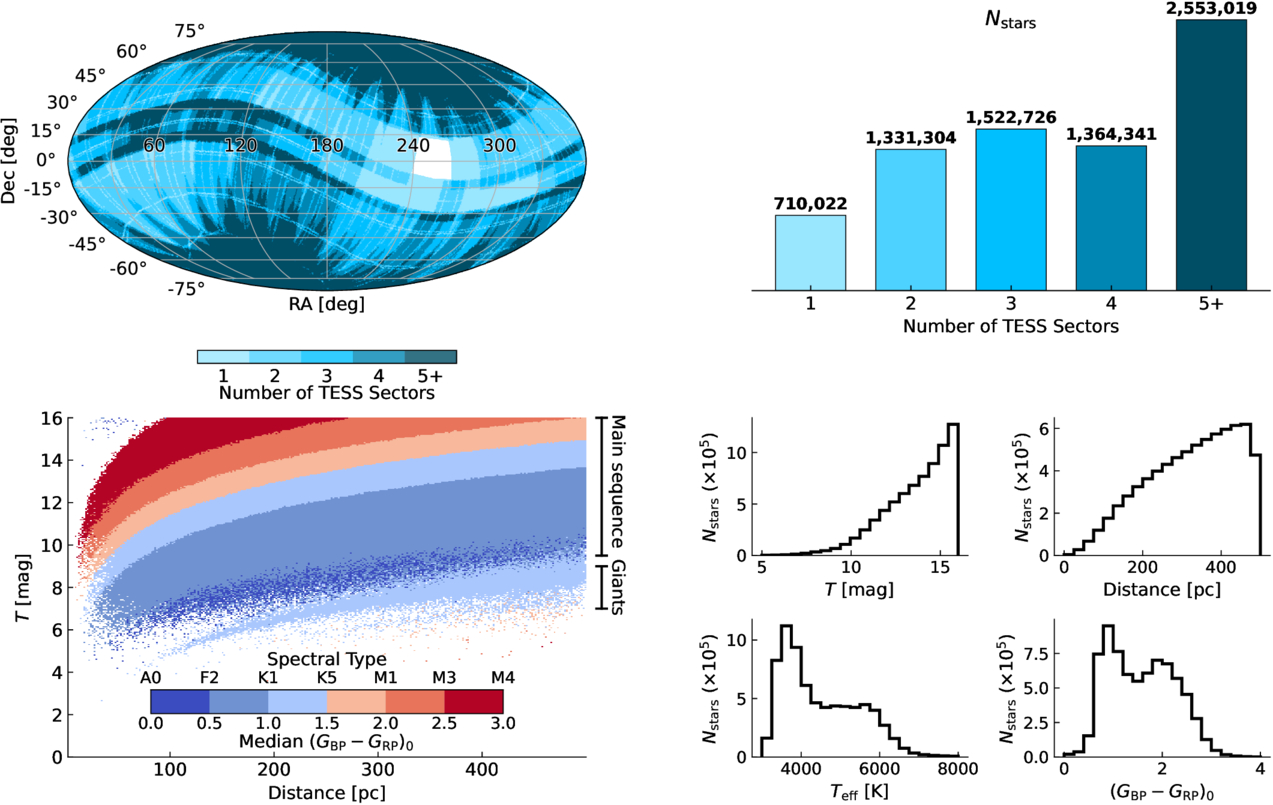
Target sample summary showing the TESS sky coverage (top left), histogram of number of TESS observations per star (top right), TESS magnitude as a function of distance to the star (bottom left), and histograms of magnitude, distance, temperature, and color across the sample (bottom right). Click to enlarge. [Boyle et al 2026]

Seeking to build a flux- and distance-limited catalog of TESS rotation periods, Andrew W. Boyle (The University of North Carolina at Chapel Hill) and collaborators used TESS full-frame images to survey the local neighborhood for stellar variability. To measure reliable stellar rotation periods for as large and diverse a sample as possible, the authors made selection cuts in brightness, distance, and data availability to build a target sample of 7,481,412 stars. They generated light curves for each observation of each star and searched them for periodicity, or repeated variation in brightness.

Not all brightness variations present in a star’s light curve are due to stellar variability — instrumental systematics and artifacts from the spacecraft’s orbital period can produce periodic variability. To combat this, the authors created a classification algorithm to select sources whose periodicity is most likely due to true stellar variability rather than instrumental or observational effects. Pairing this classification with some additional validation criteria, the authors built the TESS All-Sky Rotation Survey (TARS), a catalog of periods for 1,046,317 stars within about 1,600 light-years of our Sun.

Map of fast rotators in TARS sample

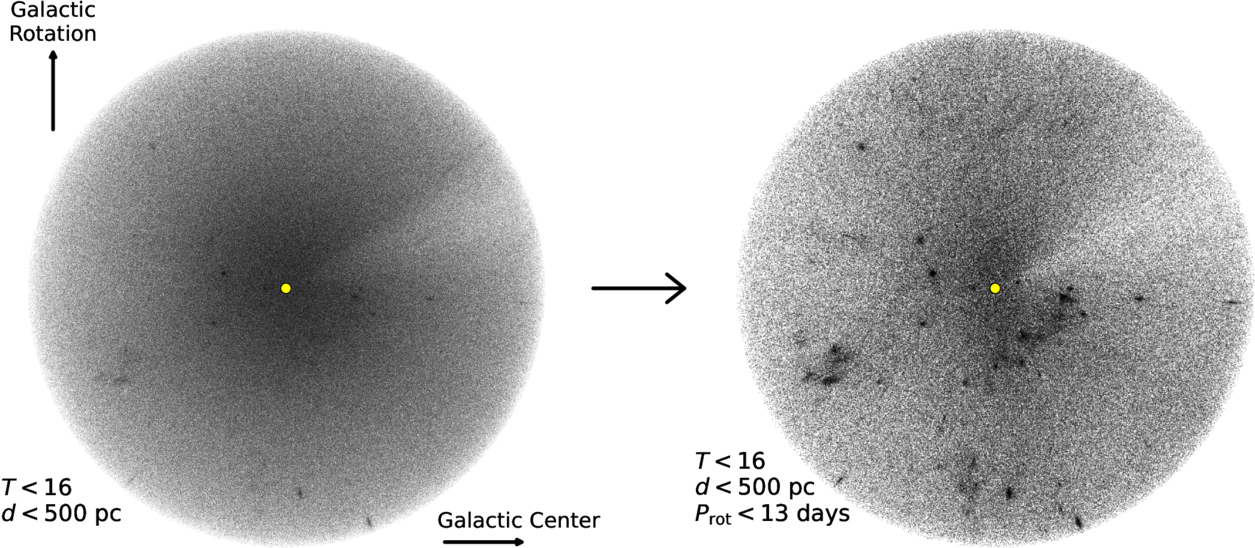
Map of all TARS stars within about 1,600 light-years of the Sun (left) and only the fast-rotating stars in the survey, highlighting clustered populations (right). Click to enlarge. [Boyle et al 2026]

Implications of TARS

Looking more finely at the TARS catalog, the authors provided additional quality cuts to remove other potential sources of stellar variability like binary companions or pulsations. The authors estimated that roughly 93% of their measured periods are due to stellar rotation, which expands the number of stars with known rotation periods by a factor of 2.3 within about 325 light-years and by a factor of 4.0 within about 1,600 light-years. As the largest homogeneous catalog of stellar rotation periods to date, TARS lays the groundwork for studies of stellar evolution, exoplanet discovery and evolution, and even Milky Way structure. For example, the authors found that when mapping the fast-rotating, typically younger stars in TARS, the location of young stellar associations in the local neighborhood became significantly clearer. This underscores the importance of this catalog for a range of science goals, and future work will only improve upon the data provided by TARS.

Citation

“The TESS All-Sky Rotation Survey: Periods for 1,046,317 Stars within 500 pc,” Andrew W. Boyle et al 2026 ApJS 284 75. doi:10.3847/1538-4365/ae6657

The post A New Catalog of Stellar Rotation Periods for Over a Million Stars appeared first on AAS Nova.
Shot from the Heart of the Milky Way: Discovery of an Old Hypervelocity Star

10 June 2026 at 17:39

Hypervelocity stars in galaxy

Zooming through the galaxy faster than they should, hypervelocity stars are a curious population of stars whose origins are often difficult to determine. A recent study presents the first evidence of an old, low-mass hypervelocity star launched from the Milky Way’s center, providing clues into this elusive set of fast-moving stars.

Flinging Fast Stars

Astronomers have caught a number of hypervelocity stars zipping through the Milky Way since their first discovery in 2005. With speeds fast enough to escape the galaxy, hypervelocity stars were launched off course by some strong dynamical interaction. One such method, known as the Hills mechanism, predicts that when a binary star system approaches the Milky Way’s central supermassive black hole, one binary member is captured by the black hole and the other is flung away with high velocity.

However, constraining a hypervelocity star’s origin to the galactic center is limited by uncertainties in distances and proper motions, muddling how well researchers have been able to trace their orbits backward. Among a number of candidate galactic center–origin hypervelocity stars, only one has been confidently identified as having been kicked from the galaxy’s center. Intriguingly, this hypervelocity star and most galactic center–origin candidates are young, massive stars — old, low-mass hypervelocity stars from the galactic center have yet to be identified.

What does this dearth of old, low-mass zooming stars mean? Either stars in the galactic center are preferentially young and massive, with fewer than expected old and small stars, or low-mass hypervelocity stars are missed by selection effects, challenging to detect in current surveys. Searching for hypervelocity stars with higher precision and sensitivity may allow astronomers to tease out this missing population and trace back more zooming stars to a Hills mechanism origin.

Discovering An Old Hypervelocity Star

Leveraging high-quality spectra from the Dark Energy Spectroscopic Instrument (DESI) survey and precise astrometry from Gaia, Shunhong Deng (University of Chinese Academy of Sciences; China West Normal University) and collaborators reported the discovery of the hypervelocity star DESI-HVS1. From the spectroscopic and astrometric analyses, the authors determined that DESI-HSV1 is a ~14-billion-year-old low-metallicity star with a mass about 80% that of the Sun’s, moving through the galaxy at 523 km/s.

Backward orbit integration

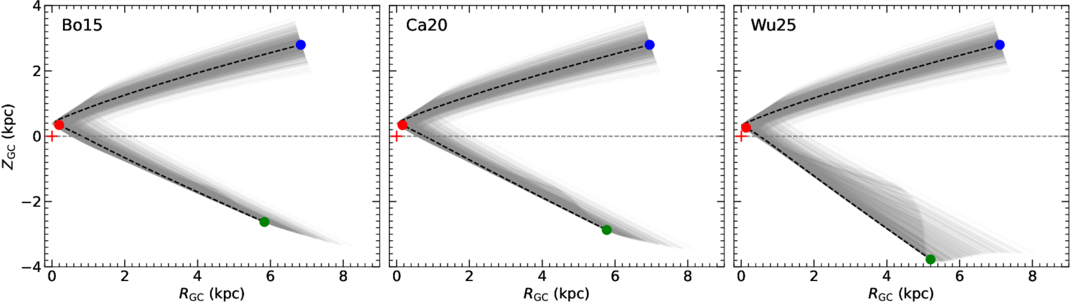
Backward-integrated orbits of DESI-HVS1 for three different galactic potential models. The blue, red, and green points show the star’s current position, closest approach to the galactic center, and position 50 million years ago, respectively. Click to enlarge. [Deng et al 2026]

Exploring the possible origins of this hypervelocity star, the authors integrated the star’s orbit backward in time for one billion years. The backward orbit integrations show the star approaching the galactic center where it then turns around, traveling away faster than the local escape velocity of the galaxy. Even when varying the galactic potential and constants, all orbit integrations suggest DESI-HVS1’s motion through the galaxy is most naturally explained by the Hills mechanism.

While more refined galaxy models and comparison to other candidate galactic center–origin hypervelocity stars are necessary to fully confirm its origins, DESI-HVS1 provides the first compelling evidence for an old, low-mass hypervelocity star candidate consistent with a galactic center launch. This suggests that the observed lack of such stars is likely not a reflection of the Milky Way’s central stellar population, but rather a consequence of observational constraints making such small hypervelocity stars particularly difficult to detect. As large spectroscopic and astrometric surveys continue to advance, the sample of galactic-center hypervelocity star candidates will grow, enabling further exploration of the stellar environment and dynamical processes at the Milky Way’s core.

Citation

“An Old, Low-mass, Metal-poor Hypervelocity Star Candidate Consistent with Galactic Center Origin,” Shunhong Deng et al 2026 ApJL 1003 L9. doi:10.3847/2041-8213/ae6505

The post Shot from the Heart of the Milky Way: Discovery of an Old Hypervelocity Star appeared first on AAS Nova.
Stacking Up the Discovery of Six Millisecond Pulsars

29 May 2026 at 17:00

Millisecond pulsar and companion artist's impression

The fastest spinning pulsars in the universe are often quite difficult to detect. Leveraging multiple observations from the largest single-dish telescope in the world, researchers have discovered six previously undetected pulsars.

Millisecond Pulsars in Globular Clusters

Globular clusters, compact collections of tens of thousands to millions of stars, are highly dense and rife with dynamical interactions. These active environments are ideal factories for the formation of millisecond pulsars — the extremely fast-spinning cores of once-massive stars, shining beams of radio emission from their poles. One way millisecond pulsars are thought to form is when a pulsar in a binary system steals mass from its companion star, transferring angular momentum and causing the pulsar to spin up. The densely packed environment in a globular cluster provides ample opportunity for a pulsar to acquire a companion to siphon.

However, millisecond pulsars in distant globular clusters are notoriously difficult to detect. Traditional pulsar searches that rely on a single observation tend to miss millisecond pulsars, many of which have signals too faint to be distinguished from noise or radio interference. Instead, researchers must rely on a different method to find these fast-spinning pulsars.

FAST

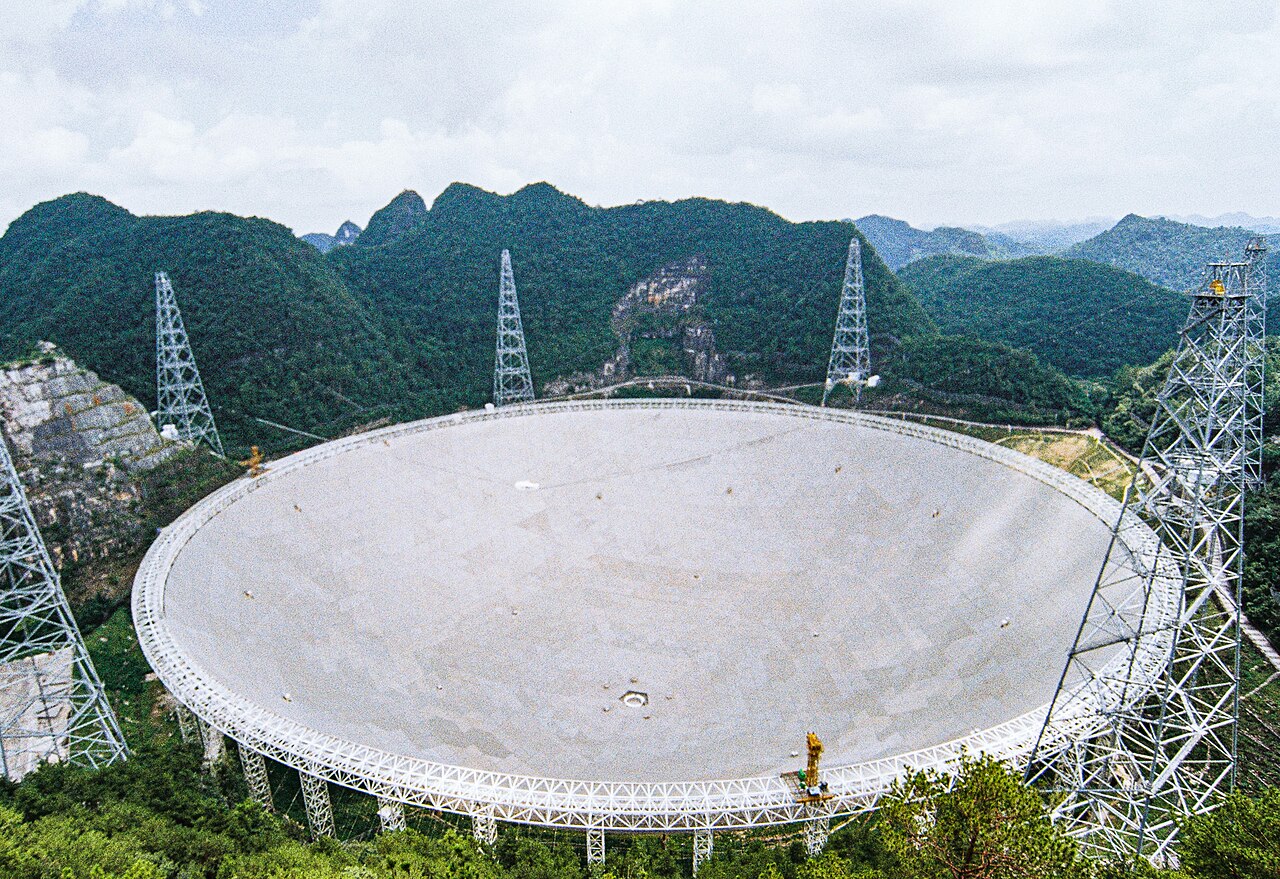
FAST, the 500-meter single-dish radio telescope located in southwestern China. [Wikipedia user SCJiang; CC BY 4.0]

Stack Search Success

To find faint millisecond pulsars, researchers have developed the stack search method, in which multiple radio observations are combined to tease out faint signals and decrease noise. Reliably stacking observations across epochs requires stability; isolated millisecond pulsars, now no longer spinning up after losing their companion, have very stable rotation periods, making them ideal targets for the stack search method. To date, the stack search method has successfully identified nine isolated globular cluster millisecond pulsars using data from the Arecibo, Parkes, and Green Bank radio telescopes.

Stack Spectra

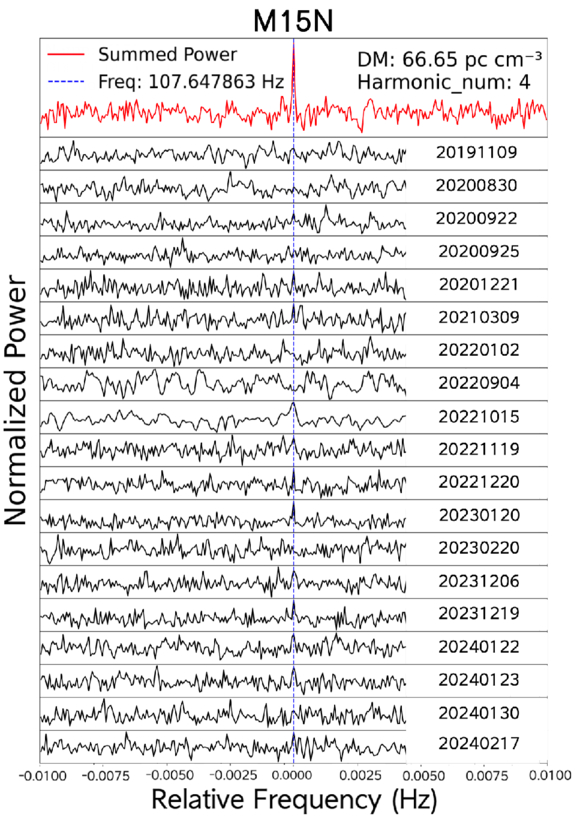
Power spectra from a discovered millisecond pulsar M15N. The black solid lines show the 19 individual observations of the pulsar, and the red solid line in the top panel shows the stacked spectrum. The stack search method pulls out a clear pulsar signal. [Dai et al. 2026]

In hopes of recovering more of these faint fast-spinning pulsars, Yinfeng Dai (Beijing Normal University) and collaborators used archival data obtained with the Five-hundred-meter Aperture Spherical radio Telescope (FAST), the world’s largest single-dish telescope. Targeting two specific globular clusters, NGC 6517 and M15, the team applied the stack search method to 23 and 19 observations of the globular clusters, respectively. From their search, the authors discovered six previously unidentified isolated millisecond pulsars: four in NGC 6517 and two in M15.

While previous studies identified brighter pulsars in the targeted globular clusters, the authors confirmed that all six newly discovered pulsars are too weak to be reliably recovered from single-epoch searches, underscoring the importance of the stack search method. In particular, this search increased the known pulsar populations of NGC 6517 and M15 by 27% and 18%, respectively, suggesting that a meaningful fraction of globular cluster pulsars are easily missed in traditional pulsar searches. Future studies employing this stack search method will continue to detect faint millisecond pulsars, unlocking this elusive population for further exploration.

Citation

“The Stack Search Tests on FAST Data: Discovery of Six Faint Isolated Millisecond Pulsars in NGC 6517 and NGC 7078 (M15),” Yinfeng Dai et al 2026 ApJL 1002 L31. doi:10.3847/2041-8213/ae5dbb

The post Stacking Up the Discovery of Six Millisecond Pulsars appeared first on AAS Nova.
Hints for Massive Galaxy Evolution from Dusty Star-Forming Galaxies

15 May 2026 at 17:00

NGC 972

How do massive galaxies form and evolve? A recent study traces the stellar and dust distributions across evolutionary phases of massive galaxies to better understand how massive dusty star-forming galaxies fit into the picture.

Dusty Massive Galaxies

Massive galaxies, like the Milky Way or even larger, undergo phases of active star formation and quiescent phases of inactivity, but exactly how these galaxies evolve through these stages is not yet fully understood. Dusty star-forming galaxies, which are undergoing a period of intense star formation and shrouded in dust, might be the missing evolutionary step between star-forming and quiescent phases of massive galaxy evolution. 

Currently, the leading explanation for massive galaxy formation and evolution is inside-out growth — star formation and quenching start in the inner regions of a galaxy and progress outward. However, it’s not clear whether dusty star-forming galaxies also follow the favored inside-out pathway, or if they instead proceed outside-in, first growing their disks and then assembling a central bulge.

JWST NIRCam images

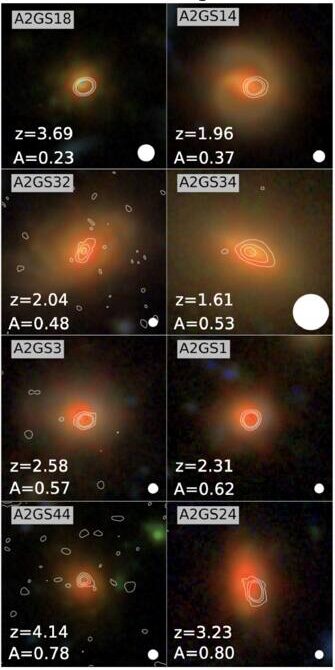
Example of JWST NIRCam images with ALMA contour lines overlaid for select dusty star-forming galaxies in the sample. [Modified from Bodansky et al 2026]

The spatial distribution (or morphology) of the stars and dust within dusty massive galaxies can help us trace their evolution. Thanks to high-resolution observations from JWST and the Atacama Large Millimeter/submillimeter Array (ALMA), researchers can now directly compare the morphologies of distant star-forming, quiescent, and dusty galaxies during the height of our universe’s star formation. Filling this gap will reveal how dusty star-forming galaxies may connect star-forming and quiescent galaxies in massive galaxy evolution.

Multiwavelength Morphological Comparisons

To directly compare the star and dust morphologies across massive galaxies, Sarah Bodansky (University of Massachusetts, Amherst) and collaborators selected a sample of 33 dusty star-forming galaxies from the GOODS-ALMA 2.0 survey that searched the sky for 1.1-mm dust emission as well as star-forming and quiescent comparison samples drawn from JWST observations. Combining the ALMA survey data with JWST imaging, the authors studied the rest-frame optical (stars) and rest-frame near-infrared (dust) morphologies of dusty, star-forming, and quiescent galaxies at redshifts around cosmic noon (a few billion years after the Big Bang).

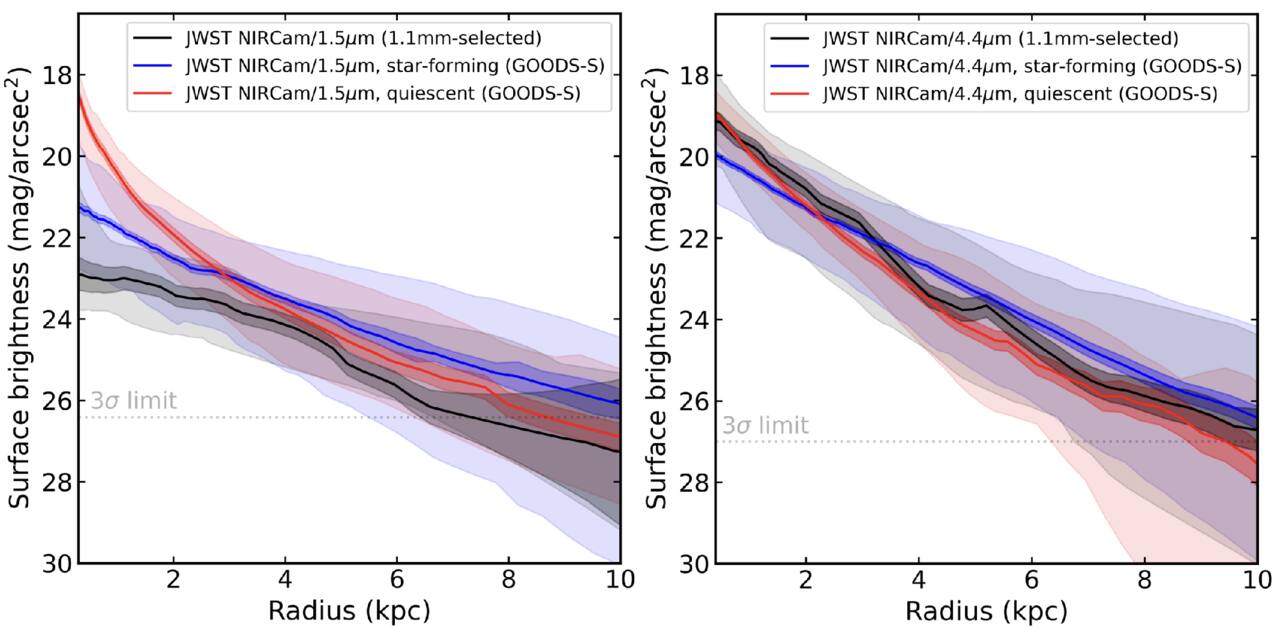
When comparing optical morphologies, the authors found that dusty star-forming galaxies and typical star-forming galaxies had similar distributions, but their near-infrared morphologies showed clear differences. Dusty galaxies tended to show more compact near-infrared emission, with dust tracing their stellar populations and more concentrated in the galaxies’ central regions. Though clearly different from star-forming galaxies, the authors noted striking similarities between the near-infrared morphologies of the dusty star-forming and quiescent galaxies, especially within their centers.

Surface brightness profiles

Average surface brightness profiles for the rest-optical (left) and rest-near-infrared (right) for the dusty (black), star-forming (blue), and quiescent (red) galaxies. In the near-infrared, the dusty star-forming galaxy profile appears very similar to the quiescent galaxy profile. [Bodansky et al 2026]

All of these properties suggest that dusty star-forming galaxies have built up stellar mass and dust in their cores, potentially forming a central bulge first and supporting an inside-out model of massive galaxy growth. This points to dusty star-forming galaxies as possible direct progenitors of early massive quiescent galaxies, hanging onto their last bit of star formation before becoming quiet as well. While this study morphologically distinguishes dusty galaxies from their star-forming and quiescent counterparts, future spectroscopic studies comparing the kinematics of these populations and investigations of molecular gas distributions are necessary to better pin down the evolutionary connection between star-forming, dusty, and quiescent massive galaxies.

Citation

“JWST+ALMA Reveal the Buildup of Stellar Mass in the Cores of Dusty Star-forming Galaxies at Cosmic Noon,” Sarah Bodansky et al 2026 ApJ 1001 235. doi:10.3847/1538-4357/ae4f64

The post Hints for Massive Galaxy Evolution from Dusty Star-Forming Galaxies appeared first on AAS Nova.
In or Out? Using Balmer Emission to Distinguish Inflows from Outflows

1 May 2026 at 17:00

M33

Galaxies pull in and pump out gas as they form and evolve, but distinguishing between the two directions is tricky. A recent study used emission lines and dust absorption to try to pin it down.

Inflow or Outflow?

Throughout their lives, galaxies churn gas into stars, stars fuse new metals, supernovae blow enriched material back out, and the cycle repeats. To maintain this process and sustain star formation, a galaxy must fuel up by accreting gas from its surroundings. However, catching galactic gas accretion has proven difficult — both emission from gas falling into the galaxy (inflows) and gas blown out by supernovae (outflows) can appear blueshifted or redshifted along an observer’s sight line, depending on if the flowing material is in front of or behind the galaxy.

While direct evidence of inflows has been identified in the Milky Way, only a few direct detections of inflowing gas in other galaxies exist due to the degeneracy of inflow and outflow emission-line features. Relying on additional absorption measurements, some studies have teased out inflows in other galaxies, but these star formation fuel pumps remain overwhelmingly evasive. The angle at which we observe a galaxy also limits our ability to detect both inflows and outflows, with face-on galaxies best oriented to detect these shifted spectral features. How then do we uncover this critical component of a galaxy’s evolution?

Breaking Through with the Balmer Decrement

Balmer decrement diagram

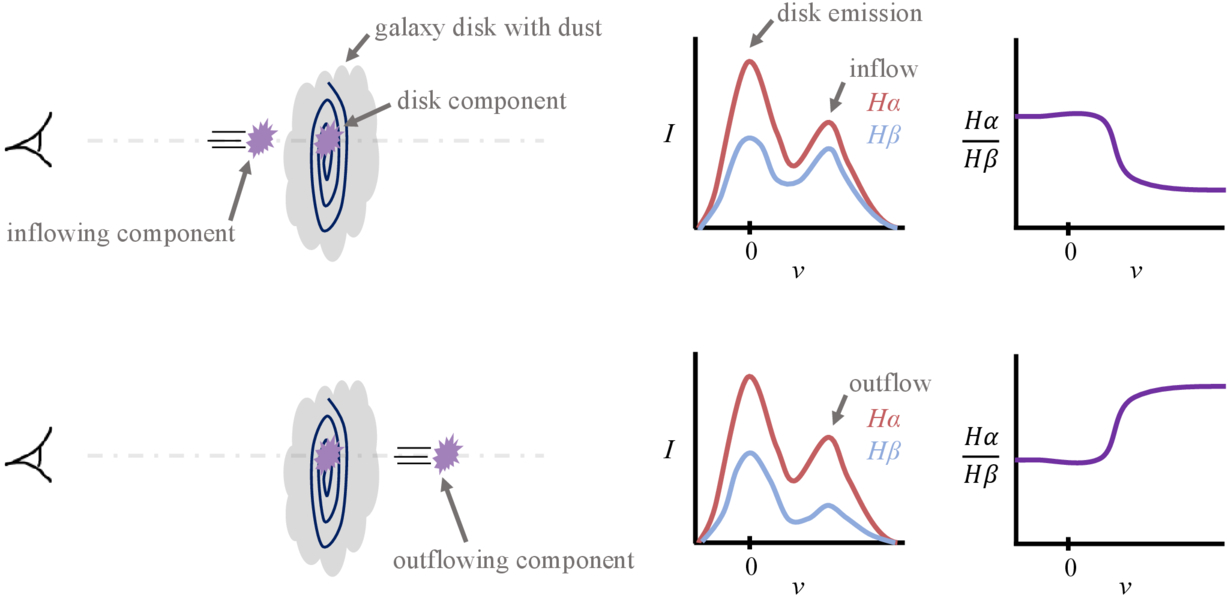
A diagram illustrating the degeneracy in emission spectra of galaxies, with the top panel showing an inflowing component and the bottom panel showing an outflowing component. While the Hα emission is similar, the Hβ emission is more affected by extinction due to dust in the galaxy’s disk, making it possible to identify inflow versus outflow based on the Balmer decrement. Click to enlarge. [Sitaram et al 2026]

To try to break through the confusion between inflows and outflows, Meghna Sitaram (Columbia University) and collaborators explored how the strengths of hydrogen emission lines vary depending on the location of the emitting gas. Referred to as the Balmer decrement, the ratio between the Hα (redder) and Hꞵ (bluer) emission lines is sensitive to dust between the emitting gas and the observer. Because dust preferentially absorbs bluer photons, an inflow or outflow behind a galaxy is expected to have a higher Hα/Hꞵ ratio due to the intervening dust in the galaxy’s disk absorbing some of the Hꞵ emission.

Testing this idea, the authors performed a hydrodynamic simulation of an isolated, face-on Milky Way–like galaxy and tracked inflows and outflows over a billion years. From the simulation, they extracted mock spectral observations to measure the ionized gas motions and Hα and Hꞵ emission lines along different sight lines throughout the galaxy. Separating gas components into three categories — inflow, outflow, and in the disk — the authors found that dust extinction does cause noticeable differences in the Balmer decrement depending on a component’s location with respect to the disk.

histograms

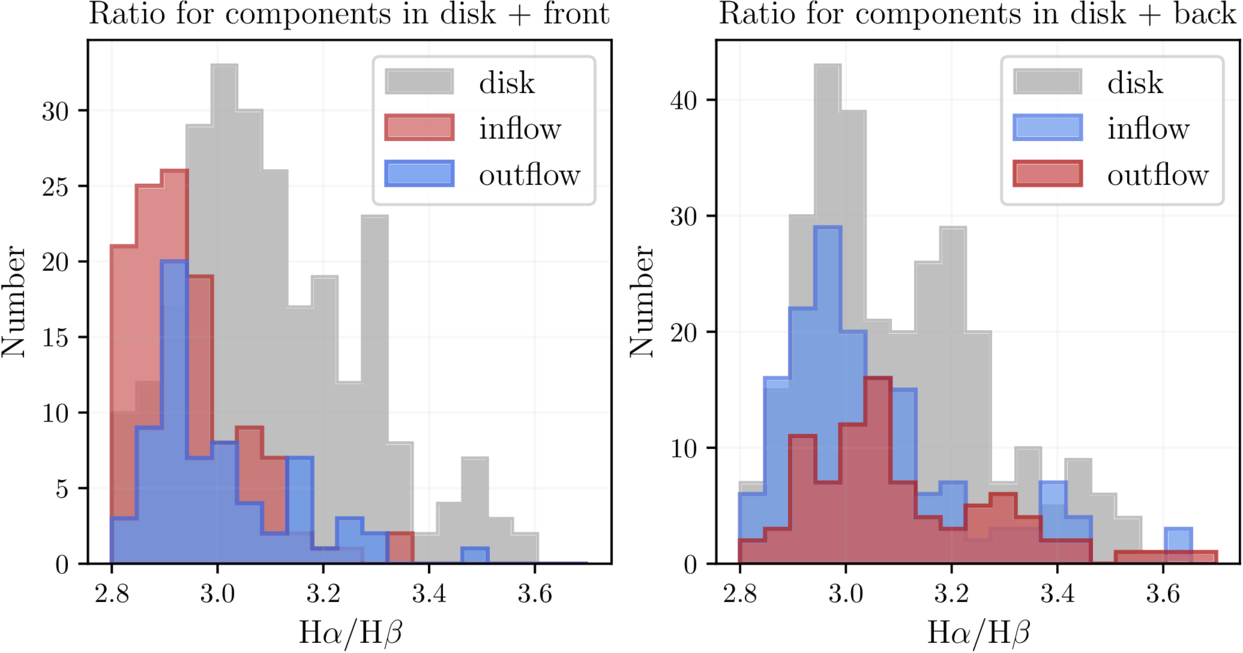
The distribution of Balmer ratios between different components in the interstellar medium and in front of the galaxy (left) and behind the galaxy (right). Material in front of the galaxy shows lower Hα/Hβ ratios. Click to enlarge. [Sitaram et al 2026]

Front Inflow Finds

What does this mean for identifying the inflows that provide galaxies with star-forming fuel? The authors reported that components in front of the galaxy — redshifted inflows and blueshifted outflows — tend to exhibit lower Hα/Hꞵ ratios compared to components behind the disk, aligning with the expectation that dust in the disk absorbs Hꞵ. In particular, these front inflows appear to be the most readily distinguished from gas in and behind the galaxy’s disk.

However, things get more complicated for gas behind the galaxy. Because the dust in the simulation is distributed nonuniformly in small clumps throughout the galaxy, it is difficult to distinguish between disk gas and gas behind the galaxy. While future simulations with improved dust modeling are necessary to resolve this issue, this study offers a useful method to distinguish inflow and outflow in dusty face-on galaxies.

Citation

“Identifying Signatures of Inflow onto Face-On Galaxies Using Balmer Decrement,” Meghna Sitaram et al 2026 ApJ 1001 87. doi:10.3847/1538-4357/ae5222

The post In or Out? Using Balmer Emission to Distinguish Inflows from Outflows appeared first on AAS Nova.
Water Vapor Around a Sizzling Supergiant: High-Resolution Spectroscopy of B[e] Supergiant LHA 115-S 18

17 April 2026 at 17:00

blue supergiant

Prior to exploding, massive stars advance through action-packed evolutionary stages that are exciting but often difficult to fully decipher. A recent study focuses on a unique late-stage star to better understand its properties and evolution.

To B[e] a Supergiant

HD 62623 disk image

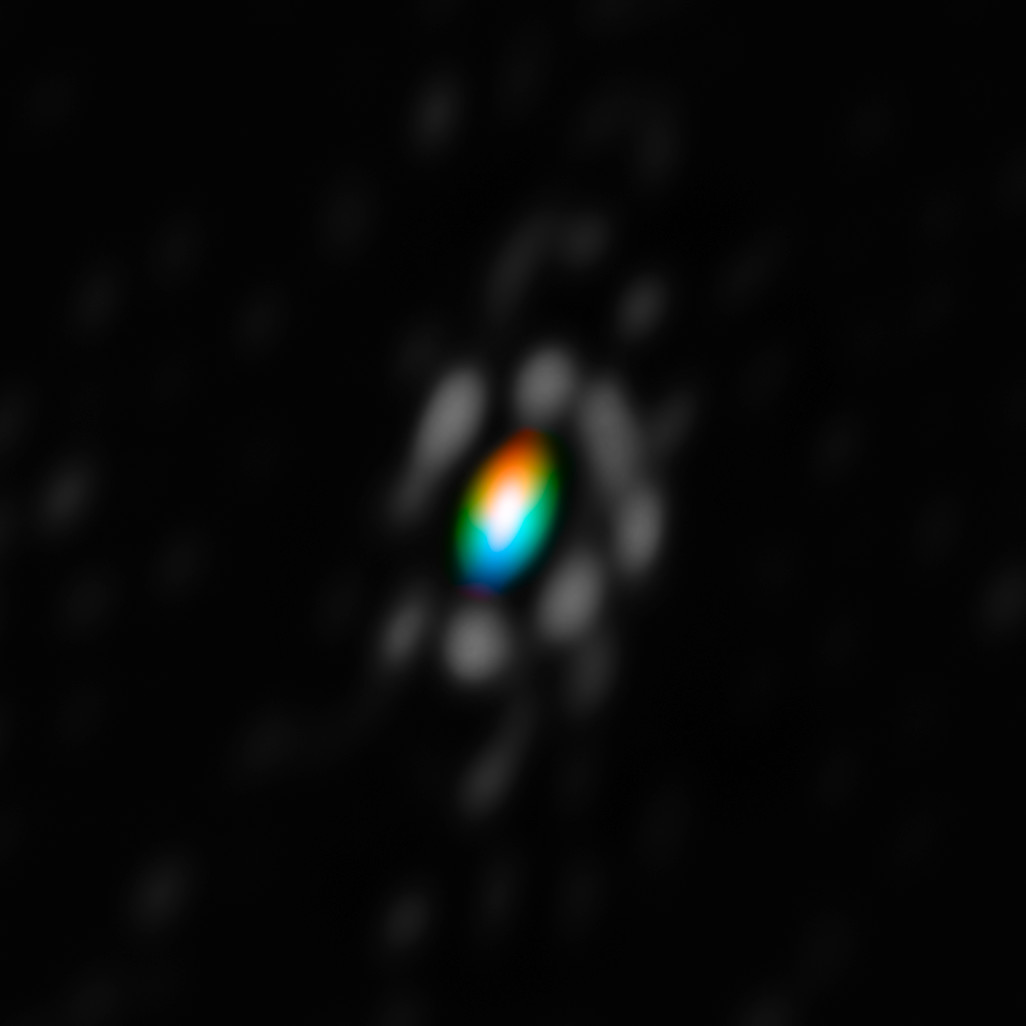
Very Large Telescope Interferometer image of the circumstellar disk around the B[e] supergiant star HD 62623. The colors indicate the rotation of the disk with blue coming toward us and red going away. [ESO/F. Millour; CC BY 4.0]

After depleting their cores of hydrogen, massive stars journey off the main sequence through a series of evolutionary phases before ending in dramatic supernova explosions. A massive star’s post-main-sequence evolution is intense, often sloughing off layers of material that can settle into a circumstellar disk. The B[e] supergiant phase describes a blue supergiant star surrounded by a cool, dense circumstellar disk where oxygen is more abundant than carbon. These environments often lock up carbon atoms in carbon monoxide molecules, leaving excess oxygen available to form other molecules including SiO, TiO, and water vapor. These molecules can survive under different physical conditions, making them key tracers of the environments around B[e] supergiants.

One particularly interesting B[e] supergiant, LHA 115-S 18, has been the subject of numerous studies but remains poorly constrained. The star exhibits significant variability both in brightness and emission features on timescales of days to years, and previous works have suggested that the star may have an as-yet unconfirmed binary companion. Molecular line emission from CO and TiO have been identified in LHA 115-S 18, indicating a circumstellar disk, but to date, water vapor emission has not been identified in any B[e] supergiant. Identifying more complex oxygen-bearing molecules like water will further reveal the physical properties and possible binary companion of LHA 115-S 18.

Identifying Emission in LHA 115-S 18

To characterize the emission around LHA 115-S 18, María Laura Arias (Institute of Astrophysics La Plata; National University of La Plata) and collaborators obtained high-resolution near-infrared spectroscopy of the star using the Immersion Grating Infrared Spectrometer on the Gemini South telescope. From the high-resolution spectra, the team identified several atomic emission lines indicative of the star’s gaseous envelope, revealing the structure of material around the star: an inner hot disk of ionized material and an outer cool disk of neutral material. Looking at molecular emission from carbon monoxide — a tracer of both gas motions and stellar age — the authors confirmed the presence of a rotating ring of gas around LHA 115-S 18 and determined that the star is an evolved, post–red supergiant object.

LHA 115-S 18 spectrum

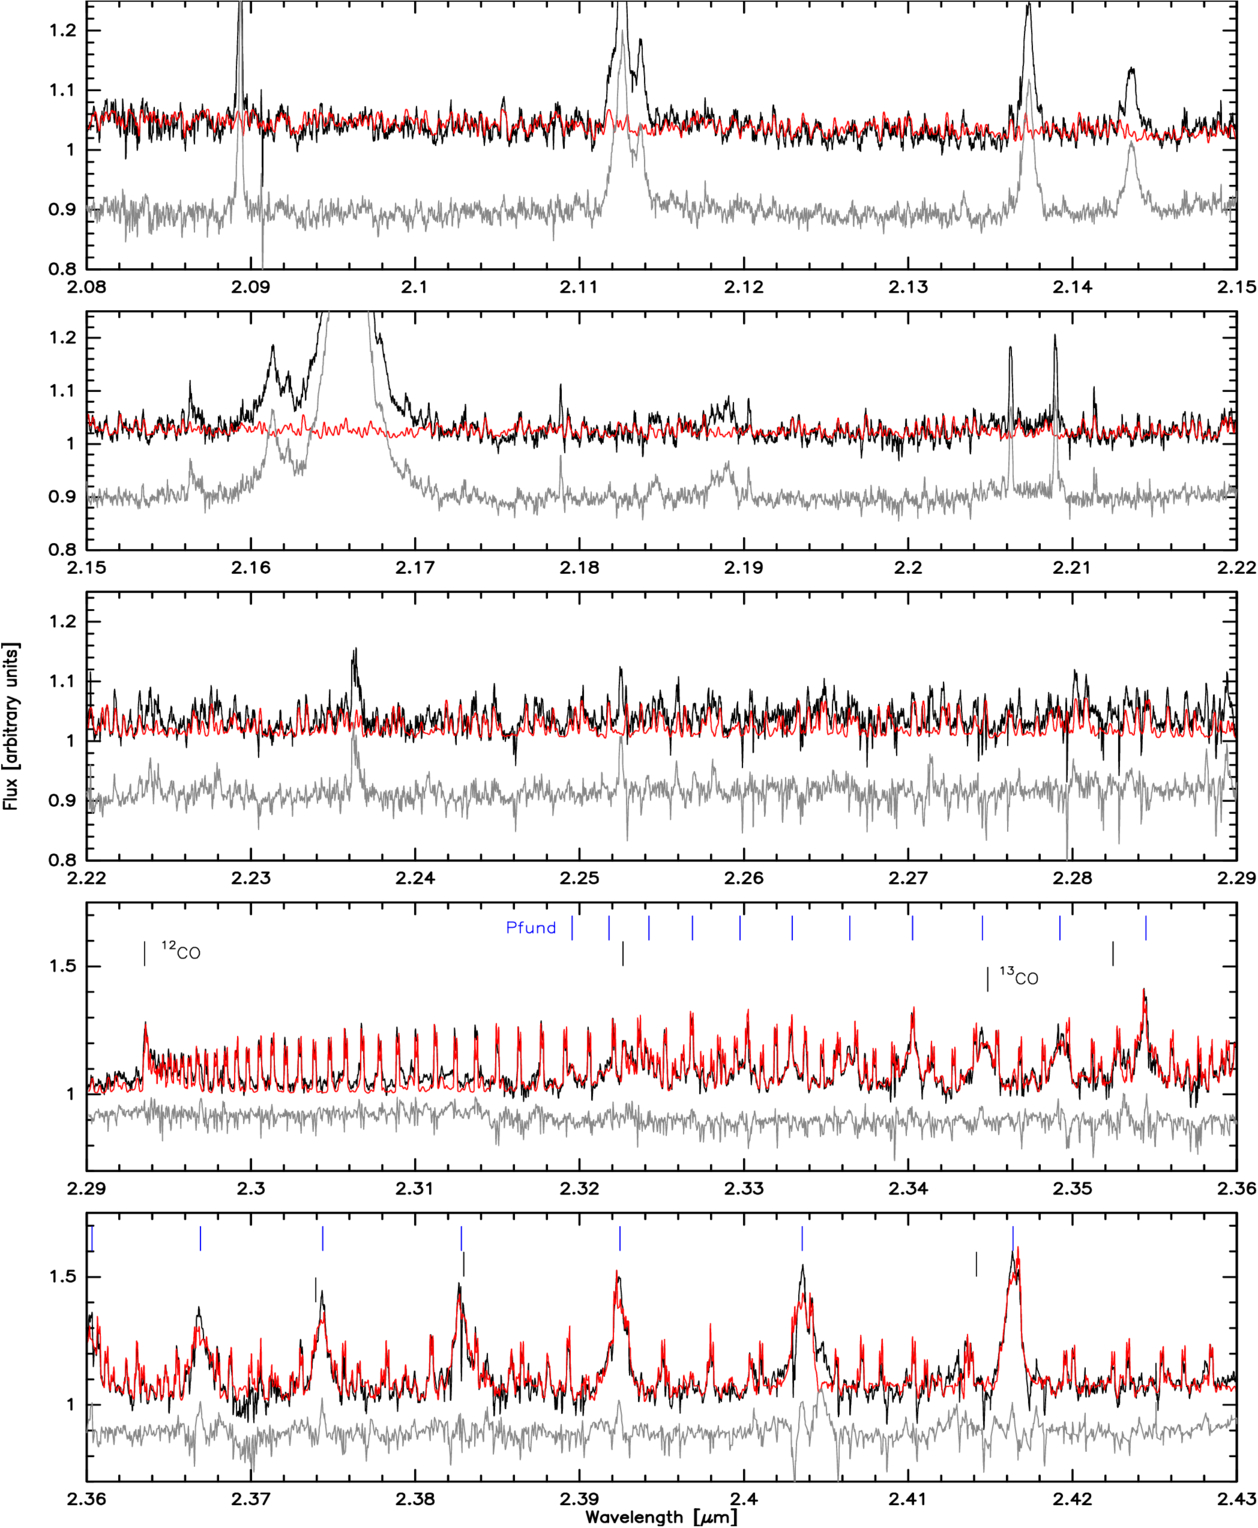
Spectrum of LHA 115-S 18 (black) with the model spectrum composed of water vapor (red, top three panels) and water vapor, CO, and hydrogen emission (red, bottom two panels) overplotted as well as residuals (gray). [Arias et al 2026]

Through computing a synthetic spectrum to compare to the observed spectrum, the authors identified many water vapor emission lines in the circumstellar environment around LHA 115-S 18. While water vapor has been detected in other evolved late-type stars, this is the first detection of water vapor from a B[e] supergiant star. For water vapor to survive the star’s intense radiation, it must exist in a dense, cool, heavily shielded disk around the B[e] supergiant.

Sustaining a cool disk around such a hot star indicates that the circumstellar environment around LHA 115-S 18 is complex and likely shaped by binary interaction. With emission features characteristic of both cool and hot evolved stars, this particular B[e] supergiant presents itself as a unique object holding critical insights into the late-stage evolution of massive stars. Further multiwavelength observations of LHA 115-S 18 will constrain its potential binarity and reveal a possible evolutionary link between B[e] supergiants and other late-stage evolutionary phases of massive stars.

Citation

“High-resolution Near-Infrared Spectroscopy of the B[e] Supergiant LHA 115-S 18: Discovery of Hot Water Vapor Emission,” María Laura Arias et al 2026 ApJL 1000 L49. doi:10.3847/2041-8213/ae524a

The post Water Vapor Around a Sizzling Supergiant: High-Resolution Spectroscopy of B[e] Supergiant LHA 115-S 18 appeared first on AAS Nova.
Characterizing the Atmosphere of Exoplanet WD 0806b with JWST

3 April 2026 at 17:00

gas giant orbiting white dwarf

Orbiting a white dwarf, the exoplanet WD 0806b is the subject of a recent study using JWST to measure the atmospheric conditions governing the planet.

Directly Imaged Exoplanet WD 0806b

Most of the 6,000 and counting exoplanets discovered thus far have been detected due to their impacts on their host star — passing in front of the star and causing it to dim, or gravitationally tugging on the star and causing it to wobble. On rare occasions, though, astronomers have been able to catch the exoplanet itself through direct imaging. Directly imaged exoplanets offer key insights that cannot be obtained through indirect detection methods. Luminosity measurements and spectral emission features allow astronomers to more directly measure planet mass, radius, and composition otherwise inferred from the host star.

WD 0806b system

NIRCam image showing host star WD 0806 circled in orange and the location of exoplanet WD 0806b marked by the orange arrow. [Lew et al 2026]

Included in the about 90 distant planets that have posed for a picture is WD 0806b, a rare exoplanet companion trotting around a white dwarf at an orbital distance of 2,500 au (50 times the distance from the Sun to the Kuiper belt!). Originally discovered with the Spitzer Infrared Array Camera in 2011, WD 0806b is the second-coldest directly imaged exoplanet to date. With JWST’s high-precision photometric and spectroscopic capabilities, WD 0806b provides a unique opportunity to probe the atmospheric chemistry of cold giant planets and take steps toward understanding the co-evolution of white dwarfs and their surviving exoplanets.

WD 0806b’s Atmospheric Abundances from JWST

Aiming to characterize the physical properties and atmospheric composition of WD 0806b, Ben W.P. Lew (Bay Area Environmental Research Institute; NASA Ames Research Center) and collaborators used JWST’s Near-Infrared Camera (NIRCam) and Near-Infrared Spectrograph (NIRSpec) to obtain high-resolution imaging and spectroscopy of the exoplanet. Combining these observations, prior lower-resolution observations, and evolutionary planet models, the authors estimated the physical properties of WD 0806b including mass, radius, surface gravity, and effective temperature.

WD 0806b spectrum

NIRSpec spectrum of WD 0806b with best-fit model spectra overlaid. [Lew et al 2026]

From the derived physical properties, the authors modeled the NIRSpec spectrum to estimate molecular abundances and elemental abundance ratios in the atmosphere of WD 0806b. They obtained measurements of multiple molecules including carbon dioxide, carbon monoxide, and ammonia; these molecular abundances offer the opportunity to test chemical equilibrium and disequilibrium as well as eddy diffusion, or bulk mixing, in the planet’s atmosphere. The authors developed a novel chemical analysis framework to determine how bulk mixing varies with altitude in WD 0806b and reported the first observational evidence that mixing becomes weaker at higher altitudes in exoplanet atmospheres. This result points to the need for future studies exploring the impact of these chemical processes on spectra and photometry, which are essential to characterizing cold giant planets.

This study highlights how high-precision JWST data can reveal a rich collection of atmospheric conditions, chemical composition, and physical processes occurring in cold giant planets. With such a wide orbit from its host white dwarf, WD 0806b serves as an interesting case study for how giant planet composition may reflect the formation and evolutionary history of the overall system. Future observations of and comparisons to similarly cold giant planets will further uncover how atmospheric characterization may fit into our understanding of exoplanets and their histories.

Citation

“JWST Spectral Retrieval of Cold Directly Imaged Planet WD 0806b and the First Measurement of Altitude-dependent Kzz in Exoplanet Atmospheres,” Ben W.P. Lew et al 2026 AJ 171 227. doi:10.3847/1538-3881/ae4747

The post Characterizing the Atmosphere of Exoplanet WD 0806b with JWST appeared first on AAS Nova.
Starring in the Early Universe: Black Hole Stars and Little Red Dots

25 March 2026 at 16:10

NIRCam JADES image

JWST has uncovered a peculiar population of very distant objects known as “little red dots.” The mechanisms powering these objects’ peculiar properties — high luminosities, compact radii, and “V”-shaped spectra — remain uncertain. Could little red dots be the result of supermassive stars, galaxy mergers, or, as a recent study explores, black hole stars?

Direct-Collapse Black Holes and Little Red Dots

Since their discovery, little red dots have been the subject of many studies, but a complete explanation for their unique combination of properties remains elusive. Multiple studies have explored the growing population of peculiar dots, with some postulating that they are the result of stars thousands of times the mass of the Sun, supermassive stars entrenched in gas from a galaxy merger, or black holes embedded in dense accretion disks. 

Even more recently, studies have proposed that little red dots may be the remnants of direct-collapse black holes. In this scenario, a large cloud of gas in the early universe directly collapses into a stellar-mass black hole, and the remaining gas envelops the black hole, forming what is known as a quasi-star (or black hole star). Researchers have suggested that little red dots may be the late stage of this process when the black hole has accreted at least 10% of the total mass of the system. Direct comparisons between quasi-star evolutionary models and JWST observations of little red dots have yet to be explored but are necessary to confirm the potential of quasi-star origins.

Evolutionary Models of Quasi-Stars

Quasi-star HR diagram

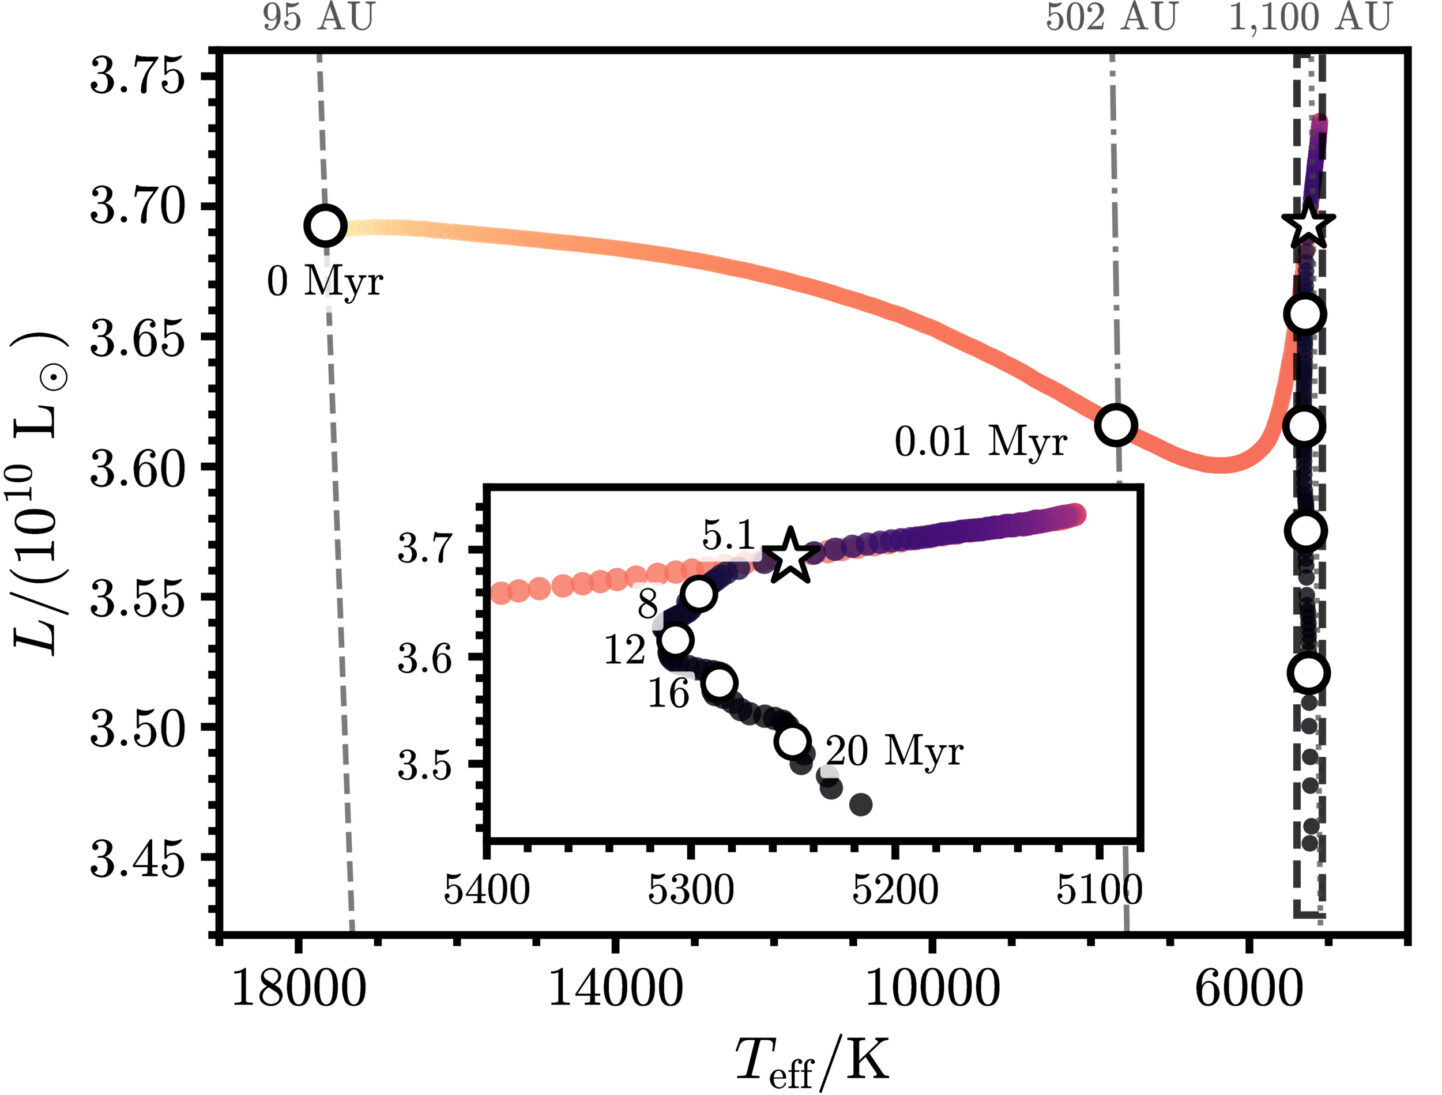
Evolution of a theoretical quasi-star model on a Hertzsprung–Russell diagram. [Modified from Santarelli et al 2026]

Seeking to compare quasi-star evolutionary models to JWST observations of little red dots, Andrew D. Santarelli (Yale University) and collaborators developed a modeling framework to simulate quasi-star evolution. In this framework, a quasi-star is modeled as a black hole at the core of a massive star that accretes material from the stellar envelope over its lifetime. The authors computed models for a range of initial masses and tracked the evolution of the quasi-stars, predicting luminosities, temperatures, surface gravities, and lifetimes of these objects.

After a short initial phase of contraction lasting around 10,000 years, the quasi-star spends the rest of its approximately 20–40-million-year lifetime in the “late stage” as the central black hole continues to eat up the surrounding envelope. In the end, the quasi-star becomes a supermassive black hole a million times the mass of the Sun.

SED comparison of quasi-star + LRDs

Predicted spectral energy distributions of 1 million solar mass, late-stage quasi-stars both alone (black dashed line) and embedded in a host galaxy (solid blue line). Each panel compares the quasi-star to a little red dot observed by JWST. [Modified from Santarelli 2026]

From these models, the authors extracted synthetic spectral energy distributions for late-stage quasi-stars. In comparing the simulated quasi-star spectra to those of three observed little red dots, the authors found that the synthetic quasi-star spectra generally reproduce the main continuum features seen in all three of the little red dots. While the models do not account for specific emission lines, the continuum slopes of the ultraviolet and near-infrared parts of the spectral energy distributions that form the signature “V” shape generally agree with those seen in the three comparison little red dots.
Plausible Progenitors

The results of this study indicate that late-stage quasi-stars can naturally produce the defining continuum features of little red dot spectra. While further modeling is required to trace specific emission line features, the initial modeling presented in this study establishes quasi-stars as plausible progenitors of not only little red dots but also the universe’s first supermassive black holes. 

As the authors noted, the short lifetimes of quasi-stars shown in their models in conjunction with the observed number density of little red dots implies that a significant fraction of supermassive black holes formed through this mechanism. Continued observations of little red dots and advanced modeling of direct-collapse black holes will aid in determining if these peculiar dots are showing off the birth of supermassive black holes in the universe.

Citation

“Evolutionary Tracks and Spectral Properties of Quasi-stars and Their Correlation with Little Red Dots,” Andrew D. Santarelli et al 2026 ApJL 998 L4. doi:10.3847/2041-8213/ae3713

The post Starring in the Early Universe: Black Hole Stars and Little Red Dots appeared first on AAS Nova.

Pulling Back the Curtain on DART Ejecta

6 March 2026 at 17:00

In September 2022, the Double Asteroid Redirection Test (DART) mission served as the first attempt at redirecting a near-Earth asteroid — an experiment testing humanity’s ability to fend off any threatening Earth-bound asteroids. A recent study presents the first 3D reconstruction of the impact ejecta, suggesting that the blown-out material is more complex than previous models considered.

DART-ing into Dimorphos 

The DART spacecraft intentionally smashed into Dimorphos, the small and unassuming moon of the larger asteroid Didymos. This space-based crash test aimed to determine if kinetic impactors like DART could successfully change an asteroid’s course through the solar system. Dimorphos’s orbit was indeed shortened by roughly 30 minutes, confirming that ramming an asteroid with a spacecraft could be a viable method of planetary defense. However, determining exactly how much an asteroid’s path will be altered is not necessarily straightforward. When a spacecraft collides with an asteroid, the impactor imparts momentum to the target, and any material excavated from the impact site can also alter the asteroid’s course.

DART’s impact launched a significant spray of rubble, or what researchers call an ejecta curtain. The ejecta curtain is typically modeled as a cone, using a simple geometry to determine its contribution to momentum transfer. However, when looking closely at imaging taken soon after the collision, the real physical structure of the ejecta appears to be more complex. Untangling the true 3D distribution of the ejecta is necessary to understand how momentum was actually distributed among escaping ejecta, better estimate the total mass ejected from Dimorphos, and improve modeling of the Didymos system’s orbit after impact.

DART ejecta

LICIACube images of the DART ejecta curtain with the 14 distinct features identified in this study outlined in red. Click to enlarge. [Deshapriya et al 2026]

Determining Debris Distribution

Seeking to better characterize the ejecta curtain, a team led by J. D. P. Deshapriya from Italy’s National Institute for Astrophysics used data from the Light Italian CubeSat for Imaging of Asteroids (LICIACube) that flew behind the DART spacecraft to capture images of the system shortly after the impact. After careful image handling to bring out diffuse and faint material, the researchers identified 14 distinct ejecta features across the flyby imaging. LICIACube viewed the aftermath both side on and face on, providing valuable 3D information about the distribution and motion of the ejecta. 

DART ejecta animation

Animation of the DART ejecta as the LICIACube spacecraft approached the impact. The left shows the images taken by the spacecraft, and the right shows the 3D model produced for the ejecta. Click to play animation. [Deshapriya et al 2026]

Using 3D modeling software, the researchers traced each of the 14 distinct features across the images and reconstructed a 3D representation of the ejecta morphology. While earlier models assumed symmetric cone-like geometries, this 3D modeling revealed clear asymmetric and non-uniform structures within the ejecta curtain. These variations point to underlying heterogeneities in the impact site on Dimorphos — surface and subsurface composition naturally link to the resulting ejecta distribution according to previous laboratory experiments. The spatial and directional features uncovered in this study highlight the limitations of models that attempt to characterize ejecta curtains with symmetric and uniform distributions. Refining these model parameters will better match observations and better predict momentum transfer in future missions. 

Planetary Defense

What does this mean for planetary defense? While simplified symmetric cone models provide helpful approximations for kinetic impactor missions, they do not fully capture the true complexity of the impact. This study shows that local variations in an asteroid’s surface and interior properties can directly influence the resulting ejecta distribution and motion. The true momentum imparted to the target asteroid depends heavily on the specific ejecta material, and these details inform how effective planetary defense missions can be in redirecting asteroids. Incorporating realistic, observation-driven ejecta distributions into modeling frameworks is essential to achieve reliable predictions for future planetary defense missions.

Citation

“3D Reconstruction of DART Ejecta at Dimorphos Reveals an Anisotropic, Filamentary Structure,” J. D. P Deshapriya et al 2026 Planet. Sci. J. 7 4. doi:10.3847/PSJ/ae2c64

The post Pulling Back the Curtain on DART Ejecta appeared first on AAS Nova.

Satellite Surplus Around Dwarf Galaxy DDO 161

20 February 2026 at 17:00

LMC

Small galaxies are expected to have even smaller companion galaxies, according to current cosmological models. A recent study takes a look at one dwarf galaxy and finds more tiny companions than anticipated. 

Cosmology Predicts Satellite Galaxies

Critical to our understanding of dark matter and galaxy formation, satellite galaxies are small, faint galaxies surrounding a larger host galaxy. The leading cosmological model, known as lambda cold dark matter (ΛCDM), predicts dark matter halos of all masses to host smaller dark matter subhalos whose luminous counterparts make up satellite galaxies. 

While the satellite systems of Milky Way-like galaxies are well characterized, the companions of dwarf galaxies are less well studied. Despite being significantly smaller, dwarf galaxies should also host even smaller satellites galaxies around them. These satellites push the limits of observations — extremely faint and hard to distinguish from background sources, dwarf galaxy satellites require innovative imaging techniques to discover. 

In recent years, new surveys have identified a number of satellites around dwarf galaxies that appear broadly consistent with ΛCDM predictions, though the sample size is still small. Continuing the search for little galaxies’ little galaxies is critical to testing the ΛCDM framework and will further our understanding of galaxy formation on the smallest scales. 

DDO 161 satellite map

Satellite candidates around DDO 161 as they appear on the sky. Click to enlarge. [Li et al 2026]

Searching for Satellites Around DDO 161

Diving into a specific system, a team led by Jiaxuan Li (李嘉轩) from Princeton University began an in-depth search for satellites around the dwarf galaxy DDO 161. Prior to this study, DDO 161 was known to have one companion, UGCA 319, that is about 10 times smaller than its host. 

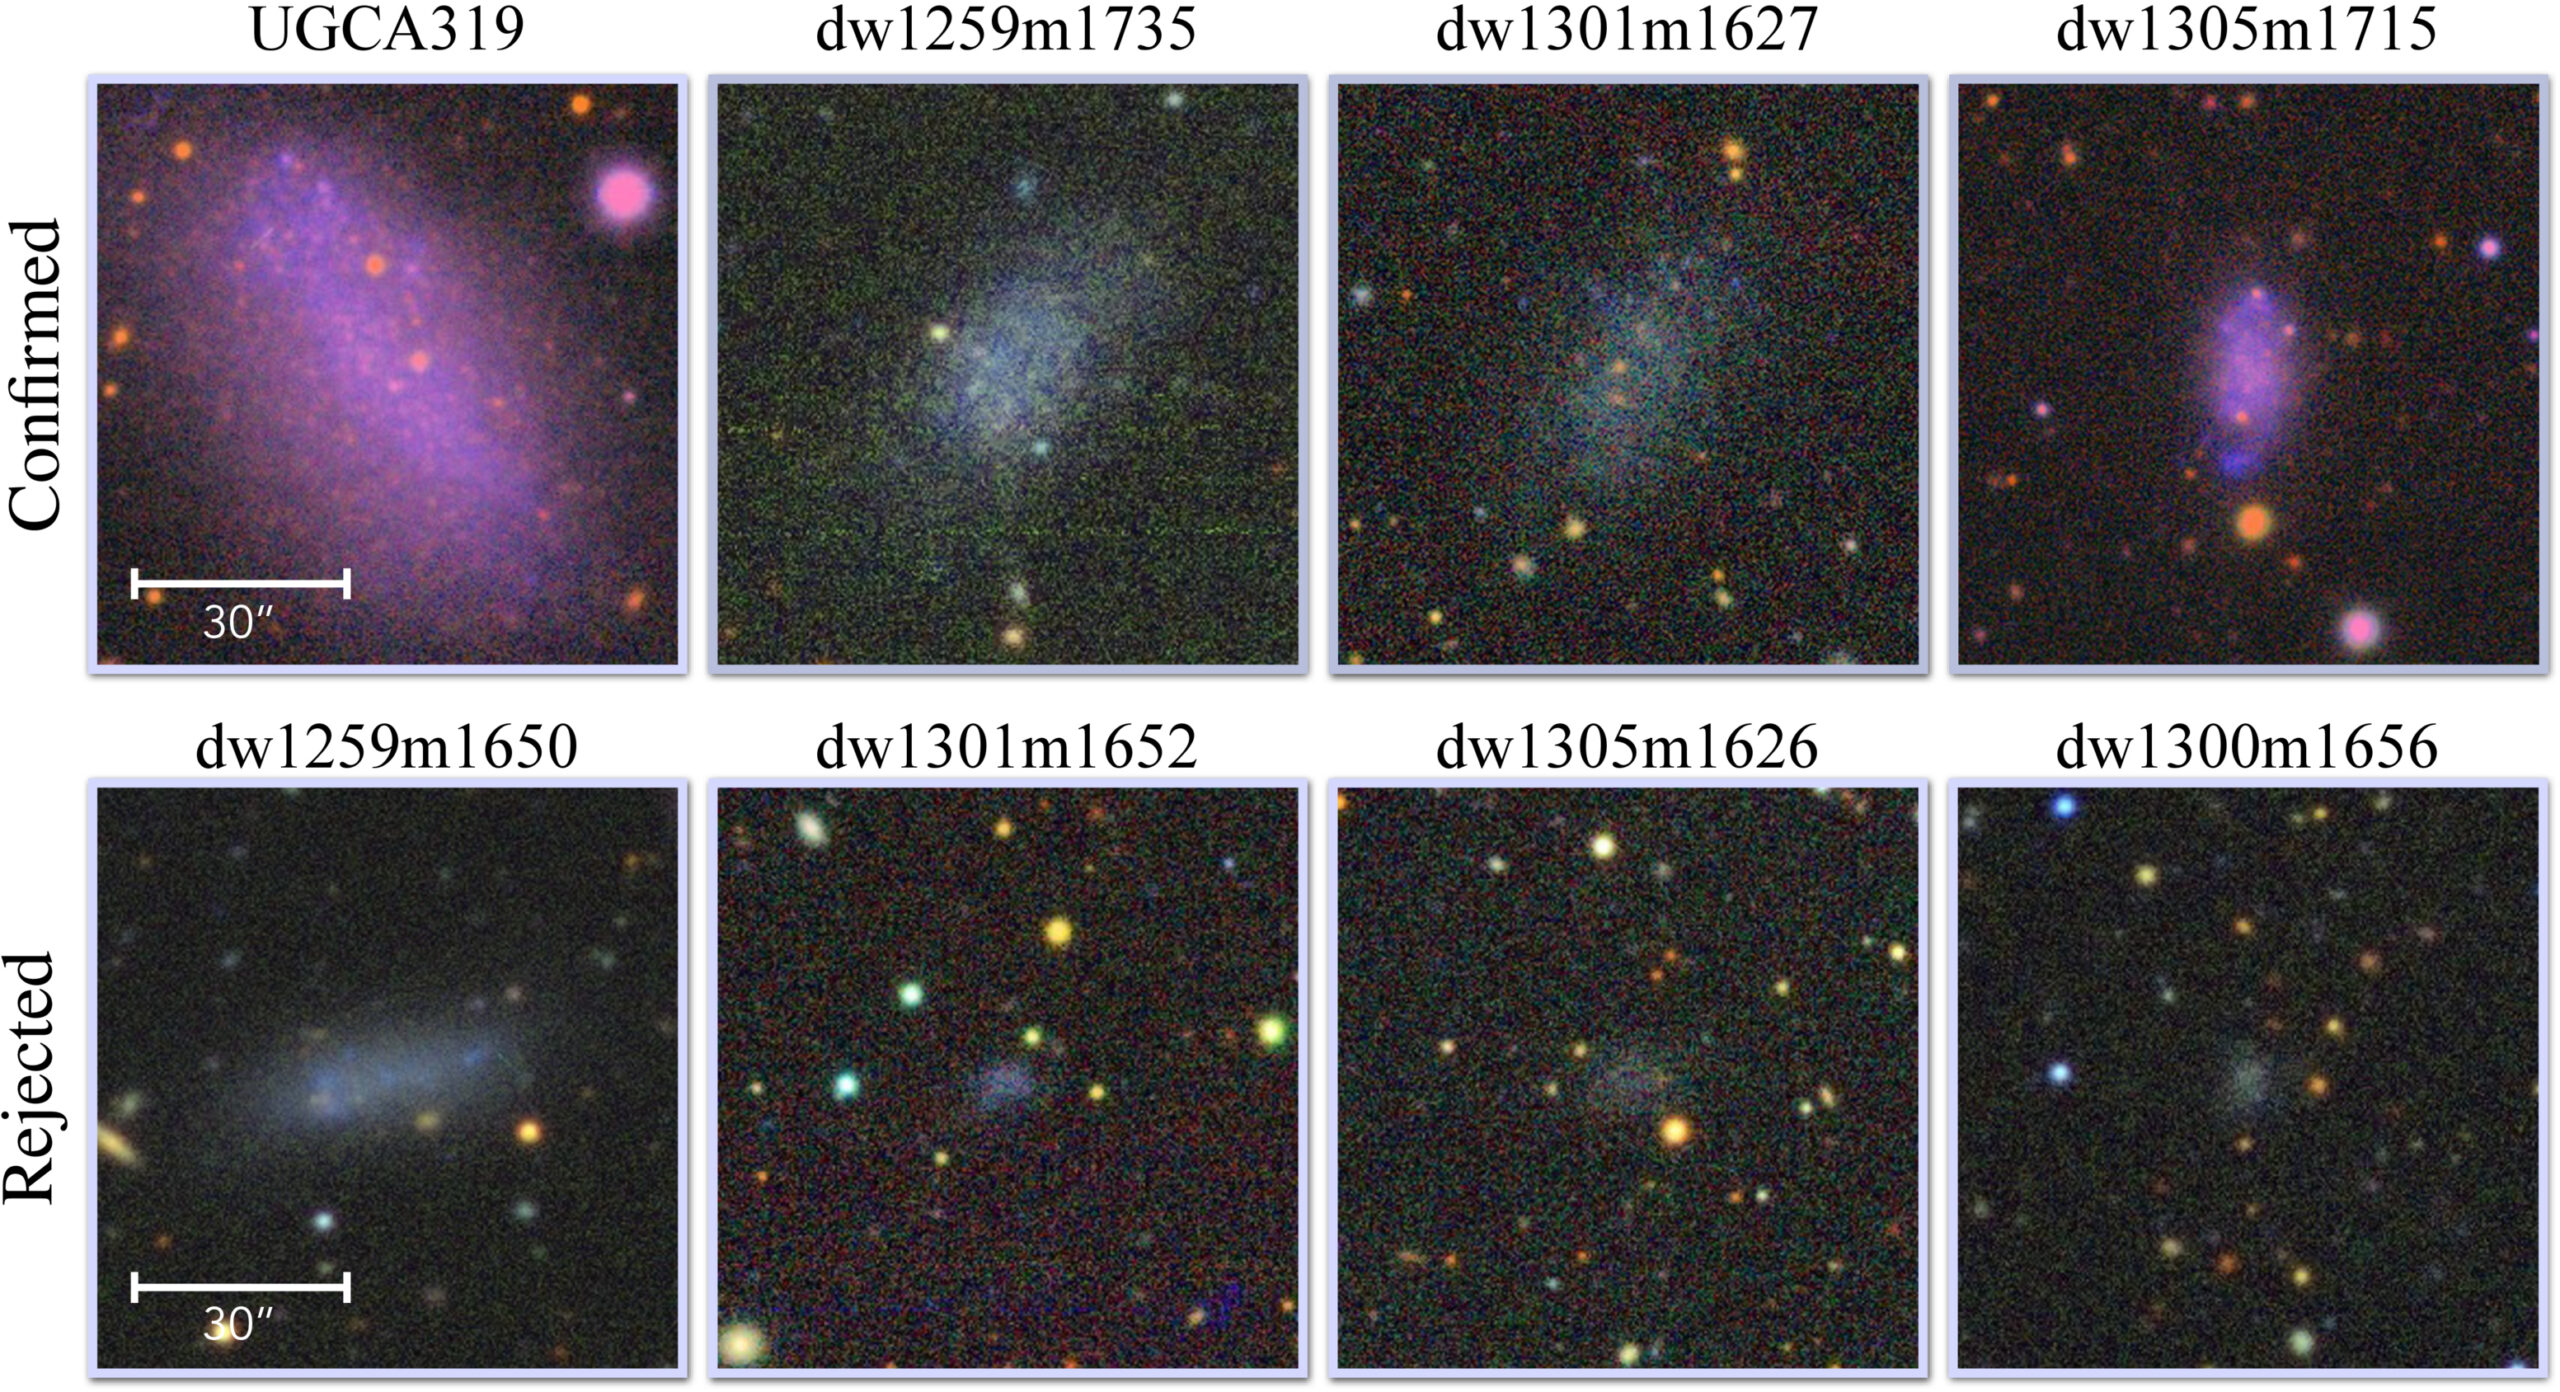
The authors used data from the Legacy Surveys to search for satellites within about 400,000 light-years of DDO 161 — the expected reach of DDO 161’s gravitational influence. After removing bright sources and smoothing the image to bring out very faint objects, they found eight satellite galaxy candidates including UGCA 319.

Images of the satellite candidates of DDO 161 from the Legacy Surveys. The top row shows the confirmed satellites, and the bottom row shows the rejected satellites. Click to enlarge. [Li et al 2026]

To confirm if these candidates were actual satellites of DDO 161, the team performed follow-up observations of the seven unconfirmed sources with the Magellan 6.2-meter telescope. Using the surface brightness fluctuation technique — measuring how a galaxy’s light fluctuates from pixel to pixel to determine its distance — the authors confirmed that three of the candidates are located at a similar distance to DDO 161 and are likely satellites. With the previously confirmed companion UGCA 319, DDO 161 has four satellite galaxies with stellar masses above 250,000 solar masses, making it the most satellite-rich dwarf galaxy known to date. 

Too Many Satellites

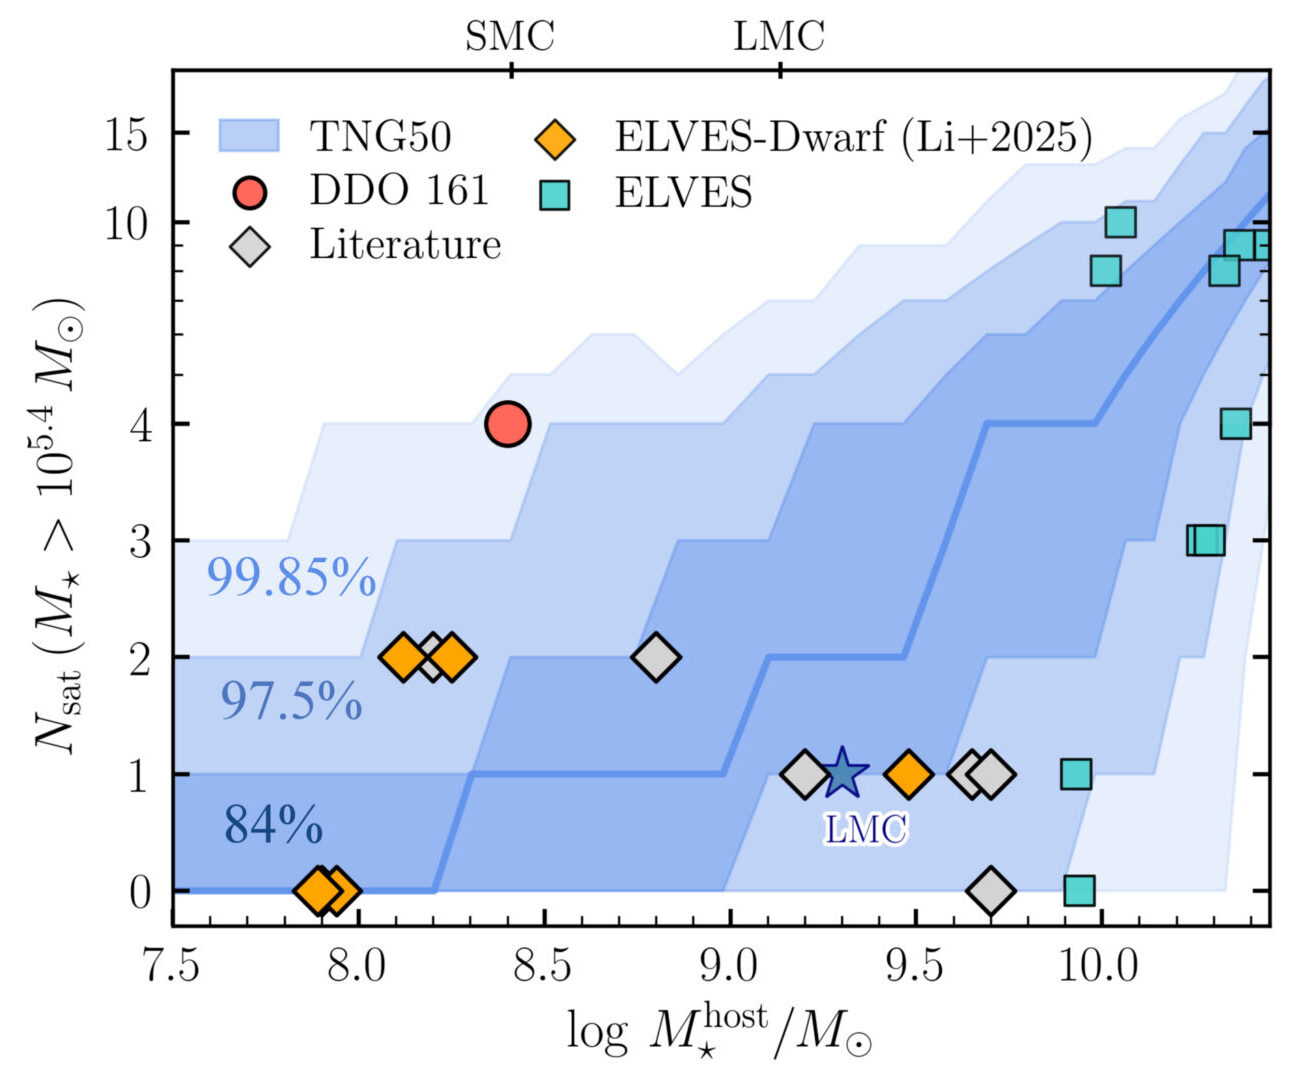
How does DDO 161 compare to theoretical predictions for galaxies of its size? The authors ran cosmological simulations to quantify the expected satellite populations around galaxies of similar size to DDO 161. Just as it is an outlier observationally, DDO 161 is also an outlier when compared to the simulation results that predicted fewer satellite galaxies in similarly massive host systems. 

DDO 161 Satellite Population Comparison

Number of satellites versus host galaxy stellar mass for DDO 161 (red circle) compared to other observed low-mass galaxy satellite systems (data points) and predicted ranges from simulations (blue regions). DDO 161 is a clear outlier, having a high number of satellites for the host galaxy’s stellar mass. Click to enlarge. [Modified from Li et al 2026]

Making sure to cover all bases, the authors considered their observational uncertainties, limitations of the simulations, different relationships between stellar and dark matter halo mass, and possible environmental effects. None of these checks could, at this point, sufficiently explain the satellite overabundance in DDO 161, introducing a possible “too-many-satellites” problem for this galaxy. A larger sample of satellites around dwarf galaxies is necessary to better understand this discrepancy, test our current cosmological framework, and give new insight into galaxy formation on small scales. 

Citation

“A Possible ‘Too-many-satellites’ Problem in the Isolated Dwarf Galaxy DDO 161,” Jiaxuan Li et al 2026 ApJL 998 L24. doi:10.3847/2041-8213/ae3ddd

The post Satellite Surplus Around Dwarf Galaxy DDO 161 appeared first on AAS Nova.
We Have Visitors: Interstellar Material from Nearby Debris Disks

6 February 2026 at 17:00

'Oumuamua

Traversing the galaxy from places yet known, a few interstellar objects have taken a quick dip into our solar system. These objects have inspired a frenzy of questions regarding their origins and paths that led them here. A recent study took to nearby planet-forming stellar systems as possible launching posts.

Interstellar Object Origins

As 3I/ATLAS was first spotted entering the solar system in July 2025, all eyes turned to the curious interstellar visitor. Just the third interstellar object astronomers have observed, 3I/ATLAS joins 1I/ʻOumuamua (2017) and 2I/Borisov (2019) in capturing our attention and igniting many questions regarding their origins and journeys to our corner of the Milky Way. While astronomers have characterized these objects’ compositions, sizes, and paths through the solar system, the mechanisms by which these objects leave their origin systems and travel the galaxy before arriving here are not well constrained. 

These three large bodies are just part of the interstellar material visiting the solar system — spacecraft have detected an influx of small interstellar dust particles, and while not yet directly confirmed, interstellar meteoroids burning up in Earth’s atmosphere are possible. This loose material likely originates in dusty, planet-forming disks (debris disks) around stars — rubble kicked out into interstellar space, sending chemicals, organic compounds, and perhaps even the precursors of life to other nearby systems. Understanding the origins and trajectories of such material will allow us to investigate planet formation and how developing systems may impact their environments.

Deliveries from Debris Disks

Debris disks offer ideal testbeds for tracing small bodies and dusty material through the galaxy. Interactions with large planets in debris disks can launch loose material like planetesimals and dust into interstellar space. To explore how debris disks may drive interstellar visitors to our solar system, Cole R. Gregg and Paul A. Wiegert (The University of Western Ontario) simulated how much material the 20 nearest debris disks would contribute to the interstellar object population of our solar system.

sky projection for particle arrival directions

Arrival direction on the sky for particles that reach the solar system from the 20 debris disks studied here. The arrival locations for 1I/ʻOumuamua, 2I/Borisov, and 3I/ATLAS are shown for comparison. Click to enlarge. [Gregg and Wiegert 2025]

The authors modeled the trajectories of ejected material from each debris disk within a simulated Milky Way, running the simulations backward and forward in time to trace the ejecta over 100 million years. These simulations show that material from each of the 20 systems is currently expected to be within our solar system. For interstellar objects (≥100 meters), the simulations predict that about two objects from these debris disks are currently within the inner solar system.

Trickier to spot, smaller meteoroids (≥200 microns) that would appear as meteors in Earth’s atmosphere are also expected. The only way to observationally confirm interstellar origins for meteors is based on how fast they are moving relative to the material in our solar system, or their excess velocities. Based on the simulations, many of these smaller particles have low excess velocities, making them observationally difficult to distinguish from bound solar system objects.

Observational Connections and Expectations

'oumuamua zoom in plot

Zoomed-in view focusing on the direction where 1I/ʻOumuamua entered the solar system. The interstellar object falls near the arrival directions of particles from HD 38858 and HD 166. Click to enlarge. [Gregg and Wiegert 2025]

How do these simulations compare to observations? From their analysis, the authors identified where the interstellar material from each debris disk would first enter the solar system. Comparing these to the entry locations of 1I/ʻOumuamua, 2I/Borisov, and 3I/ATLAS, ʻOumuamua appears near the entry locations for debris from HD 166 and HD 38858. (2I/Borisov and 3I/ATLAS had no such match up in this sample of debris disks.) However, tracing ʻOumuamua’s travel backward, its closest approaches to these systems are about 32 and 18 light-years away, respectively — likely too far to have originated from either system but still a clear proof of concept that we can place interstellar objects near potential systems of origin. 

Where are the expected interstellar meteoroids? Current meteor detectors including the Canadian Meteor Orbit Radar (CMOR) and the Global Meteor Network (GMN) search the sky for incoming material. While the simulations predict hundreds of meteoroid-sized particles from each debris disk currently in the inner solar system, the small collecting area of CMOR and the limiting size of grains detectable by GMN statistically require decades of observations to detect even a single interstellar meteoroid. Thus, the lack of detections thus far is not surprising, but with advanced instrumentation, discoveries of more interstellar particles and objects are imminent.

Citation

“A Catalogue of Interstellar Material Delivery from Nearby Debris Disks,” Cole R. Gregg and Paul A. Wiegert 2025 PSJ 6 309. doi:10.3847/PSJ/ae284f

The post We Have Visitors: Interstellar Material from Nearby Debris Disks appeared first on AAS Nova.
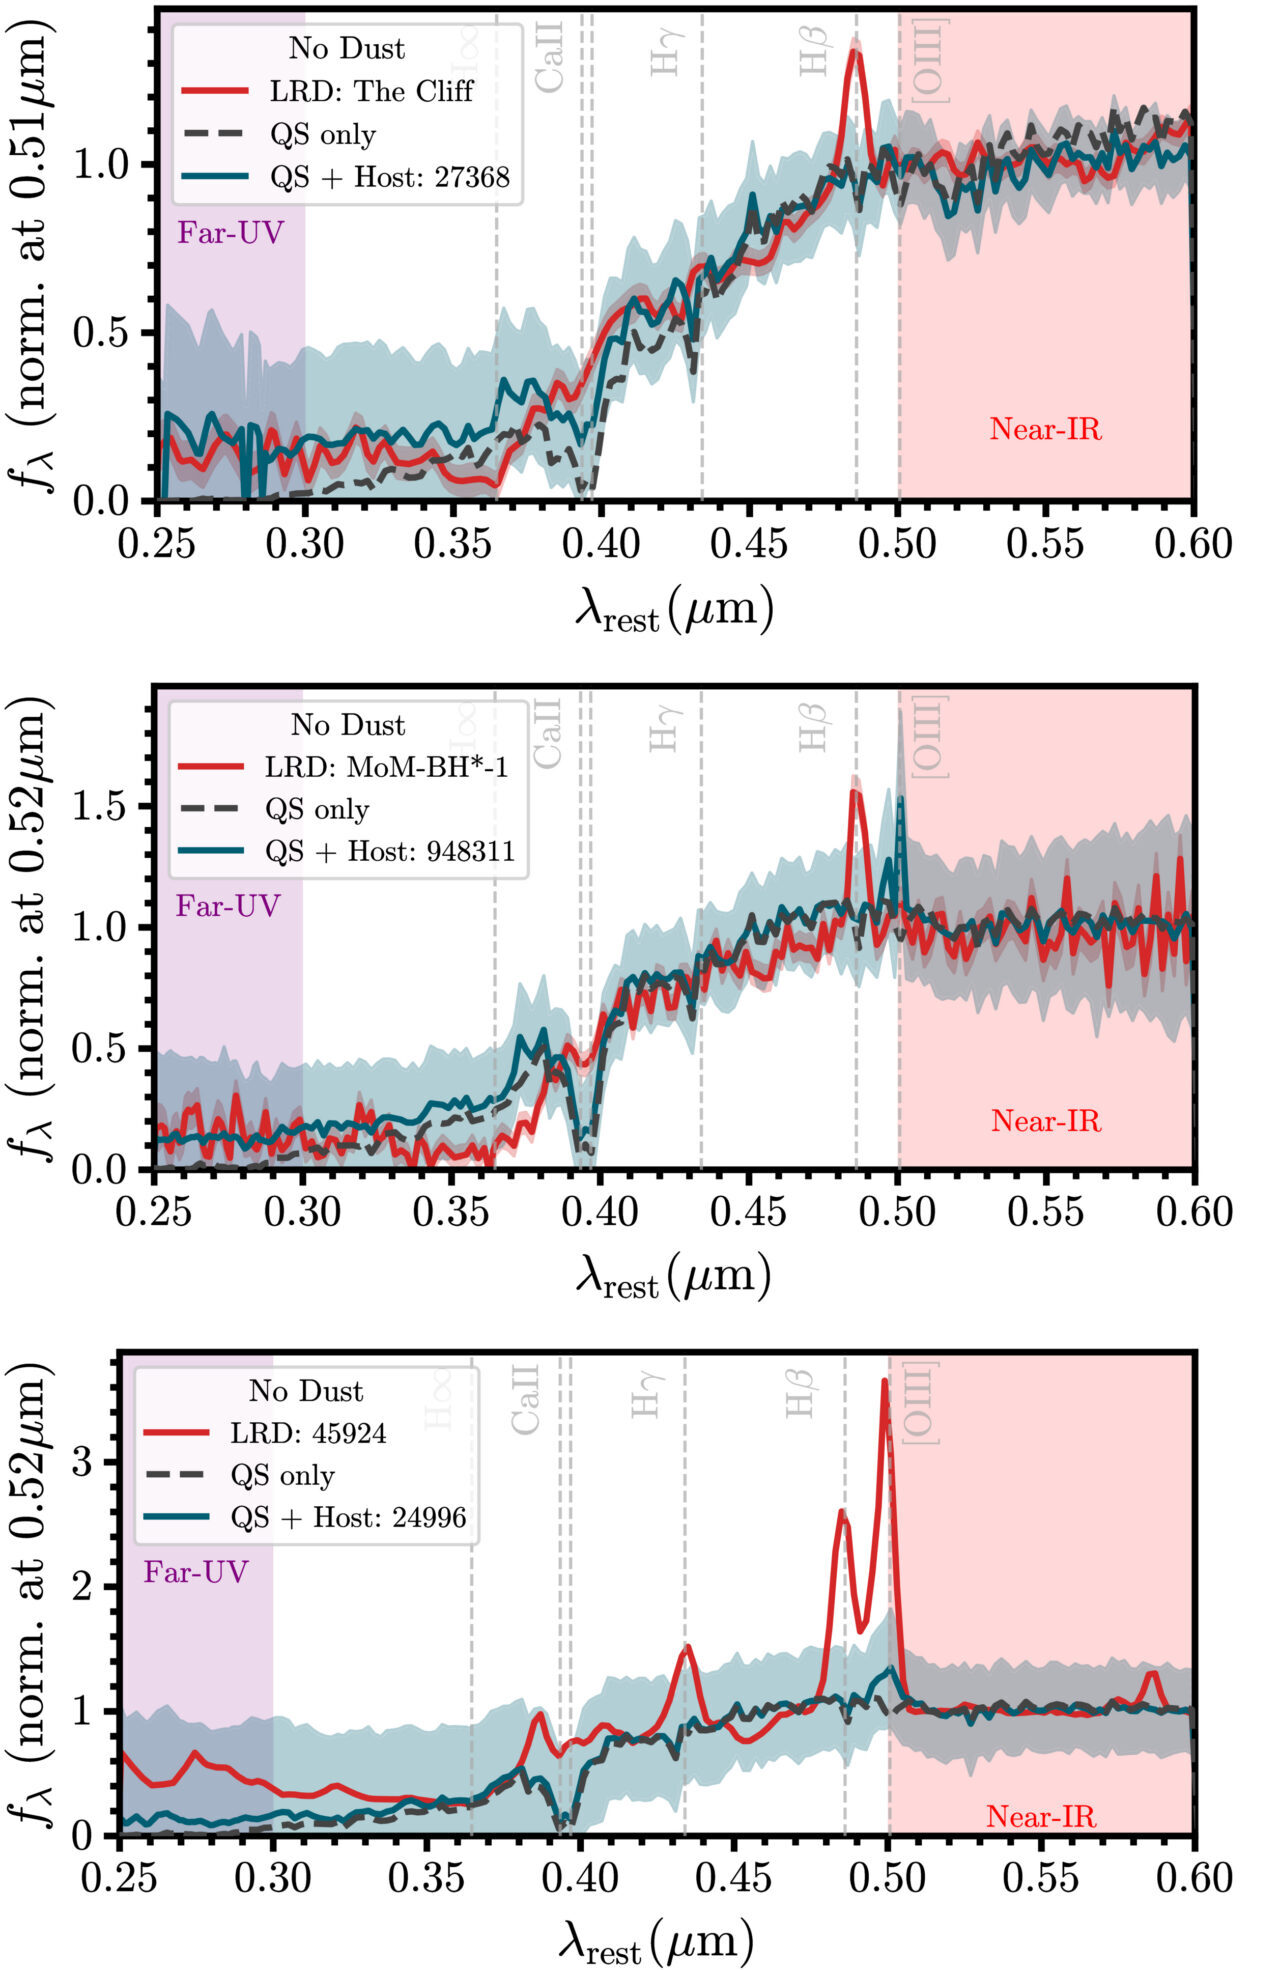
Getting a Peek of Kitt Peak National Observatory

23 January 2026 at 17:00

KPNO

After AAS 247 in Phoenix, Arizona, AAS Nova Editor Kerry Hensley and I had the chance to travel about 150 miles south for a tour of Kitt Peak National Observatory.

A Window into Kitt Peak

Located 60 miles southwest of Tucson, Kitt Peak National Observatory (KPNO) resides on a mountain top within the Tohono O’odham Nation reservation. Founded in 1958, Kitt Peak is home to nearly two dozen active telescopes ranging in wavelength coverage and scientific objectives. Ronald Proctor, Lori Allen, and Jacelle Ramon-Sauberan, all serving in crucial roles for the observatory, led our tour around the mountain.

Windows Center Lobby

The Windows On the Universe Center’s lobby exhibit displaying the Tohono O’odham language with words describing the land and astronomy. Jacelle Ramon-Sauberan, the Tohono O’odham Nation Education Liaison, is seen to the left. [KPNO/NOIRLab/NSF/AURA/R. Proctor; CC BY 4.0]

Our visit began in the new Windows on the Universe Center — the first science center inside of a telescope. Situated inside the retired McMath-Pierce Solar Telescope, the Windows Center takes visitors through exhibits exploring the universe, the telescope’s original control room, and the observatory’s connection to the Tohono O’odham Nation.

The center’s lobby introduced visitors to the beautiful land KPNO calls home. Working with Tohono O’odham linguists, Jacelle, the observatory’s Tohono O’odham Nation Education Liaison, curated the lobby exhibit that features the native language and the Nation’s connection to astronomy and the observatory. The science center serves as an educational resource and place of cultural exchange, expanding the relationship between the observatory and the Tohono O’odham Nation. 

Astronauts

Apollo astronauts in the control room of the McMath-Pierce Solar Telescope in 1964. [United States Geological Survey; CC BY 4.0]

After walking through an introduction to the universe exhibit, visitors enter the original control room of the telescope. Mirrors across the room’s ceiling focus the Sun’s light onto table screens where visitors can observe the Sun in real time without burning their eyeballs. In addition to observing the Sun, the solar telescope allowed astronauts in the 1960s to view a projection of the Moon’s surface and plan their landing site for the Apollo 11 mission. Visitors can stand in the same place and witness the instruments that made the moon landing possible.

At the end of the Windows Center is a Science On a Sphere Theater — a spherical display system that allows visitors to see planets, stars, moons, and even large-scale structures of the universe in 3D. Featuring multiple programs, the theater takes visitors through the universe and displays data collected right there on the mountain!

WIYN

The WIYN 3.5-meter telescope at sunset. [KPNO/NOIRLab/NSF/AURA/P. Marenfeld; CC BY 4.0]

A WIYN for Exoplanetary Science

Though not typically open to the public for tours, our next stop took us to the WIYN 3.5-meter telescope. This telescope is operated and owned by the WIYN Consortium, a partnership between the University of Wisconsin, Indiana University, NSF’s NOIRLab (National Optical-Infrared Astronomy Research Laboratory; formerly NOAO), Pennsylvania State University, and Princeton University. Operating since 1994 with a strong collection of instruments, WIYN has observed galaxies near and far, stars across their lifetimes, and exoplanets tugging on their host stars.

Lexi at WIYN

Me, Lexi Gault (AAS Media Fellow), in front of the WIYN 3.5-meter telescope. I have used WIYN’s SparsePak spectrograph to collect data for my dissertation research! [AAS Nova/Kerry Hensley]

WIYN’s newest instrument, NEID (pronounced “NOO-id”), has been advancing exoplanetary science since its first light in early 2020. Derived from the word meaning “to see” in the Tohono O’odham language, NEID is a high-resolution spectrograph that uses the radial velocity method to detect exoplanets. As a planet orbits its host star, its gravitational pull induces a wobble in the star, and NEID can detect these wobbles with unprecedented precision. This instrument allows astronomers to find exoplanets that were previously undetectable.

The partnership between public and private universities and a government institution was the first of its kind. Through this consortium, hundreds of undergraduate and graduate students have conducted research with WIYN, and the telescope’s suite of instruments have enabled early career astronomers to explore the universe both near and far.

Mysteries of Dark Energy at Mayall

We concluded our tour at the Mayall 4-meter Telescope, the tallest telescope dome on the mountain at a staggering 18 stories high. This iconic telescope saw first light in 1973, and at the time, was the second-largest (in diameter) telescope in the world. Originally built for wide-field optical and infrared studies of the universe, the Mayall has enabled decades of critical scientific research.

Mayall dome

The Mayall dome across the mountain as seen from inside the WIYN dome. [AAS Nova/Lexi Gault]

Mayall is now home to the Dark Energy Spectroscopic Instrument (DESI), the most powerful multi-object survey spectrograph in the world. The DESI survey measures the impact of dark energy on the expansion of the universe through creating the largest ever 3D map of the universe. Mapping the distances to hundreds of millions of galaxies, DESI has revolutionized cosmology and enabled groundbreaking research into the origins of the universe. 

From the telescope’s massive dome, to the busy DESI control room, to the gallery floor with a nearly 360 degree view of the surrounding desert, the Mayall offers visitors a unique glimpse into Kitt Peak’s history and its future. While WIYN is a hidden gem, the Mayall 4-meter Telescope is open to the public for tours daily, so you can experience the exciting era of research and discovery at KPNO. 

Visit Kitt Peak

Interested in getting a peek yourself? KPNO is open to the public daily with multiple tour types to choose from, including both daytime and nighttime visits! Plan your visit to Kitt Peak here.

The post Getting a Peek of Kitt Peak National Observatory appeared first on AAS Nova.
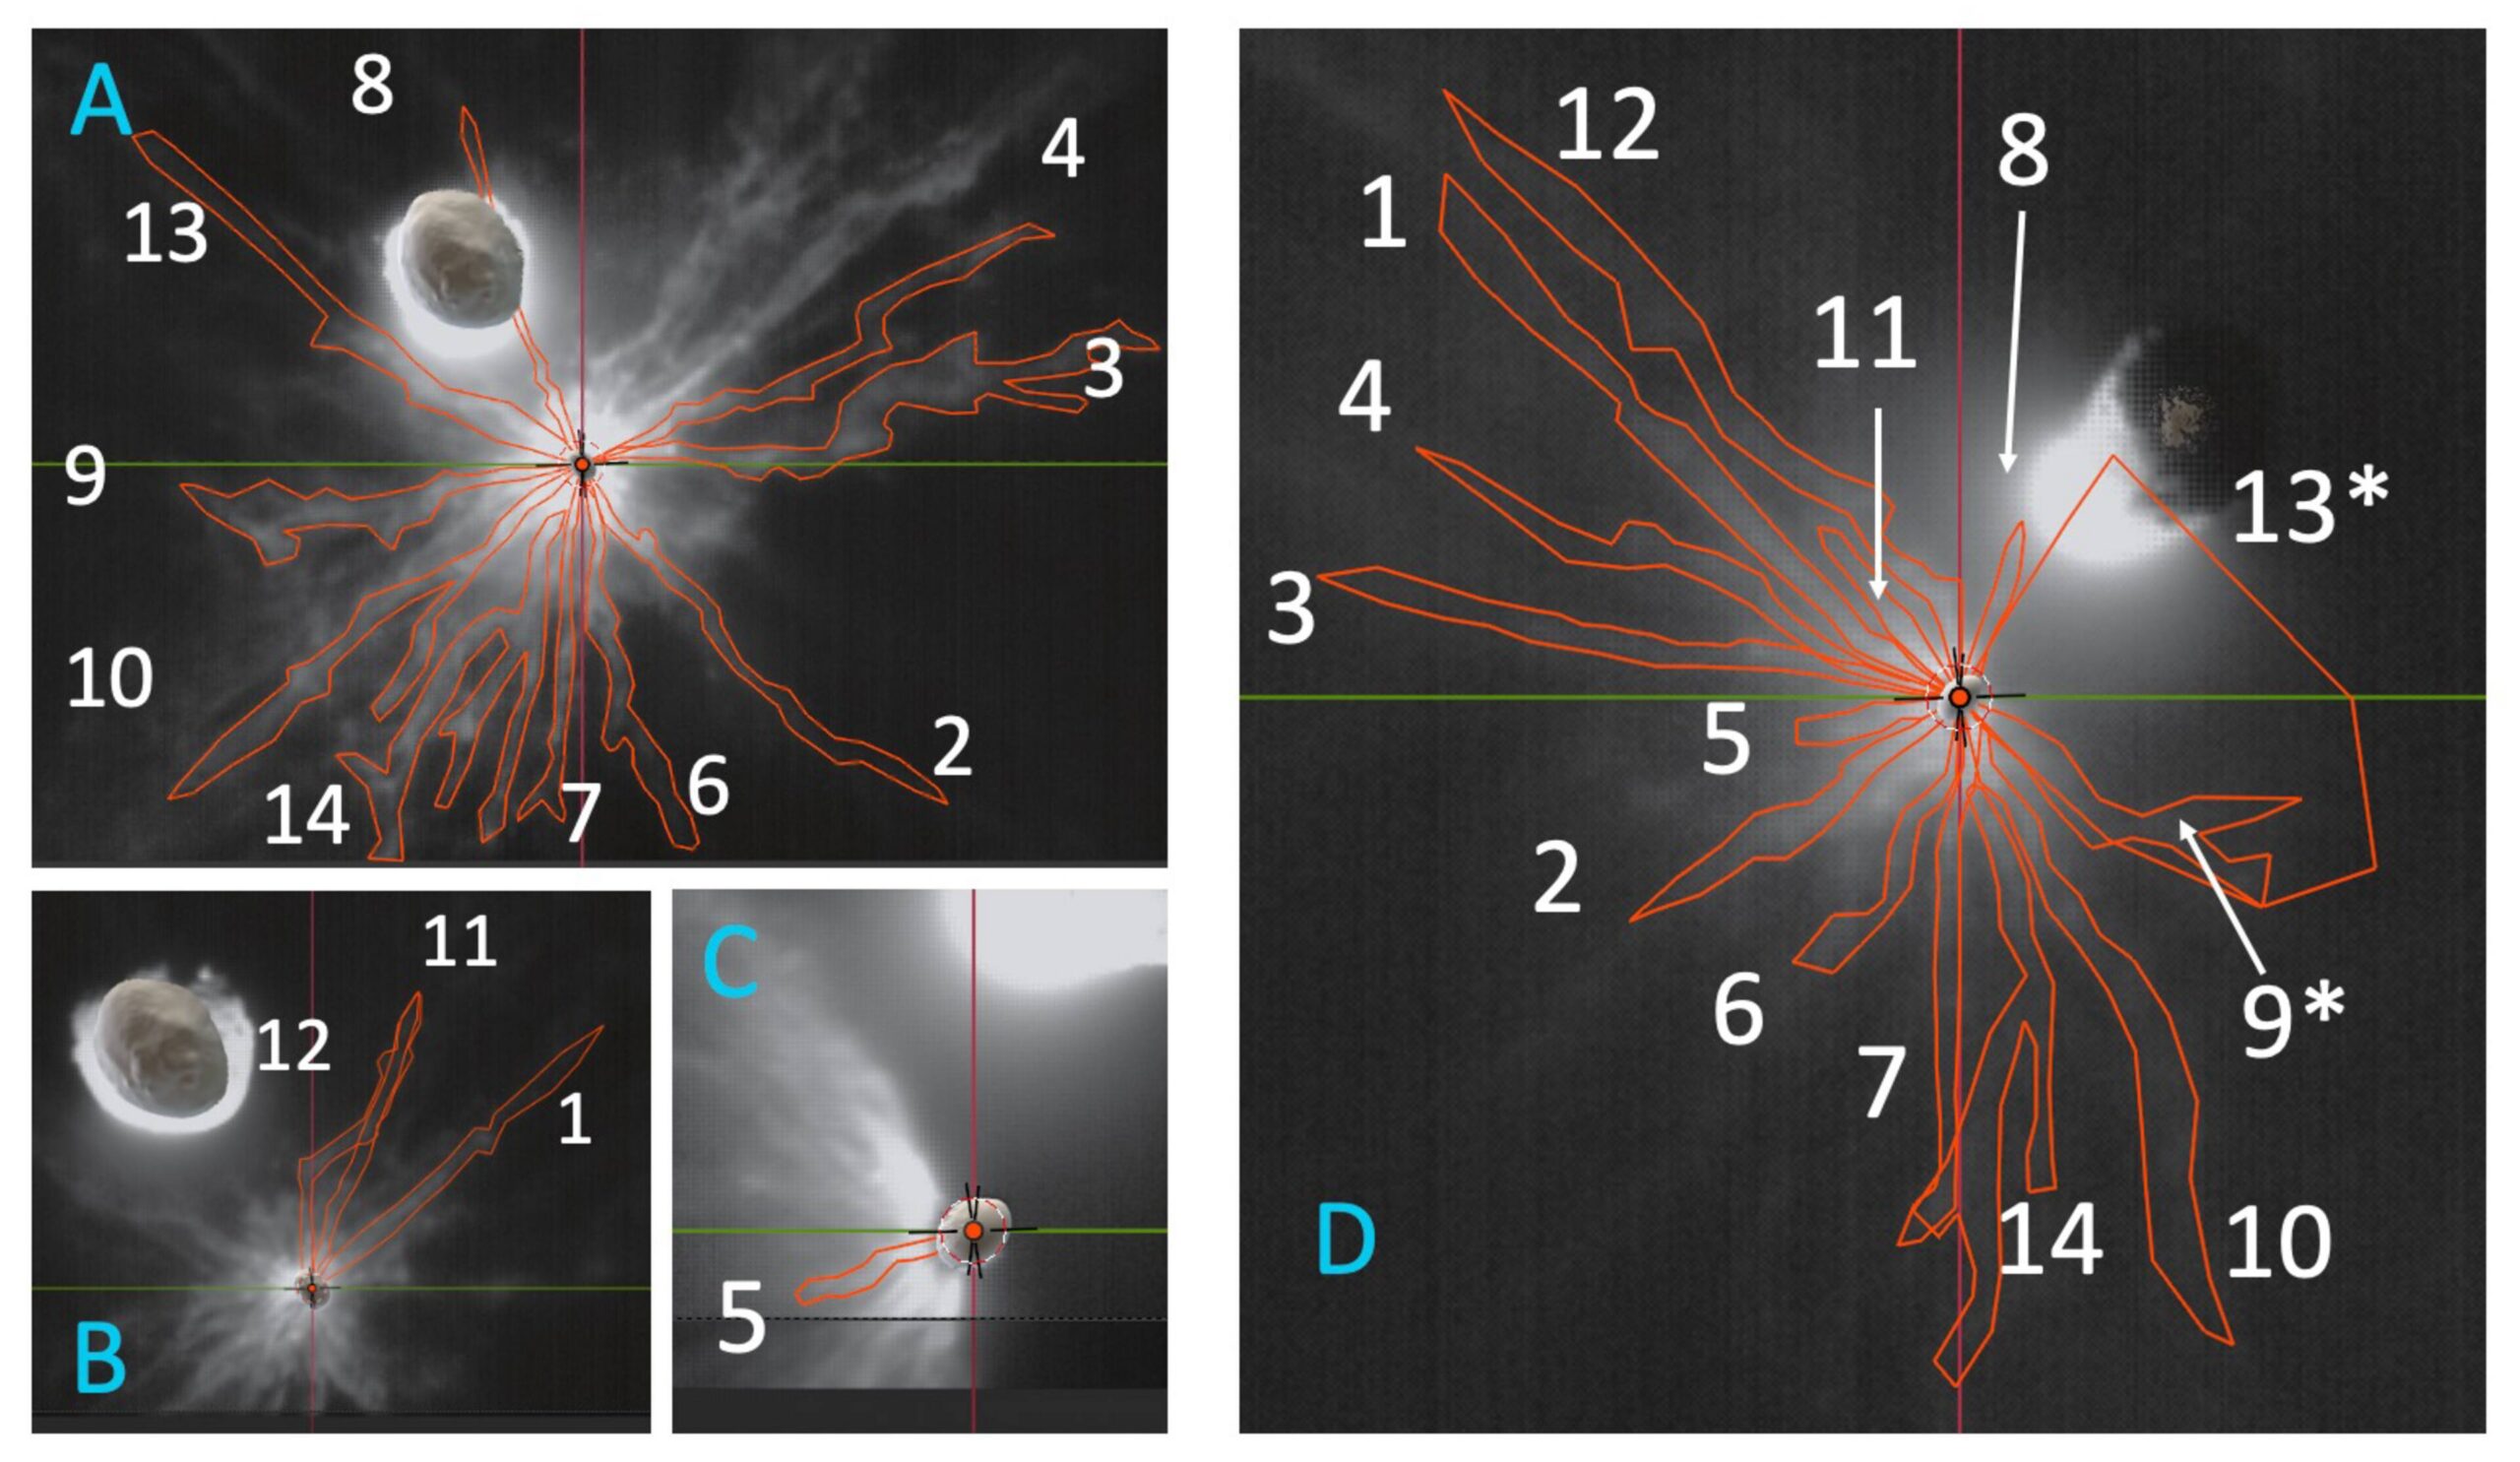
Selections from 2025: Could Earth Detect Earth?

30 December 2025 at 17:00

Earth

Editor’s Note: For the remainder of 2025, we’ll be looking at a few selections that we haven’t yet discussed on AAS Nova from among the most-downloaded articles published in AAS journals this year. The usual posting schedule will resume January 2nd.

Earth Detecting Earth: At What Distance Could Earth’s Constellation of Technosignatures Be Detected with Present-day Technology?

Published February 2025

Main takeaway:

In a collaborative effort between the Search for Extraterrestrial Intelligence (SETI) Institute and the Penn State Extraterrestrial Intelligence Center, Sofia Sheikh (SETI Institute) and team turned inward to expand the search for intelligent life in the universe. Right here on Earth, humans have created a laboratory of technological signatures that can be detected from space — if another Earth-like civilization is out there, could they detect us? Using theoretical modeling, the authors determined the reaches of various human technosignatures such as radio transmissions, optical and infrared emission, satellites, and other probes sent into space. They found humanity’s strongest signals, radio transmissions, could be detected as far as 12,000 light-years away.

Why it’s interesting:

Scientists search for intelligent civilizations by hunting for signs of technology — signals or patterns that natural phenomena cannot explain. While we cannot expect other intelligent life to look exactly like Earth’s, many SETI projects have surveyed the skies for hypothetical signals far exceeding humanity’s own technological advancements. Taking a step back, Sheikh and collaborators considered where human technology is currently and what present-day instrumentation could pick up on if we were to search for ourselves. This “Earth detecting Earth” paradigm recenters the search for intelligent life and provides a multiwavelength framework for understanding the detectability of technology on far-away worlds.

Maximum detectability of Earth's technosignatures.

Maximum distances that Earth’s technosignatures could be detected by current technology. Click to enlarge. [Sheikh et al 2025]

Earth’s constellation of technosignatures:

What exactly are Earth’s many technosignatures, and how far could our current technology detect them? The most prominent and farthest detectable signal comes from radio transmissions. As the authors noted, these signals come from multiple sources: targeted radar transmissions used to characterize planets and asteroids, radio transmissions used to communicate between space probes and ground stations (e.g., space telescopes, Mars rovers, etc.), and radio leakage from Earth’s communication systems like cell towers and broadcasting stations. Additionally, there are atmospheric technosignatures from air-polluting compounds, optical and infrared emission from cities, targeted lasers from telescopes, and interplanetary and interstellar probes sent into space. All of these combined create a constellation of technosignatures detectable across a range of distances from Earth. This study underscores the importance of assessing Earth’s technology and detection capabilities, and repeating this type of study as technological advancements continue will enhance the search for intelligent life.

Citation

Sofia Z. Sheikh et al 2025 AJ 169 118. doi:10.3847/1538-3881/ada3c7

The post Selections from 2025: Could Earth Detect Earth? appeared first on AAS Nova.
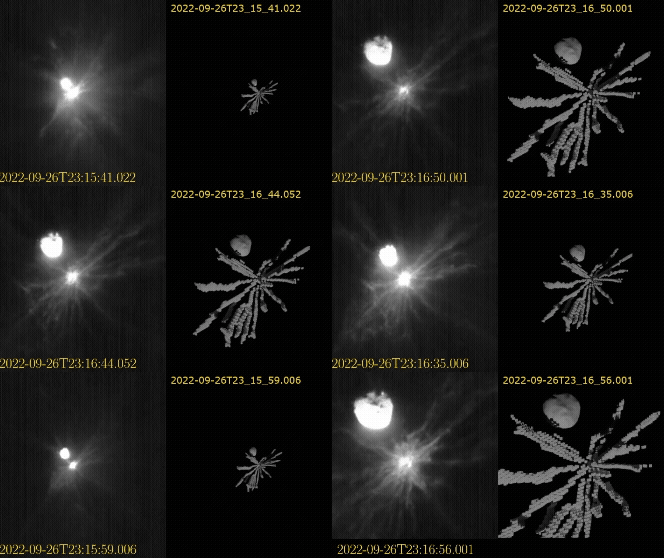
Selections from 2025: The Nine-Ringed Bullseye Galaxy

23 December 2025 at 17:00

Bullseye galaxy

Editor’s Note: For the remainder of 2025, we’ll be looking at a few selections that we haven’t yet discussed on AAS Nova from among the most-downloaded articles published in AAS journals this year. The usual posting schedule will resume January 2nd.

The Bullseye: HST, Keck/KCWI, and Dragonfly Characterization of a Giant Nine-ringed Galaxy

Published February 2025

Main takeaway:

Bullseye galaxy rings

Red ellipses overplotted on the first eight rings identified with Hubble in the Bullseye galaxy. Click to enlarge. [Pasha et al 2025]

Using a combination of the Hubble Space Telescope, the Dragonfly Telephoto Array, and the Keck Cosmic Web Imager, Imad Pasha (Yale University) and collaborators discovered and performed deep follow-up observations of a giant collisional ring galaxy aptly nicknamed the “Bullseye” galaxy (LEDA 1313424). The team identified a staggering nine rings in the Bullseye with a likely tenth that has since faded — the most rings found in any collisional ring galaxy to date. The rings are a result of a small blue dwarf galaxy shooting through the Bullseye’s core about 50 million years ago, sending ripples through the galaxy.

Why it’s interesting:

Galaxy mergers and interactions are commonplace in the universe, but it is very rare for a dwarf galaxy to strike right through a large galaxy’s core. When this does happen, the collision sends shock waves through the impaled galaxy, sweeping gas and dust outward and forming rings where star formation can occur (hence the name, collisional ring galaxy). These galaxies are valuable sites to explore galactic structure and evolution as well as provide a unique case to study galaxy mergers and interactions. Previously discovered collisional ring galaxies have at most two or three rings, so when Pasha and collaborators found the stunning nine in the Bullseye, it was clear they caught something significant.

Catching the Bullseye at a lucky time in its evolution:

Why does the Bullseye have so many rings? Theoretical studies of these head-on collisions predict that many rings will form and travel outward after the initial crash; however, the rings tend to dissolve after only a few hundred million years. Catching this collision only 50 million years after it happened means we are witnessing the earlier stages of the Bullseye’s evolution. This lucky discovery not only confirms theoretical predictions for collisional ring galaxies, it also may be a clue to how another unique galaxy type, giant low-surface brightness galaxies, originate. Given the wispy ring material found at very large radii from the Bullseye, the authors suggested that collisional ring galaxies may evolve into giant low-surface brightness galaxies as they expand outward and fade. Further investigation and a larger sample of collisional ring galaxies are necessary to confirm this hypothesis, but the Bullseye provides interesting and critical observational evidence of these predictions for the first time.

Citation

Imad Pasha et al 2025 ApJL 980 L3. doi:10.3847/2041-8213/ad9f5c

The post Selections from 2025: The Nine-Ringed Bullseye Galaxy appeared first on AAS Nova.
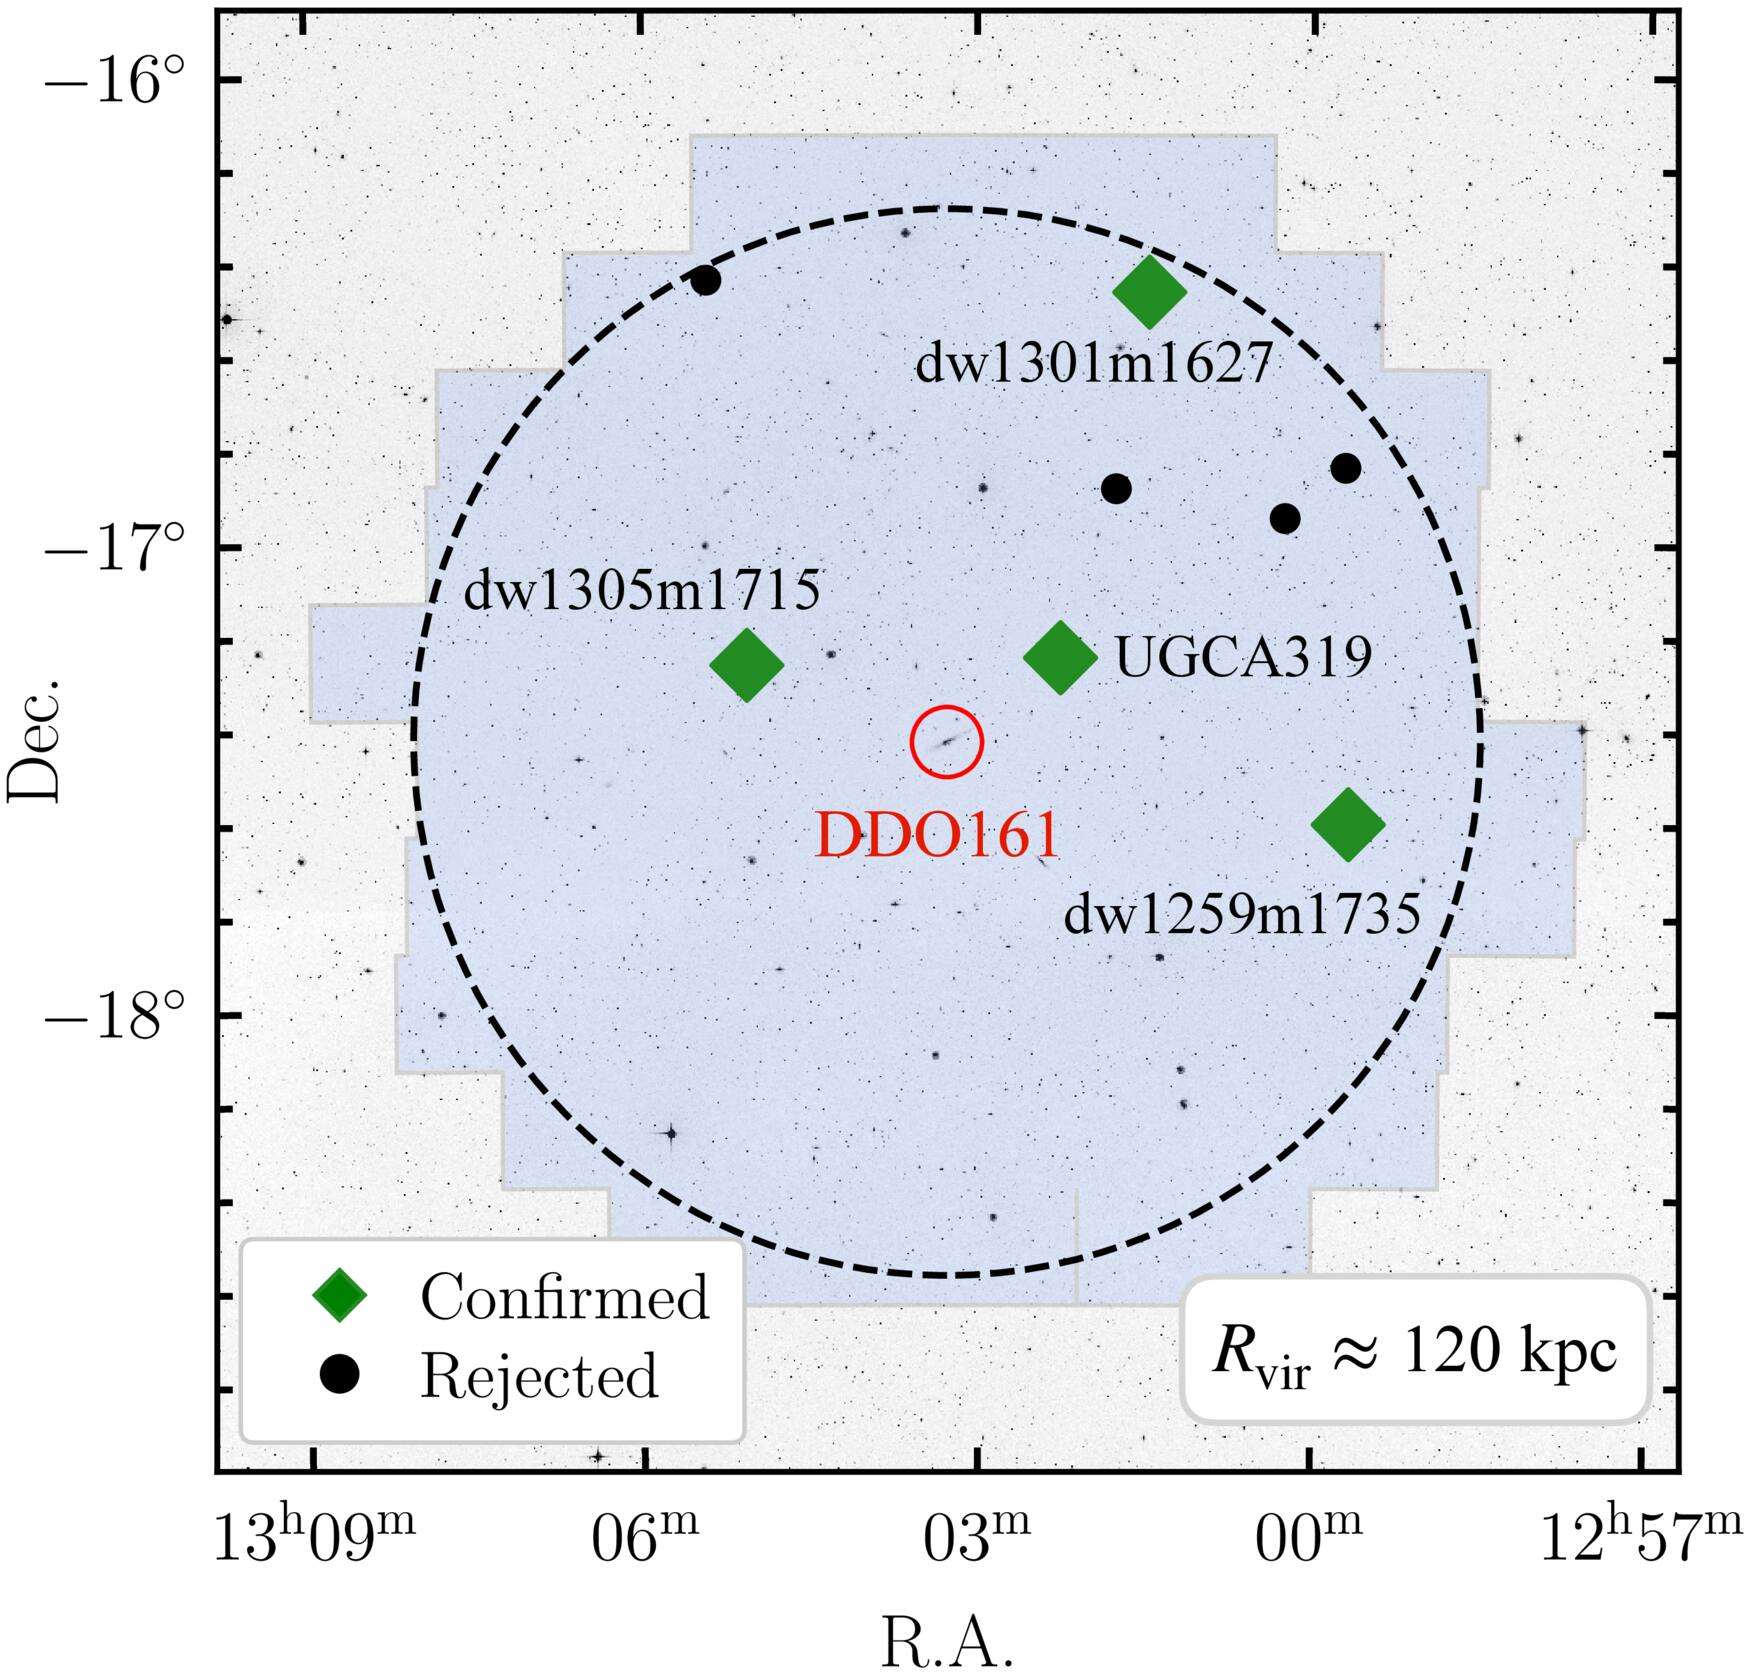
❌