❌

Normal view

El Niño Alters Marine Life in the Pacific

10 August 2026 at 05:01


june 2025
june 2026

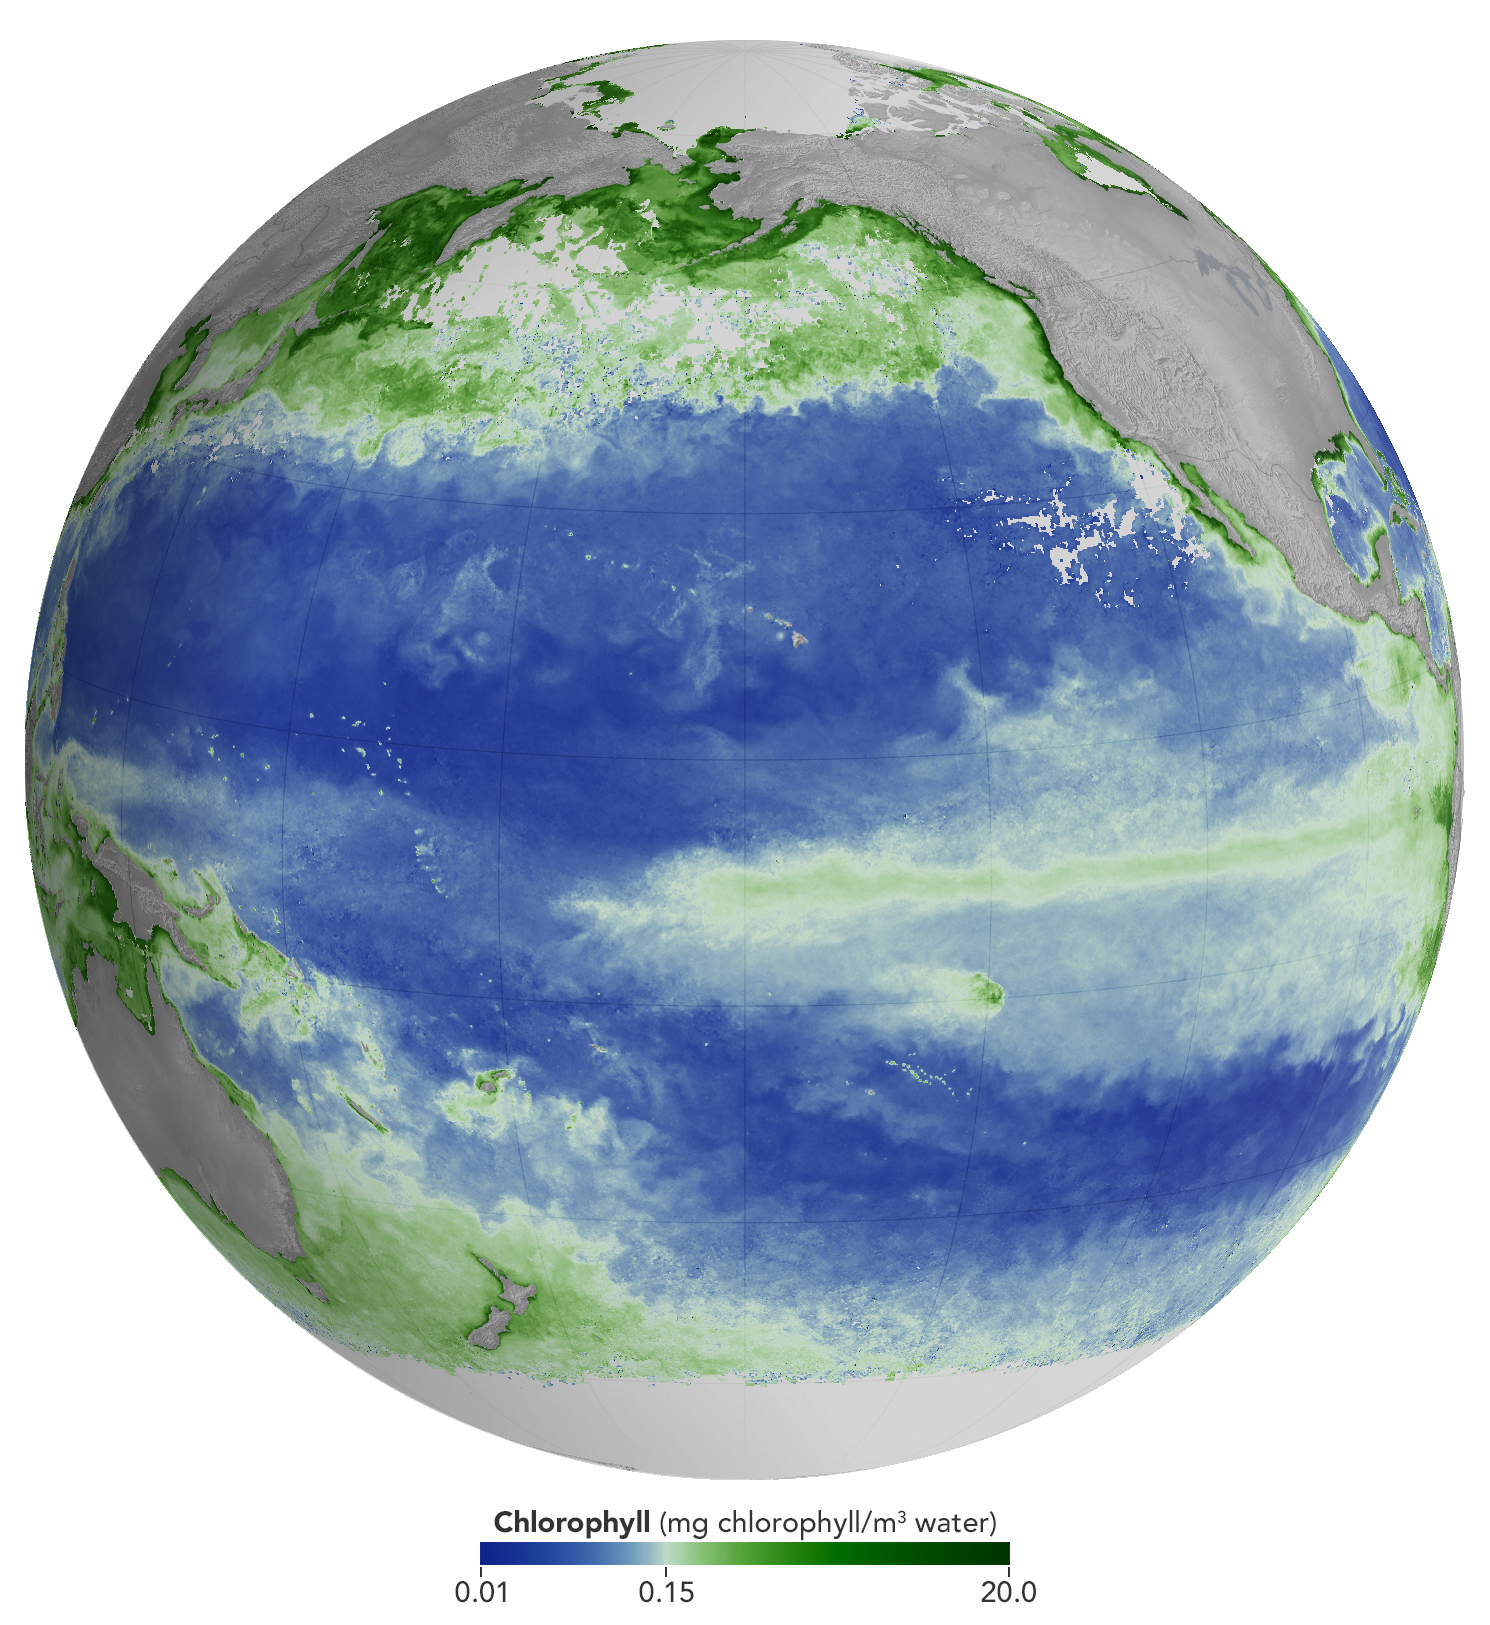
A global map centered on the Pacific Ocean shows a band of green across the equatorial region, indicating the presence of chlorophyll in surface waters.
NASA Earth Observatory/Michala Garrison

A global map centered on the Pacific Ocean shows a narrow band of green in the eastern equatorial region, indicating the presence of chlorophyll in surface waters. The central equatorial Pacific appears blue, meaning chlorophyll concentrations are low.
NASA Earth Observatory/Michala Garrison

A global map centered on the Pacific Ocean shows a band of green across the equatorial region, indicating the presence of chlorophyll in surface waters.
NASA Earth Observatory/Michala Garrison
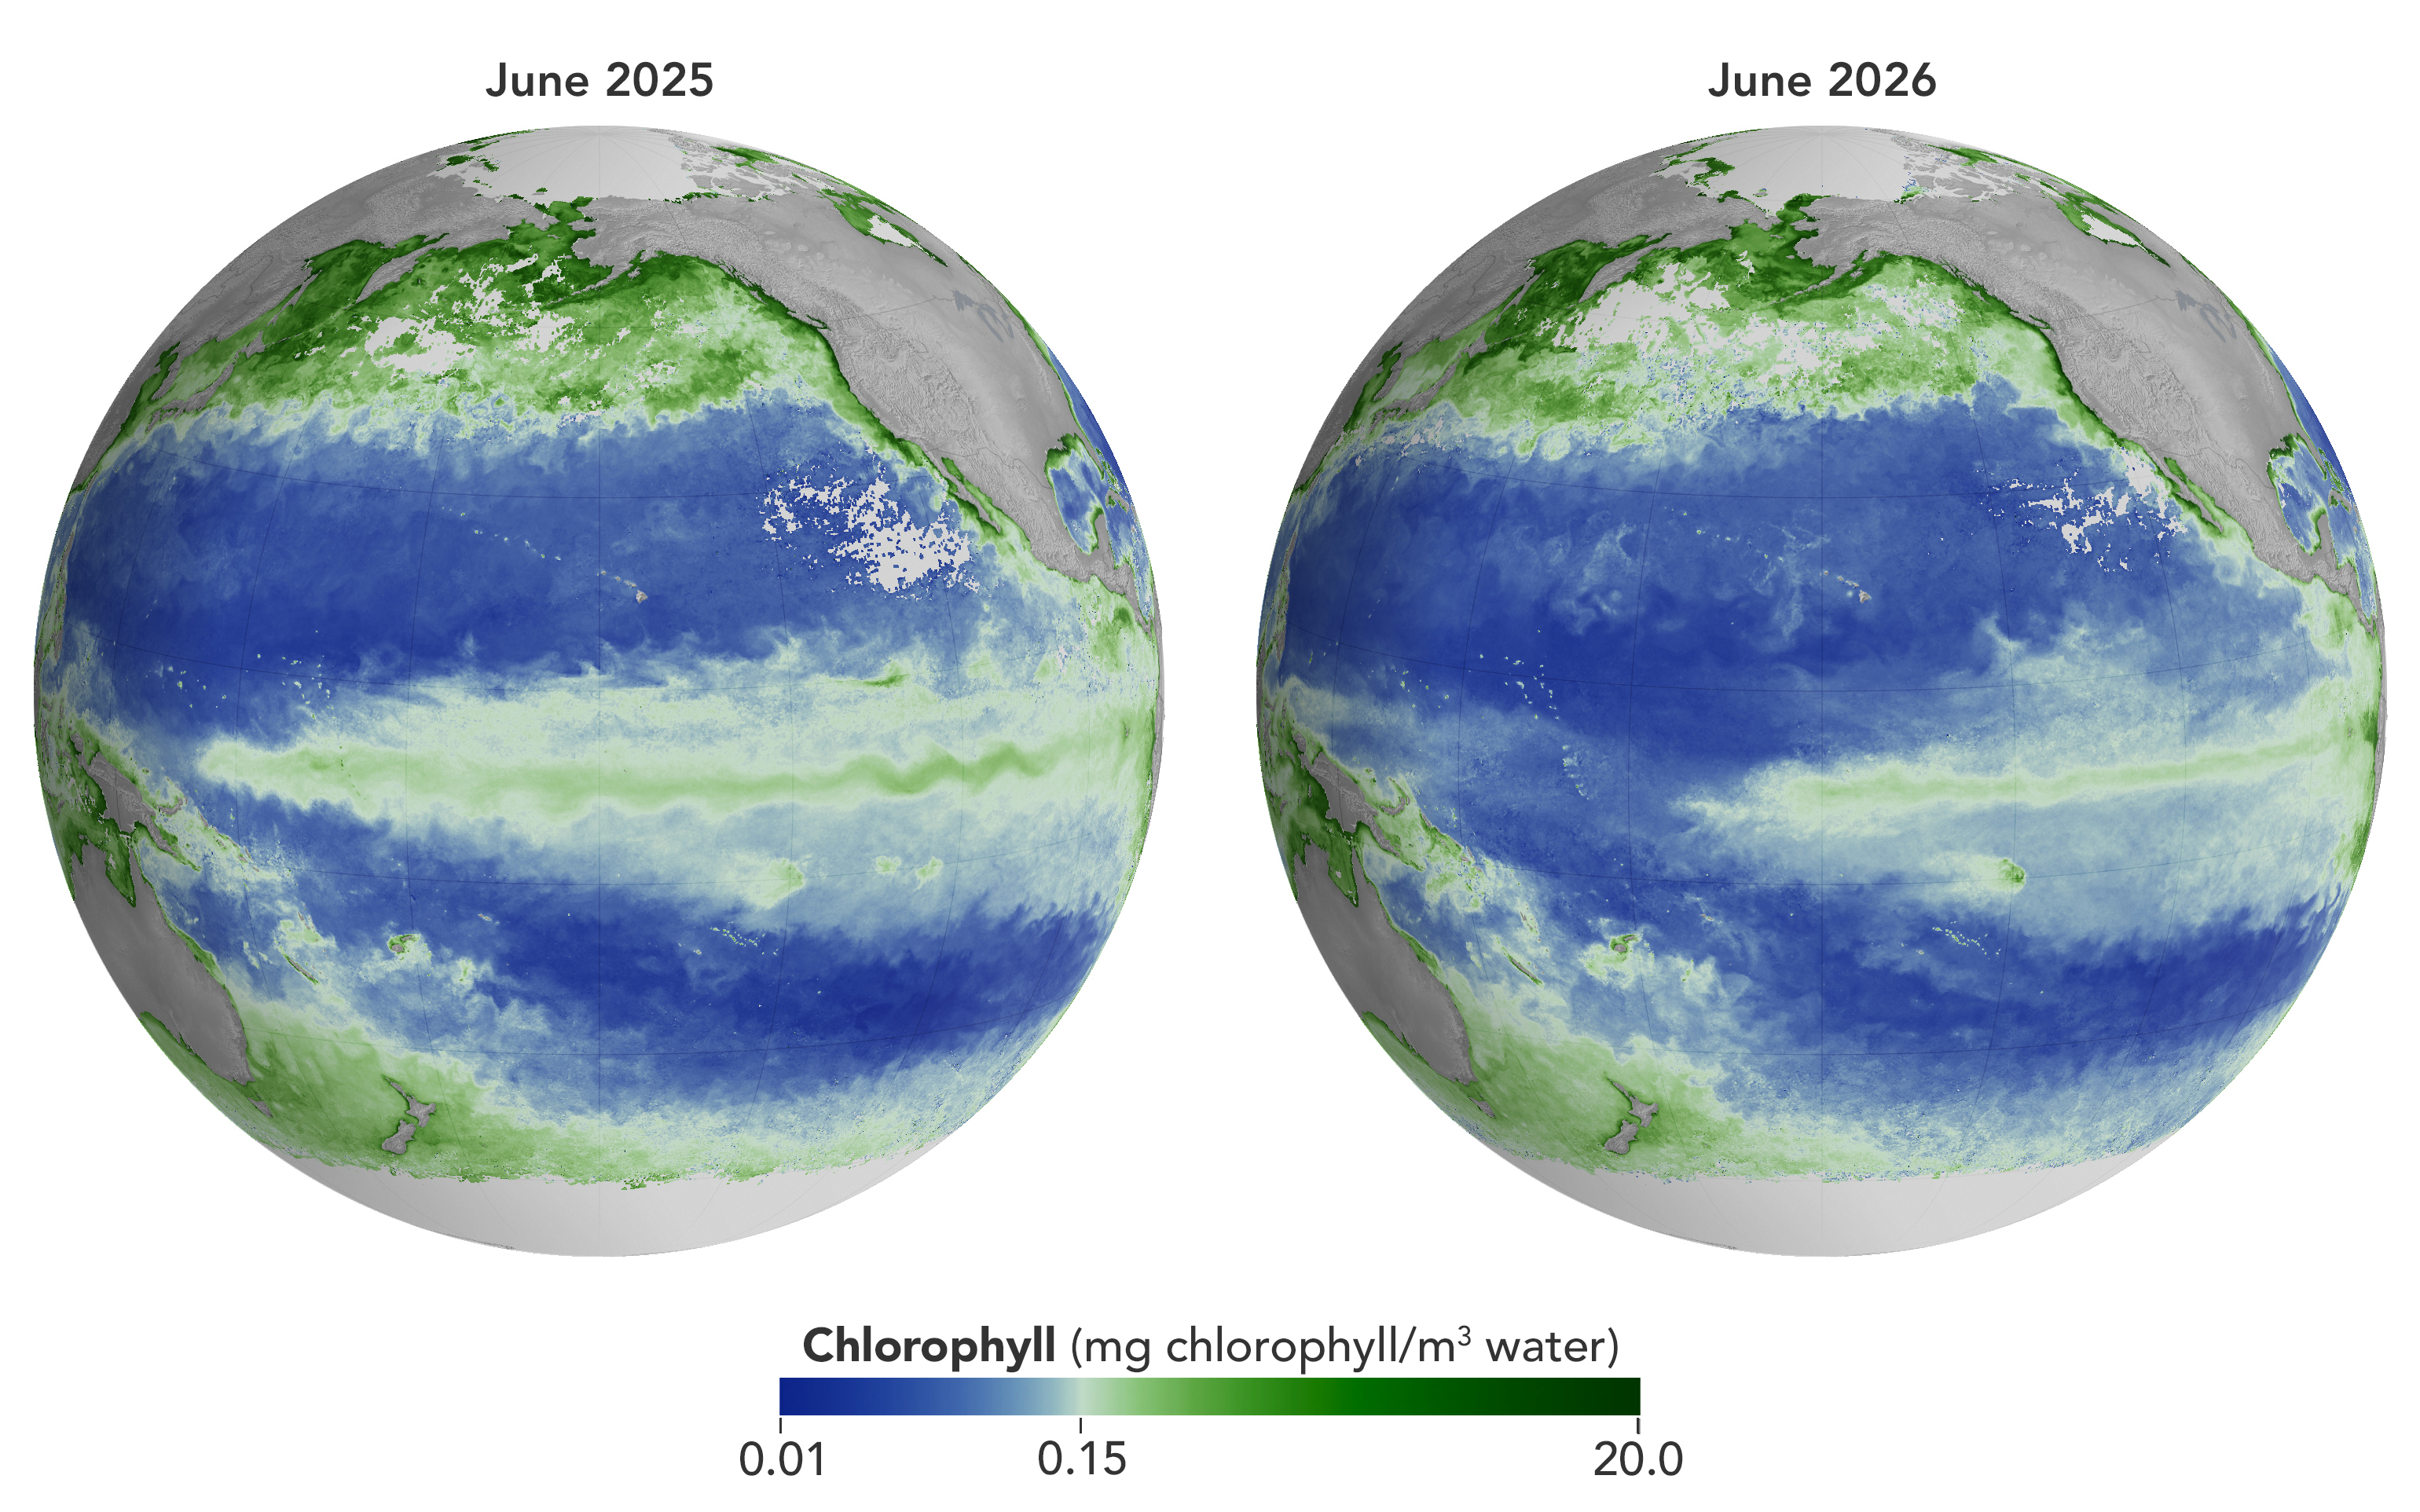
A global map centered on the Pacific Ocean shows a narrow band of green in the eastern equatorial region, indicating the presence of chlorophyll in surface waters. The central equatorial Pacific appears blue, meaning chlorophyll concentrations are low.
NASA Earth Observatory/Michala Garrison

june 2025

june 2026


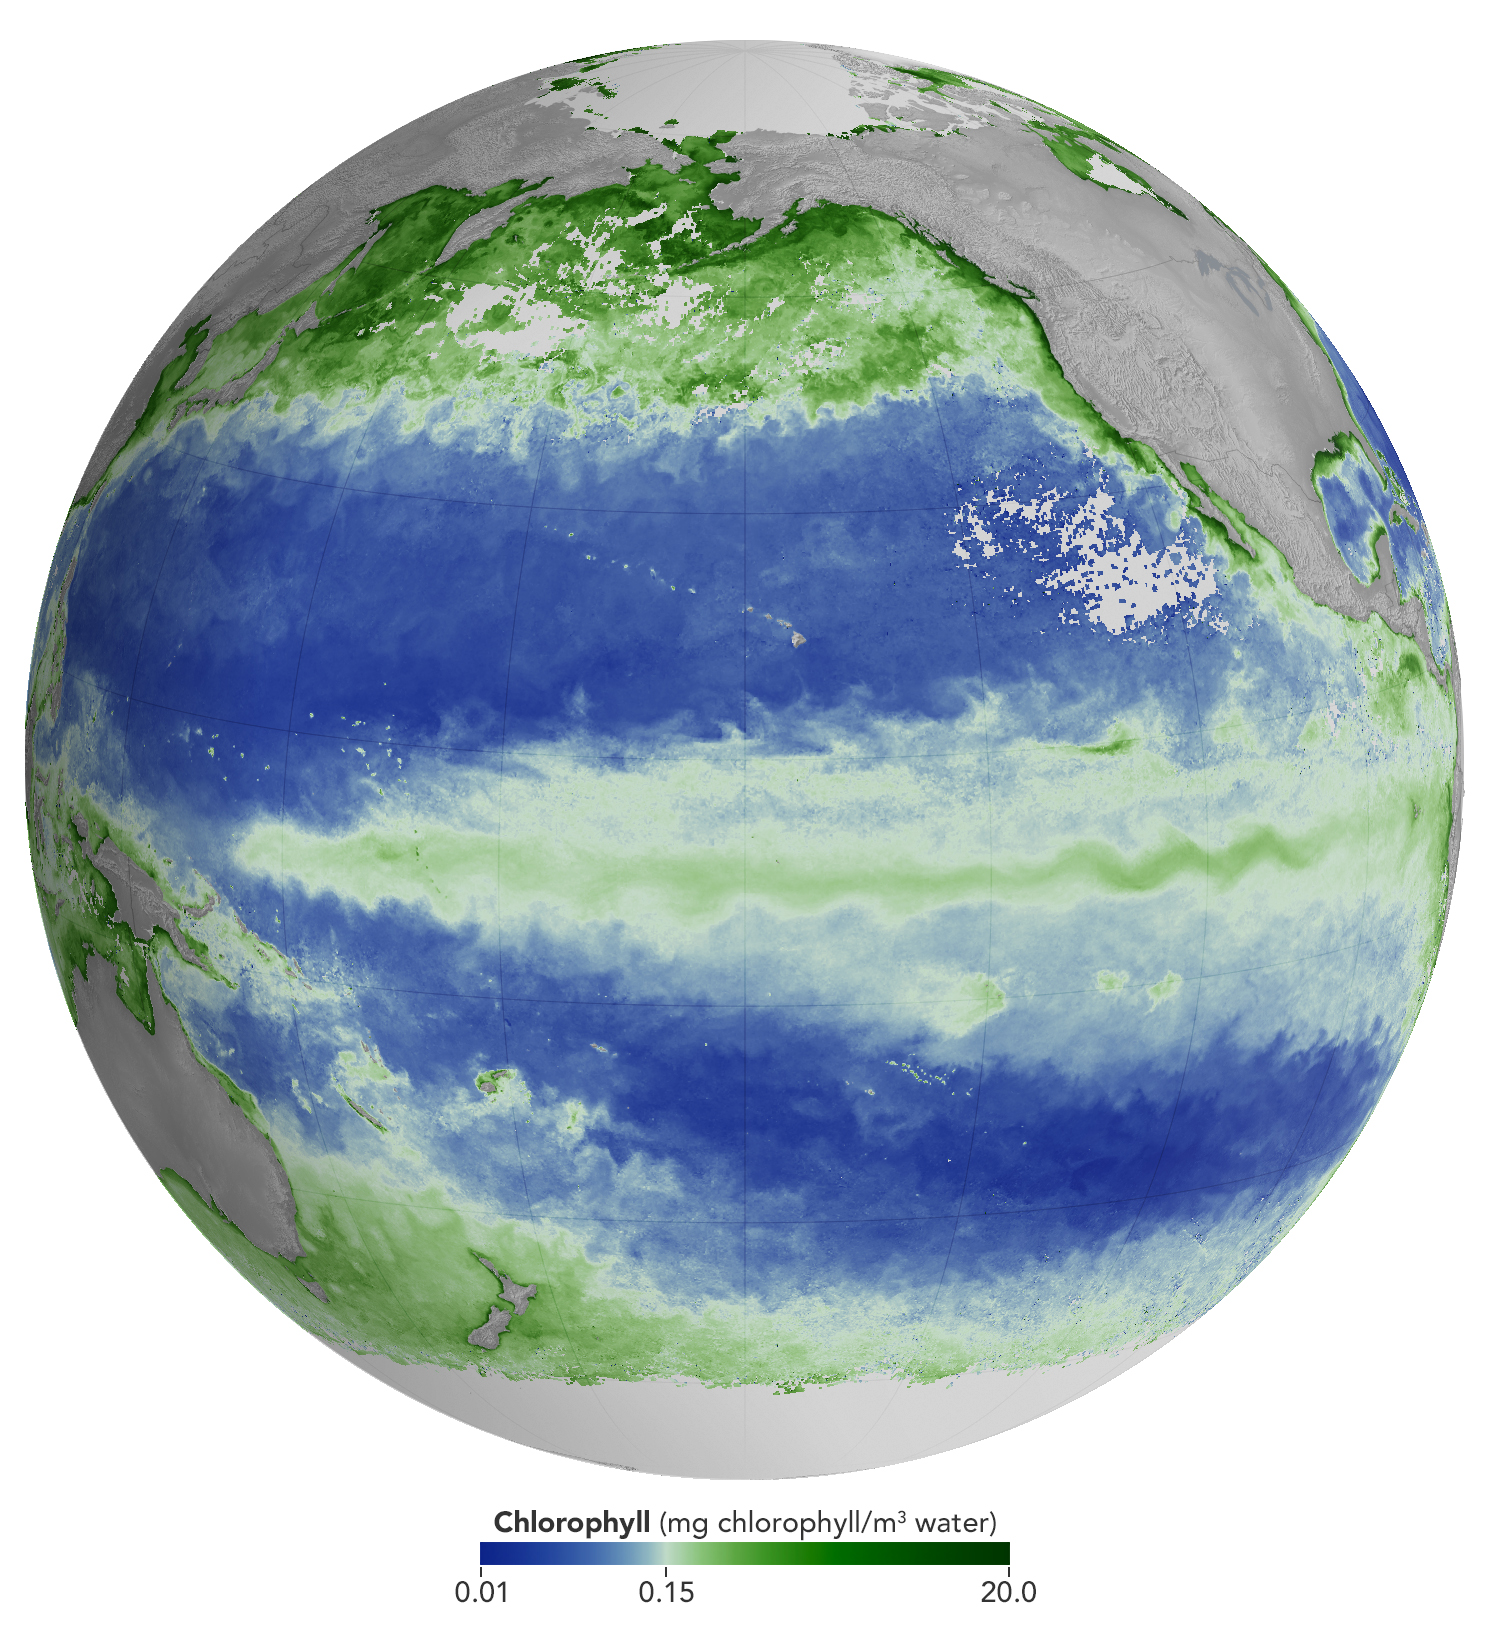
Concentrations of chlorophyll in the equatorial Pacific deviate from normal during El Niño events. These maps depict monthly average chlorophyll concentrations for June 2025 (left), under neutral conditions, and June 2026 (right), as El Niño was strengthening. Data come from the OCI (Ocean Color Instrument) on NASA’s PACE (Plankton, Aerosol, Cloud, ocean Ecosystem) satellite and are based on measurements of green and blue light from the ocean reflected back to the sensor. NASA Earth Observatory images by Michala Garrison.

As of June 2026, El Niño has officially arrived. This naturally recurring phenomenon is characterized by warmer-than-normal water temperatures in parts of the equatorial Pacific along with changes to atmospheric and oceanic circulation patterns. Its regional effects range from desert floods to delayed monsoons to shifts in where tropical cyclones are more likely to form.

NOAA’s Climate Prediction Center expects the current El Niño to continue to strengthen through the end of 2026, with a 97 percent chance of lasting through early Northern Hemisphere spring 2027. Even during El Niño’s early stages, satellites have observed characteristic changes along the equatorial Pacific, such as warmer-than-normal sea surface temperatures and higher-than-normal sea surface height.

Among the first ecological downstream effects are changes to the marine food web. The maps above show chlorophyll-a concentrations—the pigment present in most phytoplankton—as observed by the OCI (Ocean Color Instrument) on NASA’s PACE (Plankton, Aerosol, Cloud, ocean Ecosystem) satellite. In June 2025 (left), conditions were neutral, while in June 2026 (right), El Niño was strengthening.

The most noticeable difference appears in the central Pacific, around the equator due north of New Zealand: chlorophyll concentrations, an indication of phytoplankton abundance, are substantially lower in 2026. This change is expected, said Matthew Kehrli and Graham Trolley, oceanographers in the Ocean Ecology Laboratory at NASA’s Goddard Space Flight Center. That’s because during an El Niño, easterly equatorial trade winds weaken, the warm surface layer of the ocean extends deeper, and the upwelling of cool, nutrient-rich water that typically fuels phytoplankton growth is suppressed.  

As the El Niño progresses, the scientists anticipate the differences in the central Pacific will become more pronounced. “This may manifest as a greater difference in values across the current region, as a broadening region of reduced surface chlorophyll-a concentration, or both, depending on the behavior of the equatorial trade winds,” they said.

Reductions in phytoplankton have ripple effects through the marine food web, including in coastal regions. Less food is available for zooplankton, as well as for fish, seabirds, and marine mammals. Peru’s anchovy fisheries have seen profound declines in catch during past El Niños, driven similarly by warmer surface waters, reduced upwelling, and lower phytoplankton abundance. In 2026, Peru’s Ministry of Production repeatedly suspended the fishery to safeguard the country’s main fishing resource. Pelicans have been seen venturing into Peruvian ports and urban areas in search of food.

Although the disruptions to marine life can be severe, a post-El Niño “chlorophyll rebound,” with higher-than-normal concentrations in the equatorial Pacific, can occur. Research suggests that higher iron concentrations delivered in ocean currents, as well as dust arriving from drier land in parts of Central and South America, help fuel the resurgence—a rebound that doesn’t require a follow-on La Niña. La Niña, which often follows El Niño events, can also produce elevated chlorophyll concentrations. A strong La Niña in 1998–1999 set off a large phytoplankton bloom in the eastern Pacific and a dramatic increase in fish populations.

Scientists have new tools available for studying this sort of variability. The PACE mission launched in February 2024, making this the first complete El Niño event for which the satellite will gather global, near-daily hyperspectral measurements. “The scientific community will be able to observe the 2026 El Niño with data across more wavelengths of light than ever before,” Kehrli and Trolley said.

To better understand effects on life in the ocean, researchers hope to use PACE data to gauge the responses of specific phytoplankton communities to El Niño. And the possibilities extend beyond the marine realm, the scientists note. PACE’s sensors can measure plant pigment composition on land and clouds and aerosols in the atmosphere, all of which are influenced by El Niño.

NASA Earth Observatory images by Michala Garrison, using PACE data from the NASA Ocean Biology Distributed Active Archive Center OB.DAAC and processed by Matthew Kehrli. Story by Lindsey Doermann.

Downloads

A global map centered on the Pacific Ocean shows a band of green across the equatorial region, indicating the presence of chlorophyll in surface waters.

June 2025

JPEG (1.40 MB)

A global map centered on the Pacific Ocean shows a narrow band of green in the eastern equatorial region, indicating the presence of chlorophyll in surface waters. The central equatorial Pacific appears blue, meaning chlorophyll concentrations are low.

June 2026

JPEG (1.37 MB)

A global map centered on the Pacific Ocean shows a narrow band of green in the eastern equatorial region, indicating the presence of chlorophyll in surface waters. The central equatorial Pacific appears blue, meaning chlorophyll concentrations are low.

June 2025 + June 2026

JPEG (2.85 MB)

References & Resources

You may also be interested in:

Stay up-to-date with the latest content from NASA as we explore the universe and discover more about our home planet.

El Niño Is Underway

4 min read

Satellite observations of sea surface height indicated that the 2026 event continued to strengthen in early June.

Article

Color Off the Mid-Atlantic Coast

4 min read

Something is brewing in shallow waters offshore of Delaware, New Jersey, Maryland, and Virginia.

Article

Sizing Up the Sargassum Belt

6 min read

Seaweed composing the Great Atlantic Sargassum Belt hit near-record levels in June 2026, with the Caribbean Sea and Gulf of…

Article

Sizing Up the Sargassum Belt

29 July 2026 at 05:00
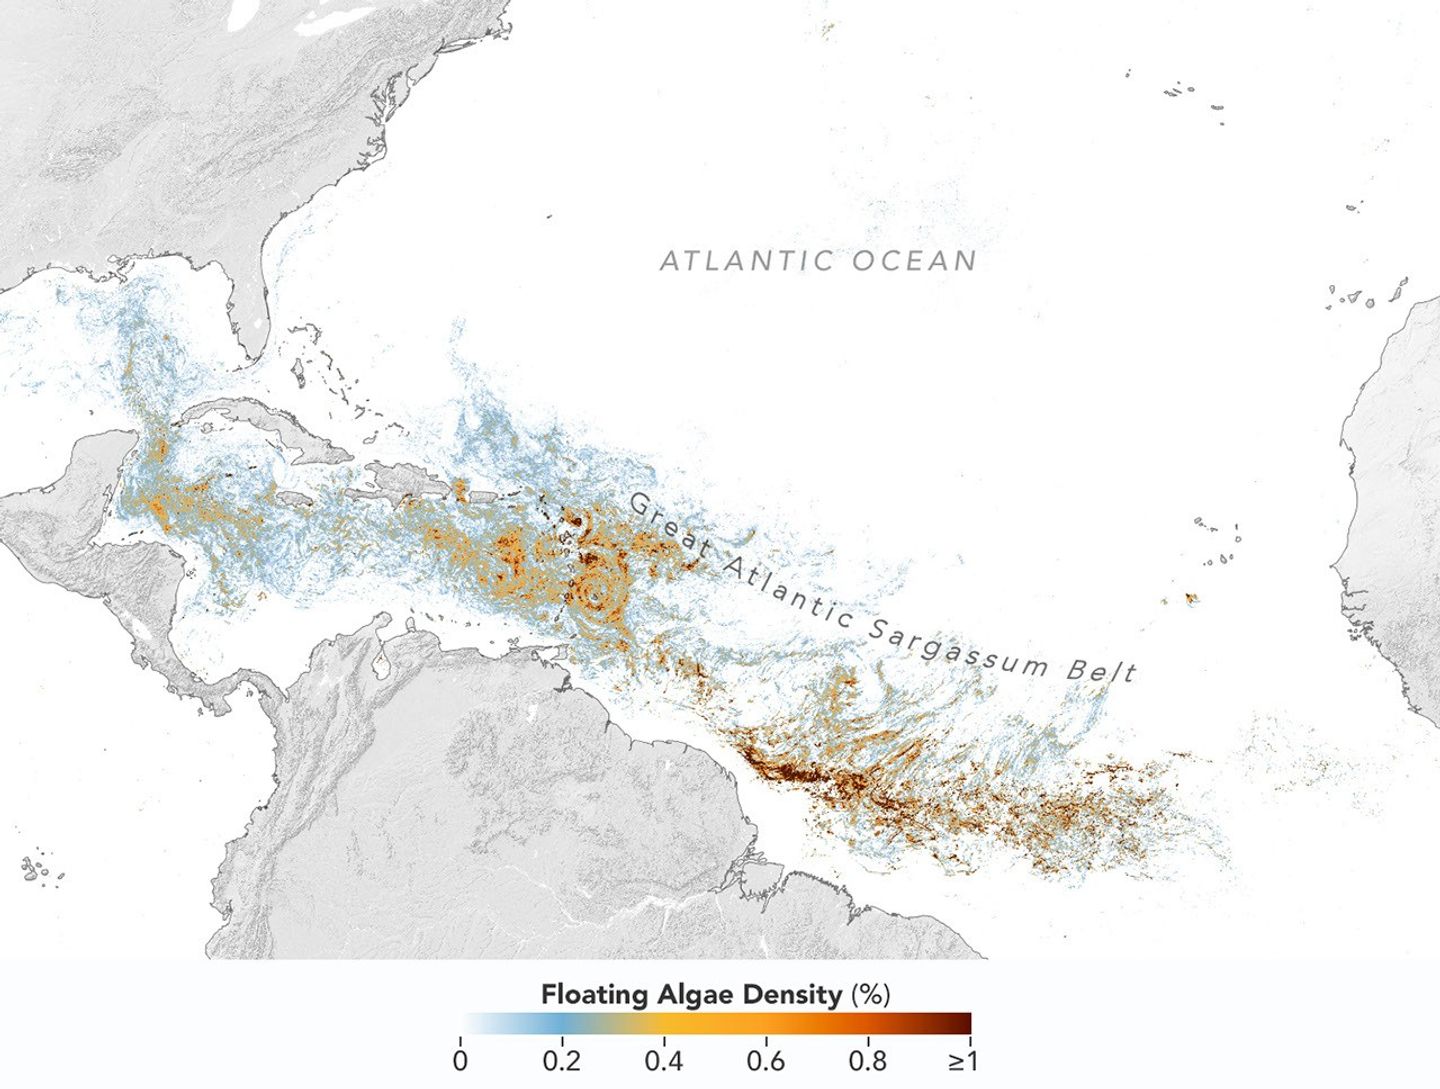
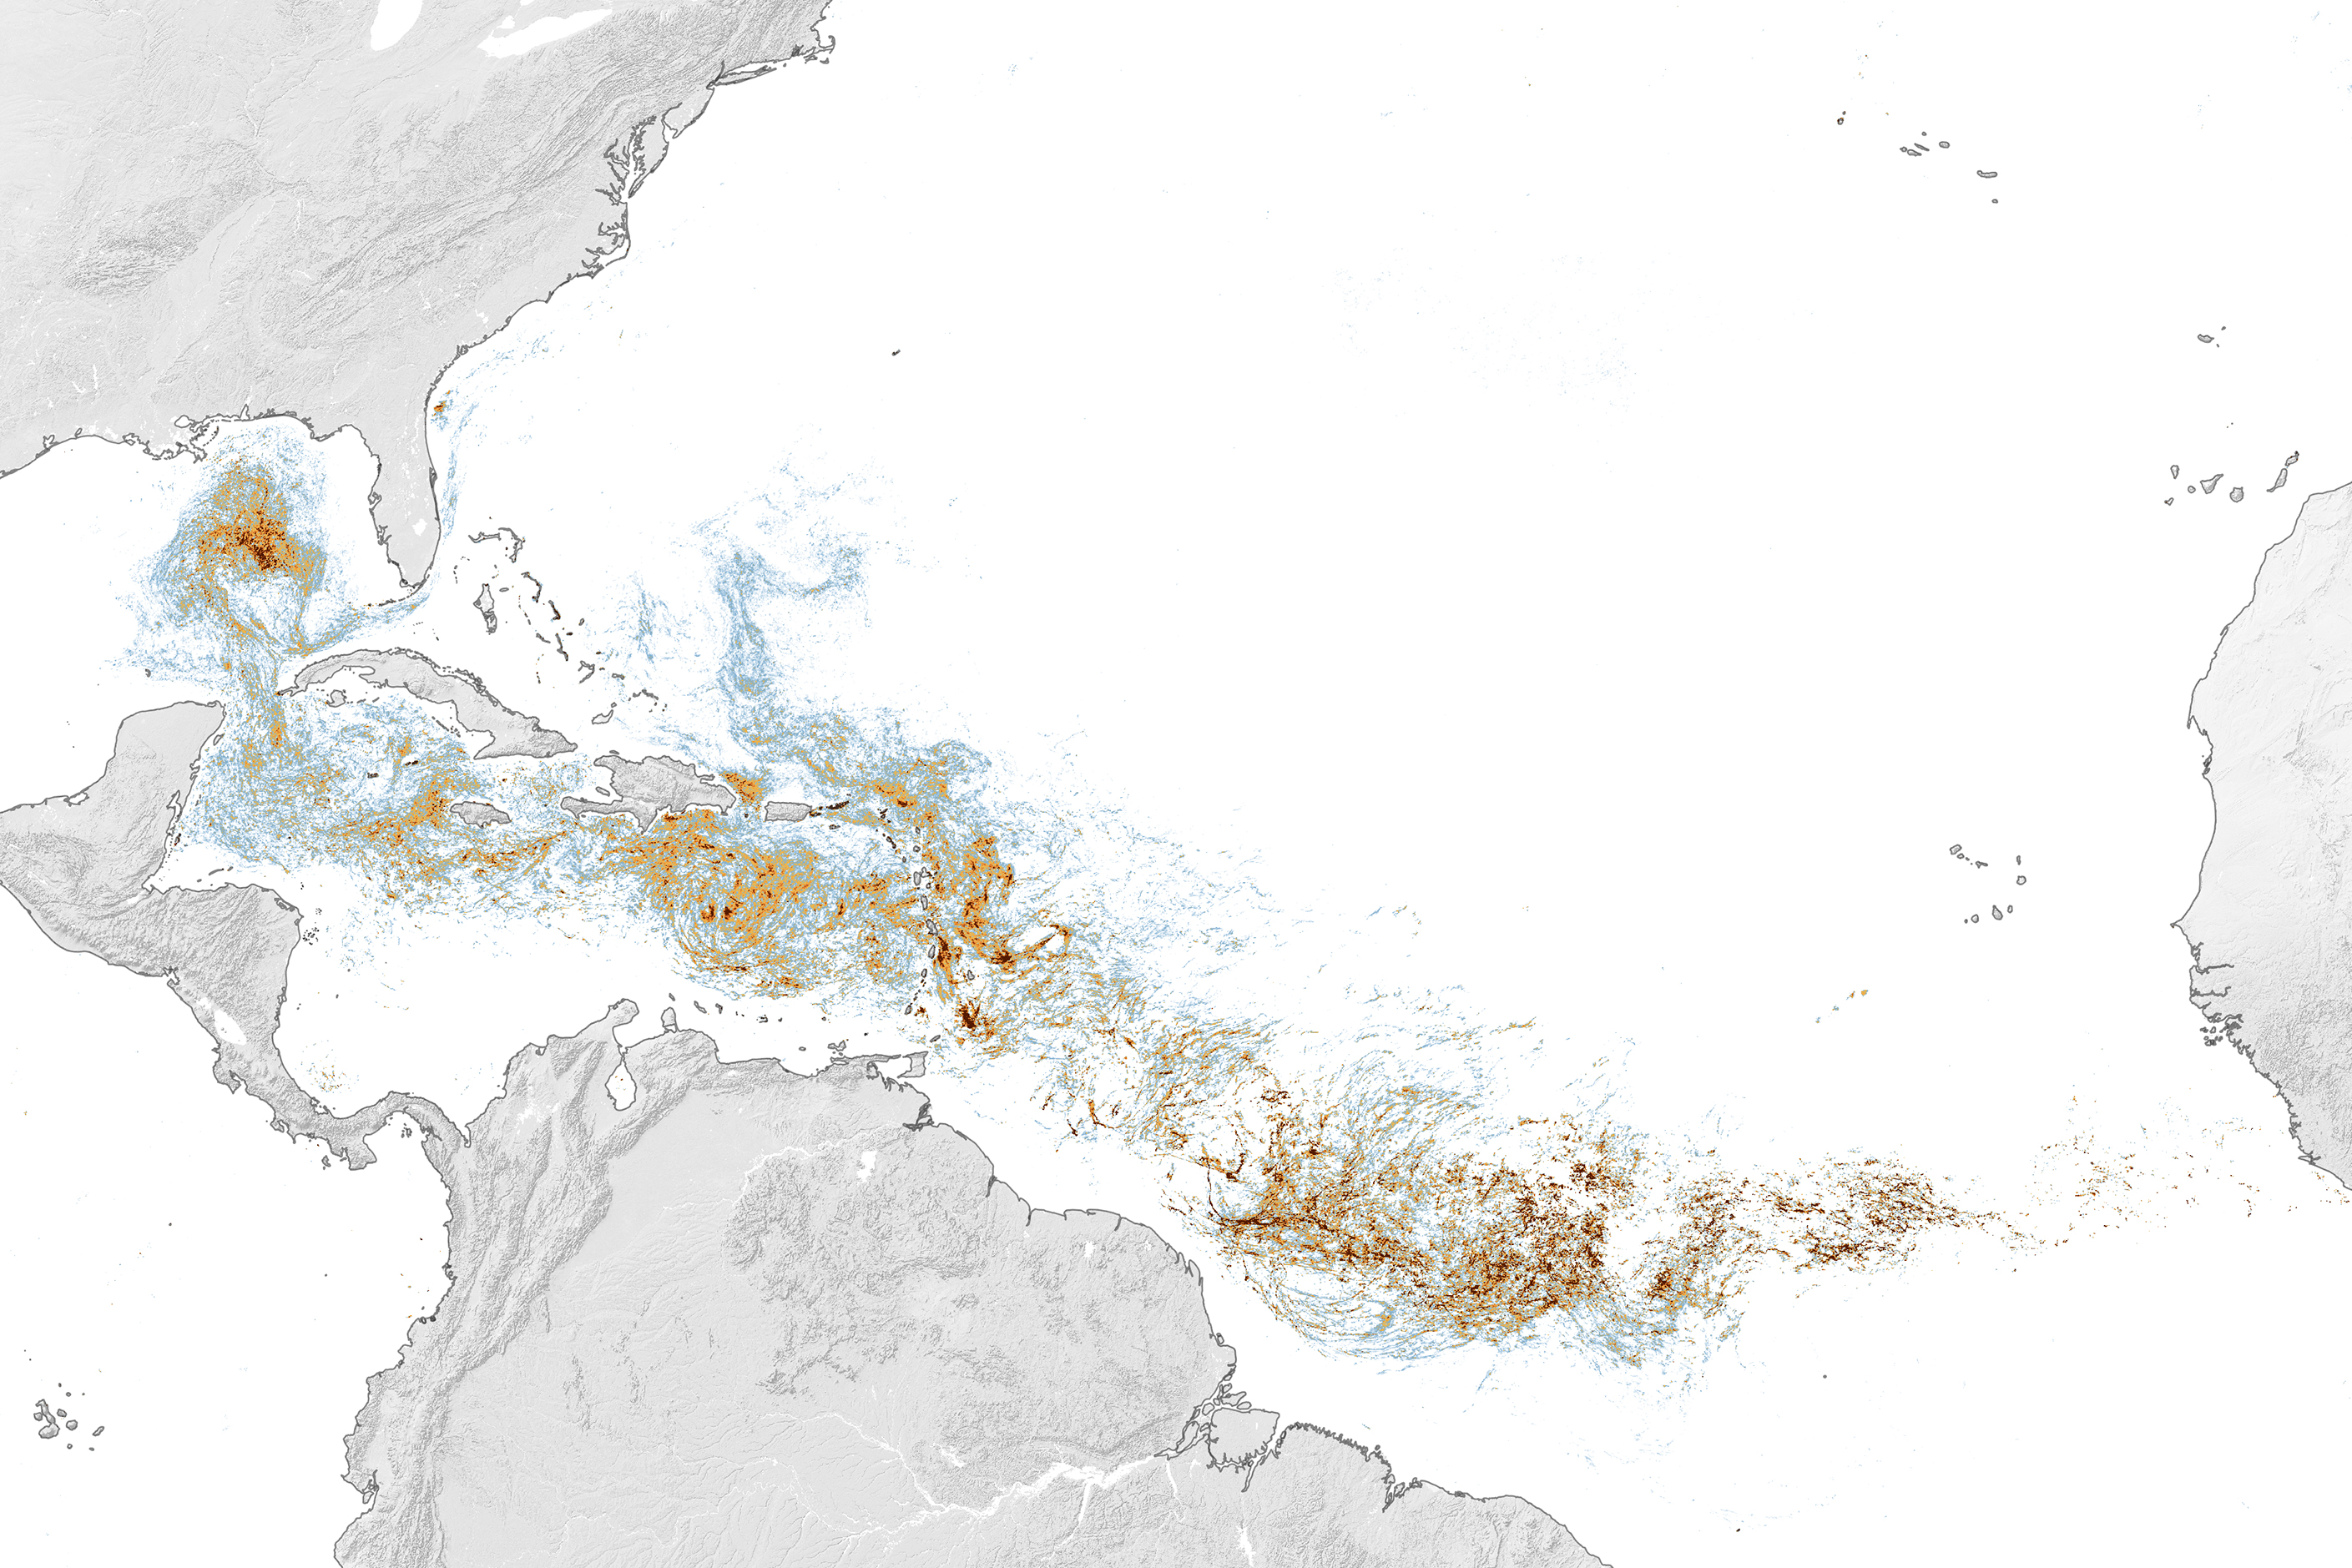
Map of the Atlantic Ocean showing Sargassum density from low (blue) to high (red) in June 2026, with the highest concentrations in the tropical Atlantic.
This map, based on data from the OCI (Ocean Color Instrument) on NASA’s PACE (Plankton, Aerosol, Cloud, ocean Ecosystem) satellite, shows Sargassum highly concentrated in the tropical Atlantic in June 2026.
NASA Earth Observatory/Lauren Dauphin

Sargassum, a type of brown floating algae, has shifted its range in recent decades, thinning out in the North Atlantic’s Sargasso Sea while proliferating in the tropical Atlantic. That trend, underway since 2011, continued in 2026 as the algae, commonly known as a type of seaweed, reached its annual peak in June across a stretch of ocean known as the Great Atlantic Sargassum Belt.

The belt’s Sargassum abundance in June 2026 made it the second-highest Sargassum year in the satellite record, slightly behind 2025, according to scientists at the University of South Florida (USF) College of Marine Science. Regionally, the Caribbean Sea and the Gulf of America (Gulf of Mexico) both hit record highs, according to USF’s June 2026 Sargassum outlook. The western and eastern Caribbean saw 3.6 and 9 million metric tons, respectively, while the Gulf saw 5 million metric tons—nearly double its previous record, also set in 2025. 

“The belt is a basin-scale phenomenon that can have devastating local-scale impacts throughout the Caribbean and Gulf, and satellite observations are the only method that captures both scales on a daily basis,” said Brian Barnes, a marine scientist at the Optical Oceanography Laboratory at USF. “The tracking done by our lab helps communities know the current extent of Sargassum and prepare for what’s to come.”

In moderate amounts in the open ocean, Sargassum provides habitat for turtles, invertebrates, fish, and birds, and adds oxygen to the water through photosynthesis. But too much of it near shore can tangle and suffocate marine life, and mats that sink can smother corals and seagrasses. On beaches, decomposing Sargassum releases hydrogen sulfide, a rotten-egg-smelling gas that’s a potential problem for both ecosystems and tourism.

The map above shows Sargassum density in the tropical Atlantic Ocean in June 2026. Red and orange areas are where Sargassum densities were the highest. Note that although the “belt” appears continuous, discrete Sargassum mats are scattered across the ocean surface. The map is based on satellite measurements of how much of the ocean surface was covered by the seaweed, averaged per pixel across all observations made in June by the OCI (Ocean Color Instrument) on NASA’s PACE (Plankton, Aerosol, Cloud, ocean Ecosystem) satellite.

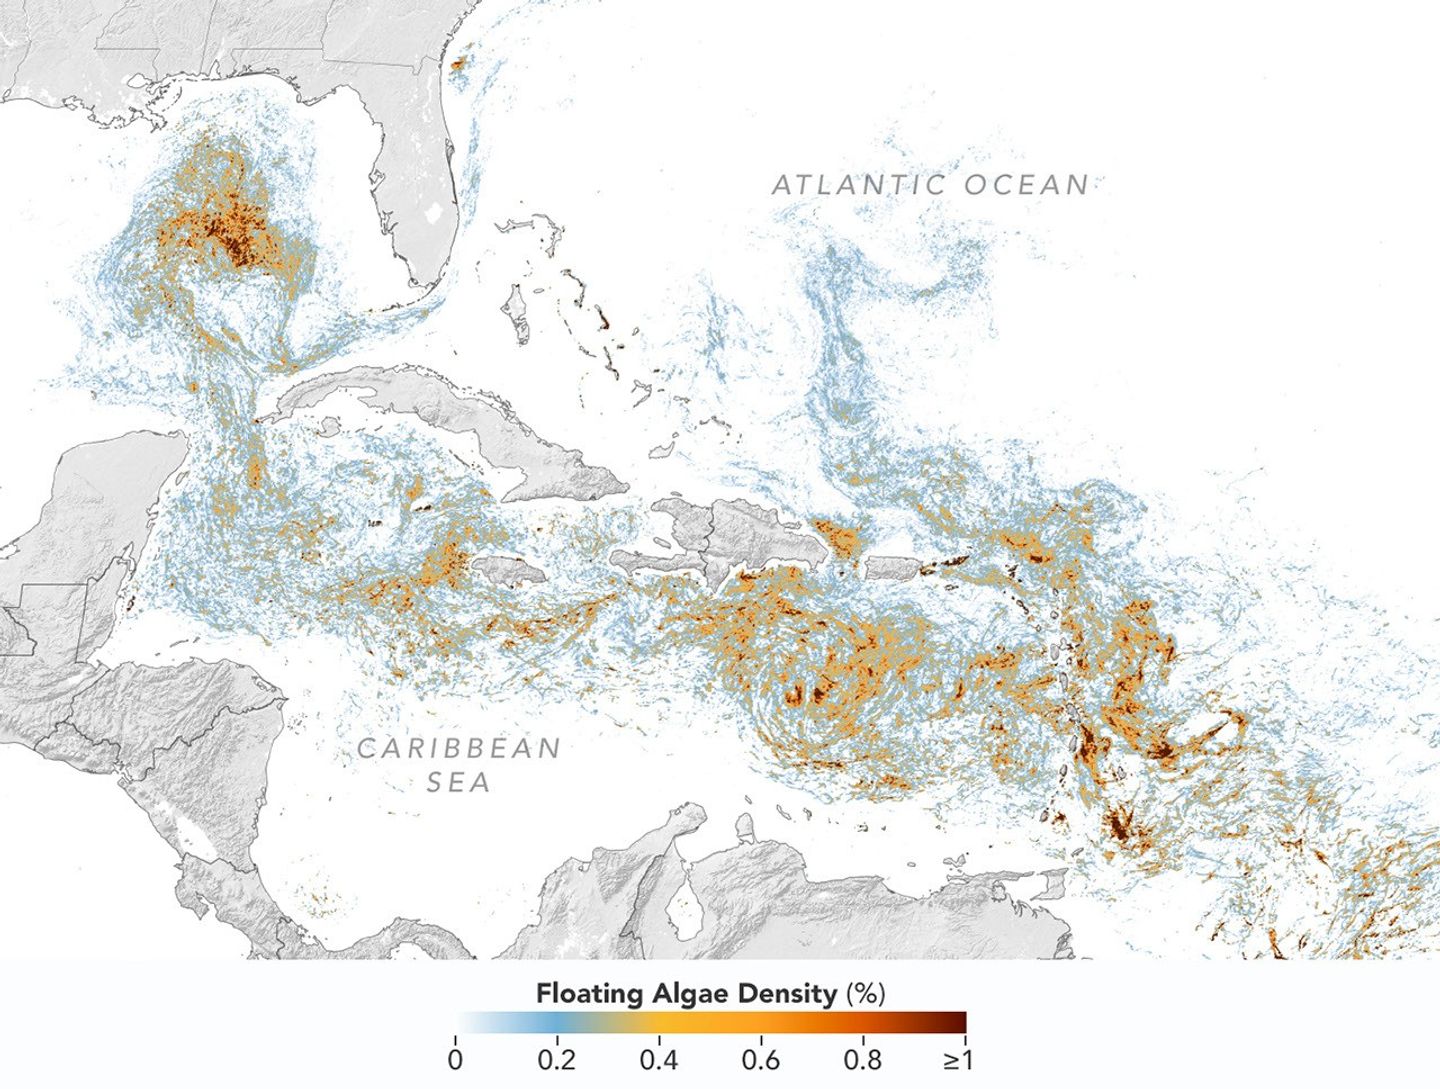
A detailed map of the Atlantic Ocean centered on the Caribbean Sea shows Sargassum density from low (blue) to high (red) in June 2026.
This detailed view of the same PACE OCI map highlights Sargassum concentrations across the Caribbean Sea and Gulf of America, both of which saw record-high amounts of the floating algae in June 2026.
NASA Earth Observatory/Lauren Dauphin

Ocean currents and winds shape the Sargassum belt, which, despite the patchiness, stretches nearly continuously from West Africa to the Gulf and holds a fairly steady “width” from the western tropical Atlantic westward, explained Chuanmin Hu, also an optical oceanographer at USF. The ocean currents have also spared Florida’s west coast from inundation this summer, while delivering large amounts of seaweed to the Florida Keys and the state’s east coast. The bulk of the Sargassum, however, is visible in the Caribbean Sea, shown in detail above, where problems associated with inundation have been more severe, Hu said.

Data for the maps were provided by Lin Qi, an oceanographer at NOAA’s Center for Satellite Applications and Research, who has been working to generate Sargassum maps based on data from PACE, which was launched in February 2024. The work extends that of Qi and colleagues at USF’s Optical Oceanography Laboratory. This team first developed Sargassum detection techniques using MODIS (Moderate Resolution Imaging Spectroradiometer) on NASA’s long-running Terra and Aqua satellites and VIIRS (Visible Infrared Imaging Radiometer Suite) on the NOAA-20 satellite—data that have been a key component of USF’s Sargassum Watch System and of research into the seaweed’s longer-term trends.

Satellites detect Sargassum by its signals in reflected sunlight. Because of its plant structure and chlorophyll pigments, Sargassum reflects more near-infrared light than water. Scientists flag pixels where the reflectance spikes above the levels produced by plain seawater, and then they use the strength of this spike to estimate Sargassum density, which refers to the fraction of ocean surface covered by the seaweed in each pixel. Density estimates can then be converted into biomass, or the total weight of Sargassum present within a pixel, which is how the longer-term trends in the chart below are tracked.

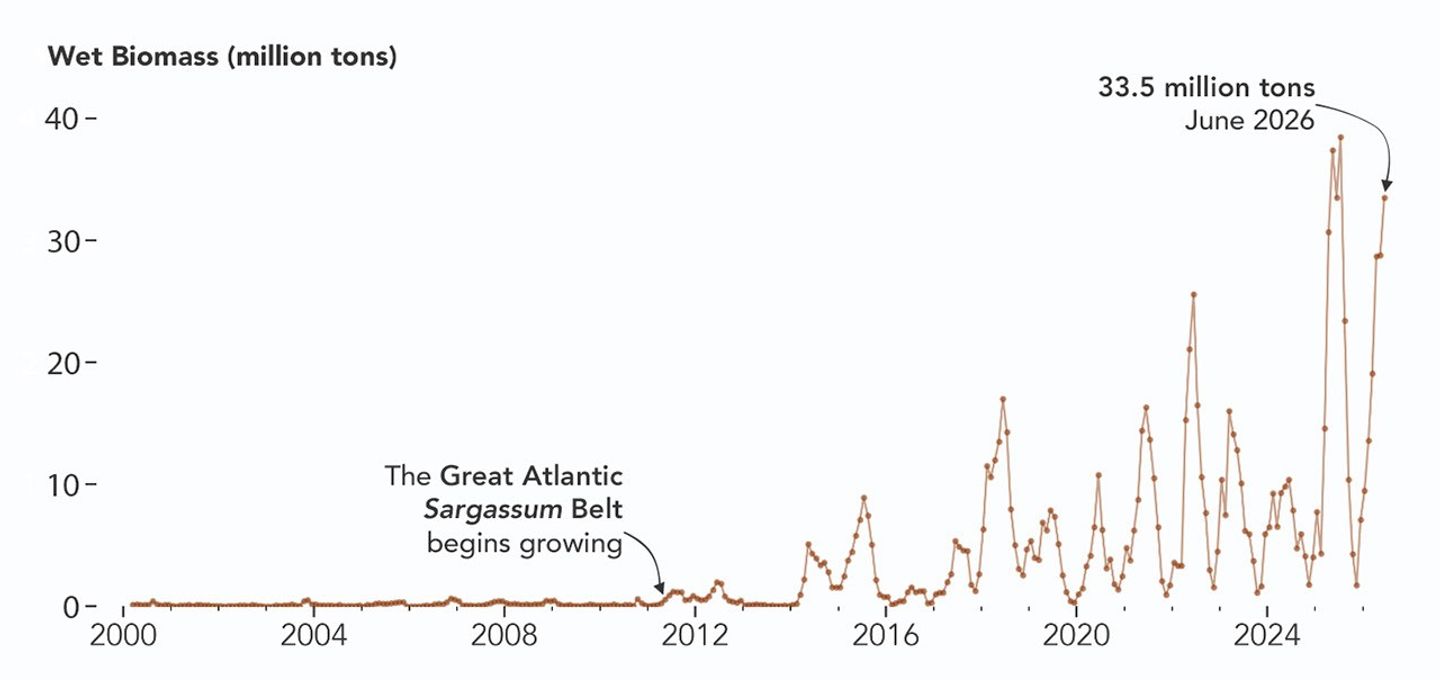
A chart of Sargassum biomass detected by MODIS since the early 2000s, showing amounts increasing beginning in 2011, with progressively higher spikes through summer 2025 and 2026.
NASA Earth Observatory/Lauren Dauphin

The chart above uses the continuous MODIS record since March 2000 to show how Sargassum biomass across the Great Atlantic Sargassum Belt has changed through June 2026. Notice the uptick beginning around 2011, when the belt was first developing, and the seasonal dips in winter and peaks in spring and summer. The record high in July 2025 stands out, followed by the quick rise in early 2026—especially in the first four months of the year—that culminated in the year’s peak in June. More recent observations, not yet reflected in the chart, indicate Sargassum biomass declined through the following month of July.

“Since the initial appearance of the Great Atlantic Sargassum Belt in 2011, the total Sargassum amount in the Atlantic Ocean has increased substantially, more than doubling every five years,” Hu said. He added that the exact mechanism is still being investigated, but it’s possibly related to ocean warming, multiple nutrient sources, and the fact that large Sargassum mats attract other organisms—such as nitrogen-fixing bacteria—that can supply additional nutrients to sustain further growth.

Alongside data from MODIS and VIIRS, OCI data from PACE now feeds into the Sargassum Watch System’s near-real-time daily and weekly composite maps. A recent study of the central-west Atlantic led by Qi, spanning May through August 2024, found that OCI offers several advantages over its predecessors, observing more of the ocean and detecting Sargassum with greater sensitivity.  

Hu noted that the added pixels from OCI can improve near-real-time monitoring and analyses of short-term fluctuations. And its higher sensitivity, he said, will also lead to improved maps during winter months, “thus helping understand Sargassum changes over time.”

Additionally, the study’s authors found that OCI’s hyperspectral capability makes it the only sensor able to spectrally discriminate Sargassum pixels across the Atlantic Ocean “without ambiguity,” adding confidence to the interpretation of detected image features—especially in parts of the Atlantic where another type of floating algae, Trichodesmium, has been reported.

“I think I can speak for all project members, past and present, in sharing how rewarding it is to see the promise of PACE’s advancements come to life,” said Jeremy Werdell, PACE project scientist at NASA’s Goddard Space Flight Center. “OCI has started a true renaissance in aquatic ecosystem monitoring from space.”

NASA Earth Observatory maps and chart by Lauren Dauphin, using PACE and MODIS data courtesy of Lin Qi (NOAA), and Brian Barnes and Chuanmin Hu (University of South Florida, Optical Oceanography Laboratory). Story by Kathryn Hansen.

Downloads

Map of the Atlantic Ocean showing Sargassum density from low (blue) to high (red) in June 2026, with the highest concentrations in the tropical Atlantic.

June 2026

JPEG (2.43 MB)

References & Resources

You may also be interested in:

Stay up-to-date with the latest content from NASA as we explore the universe and discover more about our home planet.

Color Off the Mid-Atlantic Coast

4 min read

Something is brewing in shallow waters offshore of Delaware, New Jersey, Maryland, and Virginia.

Article

A Turquoise Tint for the Black Sea

3 min read

Phytoplankton added a milky blue hue to the waters of the Black Sea and nearby waterways in spring and summer…

Article

El Niño Is Underway

4 min read

Satellite observations of sea surface height indicated that the 2026 event continued to strengthen in early June.

Article
❌