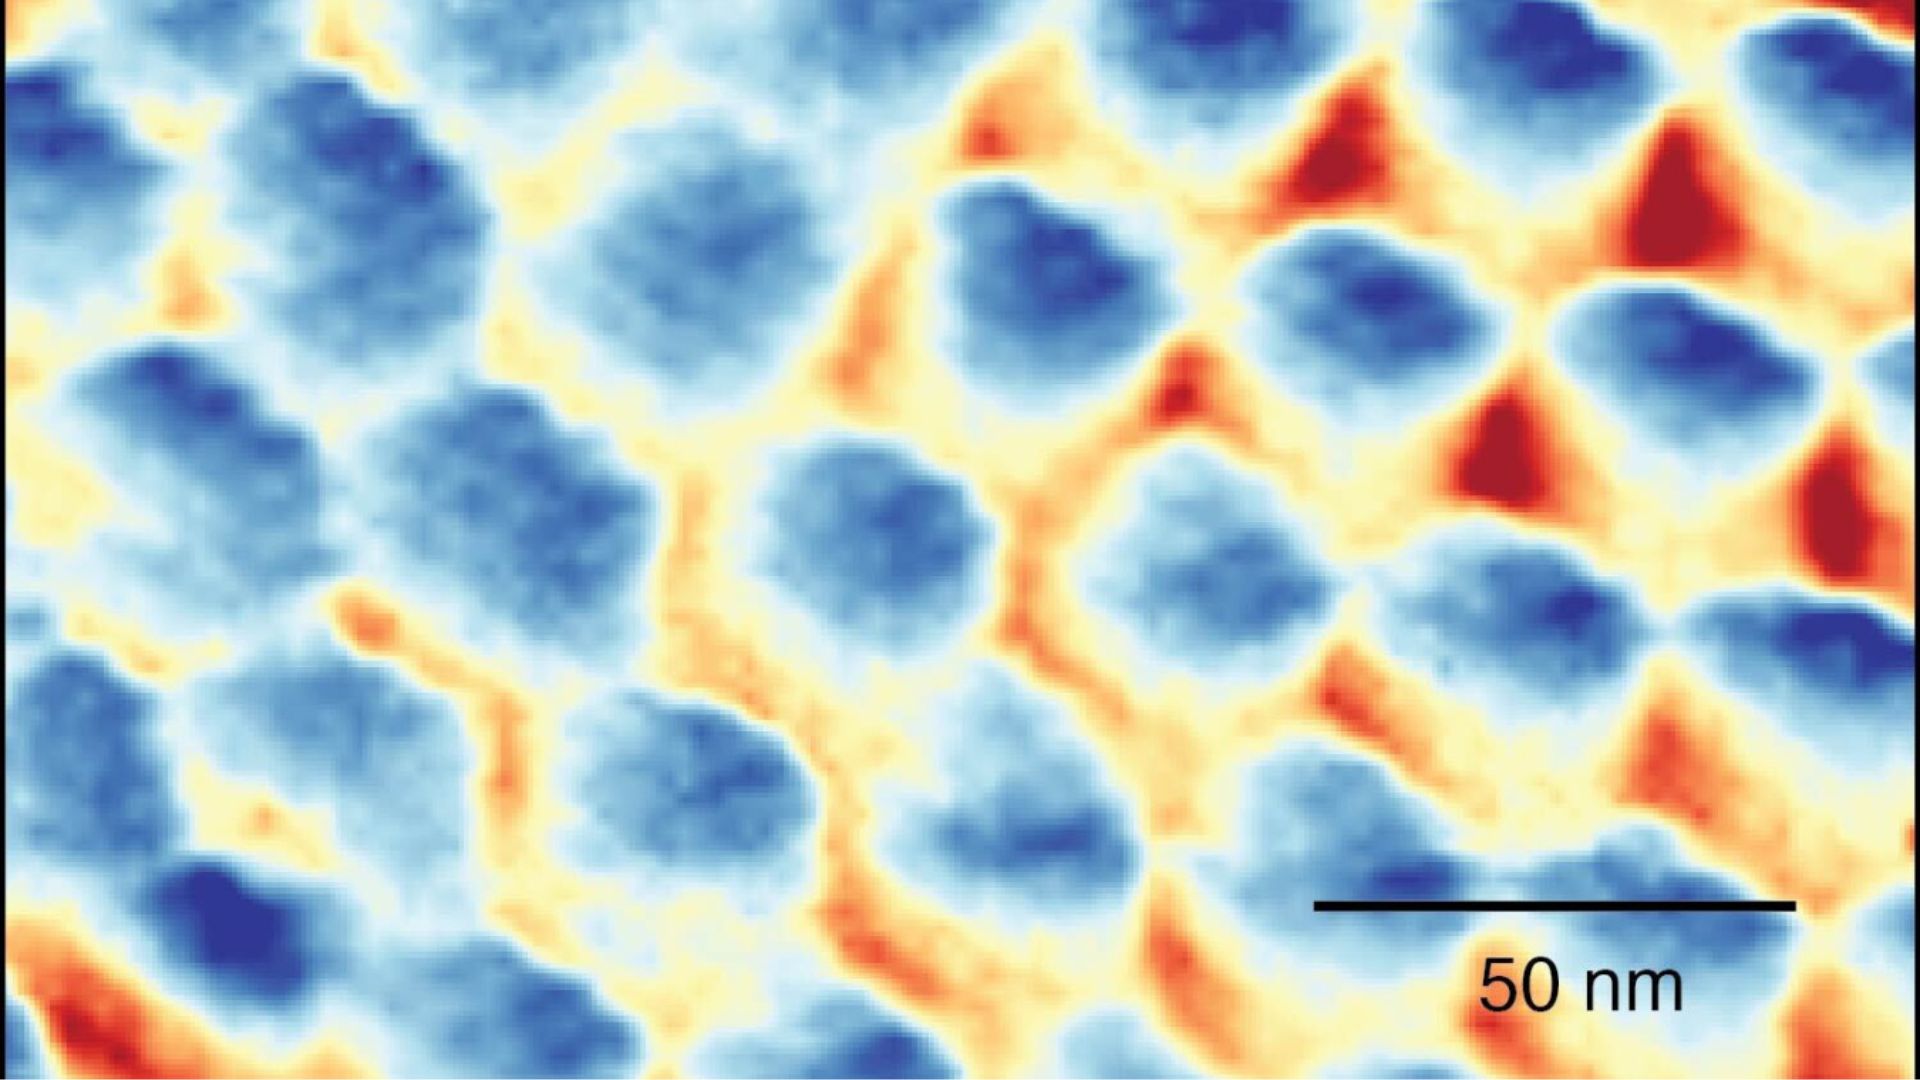
Minnesota iron ore could be key to sustainable and lower cost semiconductor
Read more of this story at Slashdot.
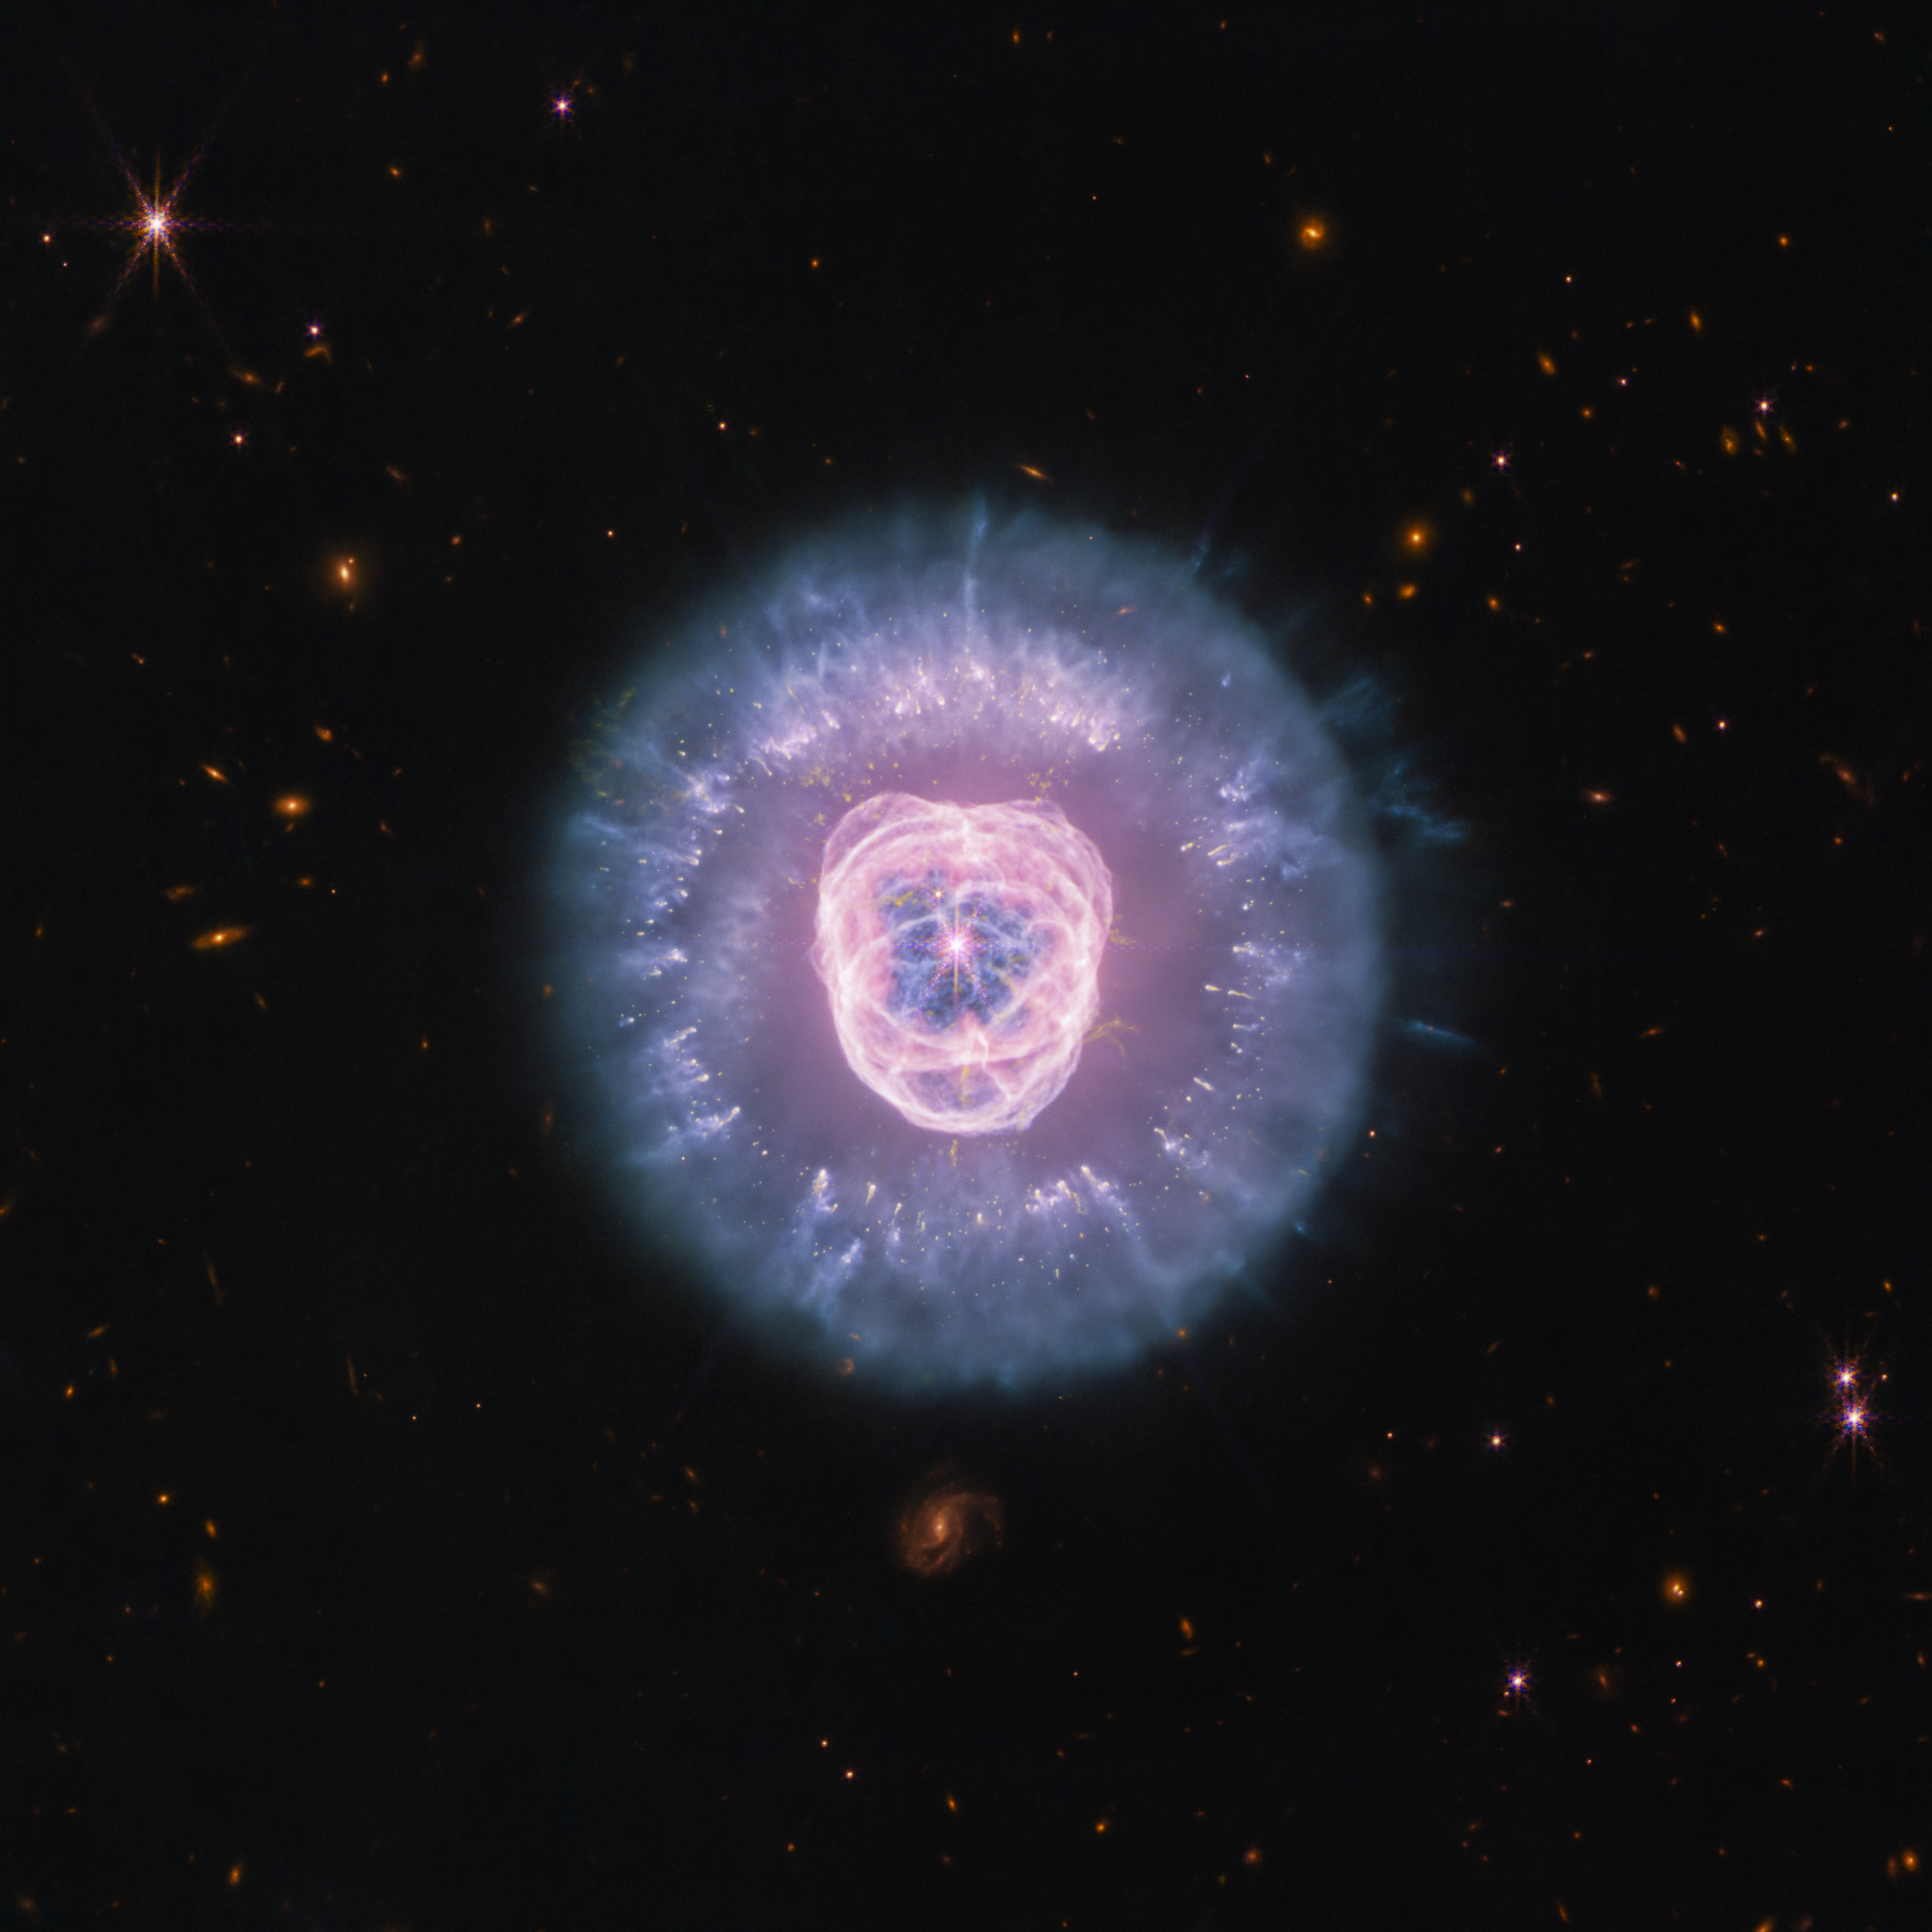
The star at the heart of the oft-observed Helix Nebula powered a clumpy wind before it died. Now, new images capture these clumps’ dissolution into the space between stars.
The post The Helix Nebula is Hurling Clumps of Gas through Space appeared first on Sky & Telescope.
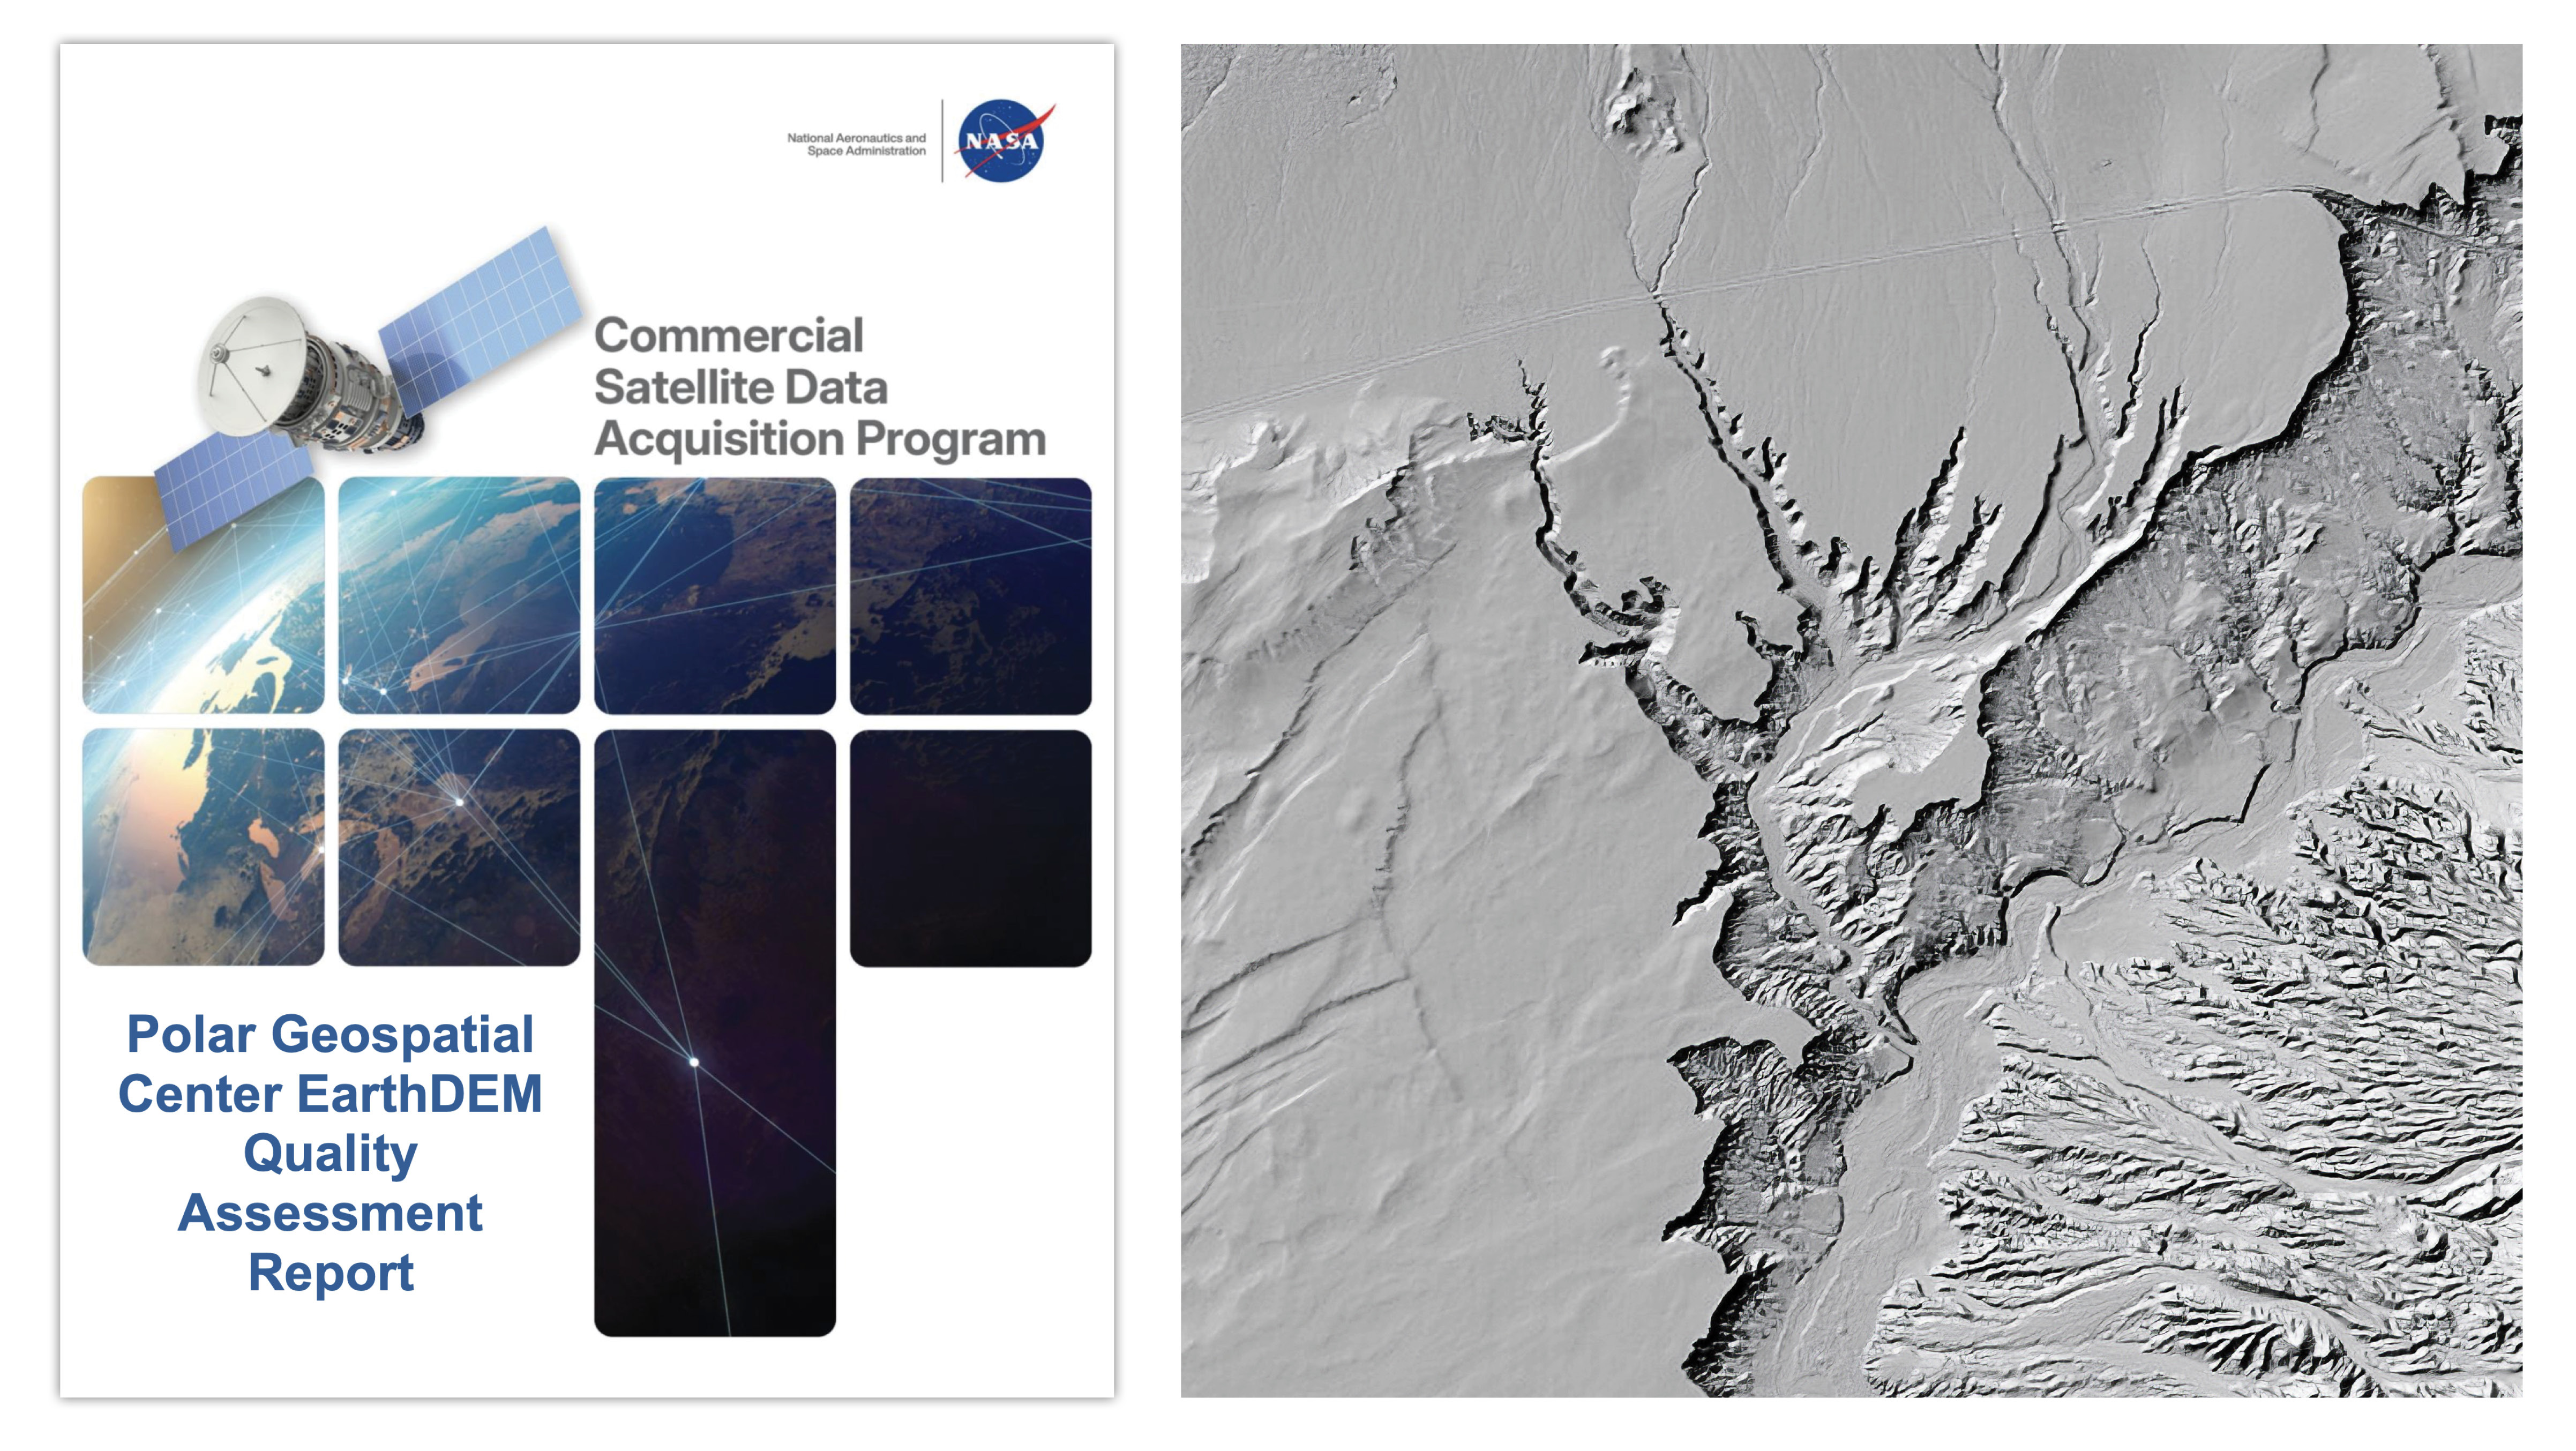
A new quality assessment report from NASA’s Commercial Satellite Data Acquisition (CSDA) program evaluates data from the Polar Geospatial Center’s (PGC) EarthDEM product. The results of the evaluation help inform NASA program management and the user community about the quality of commercial Digital Elevation Models (DEMs) for use in NASA science.

Issued August 8, 2026, the CSDA Polar Geospatial Center EarthDEM Quality Assessment Reportwas conducted by NASA Digital Elevation Model (DEM) subject matter experts (SMEs) enlisted to evaluate the horizontal and vertical accuracy of two PGC EarthDEM1 (i.e., Digital Elevation Model) products: the center’s “Mosaic Tile” and “Strip” Digital Surface Models (DSMs).
To assess the vertical and horizontal accuracy of the EarthDEM Strip DSM and Mosaic Tile products over a variety of surface characteristics, the SMEs compared them to airborne lidar data samples from across the United States and Senegal. They found the horizontal accuracy of the EarthDEM products (Strip DSM: 0.5-meter (m) Root Mean Square Error Horizontal (RMSEH); Mosaic Tile: 0.3 m RMSEH) agreed with the specifications provided by the PGC and graded them “Excellent.” The vertical accuracy results of the EarthDEM Strip DSM (5.6 m Root Mean Square Error Vertical (RMSEV)) and the Mosaic Tile (4.9 m RMSEV) products varied by land cover type, with all land cover types exceeding the specification provided by the PGC (0.5 m RMSEV). Strip DSM vertical accuracy was found to vary from 4.6-6.8 m RMSEV depending on the cloud cover metadata field generated by the PGC. Given this variation, the vertical accuracy compliance for the EarthDEM products was graded as “Basic.”
Overall, the assessment report supports the use of EarthDEM data for NASA Earth science research and applications, as long as the data characteristics (e.g., vertical accuracy, poor cloud masking, missing surface features, data voids, etc.) are compatible with the specific science objectives and use cases.
The report also provides a Data Provider Documentation Review for the EarthDEM product that evaluated information from the PGC website, as well as a series of peer-reviewed publications by researchers at The Ohio State University’s Byrd Polar and Climate Research Center. (Only documents listed in this report were considered in the evaluation.) The report’s authors found that, overall, the EarthDEM product is “well documented,” with most information present within the product User Guide, a series of peer reviewed papers, or the PGC GitHub repository.
The CSDA program was established to identify, evaluate, and acquire data from commercial sources that support the NASA Earth science research and application goals. NASA’s Earth Science Division recognizes the potential impact commercial satellite constellations may have in encouraging/enabling efficient approaches to advancing Earth System Science and applications development for societal benefit. Commercially acquired data may also provide a cost-effective means to augment and/or complement the suite of Earth observations acquired by NASA, other U.S. government agencies, and international partners.
To read the reports in full, see the links under “Evaluation” heading on the Polar Geospatial Center vendor page on the CSDA website.
1. According the authors of the report, “it should be noted that the PGC EarthDEM product is not technically a commercial product…. EarthDEM is a digital elevation dataset derived from imagery collected from the Vantor (formerly Maxar) fleet of optical satellites.”

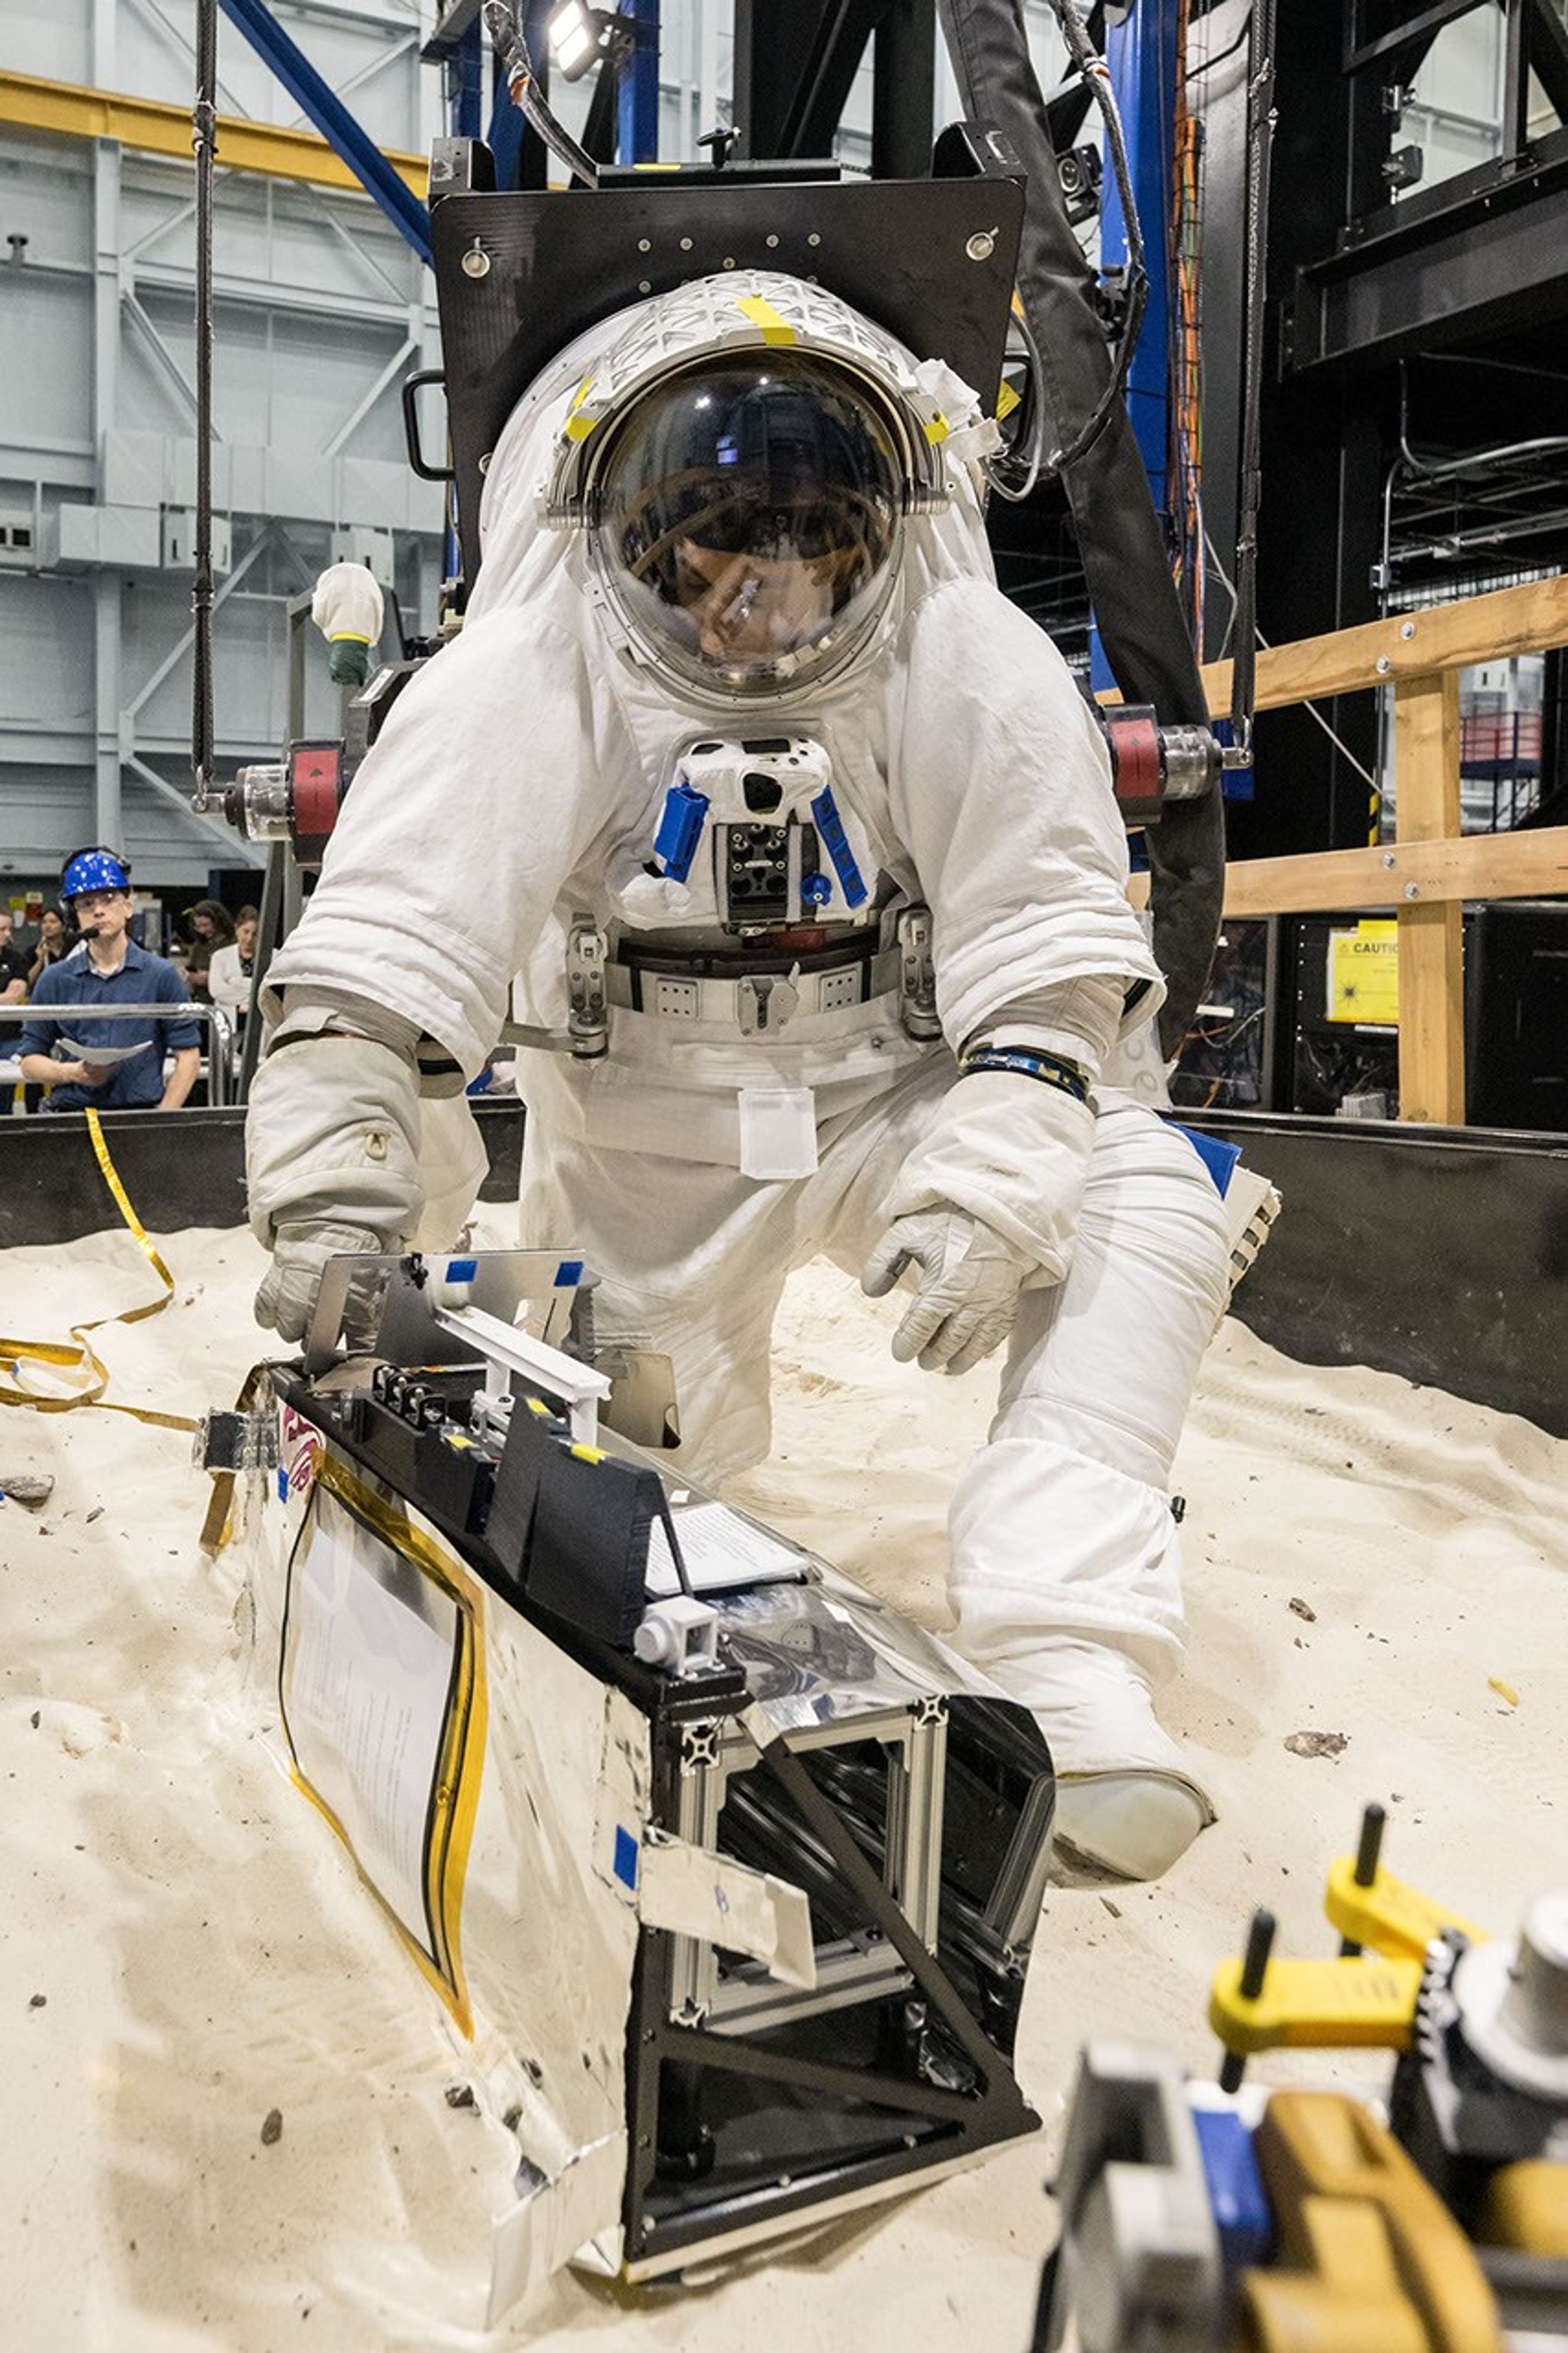
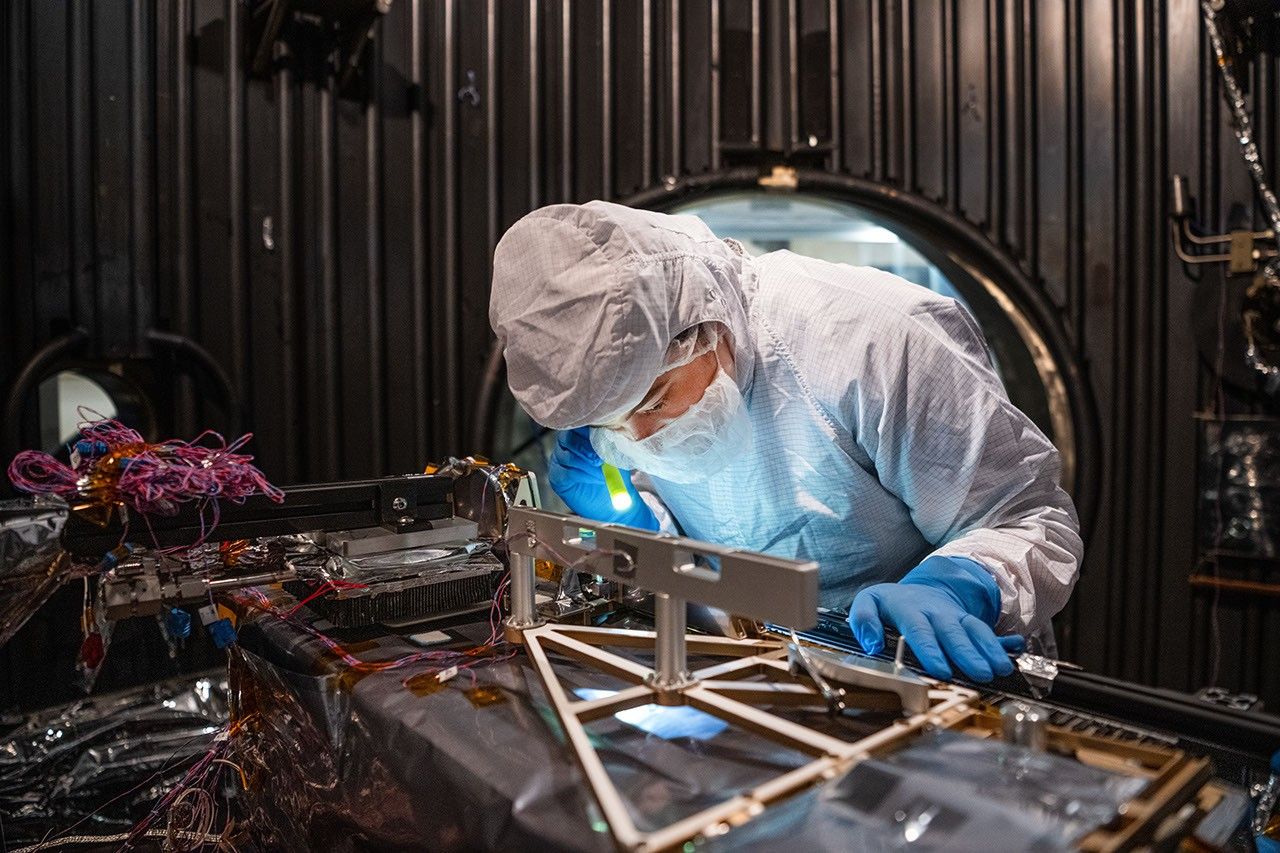
NASA has declared “wrenches down” on the first completed payload designed for Artemis astronauts to deploy on the Moon’s surface. Engineers working on NASA’s Lunar Environment Monitoring Station, or LEMS, have completed hardware development and testing and the payload is ready for its permanent home near the lunar South Pole. With the hardware complete, LEMS is ready to support one of the Artemis program’s core goals: enabling sustained lunar science and exploration.
The LEMS instrument package contains two highly sensitive seismometers that will monitor ground vibrations from moonquakes and meteorite impacts, providing scientists with insights into the Moon’s interior and the seismic hazards astronauts might encounter at the surface. Its modular design allows the system to be adapted or expanded to host new instruments in the future, creating a reusable platform that can evolve as scientific priorities grow.
The payload will remain in a clean room at NASA’s Goddard Space Flight Center in Greenbelt, Maryland, where it was built, until it is assigned to an Artemis mission for deployment to the lunar surface.
“The completion of the LEMS scientific instrument is a major step in a new era of lunar surface science. Innovative science experiments will uncover, measure, and reveal the Moon’s secrets while astronauts open new frontiers for discovery,” said Joel Kearns, deputy associate administrator for exploration, Science Mission Directorate, NASA Headquarters in Washington. “And, behind the scenes, countless teams across NASA and our partners are pushing the boundaries of what surface instruments can do, building the tools that will make future exploration possible and safer.”

The LEMS payload builds on a legacy of lunar seismic tracking. Apollo astronauts deployed a network of seismometers on the Moon’s nearside equatorial region between 1969 and 1972. Those instruments operated until 1977, recording about 13,000 moonquakes and other ground vibrations that helped scientists begin to understand the composition of the Moon’s interior. For decades, researchers have hoped to spread more seismometers, updated with new technologies, across the lunar surface.
Now, LEMS will carry the first seismometers to be deployed by future astronauts to listen for faint ground vibrations, collecting new clues to the Moon’s internal structure and ongoing seismic activity. The sensors will be the most compact, sensitive, and energy-efficient seismometers ever built for planetary exploration.
LEMS itself is about the size of a small suitcase, weighing 11 pounds in the Moon’s low-gravity environment. It will carry not just these seismic sensors, but everything it needs to function independently of humans after deployment. LEMS is built to manage its own power production via a lightweight, flexible solar array that conforms to the shape of the LEMS unit. It also will manage its operational activities to ensure continuous data collection based on a preset plan, and monthly data transmission to Earth. The payload will do all this while maintaining a stable internal temperature throughout the massive day-to-night temperature swings of the South Pole region.

“When we conceived of LEMS, we weren’t just thinking about the next mission, we were thinking about the next generation of lunar exploration,” said Mehdi Benna, a University of Maryland Baltimore County scientist who leads LEMS from NASA Goddard. “Our vision was to create a scientific buoy for the Moon. Like an ocean buoy on Earth, LEMS is designed to be easy to build, adaptable to different scientific objectives, and capable of operating independently for years.”
Before any surface science could happen, Benna and his team had to ensure that LEMS could survive the trip to the Moon and the harsh environment of its surface. Over the past five months, LEMS and its components have been subjected to a demanding series of environmental and operational tests. Engineers verified LEMS can endure the violent shaking of launch, the journey to the lunar surface, and the Moon’s temperature and radiation environment. The team also showed that the instrument package’s mechanical and electrical design is safe for astronaut handling.
The LEMS payload was built to operate through the lunar night, which lasts two Earth weeks, without external power assistance or a heat source. Past lunar surface instruments relied on radioisotope heaters for warmth and power. But LEMS instead will withstand temperatures that dip to minus 400 degrees Fahrenheit in some areas by using advanced insulation materials, low-thermal-conductivity cables that minimize heat loss, and a thermal regulator that conducts heat away during the day to prevent overheating and helps retain heat at night.
These innovations reduce mass and power needs, setting the stage for lighter, energy-efficient instruments that can operate continuously at future Artemis landing sites and the NASA-led Moon Base.
The LEMS payload is led by University of Maryland Baltimore County and University of Maryland College Park. Technical implementation is led by NASA Goddard. The University of Arizona, in partnership with Silicon Audio, Inc., supplied LEMS’ two state-of-the-art seismometers. Morehead State University in Kentucky provided LEMS’ telecommunication system and will operate the instrument on the surface. Washington University in St. Louis will manage the instrument’s data processing and dissemination to the larger scientific community.
A climate shock that unfolded about 304 million years ago is offering scientists a dramatic warning about how quickly Earth’s climate system can amplify an initial temperature rise. During the Late Paleozoic Ice Age, a relatively modest increase in global temperatures appears to have triggered a much larger episode of warming, as methane released from thawing permafrost intensified the greenhouse effect. Researchers say the ancient event provides a powerful geological parallel for the climate changes occurring today.
The study, led by Le Yao of the Nanjing Institute of Geology and Paleontology with contributions from University of Cincinnati geosciences professor Thomas Algeo and international colleagues, examined a short-lived warming episode during Earth’s penultimate ice age. Their findings suggest that global sea surface temperatures eventually increased by more than 7 degrees Celsius, or approximately 12 degrees Fahrenheit. The rise was not necessarily caused by one enormous initial pulse of carbon. Instead, it may have developed through a chain reaction in which warming activated additional natural sources of greenhouse gases.
The Late Paleozoic Ice Age extended across a vast span of geological time, when large ice sheets covered parts of the supercontinent Gondwana. Although the planet was in an “icehouse” state, atmospheric carbon dioxide and methane still had the power to destabilize the climate. The newly analyzed warming event is particularly significant because it occurred under ice-age conditions rather than during an already warm greenhouse world. That makes it a valuable analog for the modern Earth, which still contains continent-scale ice masses in Greenland and Antarctica.
According to the researchers, the initial climate disturbance may have been linked to volcanic activity. Volcanic emissions can inject carbon dioxide and other gases into the atmosphere, where they absorb outgoing infrared radiation and prevent some heat from escaping into space. The warming may also have been assisted by changes in Earth’s orbit. Over long cycles, variations in orbital shape alter the distribution of sunlight across the planet, influencing the growth and retreat of ice sheets and changing the seasonal balance of solar energy.
At first, the additional carbon may have produced only a limited temperature increase. But once warming crossed a critical threshold, frozen ground in high-latitude regions began to thaw. Permafrost contains large quantities of organic carbon preserved in frozen soils. When that material becomes available to microbes, decomposition can release carbon dioxide and methane. Methane is especially powerful over shorter atmospheric timescales because, molecule for molecule, it absorbs considerably more infrared radiation than carbon dioxide, even though it remains in the atmosphere for less time.
This process can create a positive climate feedback. An initial warming causes permafrost to thaw, thawing releases greenhouse gases, and the additional gases produce further warming. That extra heat can accelerate more thawing, allowing the cycle to reinforce itself. The researchers describe the ancient event as a transient global warming episode in which a comparatively modest carbon release appears to have crossed a climatic tipping point and initiated much more extensive carbon emissions from natural reservoirs.
The geological timescale of the ancient warming is also central to the study’s relevance. Algeo said the temperature change unfolded over tens of thousands of years, with warming occurring at an average rate of roughly one-tenth of a degree Celsius per 1,000 years. Modern warming is progressing far more rapidly. Researchers have observed an increase of nearly 1 degree Celsius in global sea surface temperature over approximately the past century, a rate many times faster than the average change reconstructed for the ancient event.
The comparison does not mean that Earth is destined to repeat the precise conditions of 304 million years ago. Continents, ecosystems, atmospheric composition and ice-sheet geometry were all different in the Late Paleozoic. However, the physics of greenhouse warming and the existence of carbon feedbacks remain relevant. Ancient climate records reveal how a system that appears stable can respond nonlinearly when warming activates processes capable of releasing additional greenhouse gases.
The findings also place human history in a broader planetary context. All recorded human civilization has developed during the most recent ice age, despite the fact that the term can sound incompatible with today’s climate. In scientific usage, Earth remains in an ice age because substantial permanent ice sheets still exist in Greenland and Antarctica. The ancient warming episode matters precisely because it demonstrates that an ice age does not guarantee a permanently cold or stable climate. Even within an icehouse world, a small disturbance can trigger rapid and substantial changes when reinforcing feedbacks are engaged.
The research, published in the Proceedings of the National Academy of Sciences, underscores why scientists closely monitor permafrost, polar ice and other climate-sensitive carbon stores. The ancient record cannot provide an exact forecast of future warming, but it shows that Earth’s climate has repeatedly responded to carbon disturbances with amplifying feedbacks. As modern emissions continue to raise temperatures at an exceptional rate, the geological evidence offers a clear message: the danger lies not only in the carbon released directly by human activity, but also in the natural carbon sources that warming can unlock.
Subject of Research: Ancient global warming, permafrost methane feedbacks, and climate tipping points during the Late Paleozoic Ice Age
Article Title: A transient global warming event during Earth’s penultimate icehouse
Web References: https://doi.org/10.1073/pnas.2601643123
References: Proceedings of the National Academy of Sciences, DOI: 10.1073/pnas.2601643123
Image Credits: Andrew Higley, University of Cincinnati
Keywords: climate change, global warming, ice age, Late Paleozoic Ice Age, permafrost, methane, climate feedback, tipping point, paleoclimate, geology, volcanic activity, Earth’s climate history

PHILADELPHIA — Public resistance to new data centers has risen sharply across the United States, even as Americans’ overall views of artificial intelligence remain largely unchanged, according to a nationally representative survey from the Annenberg Public Policy Center at the University of Pennsylvania. The findings reveal a growing divide between public attitudes toward AI as a technology and attitudes toward the physical infrastructure required to operate it. While many people continue to see potential benefits from AI, particularly in medical research, opposition increases substantially when the technology is associated with a large industrial facility being built near their homes.
The survey found that 61% of U.S. adults somewhat or strongly oppose the construction of new data centers in their communities. That figure is 12 percentage points higher than the 49% recorded in an earlier APPC survey conducted in February and March. Support fell during the same period, from 21% to 14%. The change comes as communities across the country debate the environmental, economic, and social consequences of rapidly expanding computing infrastructure used to train and operate advanced AI systems.
Data centers are specialized facilities filled with servers, networking equipment, cooling systems, backup power supplies, and security infrastructure. AI applications can require enormous amounts of computational power because they process vast datasets and perform calculations across billions of model parameters. Training a large AI model may require thousands of processors operating simultaneously, while everyday use also depends on data centers to generate responses, analyze images, translate languages, and carry out other tasks. These facilities can consume substantial amounts of electricity and water, making their construction a highly visible local issue even when the software they support is used remotely.
Opposition to local data centers crosses political boundaries. Majorities of Democrats, Republicans, and independents said they opposed new facilities in their areas, although the proportions differed: 69% of Democrats, 54% of Republicans, and 53% of independents expressed opposition. Resistance was strongest among adults younger than 30, reaching 70%, and declined to 57% among people 65 and older. The pattern is notable because younger adults are often assumed to be more comfortable with emerging technologies and are more likely to use AI-powered services in education, work, entertainment, and communication.
Despite the shift in views about local infrastructure, broader opinions about AI have remained stable. Thirty-nine percent of respondents said they expected AI’s impact on the United States over the next decade to be somewhat or very negative, compared with 18% who expected a positive impact. The result was statistically unchanged from the spring survey. In addition, 68% said the federal government has done “too little” to regulate AI, a view shared by majorities of Democrats, Republicans, and independents. The results suggest that concerns about AI regulation have become persistent rather than being driven solely by short-term news events.
Respondents distinguished sharply between areas where AI might produce public benefits and areas where it could create risks. Among 13 sectors examined, medical research and scientific discovery was the only category receiving a net-positive assessment, with anticipated benefits exceeding expected harms by 41 percentage points. AI systems are increasingly being used to identify patterns in biological data, predict molecular structures, assist with medical imaging, and help researchers screen potential treatments. These applications may accelerate work that would otherwise require years of laboratory experiments, although they still depend on human validation and carefully controlled clinical studies.
The most negative assessments involved personal privacy and data security, which registered a net score of minus 63 points. Children’s online safety followed at minus 50 points, while employment and jobs reached minus 46 points. These concerns reflect the technical and social consequences of deploying AI at scale. Models may be trained on or exposed to sensitive information, automated systems can make decisions that are difficult to explain, and workplace applications may alter or eliminate certain tasks. The survey does not measure whether these risks will materialize in specific industries, but it indicates that many Americans view them as more immediate than AI’s possible benefits outside medicine.
Personal experience with AI was associated with more favorable opinions about its national impact. Among respondents who said they had never used AI during the previous month, 54% expected its effect on the country to be negative. That proportion fell to 40% among light users and to 29% among those who used AI many times or almost every day. However, frequent use did not make people more supportive of data centers. Opposition to building new facilities near respondents’ homes remained essentially flat across different levels of AI use. This distinction suggests that familiarity may influence perceptions of digital tools, while concerns about electricity demand, water consumption, noise, traffic, land use, and local utility costs may remain regardless of personal experience with AI software.
“The people who use AI the most are the most optimistic about what it will do for the country, and that has been consistent across our surveys,” said Matt Levendusky, a University of Pennsylvania political science professor and the Stephen and Mary Baran Chair in the Institutions of Democracy at APPC. He said that optimism had clear limits, particularly when questions involved privacy, employment, or the construction of a data center nearby. The survey was conducted by SSRS for APPC’s Institutions of Democracy division among 1,320 U.S. adult citizens from June 16 through July 19, 2026. Respondents were surveyed primarily online, with a small telephone sample, and weighted to match population benchmarks. The margin of error for the full sample was plus or minus 3.5 percentage points, with larger margins for subgroups. Together, the findings indicate that the next phase of the AI debate may be shaped less by abstract promises about intelligent software than by negotiations over the highly physical systems that make it possible.
Subject of Research: People
Article Title: Opposition to Local Data Centers Rises Sharply as Views on AI Hold Steady
Web References: Annenberg Public Policy Center news release; Reuters; The New York Times; Associated Press
References: Annenberg Public Policy Center Institutions of Democracy national survey, June 16–July 19, 2026; APPC AI topline survey data; APPC survey methodology
Image Credits: Annenberg Public Policy Center
Keywords: Artificial intelligence, data centers, public opinion, AI regulation, medical research, privacy, data security, employment, social surveys, political science

Researchers at the University of Basel, Switzerland and Technical University of Munich, have developed a new approach that reveals the motion of electrons in the Wigner crystal, one of the most elusive states of matter. The team was able to access properties of the crystal in its fragile quantum state using light.
First predicted nearly a century ago, the Wigner crystal is a solid phase of electrons that forms a organized crystal-like lattice structure at low densities. When moving in an inert, neutralizing background, a gas of electrons tend to crystallize at low densities as their potential energy is more dominant than their kinetic energy.
Depending on the number of dimensions, the electrons are spread in, they can either form a crystal lattice in 3D, a triangular lattice when in two dimensions or an evenly space latticed when in a single dimension, as the electron cloud looks to minimize its potential energy. Physicist Eugene Winger predicted this in 1934 and has fascinated scientists since because it does not arise from an internal structure from the host material.
While these crystals have been observed extensively, little was known about their internal behavior, their movements, interactions or responses to external disturbances. So, a team of researchers led by Tomasz Smoleński, assistant professor at the University of Basel, probed the crystal using light.
The research team cooled a single layer of tungsten diselenide to temperatures just above absolute zero and illuminated it using light.
“Our measurements show that light can do more than simply detect the presence of this exotic state—it can reveal how the state behaves internally,” explained Lujun Wang, who carried out the experiments at the University of Basel.
Their work showed that the optical signatures were influenced by the strength of the interactions among the electrons, which is useful in exploring other systems which have multiple interacting particles.
To make sense of their find, the researchers also needed a strong theory of what was happening inside the Wigner crystal. So, the team collaborated with Michael Knap, a professor of collective quantum dynamics at the Technical University of Munich (TUM) to understand what was happening.
Knap and his team came up with the theory that the incident light generated excitons which interacted with the orderly arrangement of electrons in the Wigner crystal and resulted in the formation of hybrid quasiparticles called polarons. These polarons served as optical probes for the crystal and its collective dynamics.
“What is particularly exciting is that these signals carry information not only about how the electrons are arranged, but also about their quantum dynamics,” explained Fabian Pichler, a PhD student at TUM and member of Knap’s research team. “This allows us to connect the experimental observations directly to the underlying many-body physics.”
The study demonstrates that atomically thin materials are promising platform for viewing collective motion of electrons in ordered quantum states. This opens up possibilities of investigating other materials and understanding its internal dynamics even if it may have strongly correlated matter.
The research findings were published in the journal Nature Physics.
A new study is drawing attention to a hidden problem in mental-health research: scientists may be using the same words to describe first episode psychosis (FEP) while measuring entirely different things. In an analysis published in Schizophrenia, researchers Seiber, Sridhar, Hasenstab and colleagues examine how U.S. insurance claims data are used to estimate the incidence of FEP—the number of new cases appearing in a population over a defined period—and argue that greater standardization is urgently needed.
First episode psychosis refers to the point at which a person experiences psychotic symptoms for the first time in their life. These symptoms can include hallucinations, delusions, disorganized thinking or major changes in behavior and functioning. FEP is not a single diagnosis. It can occur in schizophrenia-spectrum disorders, bipolar disorder, severe depression and several medical or substance-related conditions. Because early treatment is linked to better long-term outcomes, knowing how often FEP occurs is essential for planning specialized clinics, staffing early-intervention programs and directing public-health resources.
The researchers focus on U.S. claims data, enormous digital records generated when patients receive medical care and providers submit bills to insurers. These databases can include diagnostic codes, procedure codes, prescription information, dates of service and details about emergency, inpatient and outpatient treatment. Unlike traditional epidemiological surveys, claims datasets can cover millions of people and make it possible to study patterns across large geographic areas. Their scale, however, does not automatically make their estimates precise.
The central challenge is that a billing code is not the same as a clinical assessment. A code for psychosis may indicate a confirmed diagnosis, a suspected condition, a historical problem or a provisional label assigned during an emergency evaluation. Claims data also rarely contain the complete clinical narrative needed to determine whether symptoms truly represent a person’s first psychotic episode. A patient may have received care in another health system, paid out of pocket, changed insurers or carried an earlier diagnosis that is invisible in the database being studied.
Even the definition of “incidence” can vary. Some researchers count a first-ever psychosis-related diagnosis, while others count a first hospitalization, a first emergency-department visit or the first appearance of a relevant code after a period without documented care. These approaches can produce different numbers from the same underlying population. A study requiring a long “clean period”—a span of time with no previous psychosis-related claims—may reduce the likelihood of counting established cases as new, but it can also exclude people whose earlier treatment occurred outside the available records.
Age, sex, insurance type and geography can further influence the apparent rate of FEP. Young adults may be more likely to encounter emergency services, while people in rural areas may face limited access to psychiatrists and specialized programs. Differences in insurance coverage can determine which services generate observable claims. If researchers compare estimates without accounting for these factors, they may mistake variations in detection or access for genuine differences in disease occurrence.
The study’s call for standardization points toward a more consistent technical framework. Researchers need to specify which diagnostic codes qualify as psychosis, whether substance-induced and medically caused episodes are included, how long a person must remain free of prior claims to be considered a new case, and which healthcare settings are examined. They also need to define the population denominator—the number of people considered at risk—and explain how individuals with incomplete enrollment or interrupted insurance coverage are handled.
Validation is another crucial step. Claims-based algorithms should be compared with detailed chart reviews, clinical registries or structured assessments to determine how accurately they identify genuine FEP. Two statistical measures are especially important: sensitivity, or the ability to capture true cases, and positive predictive value, or the proportion of algorithm-identified cases that are confirmed after review. An algorithm with high sensitivity may find more possible cases but also produce more false positives; one with high specificity may miss people who received vague or inconsistent coding.
Standardized methods could make FEP estimates more comparable across states, insurers and research teams. That would help scientists detect real trends rather than methodological noise and could reveal whether early psychosis services are reaching the populations most in need. More reliable estimates could also strengthen efforts to investigate racial, socioeconomic and regional disparities, provided that claims data are interpreted carefully and not treated as a complete substitute for clinical information.
The message from the research is not that U.S. claims databases are unusable. On the contrary, their breadth makes them one of the most powerful tools available for studying mental-health care at scale. But their value depends on transparent definitions, validated case-finding methods and clear reporting standards. As health systems increasingly rely on administrative data and automated analytics, agreeing on what counts as a new case of psychosis may be the difference between a map that reveals a public-health crisis and one that merely reflects the quirks of the billing system.
Subject of Research: Estimating first episode psychosis incidence rates using U.S. claims data
Article Title: Estimating first episode psychosis (FEP) incidence rates using U.S. claims data: a need for standardization
Article References: Seiber, E.E., Sridhar, S., Hasenstab, K.A. et al. “Estimating first episode psychosis (FEP) incidence rates using U.S. claims data: a need for standardization.” Schizophrenia (2026). https://doi.org/10.1038/s41537-026-00793-4
Image Credits: AI Generated
DOI: 10.1038/s41537-026-00793-4
Keywords: First episode psychosis, FEP, incidence rates, U.S. claims data, schizophrenia, mental health, epidemiology, healthcare data, standardization
NASA’s Transiting Exoplanet Survey Satellite (TESS) mission has notched up its first discovery of an exoplanet via a method known as microlensing. The planet is a “super Jupiter” known as Gaia23bra b, and TESS observed it when the planet and its host star acted as a gravitational lens, magnifying the light from a second, more distant background star.
Astronomers have several ways of finding planets beyond our solar system. The most successful of these by far – and the one that TESS was designed for – is the transit method, which is responsible for roughly 75% of all exoplanet detections to date. This approach relies on observing the periodic dimming of a star’s light as a planet passes between the star and an observer here on Earth.
The transit method does have limitations, however. The main limitation is that we can see transits for only a small number of planets, namely those with orbital planes that are almost exactly edge-on to Earth. An alternative approach known as photometric microlensing is somewhat more flexible in this respect, as it relies on the star-planet system magnifying the light from a background star, which is known as the source. This magnification occurs because the gravitational pull of the planet-star system warps space, bending and magnifying the source’s light (as Albert Einstein predicted as part of his general theory of relativity) like a lens and producing characteristic spikes in its brightness.
Astronomers initially identified a planet in the Gaia23bra system using observations made in 2023 by the European Space Agency’s now-retired Gaia space telescope. However, while Gaia picked up the unexpected brightening of a background star, it did not identify this event as coming from a binary-star system, and it could not pick out the planet itself because its observations were too sparse, explains Mallory Harris, an astronomer at the University of New Mexico, US who led the TESS study.
In the new work, Harris and colleagues scoured TESS data from the same period. Because TESS’ observations were much denser – it observed the region every 200 seconds for nearly 60 days – they were able to identify extra features in the brightness of the light curve that indicated the presence of a planet in the system. Subsequent analyses revealed that this planet is about 1.63 times the size of Jupiter, and it orbits its host – an orange dwarf star 20% smaller than our Sun – at a distance similar to that of Jupiter from our Sun.
The transit technique is particularly sensitive to planets that orbit close to their star because these planets are the most likely to transit and block out most of their host stars’ light as they pass in front of them. In contrast, Harris explains that microlensing is most sensitive to planets orbiting at Earth-like distances or further from their stars, making it better for studying planetary systems more like our own solar system. “With microlensing, we can find smaller planets with greater orbital distances, including worlds in the habitable zone of their star and even farther away,” she says.
The transit technique and microlensing are therefore complementary because each reveals a category of planet that the other may not be able to detect, adds team member Diana Dragomir. The only problem, Harris notes, is that microlensing observations are limited-time opportunities. “Microlensing events happen once and they’re gone – they don’t repeat,” Harris says. “I like to joke that we’ll probably find the first Earth analogue with microlensing and then wave at it as it goes by because we’ll never see it again.”
That said, Harris says that Gaia23bra will be an important observing target for the Nancy Grace Roman Space Telescope. “Microlensing is currently the only method capable of detecting Earth‑mass planets at Earth‑like orbital distances,” she explains. “We already knew that this technique could find planets, because it has done so in the past using ground-based observatories.
“What we demonstrated in this work is that high-cadence observations (even with low spatial precision) and high-precision long-baseline observations can work together to find a microlensing planet. And that it is possible to specifically do this by pairing TESS observations with those from another instrument.”
This synergy between long-time-scale surveys and high cadence observations could be therefore applied towards future searches for potentially habitable worlds, she tells Physics World. Although Gaia was retired last January, making it unlikely that astronomers will find many additional events via a Gaia–TESS combination, Harris adds that there could nevertheless be other microlensing planets in the past eight years of archived TESS observations. “I’m excited to see whether there are other events like this already hiding in the TESS data and whether future surveys can work together with TESS to find more microlensing planets in different parts of the galaxy,” she says.
The post Transit-based exoplanet survey finds its first microlensing exoplanet appeared first on Physics World.

A third of humanity cannot see the Milky Way from where they live. The statistic is real, but it needs a date and a definition attached to it.
It comes from the 2016 New World Atlas of Artificial Night Sky Brightness, not from a survey in which billions of people were asked to look up. Researchers combined satellite observations, ground measurements, a model of how light scatters through the atmosphere and population data to estimate who lived under skies bright enough to erase the galaxy’s pale band.
No newer study has yet replaced it with an equivalent global headcount. More recent research shows that artificial light at night is still changing, often quickly, but those measurements do not translate directly into a new percentage of humanity that can or cannot see the Milky Way.
The New World Atlas was published in Science Advances by Fabio Falchi and an international team. Its headline results were stark: more than 80 percent of the global population lived under light-polluted skies, while more than 99 percent of people in the United States and Europe did.
The threshold for losing the Milky Way was higher than the threshold for merely experiencing some artificial skyglow. Under the atlas model, the galaxy was hidden from more than one-third of humanity, including about 60 percent of Europeans and nearly 80 percent of North Americans.
Space Daily reported those findings when the atlas appeared. The number has remained in circulation because the atlas is still the most complete population-weighted global estimate of this specific loss.
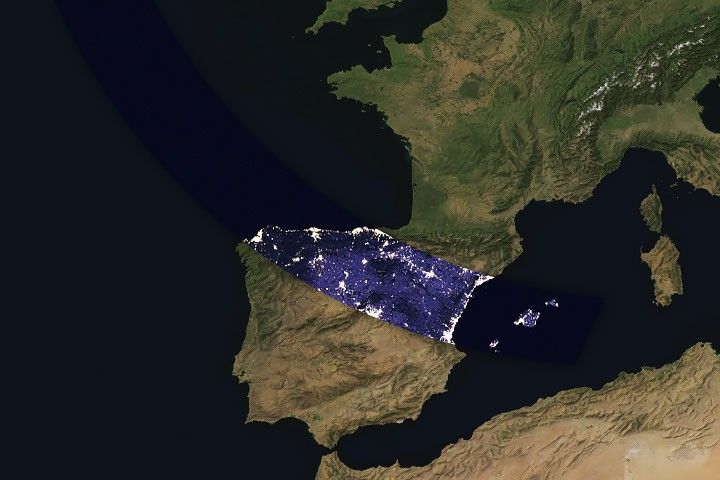
The atlas used low-light observations from the Visible Infrared Imaging Radiometer Suite aboard the Suomi NPP satellite. Those measurements showed light emitted upward from towns, roads and industrial areas.
A propagation model then estimated how that light would scatter through a standard clear atmosphere and return toward an observer as skyglow. Thousands of calibrated measurements made on the ground were used to check the model. Finally, the brightness map was combined with population data.
The result was not a prediction for every night. Clouds can amplify urban skyglow, while moonlight, haze, snow, altitude, season and the observer’s eyesight can all change what is visible. The atlas instead described modeled clear-sky conditions at the zenith using consistent assumptions, which made places comparable.
A zoomable version maintained by the Cooperative Institute for Research in Environmental Sciences shows how light from cities spreads beyond their built boundaries. A person can live well outside a city center and still look through its luminous dome.
Satellite instruments are excellent at mapping emitted light, but they do not see the night exactly as a dark-adapted person does. A 2023 study approached the problem from the ground.
Researchers analyzed 51,351 naked-eye observations submitted to the Globe at Night citizen-science project between 2011 and 2022. Participants compared the stars they could see with a sequence of charts under cloudless, moonless conditions.
The study found that the decline in visible stars at the observed locations was consistent with artificial sky brightness increasing by 7 to 10 percent per year in the human-visible band. Its central estimate was 9.6 percent.
That does not mean every place on Earth brightened by 9.6 percent each year. The observations were concentrated in Europe and North America and were biased toward inhabited locations. The authors explicitly noted that the sample did not represent the average distribution of either land area or global population.
It therefore cannot be applied to the 2016 total like compound interest to produce a new global headcount.
The difference between satellite and naked-eye trends is partly about direction. An orbiting sensor mainly detects light traveling upward. Skyglow is the result of light scattering back down toward people on the ground, and horizontally emitted light can make a large contribution.
Color matters too. The widely used VIIRS day-night instrument is relatively insensitive to shorter blue wavelengths. Human night vision is more sensitive to that part of the spectrum, and blue light scatters efficiently in the atmosphere. A city switching from orange sodium lamps to broad-spectrum white LEDs can therefore change the visible sky in ways the satellite record does not fully capture.
This does not make satellite measurements wrong. It means upward radiance and the brightness perceived by a person looking at the sky are related but different quantities.
A separate Nature study published in 2026 analyzed more than 1.16 million daily satellite images from 2014 through 2022. It found a net 16 percent rise in global artificial-light radiance over that period.
The global total concealed movement in both directions. Brightening added radiance equivalent to 34 percent of the 2014 baseline, while dimming elsewhere offset 18 percent. Urbanization and electrification drove many increases, especially in Asia, while energy policy, conflict, economic disruption and lighting changes produced reductions in other regions.
The authors also stressed that their satellite measurement was not the same as downward skyglow. It was especially sensitive to upward light after midnight within a limited range of wavelengths. That makes it valuable for tracking how Earth’s illuminated surface changes, but it still cannot provide an updated Milky Way visibility percentage by itself.
It is reasonable to suspect that the 2016 figure is now conservative in many growing urban regions. Ground observations show stars disappearing faster than earlier satellite trends suggested, and the 2026 analysis found a net rise in emitted light. Yet some places have dimmed, and the world’s population has moved as well as grown.
The defensible statement remains precise: the best global atlas found that more than a third of humanity lived where artificial skyglow hid the Milky Way under its modeled conditions. Newer work shows continued and uneven change, not a replacement population fraction.
Space Daily recently examined what losing routine access to a star-filled sky may mean psychologically. The measurement story adds a quieter lesson: we cannot protect what we do not measure carefully.
The good news is that skyglow is not permanent contamination. The US National Park Service recommends using light only where and when it is needed, choosing fully shielded fixtures, keeping output to the minimum necessary and favoring warmer colors. Unlike many environmental changes, turning down unnecessary light can improve the view that same night.
The post The claim that a third of humanity cannot see the Milky Way comes from a 2016 atlas, and newer studies show why producing an updated global headcount is harder than it sounds appeared first on Space Daily.

My two daughters were born less than two years apart, and yet only one of them arrived with a faint blue-grey patch spread across her lower back. My older daughter had it from her first day. My second daughter, born this past July, doesn’t have it at all. Same parents, same city, same general recipe, and one very visible difference between them before either one could hold up her own head.
I didn’t think much of it with my first until a nurse mentioned it by name almost in passing, the way you’d mention a birthmark anyone in the ward had seen a hundred times before. It’s common enough to have its own clinical shorthand and, unfortunately, its own history of being misread as something it isn’t.
The medical explanation has nothing to do with bruising, injury, or anything that happened during delivery. Cleveland Clinic explains that the marks form when “some melanocytes, the cells that give skin its color, don’t move to the surface of the skin as they normally do” while a baby is still developing in the womb. Instead of migrating up into the outer layers of skin the way they usually do, a cluster of them gets left behind deeper down, and the tissue above them scatters light in a way that reads as blue-grey rather than brown or tan. Nothing is wrong with the skin. The pigment cells are simply parked in the wrong layer.
These marks are also, by every account, completely harmless. Cleveland Clinic is blunt about it: the birthmarks need no treatment and tend to fade on their own as a child grows, with many fading substantially within the first year and the majority gone somewhere between ages six and ten, though larger or darker patches can occasionally last into adulthood.
Search for this mark online and the Genghis Khan story comes up almost immediately, the idea that it marks out the bloodline of the Mongol Empire, passed down through the centuries to anyone who carries it. It’s a good story, and it’s almost entirely a modern piece of internet folklore rather than a documented belief with any real age to it.
The actual history behind the clinical name is stranger and less flattering. It traces back to the 1880s and a German physician named Erwin Bälz, who was working in Japan at the time and documented the mark in Japanese infants. He borrowed the label from an outdated racial classification system from the century before, one that had lumped a wide range of Asian and Indigenous populations together under the single, since-abandoned category of the “Mongolian race.” The name was never really about the nation of Mongolia or any specific bloodline. It was a leftover from a scientific framework doctors gave up on generations ago, which is exactly why dermatology has been quietly moving away from it. A 2021 review in the medical journal Cureus put the broader principle plainly: “Terms that stigmatize a culture, region, people, country, communities, and ethnic group should be replaced by their more descriptive counterparts,” which is why you’ll increasingly see the mark called congenital dermal melanocytosis or a slate-grey nevus in clinical settings instead.
None of that explains why my older daughter has it and her sister doesn’t, but the biology does. The marks are simply far more common in babies with more heavily pigmented skin. Cleveland Clinic notes they turn up more often in babies of Asian, Black, or Hispanic ancestry, though any baby, of any background, can be born with one or without one. It comes down to how much melanin a particular baby’s skin was already producing and exactly how much of it got trapped on the way to the surface, a small, essentially random variation in a process every fetus goes through. Two children from the same two parents can land on different sides of that variation the same way they can end up with different eye colors or different amounts of hair at birth.
A small irony sits in my own case. I grew up in Central Asia, not far at all from the region the outdated name technically points to, and my husband is Chilean, which puts a decent amount of Indigenous Latin American ancestry somewhere in our daughters’ family tree as well. Both backgrounds are commonly cited as ones where this mark shows up often. And it still only showed up in one of our two children. Shared ancestry raises the odds. It doesn’t hand down a guarantee, and it certainly doesn’t sort itself along any bloodline neat enough to make a good legend.
The part of this that actually matters for a new parent isn’t the legend, it’s a practical one: these marks are frequently mistaken for bruises, and that mistake has occasionally triggered real child-abuse investigations for entirely innocent families. Physicians have known about this risk for decades. Writing in the journal Contemporary Pediatrics back in 1999, a team of dermatologists advised that “to minimize confusion, it is wise to document the presence and location of Mongolian spots in the patient record,” so that a mark noted at birth doesn’t get mistaken for a fresh injury months or years later by someone seeing a child for the first time. Most hospitals do exactly this now as a matter of routine. It’s worth asking about if you notice one on your own newborn and nobody brings it up first.
No hidden meaning explains which of my daughters has the mark and which one doesn’t, no ancestral message waiting to be decoded. It’s melanocytes settling in slightly different places during two otherwise very similar pregnancies, nothing more mystical than that. What I do find worth sitting with is how easily a mark like that gets a legend attached to it, and how the real explanation, the quieter, more mechanical one, tends to arrive later and get repeated far less often. My older daughter’s mark is already noticeably lighter than it was a year ago. It will likely be gone before she’s old enough to ask me what it was, and when she does, I’d rather have the real answer ready than the one that just sounds better in a headline.
The post Some babies are born with a mysterious blue-grey mark across their lower back — a birthmark legend has linked to the descendants of Genghis Khan, but science offers a very different explanation for where it comes from. appeared first on Space Daily.