❌

Reading view

Search for Hidden Cosmic Companions in Sun’s Backyard

Some stars have planets. Others are orbited by brown dwarfs, balls of gas too massive to be planets, but too low-mass to be stars. Astronomers love these brown dwarf-star pairs because being paired with a star helps reveal a brown dwarf’s age. Ages of astronomical objects are often hard to measure, but essential for understanding how they form. 

Now, you can join NASA’s new Backyard Worlds: Binaries project and help astronomers discover these rare and interesting pairs. As a volunteer, you’ll inspect images from NASA’s Wide-field Infrared Survey Explorer (WISE) space telescope. Brown dwarfs may appear as small dots moving across a field of otherwise static stars. 

“We need your help to gain critical insights into these enigmatic cosmic objects,” said project lead Aaron Meisner.

Brown dwarfs are common but mysterious because they are so faint. There’s one for every three or four stars in our corner of the Milky Way galaxy. They are important laboratories for understanding giant planets like Jupiter.

Join the Backyard Worlds: Binaries project today and help astronomers understand where and when brown dwarfs form! You can also try one of our other brown dwarf-related projects: Backyard Worlds: Cool Neighbors! Anyone with a laptop or cell phone can participate. Participation does not require citizenship in any particular country.

Share

Details

Last Updated
Jun 18, 2026
Editor
NASA Science Editorial Team

The post Search for Hidden Cosmic Companions in Sun’s Backyard appeared first on NASA Science.

  •  

Search for Hidden Cosmic Companions in Sun’s Backyard

Some stars have planets. Others are orbited by brown dwarfs, balls of gas too massive to be planets, but too low-mass to be stars. Astronomers love these brown dwarf-star pairs because being paired with a star helps reveal a brown dwarf’s age. Ages of astronomical objects are often hard to measure, but essential for understanding how they form. 

Now, you can join NASA’s new Backyard Worlds: Binaries project and help astronomers discover these rare and interesting pairs. As a volunteer, you’ll inspect images from NASA’s Wide-field Infrared Survey Explorer (WISE) space telescope. Brown dwarfs may appear as small dots moving across a field of otherwise static stars. 

“We need your help to gain critical insights into these enigmatic cosmic objects,” said project lead Aaron Meisner.

Brown dwarfs are common but mysterious because they are so faint. There’s one for every three or four stars in our corner of the Milky Way galaxy. They are important laboratories for understanding giant planets like Jupiter.

Join the Backyard Worlds: Binaries project today and help astronomers understand where and when brown dwarfs form! You can also try one of our other brown dwarf-related projects: Backyard Worlds: Cool Neighbors! Anyone with a laptop or cell phone can participate. Participation does not require citizenship in any particular country.

Share

Details

Last Updated
Jun 18, 2026
Editor
NASA Science Editorial Team
  •  

Zooming In on Individual Lipid Transporters: A Closer Look

In the complex landscape of cellular biology, lipid transport stands as a fundamental process indispensable to life. All cells are enveloped by a thin, flexible membrane primarily composed of lipids, which not only serve as barriers but also actively participate in critical cellular functions. The transport of these lipids across membranes is orchestrated by specialized proteins, the lipid transporters, which facilitate the movement of lipid molecules from one side of the membrane bilayer to the other. This transport underpins a myriad of physiological activities, including the assembly and preservation of cellular membranes, lipid provision to mitochondria, and signaling pathways involved in programmed cell death. Despite its significance, the individual dynamics of lipid transport proteins have remained elusive due to limitations in traditional investigative methodologies.

Historically, investigations into lipid transporter proteins have utilized ensemble measurement techniques. These conventional methods analyze millions of protein molecules simultaneously, yielding averaged data that mask the heterogeneity among individual transporters. Consequently, the unique behaviors, efficiency rates, and mechanistic variations of single lipid transport proteins could not be discerned. Understanding these subtle distinctions is pivotal for unearthing nuanced cellular processes and developing targeted therapeutic interventions. Addressing this gap, an international cohort of researchers has pioneered a breakthrough technique leveraging highly sensitive imaging methodologies combined with high-throughput capabilities to observe and quantify the lipid transport activity of individual proteins in real-time.

Central to the research is the protein VDAC1 (Voltage-Dependent Anion Channel 1), which plays a crucial role in the delivery of lipids to mitochondria, thereby sustaining mitochondrial membrane integrity and function. Notably, VDAC1’s lipid transport activity is contingent upon its assembly into dimers—complexes formed by the pairing of two protein molecules. The novel imaging approach revealed a striking variability in the lipid transport efficiency among these dimers. Whereas some VDAC1 dimers were capable of translocating thousands of lipid molecules per second, others exhibited markedly reduced activity, and a subset appeared completely inactive. This individual-level heterogeneity, unnoticed in previous bulk assays, can be attributed to the specific spatial conformations that these dimers adopt, influencing their functional interfaces for lipid translocation.

This heterogeneity extends beyond mere functional curiosity; it introduces a paradigm shift in understanding membrane protein behavior, suggesting that protein complex formation—its precise structural arrangement—critically governs functional outcomes. Molecular dynamic simulations provided corroborative evidence, demonstrating that only particular dimer configurations furnish the optimal surface topology necessary for efficient lipid movement. These insights prompt a reevaluation of lipid transporter function that moves beyond static representations, embracing the dynamic and variable nature of protein assemblies in vivo.

The methodology that underpins these discoveries is itself a technical marvel. By employing a single vesicle fluorescence microscopy platform, the researchers can isolate individual liposomes encapsulating single protein entities. Fluorescent probes sensitive to lipid translocation allow precise quantification of scrambling events—a process by which phospholipids redistribute between the bilayer leaflets—on a vesicle-by-vesicle basis. This level of granularity affords unprecedented resolution in kinetic measurements, avoiding the artifacts inherent in bulk assays where asynchronous activity and averaged signals convolute interpretation.

Moreover, this platform’s versatility is notable. It is not confined to the study of VDAC1 but adaptable to a broad spectrum of lipid transporters implicated across diverse cellular pathways. By systematically altering membrane lipid compositions or introducing cofactors such as metal ions, researchers can dissect how microenvironmental factors influence transporter kinetics. This feature facilitates comprehensive structure-function analyses, enabling the delineation of regulatory mechanisms and potential modulatory elements affecting transport efficacy.

From a translational perspective, the implications of these findings are profound. Mitochondrial dysfunction underlies a constellation of pathologies ranging from metabolic disorders to neurodegenerative diseases and certain hematological conditions. Aberrant lipid transport may contribute to these dysfunctions by compromising membrane integrity or signaling fidelity. Enhanced comprehension of individual transporter behavior could usher in new diagnostic markers or therapeutic targets. For instance, modulating the assembly state or stabilizing the active dimer conformation of VDAC1 may represent novel strategies to restore or optimize mitochondrial lipid homeostasis.

Furthermore, the study’s insights into the variability of lipid transporters invite reconsideration of drug design paradigms. Rather than targeting proteins en masse, future pharmacological interventions might be tailored to influence specific functional states or conformers of lipid transport proteins, enhancing efficacy and minimizing off-target effects. Such precision medicine approaches would benefit immensely from platforms capable of high-resolution characterization as demonstrated here.

The scientific community also gains a powerful tool to unravel the complexities of lipid dynamics and membrane biology. By circumventing the averaging problem intrinsic to ensemble experiments, researchers can now observe phenomena such as transient conformational states, stochastic transport events, and cooperative interactions among protein assemblies. This deeper understanding is essential for decoding the lipid-mediated regulatory codes that orchestrate cellular responses to environmental cues and stressors.

Importantly, this research exemplifies the synergy between experimental innovation and computational modeling. The integration of single-molecule fluorescence microscopy with molecular simulations not only confirms empirical observations but also guides hypothesis generation and experimental design. Such interdisciplinary approaches are increasingly vital for tackling intricate biological questions that span scales from atomic-level interactions to cellular physiology.

Looking ahead, the deployment of this single-vesicle fluorescence microscopy platform promises to accelerate discoveries in membrane biology and lipid transport. As the method is refined and applied to other protein families, it may reveal fundamental principles governing membrane asymmetry, lipid signaling, and protein-lipid interplay. These explorations are key for elucidating cellular homeostasis and the pathological disruptions that lead to disease.

In conclusion, the unveiling of individual lipid transporter dynamics through advanced fluorescence microscopy heralds a new era in cellular biochemistry. This technological and conceptual advance provides a crucial lens to interrogate the heterogeneity and regulation of crucial transport proteins, broadening our understanding of lipid biology and opening avenues for targeted biomedical innovations that address mitochondrial health and related disorders.


Subject of Research: Cells
Article Title: A Single Vesicle Fluorescence Microscopy Platform to Quantify Phospholipid Scrambling
News Publication Date: 15-Jun-2026
Web References: https://doi.org/10.1038/s41594-026-01821-8
Image Credits: © Günther-Pomorski
Keywords: lipid transport, VDAC1, mitochondrial lipid supply, single vesicle microscopy, phospholipid scrambling, protein dimerization, membrane biology, fluorescence microscopy, lipid transporter heterogeneity, mitochondrial function, molecular simulation, cellular membranes

  •  

Trop risqué pour l’État ? La France remplace Palantir par un acteur français « méconnu »

La DGSI rompt avec son prestataire américain historique Palantir, 10 ans après les attentats du 13-novembre. Un virage stratégique qui fait également école outre-Rhin. Futura fait le point sur l'inquiétant géant américain Palantir et son remplaçant, le français ChapsVision encore inconnu du...

  •  

NASA’s Webb Catches Exoplanet Getting Roasted

 
4 Min Read

NASA’s Webb Catches Exoplanet Getting Roasted

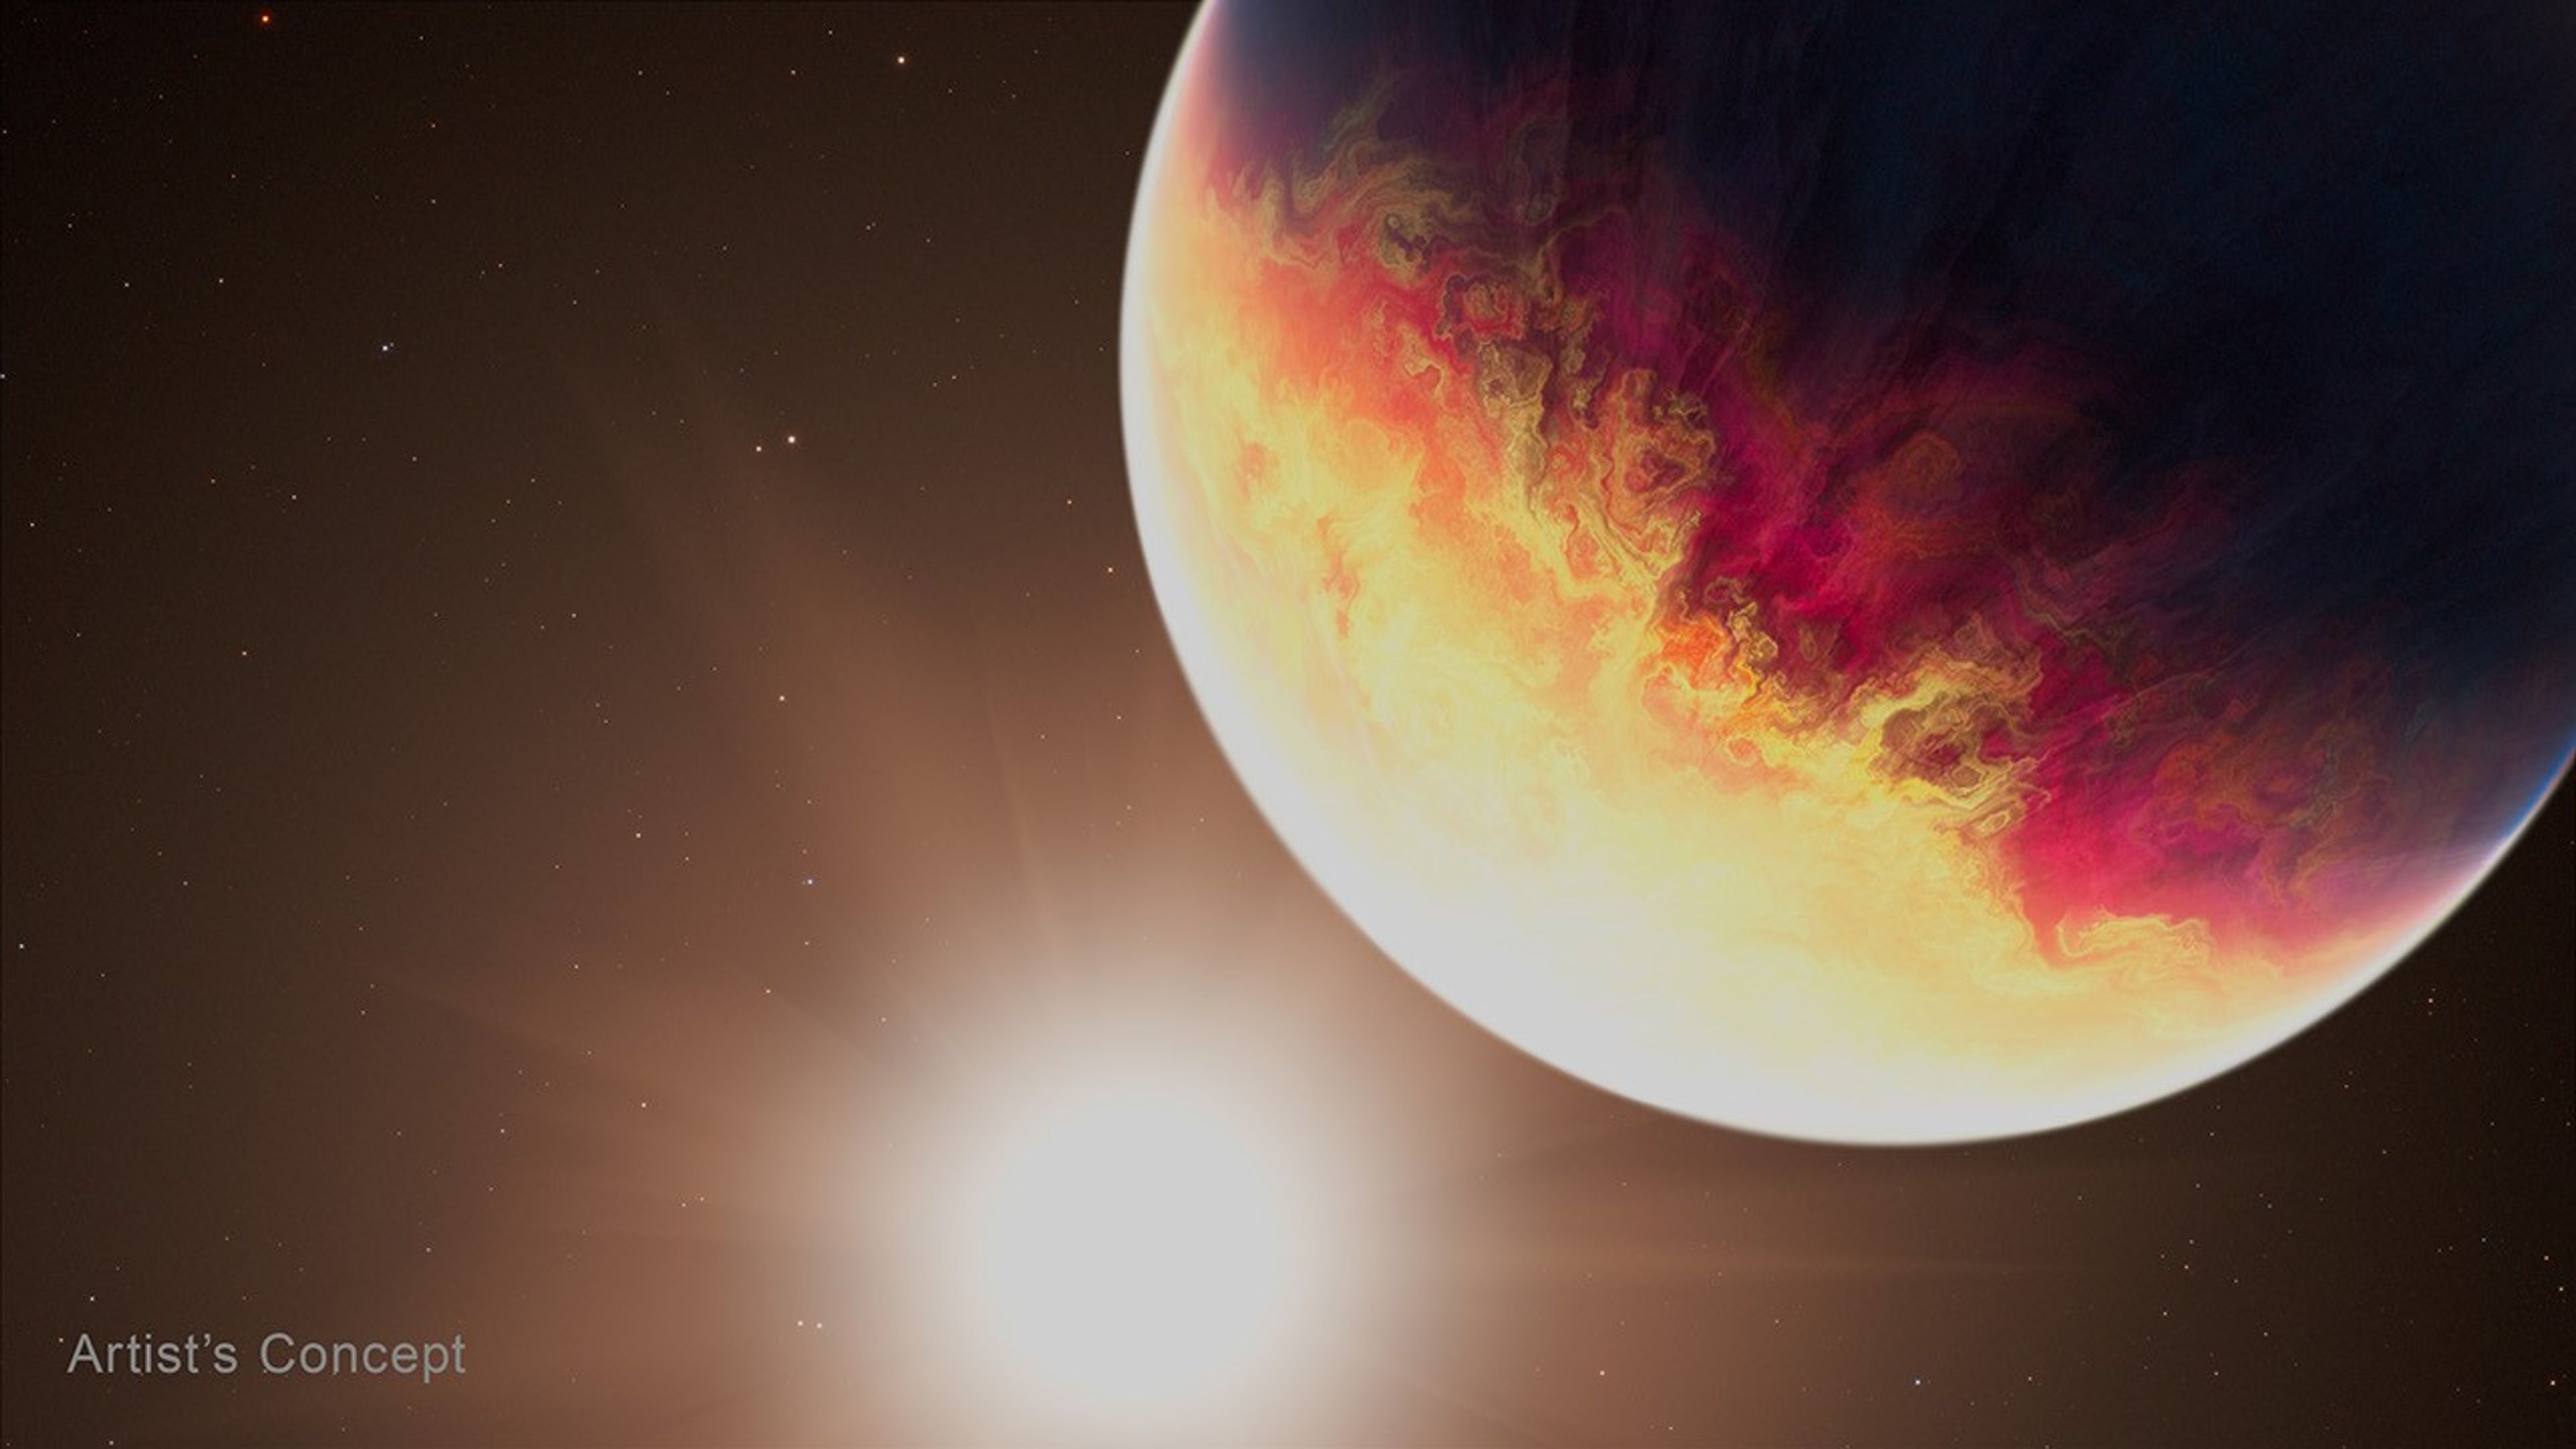
Illustration of a planet and a star, labeled artist’s concept at the bottom left. The planet fills more than a quarter of the image to the upper right, with the bright star to its lower left. The planet is white hot on the star side, fading to yellow that mixes with swirls of bright red across its middle, and eventually fading to black on the side most distant from the star. Distant stars dot the background of space, which is black near the edges of the frame.
This artist’s concept shows exoplanet HD 80606 b being “roasted” as its orbit approaches periastron, the point at which it is closest to its host star, which is similar to our Sun.
Credits:
Artwork: NASA, ESA, CSA, Joseph Olmsted (STScI)

4 min read

NASA’s Webb Catches Exoplanet Getting Roasted

One well-done gas giant, coming right up! That’s the latest from researchers analyzing NASA’s James Webb Space Telescope’s observations of HD 80606 b, an exoplanet four times the mass of Jupiter with an extremely elliptical orbit that sweeps close by its Sun-like star. The research team is presenting their study and preliminary findings Tuesday at the 248th meeting of the American Astronomical Society in Pasadena, California.

“Hot Jupiters are already considered some of the most extreme exoplanets we know of, but even among that population, HD 80606 b is one of the most extreme,” said Tiffany Kataria, the study’s principal investigator at NASA’s Jet Propulsion Laboratory in Southern California. “We typically think of hot Jupiters as hot gas giants sitting right next to their stars, but this planet’s highly eccentric orbit creates a completely different beast.”

As the planet plunges close to its star, Webb shows its temperature skyrockets by 1,100 degrees Fahrenheit. Previous studies have shown that radical temperature swings can cause an exoplanet’s chemistry and clouds to change in real time. According to the research team, the dynamic conditions of HD 80606 b make the planet an ideal target to observe these changes with Webb’s powerful instruments.

Image: Artist’s concept exoplanet HD 80606 b

Illustration of a planet and a star, labeled artistu2019s concept at the bottom left. The planet fills more than a quarter of the image to the upper right, with the bright star to its lower left. The planet is white hot on the star side, fading to yellow that mixes with swirls of bright red across its middle, and eventually fading to black on the side most distant from the star. Distant stars dot the background of space, which is black near the edges of the frame.
This artist’s concept shows exoplanet HD 80606 b being “roasted” as its orbit approaches periastron, the point at which it is closest to its host star, which is similar to our Sun.
Artwork: NASA, ESA, CSA, Joseph Olmsted (STScI)

“Observing a planet like HD 80606 b is actually very efficient because its unusual orbit, with the corresponding swings in temperature and chemical composition, allow us to gather data under varying conditions in just hours and apply those findings to other hot Jupiters or more conventional exoplanets,” said Laura C. Mayorga, co-investigator on the study and an exoplanet astronomer at the Johns Hopkins Applied Physics Laboratory in Laurel, Maryland.

Measurements of temperature and chemical composition were done with spectroscopy, a technique scientists use to break light into its component colors to reveal information about the composition, temperature, motion, and physical properties of objects in space. The team used Webb’s MIRI (Mid-Infrared Instrument) for an extended observation of HD 80606 b before, during, and after its periastron, or closest pass by its star. During periastron, the planet also passed behind the star from Webb’s perspective in what’s known as a secondary eclipse. The observation was years in the planning, as scheduling the time to catch the planet at this point was complex given its extremely elliptical 111-day orbit, and Webb’s own restrictions on where it can look during specific times of the year, based on Earth’s position in orbit around the Sun.

Researchers say they have only begun to peel back the layers of an incredibly rich dataset, but they can clearly see a dramatic shift in the exoplanet’s temperature. “Webb has shown that the planet’s increase in temperature was even more extreme than we anticipated based on Spitzer data,” said Kataria.

In fact, the planet had already been dubbed the “roasted exoplanet” and even got its own poster in NASA’s popular series. NASA’s now-retired Spitzer Space Telescope laid the groundwork of infrared observations of HD 80606 b, showing that more detailed spectroscopic data from Webb would be especially compelling.

“Spitzer did amazing work on this exoplanet, and now Webb is building on that legacy by enabling us to drill down to distinguish specific chemical signatures like methane and carbon dioxide, which is just amazing progress,” said Ryan Challener, co-author and research associate at the Cornell Center for Astrophysics and Planetary Science. “There’s so much to learn from this one dataset here — we really are just getting started deciphering what Webb has to tell us.”

The James Webb Space Telescope is the world’s premier space science observatory. Webb is solving mysteries in our solar system, looking beyond to distant worlds around other stars, and probing the mysterious structures and origins of our universe and our place in it. Webb is an international program led by NASA with its partners, ESA (European Space Agency) and CSA (Canadian Space Agency).

For more information on Webb, visit:

science.nasa.gov/webb

Downloads & Related Information

The following sections contain links to download this article’s images and videos in all available resolutions followed by related information links, media contacts, and if available, research paper and Spanish translation links.

Related Images & Videos

Illustration of a planet and a star, labeled artistu2019s concept at the bottom left. The planet fills more than a quarter of the image to the upper right, with the bright star to its lower left. The planet is white hot on the star side, fading to yellow that mixes with swirls of bright red across its middle, and eventually fading to black on the side most distant from the star. Distant stars dot the background of space, which is black near the edges of the frame.

HD 80606 b (Artist’s Concept)

This artist’s concept shows exoplanet HD 80606 b being “roasted” as its orbit approaches periastron, the point at which it is closest to its host star, which is similar to our Sun.

Related Links

Este Artículo en Español – “Telescopio Webb de la NASA Detecta un Exoplaneto Asandose”

Read:  Webb’s Impact on Exoplanet Research

Watch:  How to Study Exoplanets: Webb and Challenges

Explore:  Eyes on Exoplanets

Print: The Roasted Exoplanet Poster

More Webb: News | Images | Science | Home Page


Share

Details

Last Updated
Jun 17, 2026
Contact
Media

Laura Betz
NASA’s Goddard Space Flight Center
Greenbelt, Maryland
laura.e.betz@nasa.gov

Leah Ramsay
Space Telescope Science Institute
Baltimore, Maryland

Hannah Braun
Space Telescope Science Institute
Baltimore, Maryland

  •  

NASA Uses Machine Learning to Enhance Flash Flood Warnings

The Transient Artifact and Continuous Learning System (TACLS) leverages data from continuously operating satellite networks coupled with machine learning models to help meteorologists at the National Weather Service forecast flash floods more efficiently. This new software is the result of a collaboration between NASA’s Jet Propulsion Laboratory, the University of California, San Diego (UCSD), and the National Oceanic and Atmospheric Administration (NOAA) National Weather Service (NWS).

A visual analysis from a TACLS test prediction run using data from flash floods the week of Christmas, 2025. The image shows flash flood warning (FFW) probabilities generated by TACLS (in shades of red) and overlaid on areas that received flash flood warnings from the National Weather Service (in blue).
Credit: UCSD Scripps Institution of Oceanography

Created with support from NASA’s Earth Science Technology Office (ESTO), TACLS leverages machine learning to automatically locate evidence (unusual increases in atmospheric moisture) of impending flash flooding that meteorologists may otherwise miss as they analyze large amounts of data. TACLS flags that evidence, indicates where flash flooding could likely occur, and displays that information via a user-friendly visualization for human analysts to interpret. Those analysts can then decide whether to issue a flash flood warning or weather advisory.

This novel framework for tracking extreme weather events and predicting imminent flash floods operates in near real-time, producing forecasts in as little as fifteen minutes.

“That’s really what we wanted to do, to give meteorologists a tool to help decision making for flash flood warnings,” said Yehuda Bock, Distinguished Researcher at the UCSD Scripps Institution of Oceanography and principal investigator for TACLS.

In simulations testing, TACLS used data from diverse severe weather events—including atmospheric rivers, monsoonal convection, and tropical cyclone remnants—between 2017 and 2023 and successfully captured 93% of the issued flash-flood warnings. Meteorologists from the National Weather Service are currently working to incorporate TACLS into their existing systems for forecasting flash floods in Southern California.

A cyclone makes landfall across the California coast on November 19, 2024. TACLS will help give communities more time to prepare for impending severe weather.
Credit: NASA

This learning system has two main components. First, an analytic back-end software suite uses machine learning algorithms to process satellite data and determine areas at risk for flooding. Second, user-friendly visualization software highlights those areas for further analysis by humans.

The ACLS back-end software analyzes data from satellites in the Global Navigation Satellite System (GNSS), a constellation of satellite networks that drive navigation services around the world. Water vapor in the troposphere delays signals from these satellites as they travel to Earth. This signal delay can be analyzed to calculate the amount of water vapor in the atmosphere over a particular location on Earth.

The TACLS analytic back-end software suite features a machine learning model trained using more than 30 years of past GNSS data. This model is an anomaly detector that tracks unusual increases in atmospheric moisture. The model then carefully examines that atmospheric moisture data and determines whether it’s either an artifact (a false feature or distortion in the data) or a transient (a time-sensitive physical event, like heavy precipitation) that requires interpretation by human analysts.

If TACLS determines the data represents a transient, such as an extreme weather event that warrants a flash flood warning, it will forward that data to the TACLS visualization software (MGViz) for further evaluation by humans. The analysts use their judgement and experience to interpret these events and determine whether the flagged data indicates a flash flood is likely, and, if necessary, issue a flash flood warning.

Several past innovations developed at JPL are leveraged by TACLS to process GNSS data and present the results. The analytic back-end software suite incorporates elements from JPL’s Domain-agnostic Outlier Ranking Algorithms program and the Time-series Forecasting, Evaluation, and Deployment program. The TACLS visualizer is based on the Multi-Mission Geographic Information System, originally developed at JPL for NASA’s Mars missions.

The TACLS software binds all these components within a novel system that enhances existing methods to reduce the amount of time it takes for a human analyst to determine whether to issue a flash flood warning.

Both the TACLS software and the data used to train it will be open-source, allowing scientists to either tailor this model in response to their unique research needs or create their own model from scratch.

For additional details, see the entry for this project on NASA TechPort. 

Project Lead: Dr. Yehuda Bock, University of California, San Diego. 

Sponsoring Organization(s): NASA’s Earth Science Technology Office Advanced Information Systems Technology Program; JPL; NOAA; National Weather Service. 

The post NASA Uses Machine Learning to Enhance Flash Flood Warnings appeared first on NASA Science.

  •  

Backyard Worlds: Binaries

Backyard Worlds: Binaries

Most stars in our Milky Way galaxy exist in groups, including pairs or “binaries,” in which two stars orbit each other. Some binaries are stars paired with brown dwarfs, balls of gas more massive than planets without enough mass to sustain nuclear fusion. Finding brown dwarfs in pairs helps scientists deduce their ages and origin stories! Backyard Worlds: Binaries invites you to search images made by NASA’s Wide-field Infrared Survey Explorer (WISE) space telescope to find these vital brown dwarfs in binary systems. Your discoveries will teach us about brown dwarf formation and identify objects that resemble giant planets like Jupiter.
Go to Project Website about Backyard Worlds: Binaries

project task

Examining Images

division

Astrophysics

where

Online

launched

2026

Illustration showing a large, dark red gas‑giant–like world in orbit with a white dwarf shown as a bright white dot. The bright band of the Milky Way stretching across the star‑filled background.
Artist’s rendition of a brown dwarf orbiting a white dwarf (the bright white circle) with the Milky Way in the background.
 NOIRLab/NSF/AURA/P. Marenfeld

What you’ll do

  • Learn how to recognize binary systems and brown dwarfs in images made by NASA’s WISE space telescope. 
  • Click buttons to indicate whether or not they contain binaries. If you see a binary, click a button to indicate whether or not it includes a brown dwarf. Review as many image sets as you like, 
  • If you want to, you can discuss what you have found with other volunteers and scientists in the Talk forum.

Requirements

  • Time: 5-15 minutes to complete the tutorial
  • Equipment: Web-connected device.
  • Knowledge: None. In project tutorial provides all instruction needed.

Get started!

  1. Visit the project website.  
  2. Complete the in-project tutorial to learn how to spot binary systems in short animations of WISE data.
  3. Start identifying candidate binary systems containing a brown dwarf, using a Field Guide reference as necessary.

Learn More

The Backyard Worlds: Binaries Research page gives an overview of the research being pursued and its value towards expanding what we know about how star and planetary systems form. Links throughout this page take the reader to additional sources of information. The Frequently Asked Questions (FAQs) page has additional information relevant to the work of the project. 

You might also like to try Backyard Worlds: Cool Neighbors and Backyard Worlds: Planet 9!

A vibrant logo set against a starry space background. In the center is a colorful, striped planet featuring shades of blue, green, and pink, surrounded by a glowing orange-red ring. A white silhouette of a telescope on a tripod points up toward the planet. Arcing above the planet is the text "BACKYARD WORLDS:" in white, blue-outlined letters. Arcing below is the word "BINARIES" in large, stylized red bubble letters on a white, cloud-like background.

Looping side‑by‑side animation showing two sky images: the original WISE sky view on the left and processed images on the right. Pixelated points labeled as M‑dwarf stars shift position between frames, illustrating how subtracting sequential images reveals moving objects.
Animated images from the Backyard Worlds: Binaries project showing two distinct “dipoles” – single objects moving through space – that appear to be moving together. These dipoles “flip” together, indicating that they are moving in the same direction.
Backyard Worlds: Binaries WISE data.

Get to know the people of Backyard Worlds: Binaries!

Mei Lin

Intern, undergraduate student
Harvard University

Portrait photo of a man wearing a blue shirt and blazer

Aaron Meisner

Staff Astronomer
NSF’s NOIRLab and Harvard University

Zachary Hartman

NASA Postdoctoral Fellow
NASA Ames Research Center

Austin Rothermich

Graduate Student
City University of New York and American Museum of Natural History

Portrait photo of a woman with long curly hair

Jackie Faherty

Astrophysicist / Scientist at American Museum of Natural History

Adam Schneider

United States Naval Observatory

Portrait photo of a smiling man

J. Davy Kirkpatrick

Astronomer, Infrared Processing and Analysis Center (IPAC) at the California Institute of Technology 

Portrait photo of a bearded young man

Dan Caseldon

Citizen scientist and Research Associate, American Museum of Natural History

Arjun Dey

Astronomer, NSF’s NOIRLab 

John Gizis

Observational Astronomer, University of Delaware

The post Backyard Worlds: Binaries appeared first on NASA Science.

  •  

Hubble Sees Swarm of Galaxies

2 min read

Hubble Sees Swarm of Galaxies

Numerous galaxies dot the scene and appear to cluster around the image center. The view includes large elliptical galaxies along with spiral and lenticular galaxies. Faint arcs of distant galaxies gravitationally lensed by the cluster appear in the upper-right quadrant of the image. A couple of foreground stars are also visible and easily distinguished by their diffraction spikes.
This NASA Hubble Space Telescope image features the galaxy cluster MACS0329-0211.
NASA, ESA, M. Postman (STScI); Image Processing: G. Kober (NASA/Catholic University of America)

Looking somewhat like a swarm of bees returning to their hive, this NASA Hubble Space Telescope image features the galaxy cluster MACS0329-0211. Galaxy clusters like MACS0329-0211 are important signposts in the story of how the structure of the universe evolved, and are the ultimate telescopic lenses, placing gravitationally lensed galaxies from the earliest stages of the universe into our view.

Zoom into this galaxy swarm and you will find large, oval-shaped elliptical galaxies, and thin spiral and lenticular galaxies viewed from the edge. We can also see the full, face-on view of spiral galaxies and their curving spiral arms. The image’s upper-right quadrant holds faint arcs of distant galaxies gravitationally lensed by the cluster’s massive gravity. The largest of these arcs appears above the bright oval shape of a giant elliptical galaxy. Closer inspection of the image’s center reveals several bright-white intersecting curves that appear as a distorted figure eight. This may be another distant galaxy whose light was magnified and distorted by this massive cluster’s gravity.

Hubble looked at MACS0329-0211 as part of an observing program of X-ray bright galaxy clusters. Researchers used Hubble’s two main cameras, the Advanced Camera for Surveys and its Wide Field Camera 3, to gather data visible and infrared light from the cluster. Hubble’s ability to see such a broad spectrum of light makes it a valuable tool in understanding the very nature of these galaxy clusters.

Media Contact:

Claire Andreoli
NASA’s Goddard Space Flight Center, Greenbelt, MD
claire.andreoli@nasa.gov

The post Hubble Sees Swarm of Galaxies appeared first on NASA Science.

  •  

Parker Solar Probe Makes 28th Close Pass of Sun

NASA’s Parker Solar Probe completed its 28th close approach to the Sun on June 8, again matching its record distance of 3.8 million miles from the solar surface. The flyby allowed the spacecraft to continue its measurements of the solar wind and solar activity at their source, while adding to our understanding of how the Sun’s atmosphere changes throughout the solar cycle.

The spacecraft checked in with flight controllers at the Johns Hopkins Applied Physics Laboratory (APL) in Laurel, Maryland — where Parker Solar Probe was designed and built — on Thursday, transmitting a beacon tone that indicated its systems were operating normally. Zooming around the Sun on a trajectory that limited communications with Earth, Parker had been out of contact and operating autonomously for nine days around its closest approach, as planned.
 
During this solar encounter, which started June 3 and ends Saturday, June 13, Parker’s four scientific instrument packages gathered data from inside the Sun’s atmosphere, or corona. Parker will begin returning detailed spacecraft telemetry on June 14, with science data transmission set to run from Wednesday, June 17 to Tuesday, June 30.
 
Parker’s observations of the solar wind and solar events, such as coronal mass ejections and the aftermaths of flares, are critical to advancing humanity’s understanding of the Sun and the phenomena that drive high-energy space weather events that pose risks to astronauts, satellites, air travel, and even power grids on Earth. Understanding the fundamental physics of space weather enables more reliable prediction of astronaut safety during future deep-space missions to the Moon and Mars.
 
Parker also equaled its record-setting speed of 430,000 mph — a mark that, like Parker’s distance to the Sun, was set during a close approach on Dec. 24, 2024, and matched during five flybys since, most recently on March 11. Parker will continue matching these speed and distance records during future flybys.
 
Through all six close approaches, mission leads say, the spacecraft has remained in excellent condition. While Parker doesn’t have a temperature sensor on the front of its heat shield — known as the Thermal Protection System, or TPS — the team can estimate through models that the heat shield reaches temperatures of about 1,700 degrees Fahrenheit at closest approach.

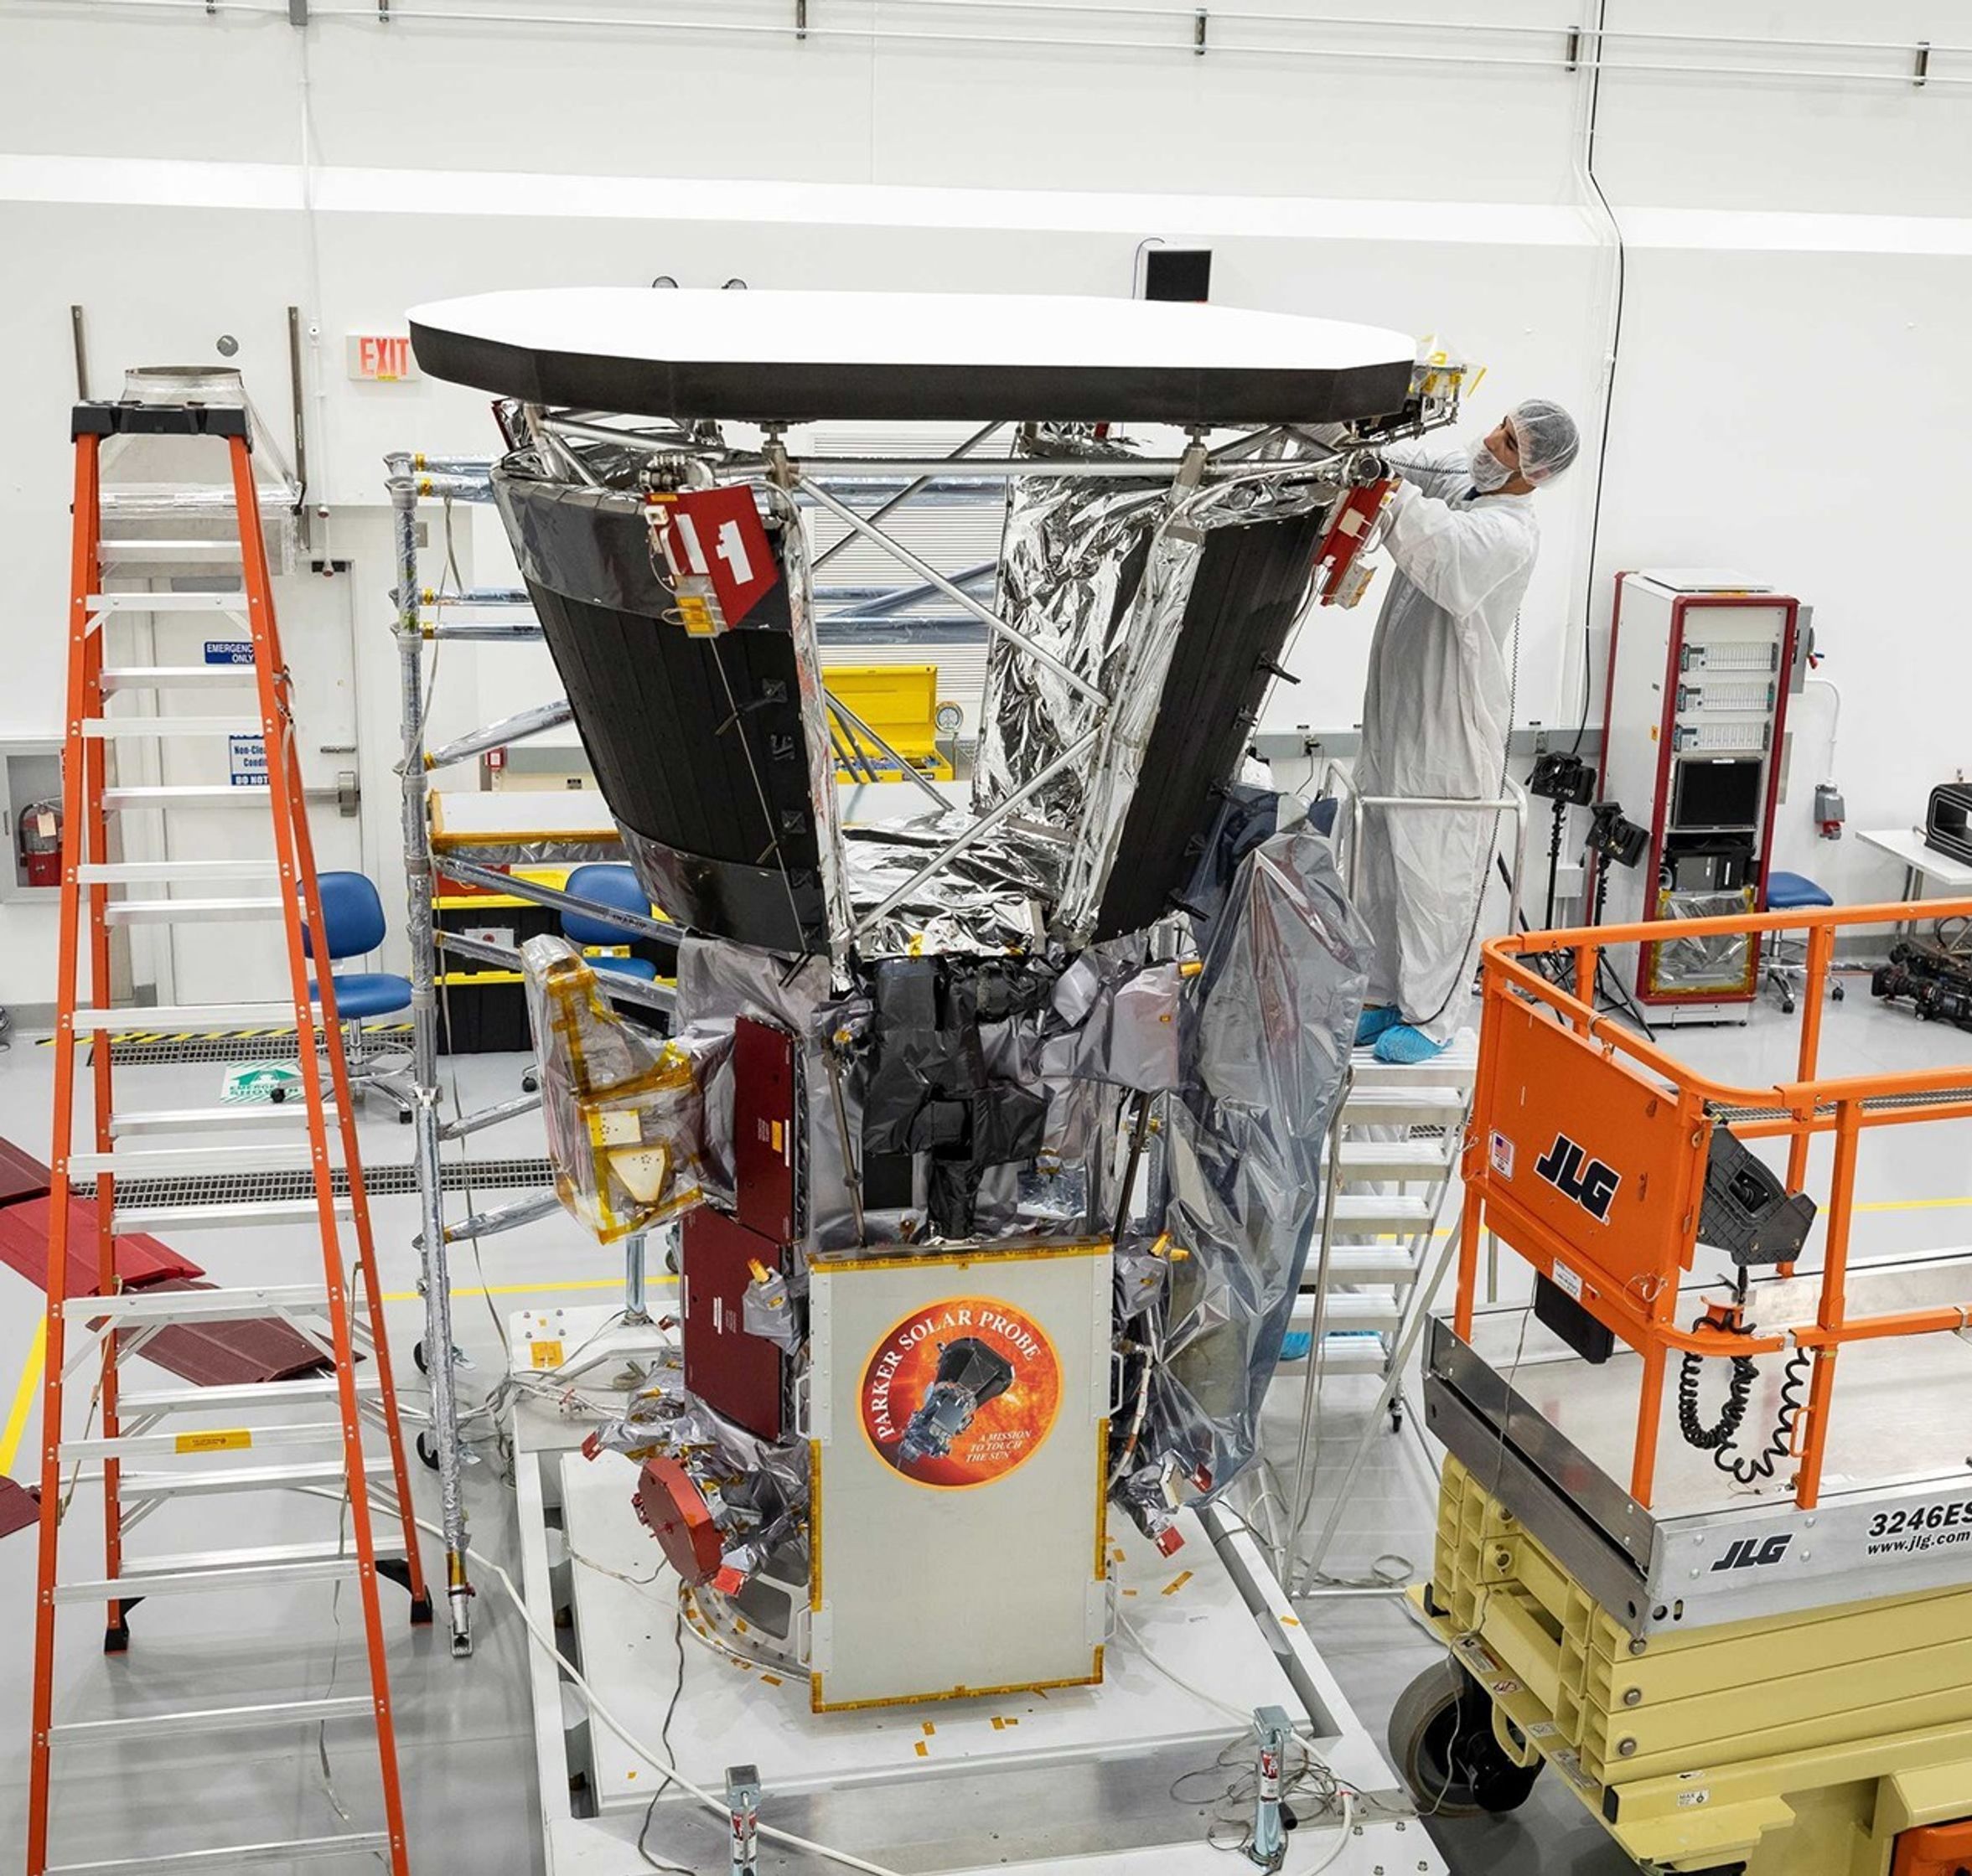
An image of a spacecraft in the center of the photo, with an orange round sticker on the bottom of the spacecraft, identifying it as Parker Solar Probe. A person in a clean-room outfit, right, is installing black thermal shield panels on the spacecraft.
In this image from June 2018, about two months before Parker Solar Probe’s launch, technicians put the final touches on the thermal blankets below the spacecraft’s signature heat shield, the Thermal Protection System (TPS). After nearly eight years in space and through 28 solar en-counters, the TPS remains in excellent condition, even after withstanding temperatures of about 1,700 degrees Fahrenheit during its closest approaches to the Sun.
NASA/Johns Hopkins APL/Ed Whitman

“The heat shield material is incredibly light and fragile, but the thermal design, as well as the software that keeps the spacecraft pointing the TPS toward the Sun, have been outstanding,” said John Wirzburger, Parker Solar Probe mission systems engineer at APL. “It’s a real tribute to the team that designed, built, and operates Parker Solar Probe.”
 
Meanwhile, the team can measure the temperature of the barrier blanketing below the heat shield, and the actual spacecraft temperature has remained consistent on each pass.
 
“That temperature consistency is a major indicator of spacecraft health,” said Wirzburger. “It tells us the heat shield isn’t degrading. If it were cracking or weakening, we’d see temperatures drift upward as more heat leaked through.”
 
Parker launched in August 2018. At the time, the Sun was near the minimum of its 11-year activity cycle. In 2024, representatives from NASA, the National Oceanic and Atmospheric Administration (NOAA), and the international Solar Cycle Prediction Panel announced that the Sun had reached its solar maximum period. Parker’s 28 encounters with the Sun reflect this change over time, sampling the Sun’s atmosphere from quiet to very active periods. Parker Solar Probe will remain in this orbit around the Sun and continue making observations into the declining phase of solar activity.
 
The next steps for the mission in late 2026 and beyond are under NASA review.
 
Parker Solar Probe was developed as a part of NASA’s Living With a Star (LWS) program to explore aspects of the Sun-Earth system that directly affect life and society. The LWS program is managed by the agency’s Goddard Space Flight Center in Greenbelt, Maryland, for NASA’s Science Mission Directorate in Washington. Johns Hopkins APL manages Parker Solar Probe for NASA and designed, built, and now operates the mission.
 
Mike Buckley, Johns Hopkins Applied Physics Laboratory

The post Parker Solar Probe Makes 28th Close Pass of Sun appeared first on NASA Science.

  •  
❌