❌

Reading view

Près d'un Français sur deux utiliserait déjà l'IA au quotidien et voici les usages qu'ils en font

Deux heures récupérées chaque semaine, des courses faites automatiquement, une recherche d'appartement pilotée par un bot : l'IA s'installe dans le quotidien des Français à une vitesse surprenante. Près d'un Français sur deux y recourt déjà régulièrement. Mais jusqu'où peut-on lui faire...

  •  

Tiny Genetic Change Turns Female Mice Into Males, Scientists Discover

X Chromosome DNA StrandA new study reveals that an extremely small change in a non-coding region of DNA can dramatically alter how sex develops in mice. How much can a single letter of DNA matter? According to new research from Bar-Ilan University, one misplaced genetic “letter” can completely change the course of sexual development. In a study published [...]
  •  

NASA encerra a missão MAVEN depois de mais de 11 anos a estudar a atmosfera de Marte

A sonda MAVEN, lançada em 2013 e ativa durante uma década além da sua missão original de apenas um ano, deixou de responder em dezembro após uma rotação inesperada que esgotou as baterias. O painel de revisão da NASA concluiu que a sonda é irrecuperável.

The post NASA encerra a missão MAVEN depois de mais de 11 anos a estudar a atmosfera de Marte appeared first on Tek Notícias.

  •  

Il misterioso Vetro del Deserto Libico, un materiale giallo sparso tra Egit…

Il misterioso Vetro del Deserto Libico, un materiale giallo sparso tra Egitto e Libia e formatosi circa 29 milioni di anni fa, continua a sfidare gli scienziati. Un nuovo studio ha scoperto al suo interno una minuscola struttura di zircone con una rara forma dendritica, simile a un albero, che sembra essersi formata dopo la […]
  •  

Lo studio pubblicato sulla rivista Palaeontology descrive Praearcturus, uno…

Lo studio pubblicato sulla rivista Palaeontology descrive Praearcturus, uno scorpione gigante vissuto circa 415 milioni di anni fa, nel periodo Devoniano, nelle aree che oggi corrispondono a Inghilterra e Galles. Con una lunghezza superiore a 90 centimetri e chele di circa 15 centimetri, è considerato il più grande scorpione fossile conosciuto. Le sue chele erano […]
  •  

Museu virtual convida a uma viagem pelos computadores “vintage”

Ainda se lembra de usar a linha de comando, e das cores dos sistemas operativos antigos? No Virtual OS Museum pode recuperar a nostalgia dos antigos mainframes e dos primeiros computadores pessoais, mas também dos sistema para telemóveis.

The post Museu virtual convida a uma viagem pelos computadores “vintage” appeared first on Tek Notícias.

  •  

Penser l’intelligence artificielle autrement, par Jean-Claude Heudin

Régulièrement, je vais publier ici, sur Futura, un court article sur l'intelligence artificielle ou sur un sujet scientifique qui me tient à cœur. Aujourd'hui : la voie empruntée pour l’intelligence artificielle par les géants de la tech est-elle la seule possible ?

  •  

Garder le lien avec ses proches à l’international : Lebara 250 Go simplifie les communications

Garder le contact avec ses proches à l’étranger est devenu un réflexe du quotidien. Appels réguliers, messages instantanés, appels vidéo… la distance ne suffit plus à rompre le lien, mais encore faut-il disposer d’un forfait capable de suivre le rythme. Entre les usages qui explosent et les...

  •  

Toyzie: aponte a câmara a um brinquedo e a IA diz-lhe quanto vale

Com recurso a inteligência artificial, o Toyzie identifica Hot Wheels, figuras de ação, Funko Pops, cartas TCG e muito mais, e diz-lhe, em segundos, o que tem na coleção e quanto vale cada peça no mercado atual.

The post Toyzie: aponte a câmara a um brinquedo e a IA diz-lhe quanto vale appeared first on Tek Notícias.

  •  

Hints for Massive Galaxy Evolution from Dusty Star-Forming Galaxies

NGC 972

How do massive galaxies form and evolve? A recent study traces the stellar and dust distributions across evolutionary phases of massive galaxies to better understand how massive dusty star-forming galaxies fit into the picture.

Dusty Massive Galaxies

Massive galaxies, like the Milky Way or even larger, undergo phases of active star formation and quiescent phases of inactivity, but exactly how these galaxies evolve through these stages is not yet fully understood. Dusty star-forming galaxies, which are undergoing a period of intense star formation and shrouded in dust, might be the missing evolutionary step between star-forming and quiescent phases of massive galaxy evolution. 

Currently, the leading explanation for massive galaxy formation and evolution is inside-out growth — star formation and quenching start in the inner regions of a galaxy and progress outward. However, it’s not clear whether dusty star-forming galaxies also follow the favored inside-out pathway, or if they instead proceed outside-in, first growing their disks and then assembling a central bulge.

JWST NIRCam images

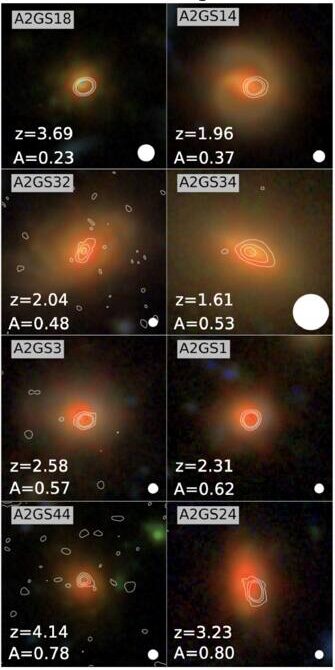
Example of JWST NIRCam images with ALMA contour lines overlaid for select dusty star-forming galaxies in the sample. [Modified from Bodansky et al 2026]

The spatial distribution (or morphology) of the stars and dust within dusty massive galaxies can help us trace their evolution. Thanks to high-resolution observations from JWST and the Atacama Large Millimeter/submillimeter Array (ALMA), researchers can now directly compare the morphologies of distant star-forming, quiescent, and dusty galaxies during the height of our universe’s star formation. Filling this gap will reveal how dusty star-forming galaxies may connect star-forming and quiescent galaxies in massive galaxy evolution.

Multiwavelength Morphological Comparisons

To directly compare the star and dust morphologies across massive galaxies, Sarah Bodansky (University of Massachusetts, Amherst) and collaborators selected a sample of 33 dusty star-forming galaxies from the GOODS-ALMA 2.0 survey that searched the sky for 1.1-mm dust emission as well as star-forming and quiescent comparison samples drawn from JWST observations. Combining the ALMA survey data with JWST imaging, the authors studied the rest-frame optical (stars) and rest-frame near-infrared (dust) morphologies of dusty, star-forming, and quiescent galaxies at redshifts around cosmic noon (a few billion years after the Big Bang).

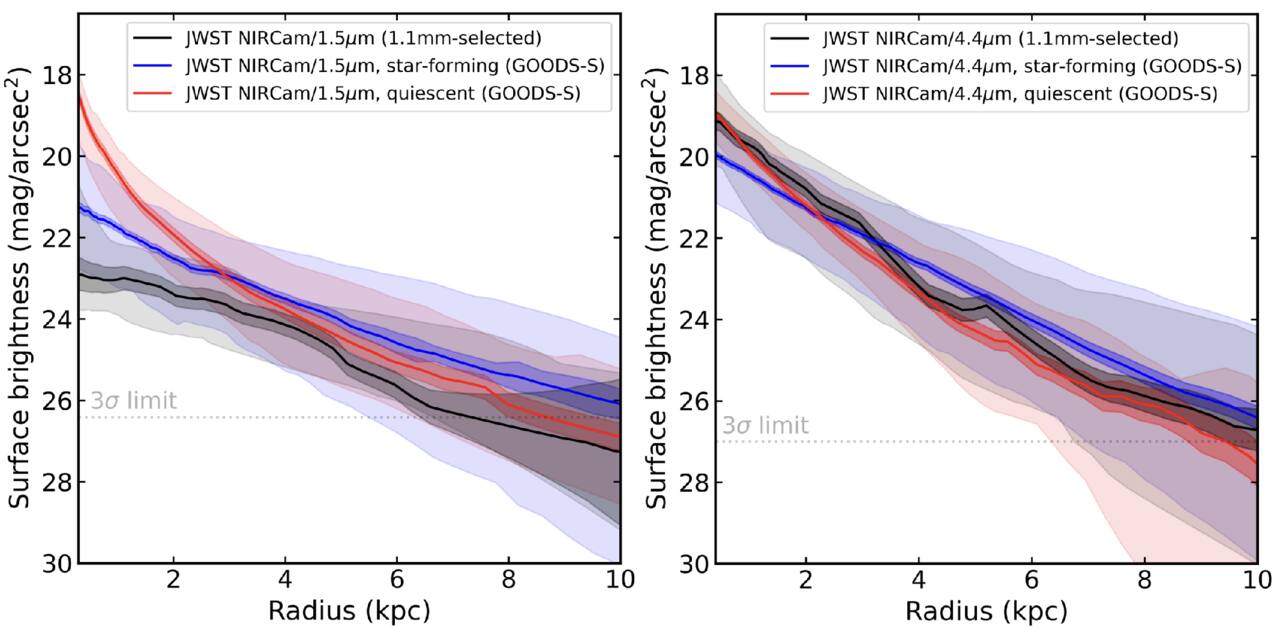
When comparing optical morphologies, the authors found that dusty star-forming galaxies and typical star-forming galaxies had similar distributions, but their near-infrared morphologies showed clear differences. Dusty galaxies tended to show more compact near-infrared emission, with dust tracing their stellar populations and more concentrated in the galaxies’ central regions. Though clearly different from star-forming galaxies, the authors noted striking similarities between the near-infrared morphologies of the dusty star-forming and quiescent galaxies, especially within their centers.

Surface brightness profiles

Average surface brightness profiles for the rest-optical (left) and rest-near-infrared (right) for the dusty (black), star-forming (blue), and quiescent (red) galaxies. In the near-infrared, the dusty star-forming galaxy profile appears very similar to the quiescent galaxy profile. [Bodansky et al 2026]

All of these properties suggest that dusty star-forming galaxies have built up stellar mass and dust in their cores, potentially forming a central bulge first and supporting an inside-out model of massive galaxy growth. This points to dusty star-forming galaxies as possible direct progenitors of early massive quiescent galaxies, hanging onto their last bit of star formation before becoming quiet as well. While this study morphologically distinguishes dusty galaxies from their star-forming and quiescent counterparts, future spectroscopic studies comparing the kinematics of these populations and investigations of molecular gas distributions are necessary to better pin down the evolutionary connection between star-forming, dusty, and quiescent massive galaxies.

Citation

“JWST+ALMA Reveal the Buildup of Stellar Mass in the Cores of Dusty Star-forming Galaxies at Cosmic Noon,” Sarah Bodansky et al 2026 ApJ 1001 235. doi:10.3847/1538-4357/ae4f64

The post Hints for Massive Galaxy Evolution from Dusty Star-Forming Galaxies appeared first on AAS Nova.

  •  

A New View of the Spectroscopic Universe

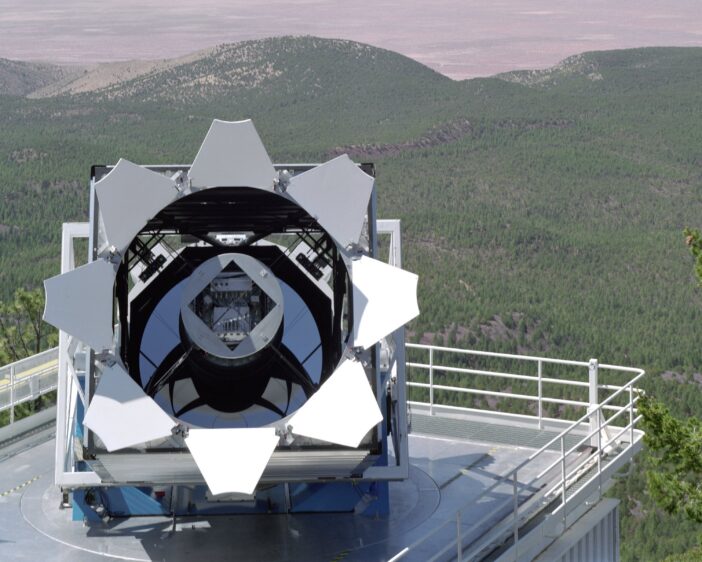
A photograph of a telescope opened at dusk.

The Sloan Digital Sky Survey (SDSS) fundamentally changed the way modern astronomy research is done. This “grand and bold thing” is not frozen in a museum exhibit, however: instead, the SDSS telescopes and team have continued to iterate. The collaboration recently described the fifth generation of this groundbreaking survey in The Astronomical Journal.

Roots in History

Astronomy is now without question a “big data” science. While a lucky few researchers still occasionally travel to distant mountaintops to sojourn with the stars, most astronomers who can describe their work as “observational” rarely ever leave their laptops. Petabytes of historical data, including images, spectra, enormous simulation archives, and more, are available the instant one’s fingers touch a keyboard. As a result, the speed of discovery has increased exponentially, and the barriers to cutting-edge research have dramatically shrunk.

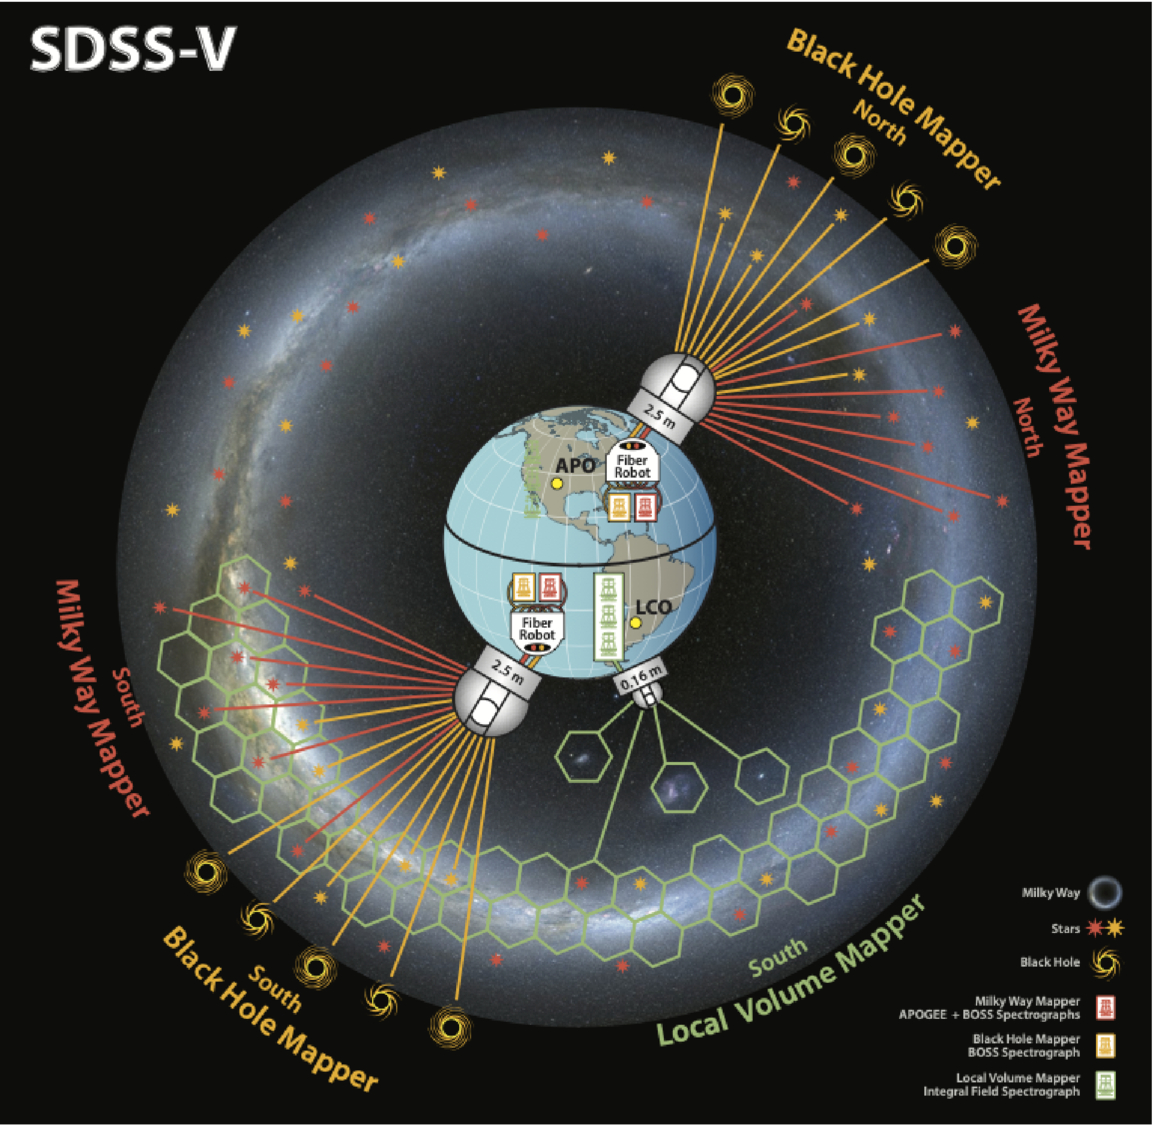
A cartoon of the Earth with three telescopes roughly geographically distributed as they are for the SDSS V survey.

A schematic of the SDSS-V survey facilities and targets. Click to enlarge. [Kollmeier et al. 2026]

While no paradigm shift can be pinned to an exact date, astronomy’s turn towards the data-rich era arguably began in 1998 when SDSS first began collecting data. This was among the first of the “industrial” surveys that observed large swaths of the sky with electronic detectors and used automated pipelines for bulk data processing. In the years since, larger robotic telescopes have begun to mimic the SDSS strategy of “mowing the sky.” The latest of these successors, which itself may usher in another paradigm shift in terms of data volume and availability, is the soon-to-begin Legacy Survey of Space and Time at the Vera C. Rubin Observatory.

While SDSS’s twin 2.5-meter telescopes (one in New Mexico and one in Chile, allowing the survey to observe the entire sky) are dwarfed by Rubin’s 8-meter mirror, there is still thrilling science to be done with these moderate-sized observatories. This is especially true after a series of upgrades to the spectrographs and thanks to a deep expertise in not only survey-style science, but also in project management and survey planning. In 2021, in the middle of COVID-19 delays and distancing requirements, the team began upgrades to their existing facilities and construction of a brand new telescope to kick off the latest survey, SDSS-V.

The Next Generation

A two-panel figure showing top-down views of the milky way galaxy with different density contours overlaid.

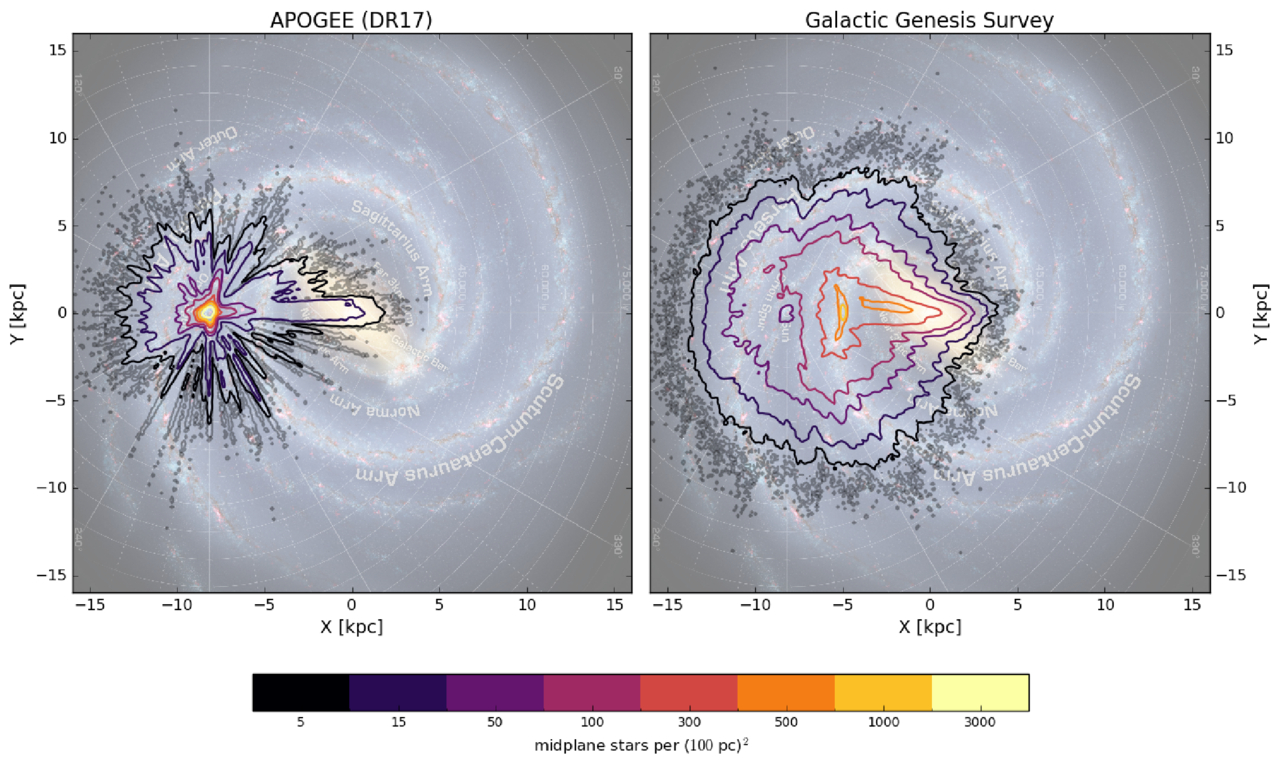
The density of target stars for the SDSS-V survey compared to a previous spectroscopic survey. Click to enlarge. [Kollmeier et al. 2026]

In a wide-ranging publication that references not only astronomy research articles but also Plato, the Bhagavad Gita, an Egyptian tomb, and Tolstoy, the large collaboration describes that this latest survey is divided into three parts: the Milky Way Mapper, the Black Hole Mapper, and the Local Volume Mapper. The preexisting telescopes, which are outfitted with hundreds of tiny robots that can swivel fiber optic cables into place to collect spectra of up to 500 objects at a time, will handle the first two of these “mappers.” A brand-new facility in Chile that’s specifically designed to map the structure of nearby gas will handle the last mapper. Instead of aiming the fibers at a known star or galaxy, this telescope will instead collect a spectrum for every point across an area the size of the full Moon with every exposure.

By the end of the survey, SDSS-V will have collected optical and near-infrared spectra for roughly 6 million objects spread across the whole sky, as well as time-series spectra from about a million of these sources. This dataset, which is unprecedented in both its spatial and temporal coverage, will allow researchers to probe questions ranging from how quasars evolve over time to how commonly young stars have brown-dwarf companions. Long since SDSS initiated the era of industrial survey astronomy, this latest publication shows how the survey continues to lead the way.

Citation

“Sloan Digital Sky Survey. V. Pioneering Panoptic Spectroscopy,” Juna A. Kollmeier et al 2026 AJ 171 52. doi:10.3847/1538-3881/ae0576

The post A New View of the Spectroscopic Universe appeared first on AAS Nova.

  •  

Black Hole Baby Photos: JWST and Chandra Observe M31-2014-DS1

illustration of M31-2014-DS1

One of the most luminous supergiant stars in the Andromeda Galaxy, M31-2014-DS1, has disappeared, potentially leaving behind a black hole shrouded in dusty gas. What do new infrared and X-ray observations tell us about this event?

Failure to Explode?

SN 2023ixf in Messier 101

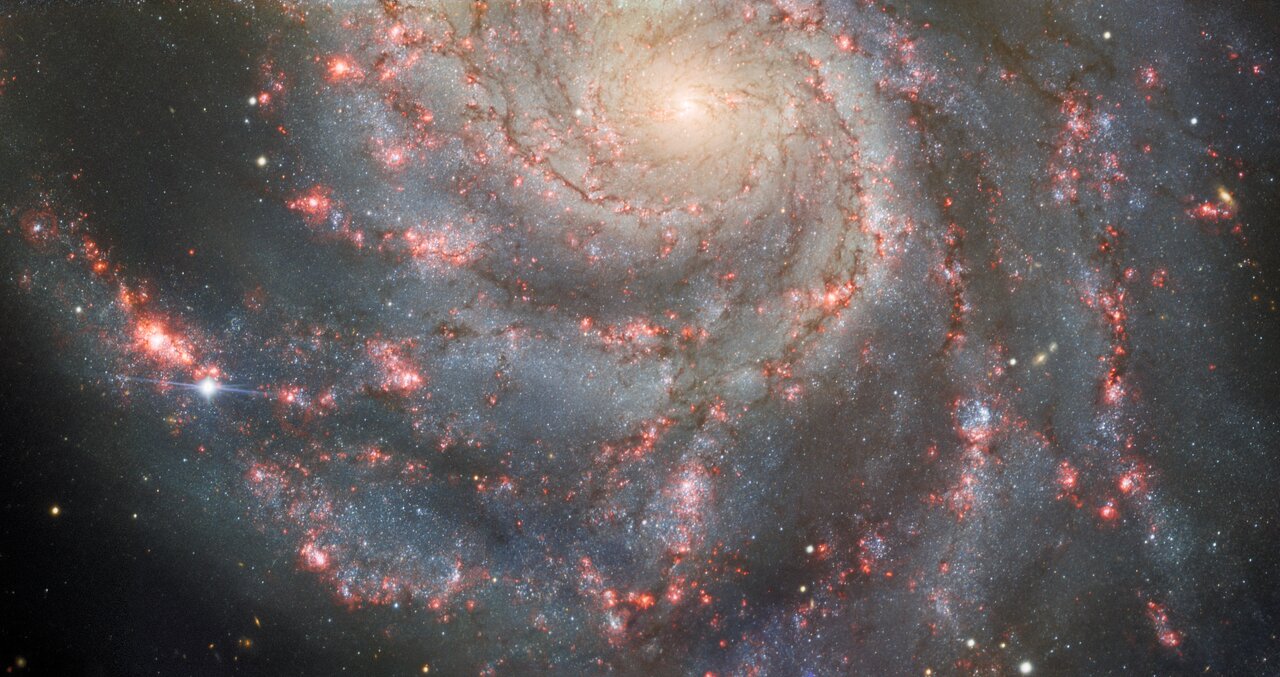
This image from Gemini North shows the supernova SN 2023ixf along one of the spiral arms of Messier 101. Though less showy than core-collapse supernovae, “failed” supernovae may be another way to form stellar-mass black holes. [International Gemini Observatory/NOIRLab/NSF/AURA; CC BY 4.0]

Massive stars are famous for going out with a bang. After swelling into supergiants, these stars bring their brief lives to a close in a cosmic fireworks show: a supernova explosion that creates a neutron star or a black hole.

But a splashy supernova explosion may not be the only way for a massive star to go out. As observations have begun to suggest, some massive stars may — for reasons not yet fully understood — quietly collapse in upon themselves, going out with a whimper rather than a bang. Though less spectacular and far harder to spot, these “failed” supernovae highlight a possible pathway for the formation of stellar-mass black holes.

A Newborn Black Hole in a Dense, Dusty Blanket

Just last month, researchers reported their discovery of a potential failed supernova. The supergiant M31-2014-DS1 suddenly brightened in 2014 before fading to obscurity, leading researchers to suspect that the star had experienced a failed supernova and created a black hole. The event shared similarities with another failed supernova candidate, NGC6946-BH1.

JWST data of M31-2014-DS 1

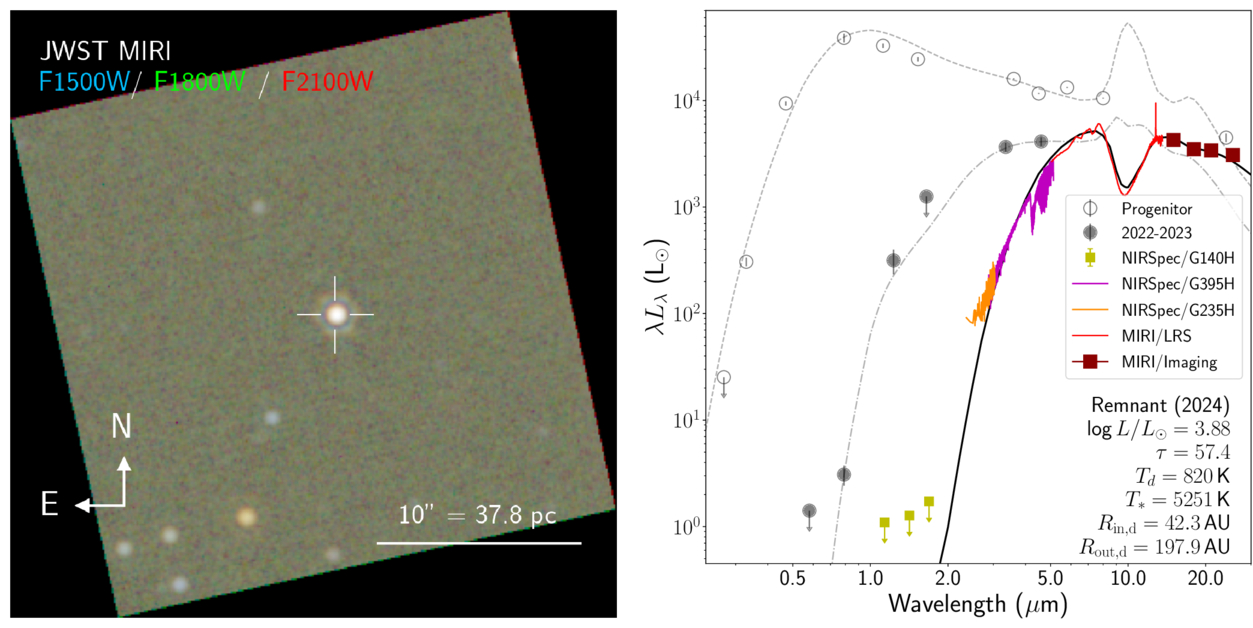
Left: A JWST image of M31-2014-DS 1. Right: Spectral energy distributions of the progenitor star/the remnant using data from 2005 to 2012 (empty circles), 2022 to 2023 (filled circles), and 2024 (colored lines). Click to enlarge. [De et al. 2026]

In a new article published in the Astrophysical Journal Letters, Kishalay De (Columbia University; Flatiron Institute) and coauthors have used JWST and the Chandra X-ray Observatory to learn more about what remained after M31-2014-DS1 disappeared. The JWST observations show an extremely red object that has faded considerably in just a few years, with a deep absorption feature from silicate dust and numerous narrow molecular absorption lines. Chandra did not detect any X-rays.

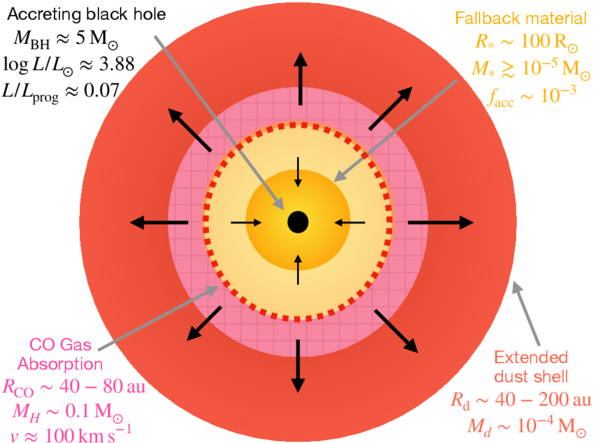
Together, these observations support a model in which the collapsing star ejected its outer layers in a relatively low-energy event (somewhere in the broad ballpark of one hundred-millionth to one ten-thousandth the energy of a typical core-collapse supernova) and formed a black hole. Some of the ejected material fell backward and fed the newborn black hole, while the remainder created a dense blanket that blocked the light from the accreting black hole from view.

Continued Evolution

schematic of the gas surrounding a newborn black hole

Cartoon showing the authors’ model and the model parameters inferred from the observations. Click to enlarge. [De et al. 2026]

In observations from 2024, the source had faded to just 7% of the progenitor star’s luminosity, supporting the conclusion that the star has disappeared and what lies beneath the dusty ejecta is a black hole. De’s team expects that as time goes on, the gas that obscures the accretion-powered luminosity of the newborn black hole will expand and become less dense along our line of sight. At some point — estimated to be no sooner than about 27 years from now — the X-ray emission from the accreting black hole should pierce the dusty shroud and become visible to sensitive X-ray observatories. In the infrared, JWST will be able to track the source’s evolution caused by continued dust creation in the expanding shell.

Thanks to its location in a neighboring galaxy, M31-2014-DS1 has granted astronomers a front-row seat to a poorly understood pathway for black hole formation. Going forward, we can expect further insights into M31-2014-DS1 and, hopefully, the discovery of many more sources like it.

Citation

“Fading into Darkness: A Weak Mass Ejection and Low-Efficiency Fallback Accompanying Black Hole Formation in M31-2014-DS1,” Kishalay De et al 2026 ApJL 999 L25. doi:10.3847/2041-8213/ae468d

The post Black Hole Baby Photos: JWST and Chandra Observe M31-2014-DS1 appeared first on AAS Nova.

  •  

How Solar Flares Hint That They’re About to Happen

Images of a solar flare at different wavelengths

Forecasting solar flares is one of the major challenges facing solar physicists today. New research finds that non-thermal emission can precede a solar flare by more than an hour, and this early emission may signal whether the flare will be accompanied by an explosion of plasma.

Flare Flavors

photograph of a coronal mass ejection

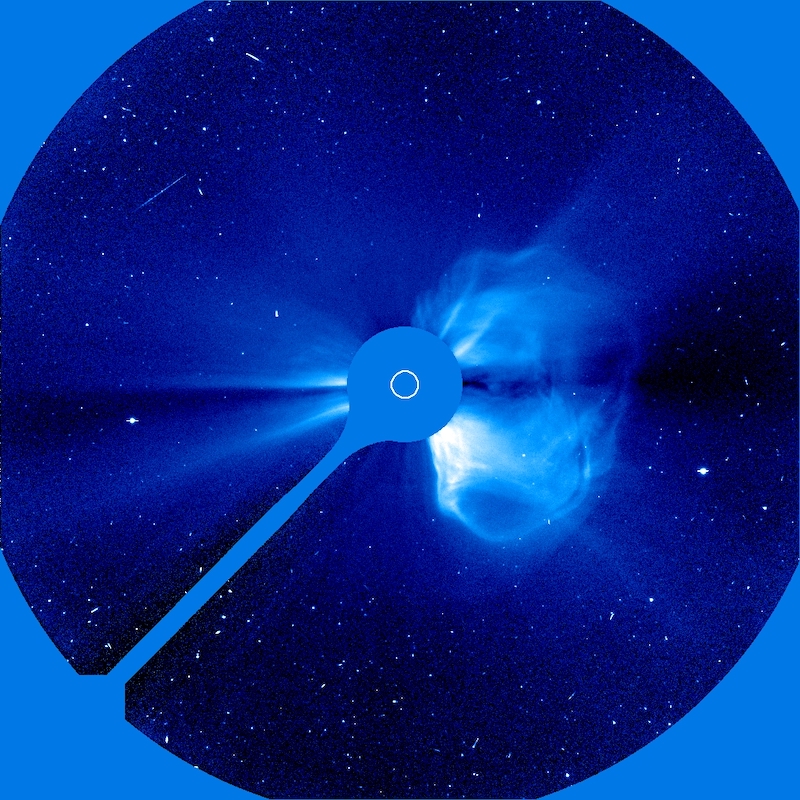
The Solar & Heliospheric Observatory (SOHO) took this coronagraphic image of a coronal mass ejection on 20 April 1998. [SOHO (ESA & NASA)]

Solar flares come in two basic flavors: eruptive and confined. Eruptive flares are accompanied by the launch of tangled clouds of plasma and magnetic fields called coronal mass ejections. Confined flares, so called because the solar plasma remains confined to the Sun, feature only a brief blast of high-energy radiation.

Both solar flares and coronal mass ejections can disrupt everyday life on Earth, with flares knocking out radio communications and coronal mass ejections threatening spacecraft electronics and power grids. Given these real-life risks, as well as the potential for probing the physics behind the activity on the Sun and other stars, it’s critical to be able to identify signs of upcoming flares.

Looking at the Lead-Up

Luckily, there’s growing evidence that the Sun sends out subtle signals that a flare is soon to happen. One early sign of an impending flare is an increase in the non-thermal velocity of the plasma at the flare’s location. This phenomenon has been spotted in individual flares, but it hasn’t been studied and characterized for a large sample of flares — until now.

example of increasing non-thermal velocity before a solar flare

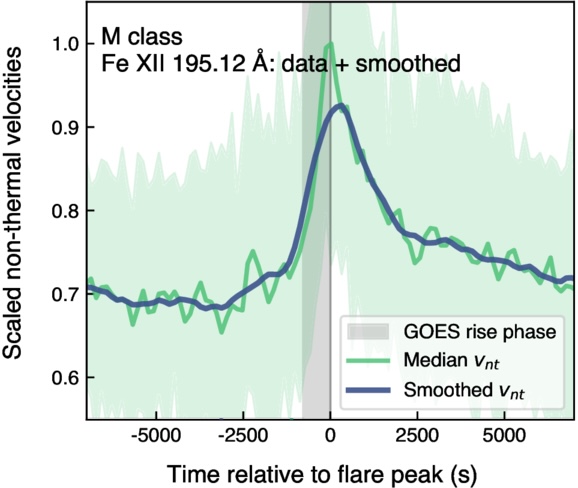
Demonstration of the increase in non-thermal velocity seen in an M-class flare compared to the onset and rise time of the soft X-ray flux (gray shaded area). [Adapted from To et al. 2025]

A recent research article led by Andy S. H. To (European Space Agency) takes the first systematic, large-scale approach to studying the non-thermal velocity changes that precede solar flares. The team amassed a sample of 1,449 solar flares that were seen by the Hinode spacecraft, the Geostationary Operational Environmental Satellite (GOES), and the Solar Dynamics Observatory (SDO). Hinode provided the spectral information needed to identify increases in the non-thermal velocity, GOES provided the flare start times, and SDO provided detailed information on the location and appearance of each flare.

Of the flares in the sample, 83% were moderately powerful C-class flares, 18% were stronger M-class flares, and 1% were the most powerful X-class flares. To’s team identified a clear trend across all types of flares: the non-thermal velocity increases 4–25 minutes before the flare’s X-ray emission begins to rise, peaks when the X-ray emission peaks, and decays as the flare decays. The team found some evidence that for smaller flares, the velocity increase begins in spectral lines that trace cooler plasma before spreading to lines probing hotter plasma, but more work is needed to confirm this trend.

More Details

Examples of flares with and without coronal mass ejections

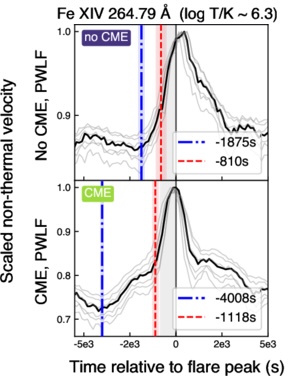
Examples of flares with and without coronal mass ejections. [Adapted from To et al. 2025]

Certain flares give even earlier hints of upcoming activity. M-class flares and some C-class flares exhibit what To’s team calls “precursor emission,” which emerges roughly 30–60 minutes before the flare’s X-ray emission peaks. The team also identified differences in precursor emission between confined and eruptive flares: eruptive flares display precursor emission over a broad range of spectral lines starting 45–74 minutes before the flare peaks, while confined flares show precursor emission later (31–54 minutes before peak) and in only a few spectral lines.

These results suggest that changes in the non-thermal velocity of solar plasma can not only signal when and where a flare is likely to arise, but also whether the flare will be accompanied by a potentially destructive coronal mass ejection. Upcoming missions like the Multi-slit Solar Explorer and SOLAR-C will give an even better view of the early stages of solar flares, helping to illuminate the physics behind them and enhancing our ability to forecast them.

Citation

“Systematic Nonthermal Velocity Increase Preceding Soft X-Ray Flare Onset: A Large-Scale Hinode/EIS Study,” Andy S. H. To et al 2025 ApJ 993 102. doi:10.3847/1538-4357/ae07de

The post How Solar Flares Hint That They’re About to Happen appeared first on AAS Nova.

  •  

Chandra Spies a Supernova Shock Front Speeding Along

Supernova remnant N132D

Beautiful bubbles of hot ionized gas, supernova remnants trace the dying days of massive stars. A recent study uses the Chandra X-ray Observatory to detail the motion and understand the origins of one supernova remnant.

Retracing Supernova Remnants

Massive stars, about 8 solar masses or larger, will end their short lives in violent core-collapse supernovae. These explosions barrel into any surrounding interstellar medium, carving out low-density cavities and blowing material outward. Appearing as a bubble or shell of hot gas, a supernova remnant carries the signatures of the type of star that produced it and the ways that star shaped its environment throughout its life. 

Nearby, in the Large Magellanic Cloud, is the 2,500-year-old supernova remnant N132D — the most X-ray luminous supernova remnant within the Local Group. Though N132D’s size, likely progenitor mass, and chemical composition are well constrained, astronomers have yet to nail down the velocity of the X-ray shock front — the outer edge of the supernova remnant that rams into the interstellar medium. This measurement is critical to understanding the local conditions the supernova first encountered and how its expansion will continue to impact the interstellar medium over time.

Chandra Observations of N132D

Determining the shock front velocity requires astronomers to focus on the thin outer edge of the soaring supernova remnant — how do we measure the motion of such a narrow strip of gas? X-ray spectroscopy of N132D yields a measurement from a single epoch of observations, but it cannot isolate the narrow shock front, making a reliable velocity measurement difficult to attain.

supernova remnant velocity

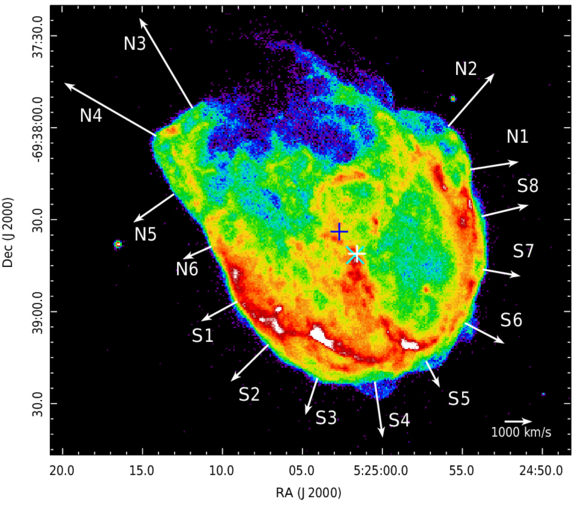
The expansion of supernova remnant N132D around the rim for each of the regions analyzed in this study. The arrow lengths are proportional to their estimated expansion velocities. Click to enlarge. [Long et al 2025]

Circumventing the challenges of spectral analyses, Xi Long (University of Hong Kong) and collaborators used two sets of X-ray observations of N132D from the Chandra X-ray Observatory taken about 14.5 years apart to measure the motion of the shock front across the sky over time. This measurement, known as proper motion, compares the location of the foreground supernova remnant to stationary background stars to estimate its angular speed. 

The authors focus on small regions on the very edge of the supernova shock front, six northern and eight southern, to carefully measure the motion of the shock between the two sets of observations. In separating the shock front into smaller regions, the authors can determine any variations in speed along the shock front. The southern edge of N132D moves with the same expansion rate of 1,620 km/s. The northern edge has an average expansion rate of 3,820 km/s, but its speed is more varied, which isn’t unexpected given its blown-out appearance.

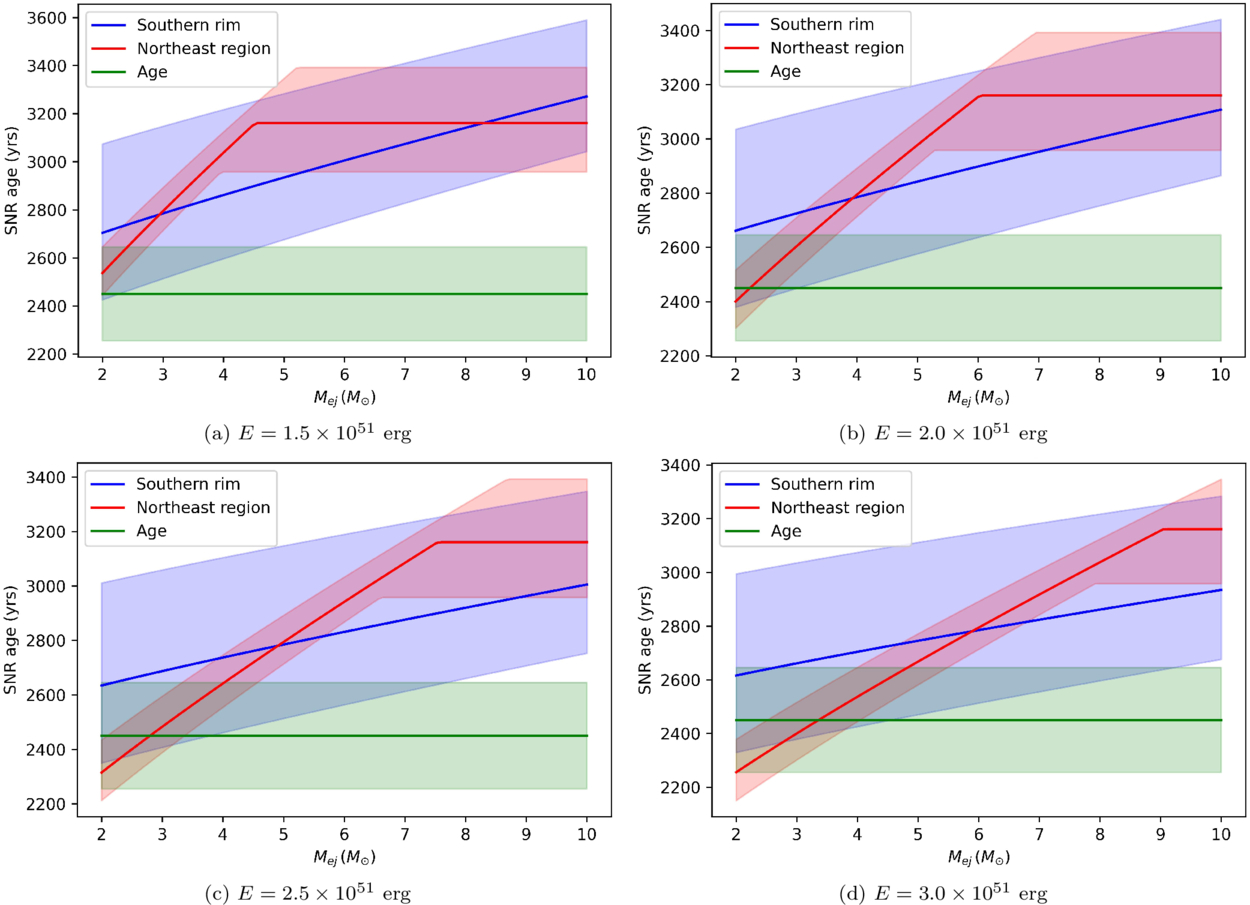
Modeling results showing the supernova age versus ejecta mass for the northern (red) and southern (blue) regions compared to the age estimate from an optical study of N132D. For the explosion energies and estimated ejecta masses between 2 and 6 solar masses, the models are consistent for all three. Click to enlarge. [Long et al 2025]

Comparing to Prior Studies

In addition to determining the velocity of the forward shock, the authors model the evolution of the supernova remnant to estimate the initial conditions of N132D including progenitor star mass, explosion energy, and ejecta mass. Their results agree with other studies that suggested N132D originated from a roughly 15-solar-mass star that exploded 2,500 years ago into a low-density cavity. 

This study showcases the unique ability of Chandra’s high-resolution instruments to carefully measure the evolution of supernova remnants, and further studies will continue to determine the detailed characteristics of supernova remnants across the Local Group.

Citation

“Chandra Large Project Observations of the Supernova Remnant N132D: Measuring the Expansion of the Forward Shock,” Xi Long et al 2025 ApJ 993 136. doi:10.3847/1538-4357/ae07c7

The post Chandra Spies a Supernova Shock Front Speeding Along appeared first on AAS Nova.

  •  

A Close Look at an Ancient Moon

A photograph of a heavily cratered moon on a black background.

By piecing together observations from dozens of radio telescopes in Chile, planetary scientists recently completed the first-ever map of Callisto’s emission at millimeter wavelengths.

Old and Cold

In striking contrast to Io’s frenzied volcanism and Europa’s cracking ice shell, Jupiter’s moon Callisto is much quieter and colder than its Galilean siblings. Though a liquid water ocean hypothetically sloshes beneath its frigid surface, it’d be hard to infer that just by looking at the moon. Callisto’s terrain is ancient, static, and bears the scars of the millennia of exposure to space. There are no volcanoes, plate tectonics, or any other features to disturb what researchers call “evolved ruins” of the numerous craters. These have names like Valhalla, Asgard, and Lofn, since Callisto’s geologic features are named after settings and characters in Norse mythology to further reinforce their freezing existence.

This never-reset canvas makes Callisto an ideal laboratory for studying the long-term effects of asteroid impacts, dust accumulation from nearby natural satellites, and other processes that modify a planetary surface over time. One way to infer the composition and structure of the first few meters of material is to observe the way the temperature changes over the course of a day. For example, ice and rock respond differently to temperature changes; similarly, small-grains of either material warm up and cool down at different speeds than their larger-grain counterparts.

An image of a purple-orange blob against a black background.

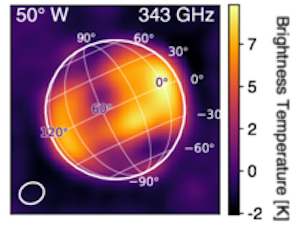
The residuals from one of ALMA’s observations of Callisto. [Adapted from Camarca et al. 2025]

In theory, planetary scientists can measure the temperature of a moon by noting how bright each patch of its surface appears in millimeter-wavelength observations. However, this is easier said than done, as only a handful of telescopes are capable of seeing Callisto as anything more than a fuzzy blob at those wavelengths. Back in 2016–2017, planetary scientists used the Atacama Large Millimeter/submillimeter Array (ALMA), a radio interferometer in Chile, to attempt the challenging feat of making a map of Callisto’s surface.

Mapping from Afar

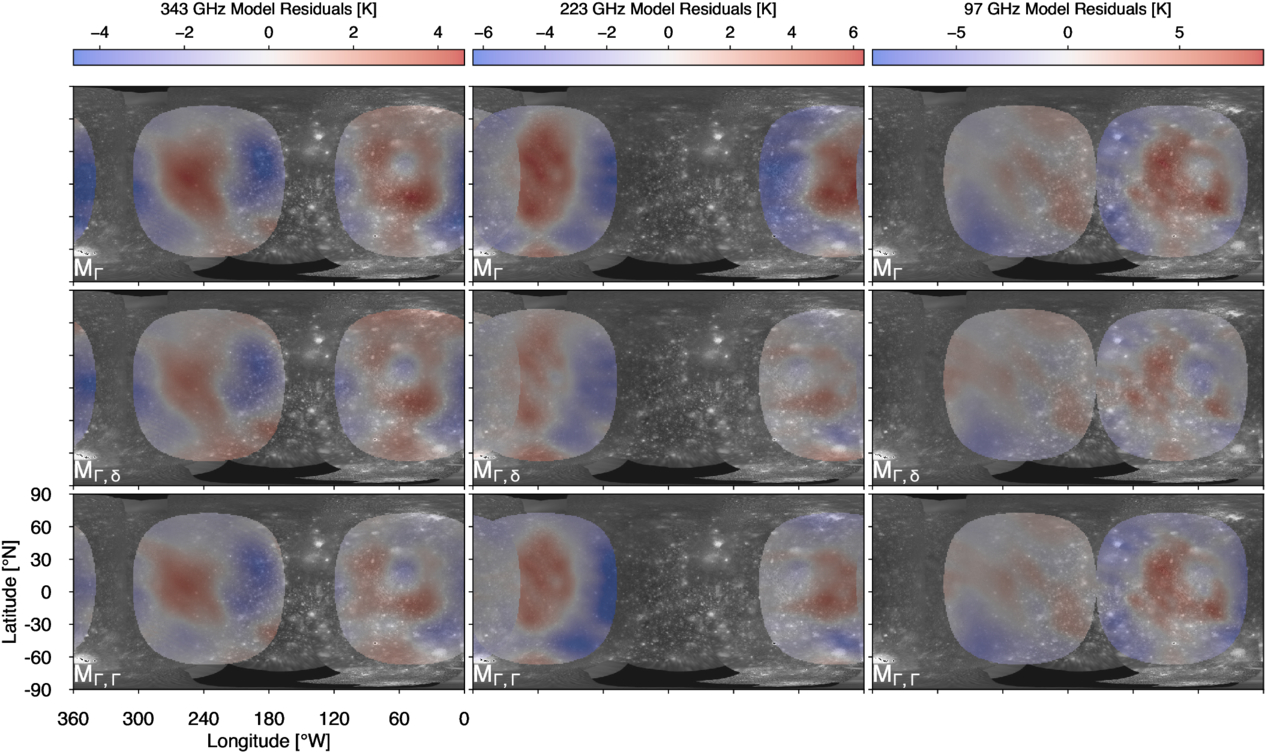
A team led by Maria Camarca, California Institute of Technology, just finished churning through all of the data and assembling their map of Callisto’s temperature residuals. Though the final spatial resolution was at best a few hundred kilometers, meaning a comparable map of Earth would blur all of New England together, this represents the most detailed thermal map of Callisto yet. The map was detailed enough to easily spot the largest craters, and several impact craters including Valhalla stood out as being 3–5K colder than all of the surrounding terrain. The team spotted another anomalously cold region that coincides with the location of maximum carbon dioxide gas density recently seen with JWST.

A multi-panel figure of a black and white surface beneath transparent red and blue blobs.

A map of Callisto’s thermal emission (red/blue) overlaid atop visible images of the surface collected by spacecraft. Click to enlarge. [Camarca et al. 2025]

The team also found that their data could not be explained by a simple model for Callisto’s surface that assumed one dominant material and structure. Instead, their images were better explained by more complex simulations that use two different thermal inertias. Though they are not sure yet why this may be, it is clear that Callisto, often overlooked compared to its flashier siblings, is a complex world worthy of further study. Luckily, the upcoming Jupiter Icy Moons Explorer mission and ALMA’s Wideband Sensitivity Upgrade will bring new knowledge of Callisto’s ancient surface.

Citation

“A Multifrequency Global View of Callisto’s Thermal Properties from ALMA,” Maria Camarca et al 2025 Planet. Sci. J. 6 183. doi:10.3847/PSJ/ade7ee

The post A Close Look at an Ancient Moon appeared first on AAS Nova.

  •  
❌