❌

Reading view

A Lyman-Leaking Galaxy Merger Confirmed with JWST

Epoch of Reionization

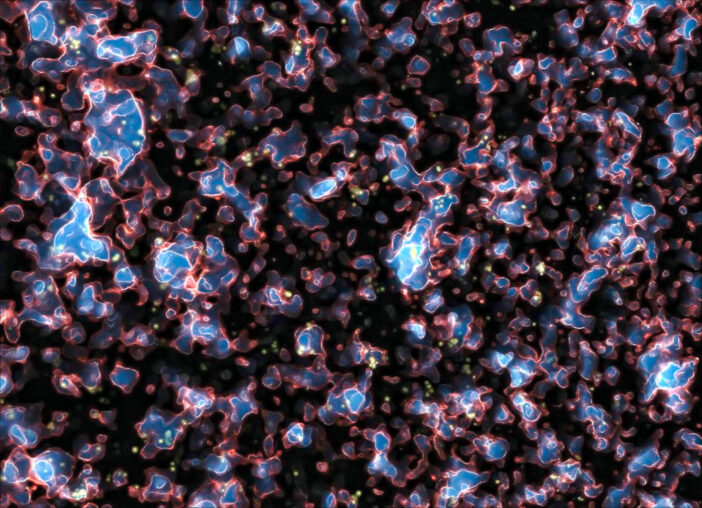
Exactly how the universe became reionized after cooling to form stars and galaxies remains an open question. A recent study investigates how a merging set of galaxies may have spurred an onslaught of ionizing photons into the intergalactic medium.

Lyman Continuum Leakers and Merging Galaxies

After its chaotic and blistering beginning, the universe cooled and began to coalesce, stars and galaxies flickering on to set the universe alight. From a few hundred million to about a billion years after the Big Bang, galaxies pumped high-energy ionizing Lyman continuum (LyC) photons into the intergalactic medium during what is known as the epoch of reionization. The exact mechanisms that produced and allowed LyC emission to escape galaxies during this era remain elusive.

Galaxy Merger

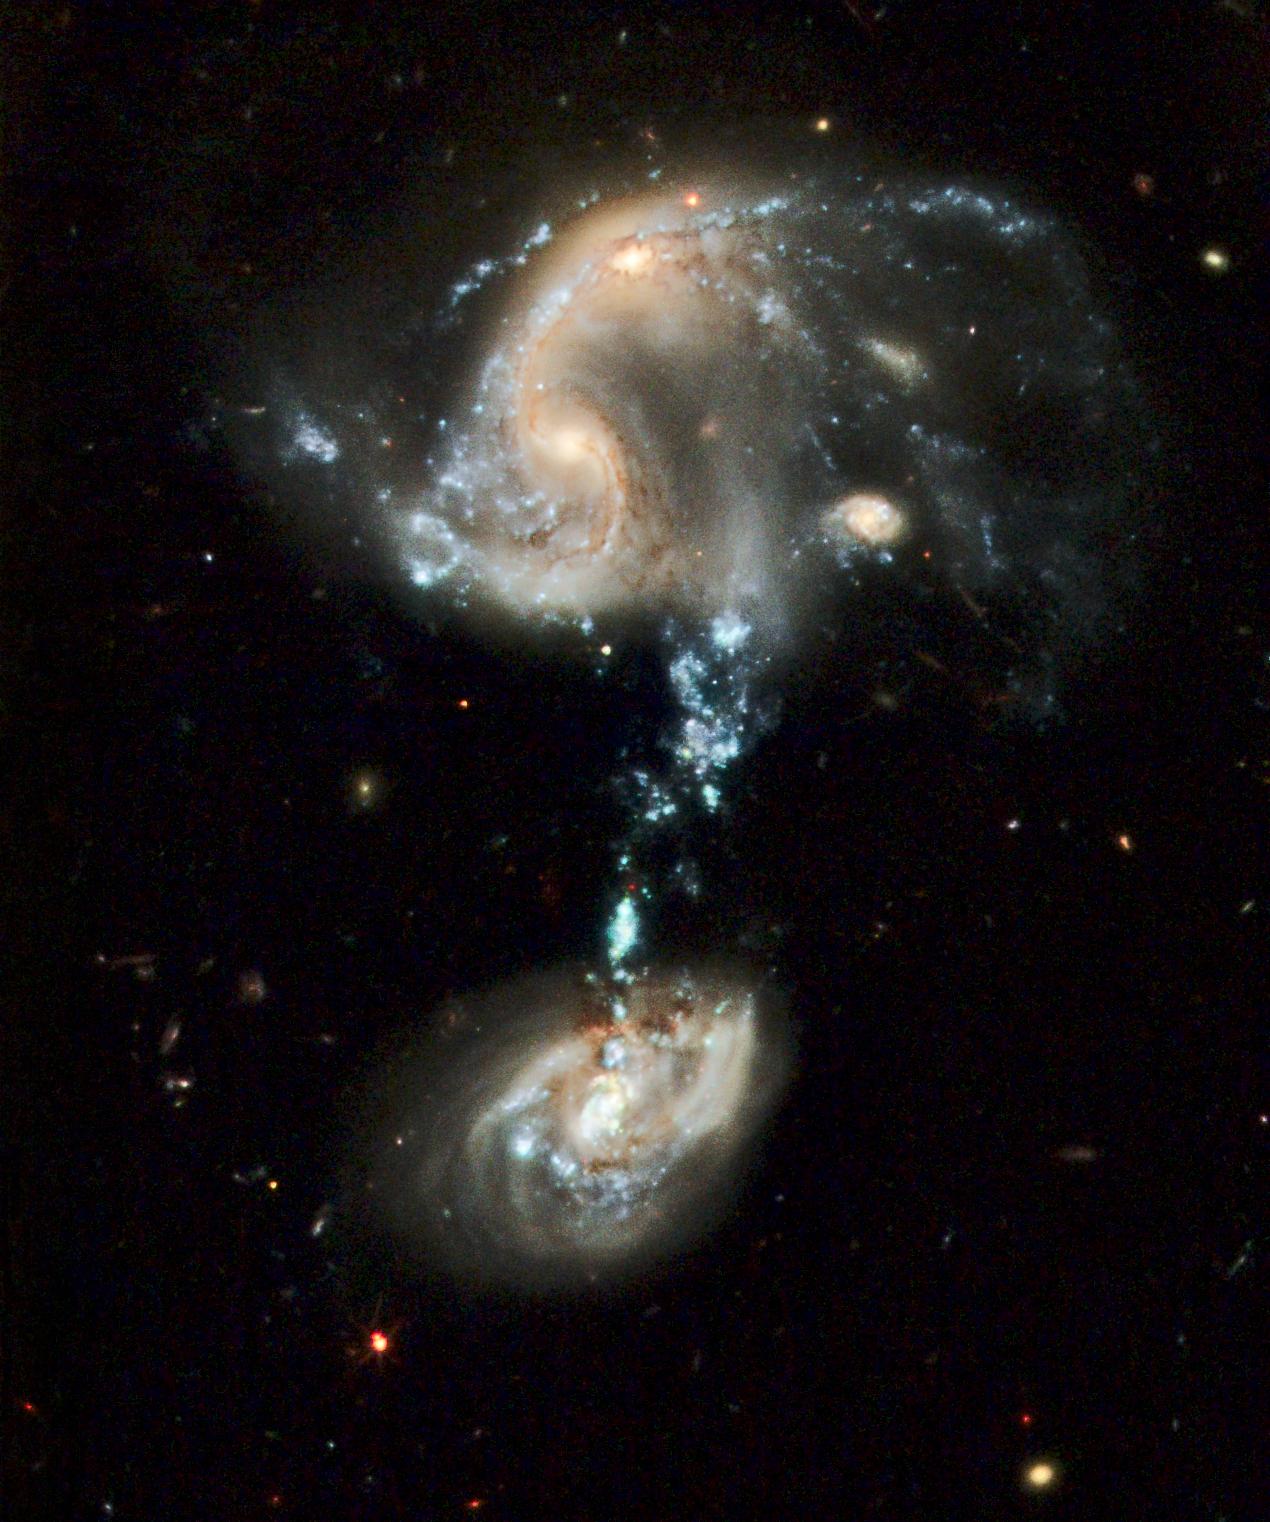
Hubble Space Telescope image of the interacting galaxy group Arp 194. The blue stream connecting the galaxies is where tidally stripped gas formed millions of new stars. [NASA, ESA, and the Hubble Heritage Team (STScI/AURA)]

One promising driver of LyC leakage is galaxy mergers — strong gravitational interactions and interstellar medium mixing can induce bursts of star formation, creating the hot, young stars that emit LyC photons. In particular, galaxy mergers can create tidal tails, streams of wispy gas, that can sustain brief but intense bouts of star formation that quickly use up surrounding gas. With no interstellar gas left to absorb radiation, the fresh stars in these streams can easily pump their high-energy photons into the intergalactic medium, contributing to cosmic reionization.

While observational studies have increasingly pointed to galaxy mergers as considerable drivers of LyC escape, only a small number have explicitly considered the role of mergers in the epoch of reionization due to spectral and spatial resolution limitations. Leveraging the high-resolution capabilities of JWST, Shengzhe Wang (University of Chinese Academy of Sciences; National Astronomical Observatories, Chinese Academy of Sciences) and collaborators performed detailed analyses of two LyC-leaker candidates to better understand the role of galaxy mergers in heating up the universe.

Confirming (and Refuting) Merger-Driven Leaks with JWST

Using candidate LyC leakers first identified in the LymAn Continuum Escape Survey (LACES) carried out with the Hubble Space Telescope, Wang and team obtained high-resolution JWST spectroscopy for two galaxies at redshift z = 3.1 (about 2 billion years after the Big Bang), LACES94460 and LACES104037. After carefully identifying and measuring emission lines in each candidate, the authors confirmed LACES104037 as a merger-driven LyC leaker. However, the apparent LyC emission from LACES94460 was determined to be contamination from a low-redshift object.

LACES 104037

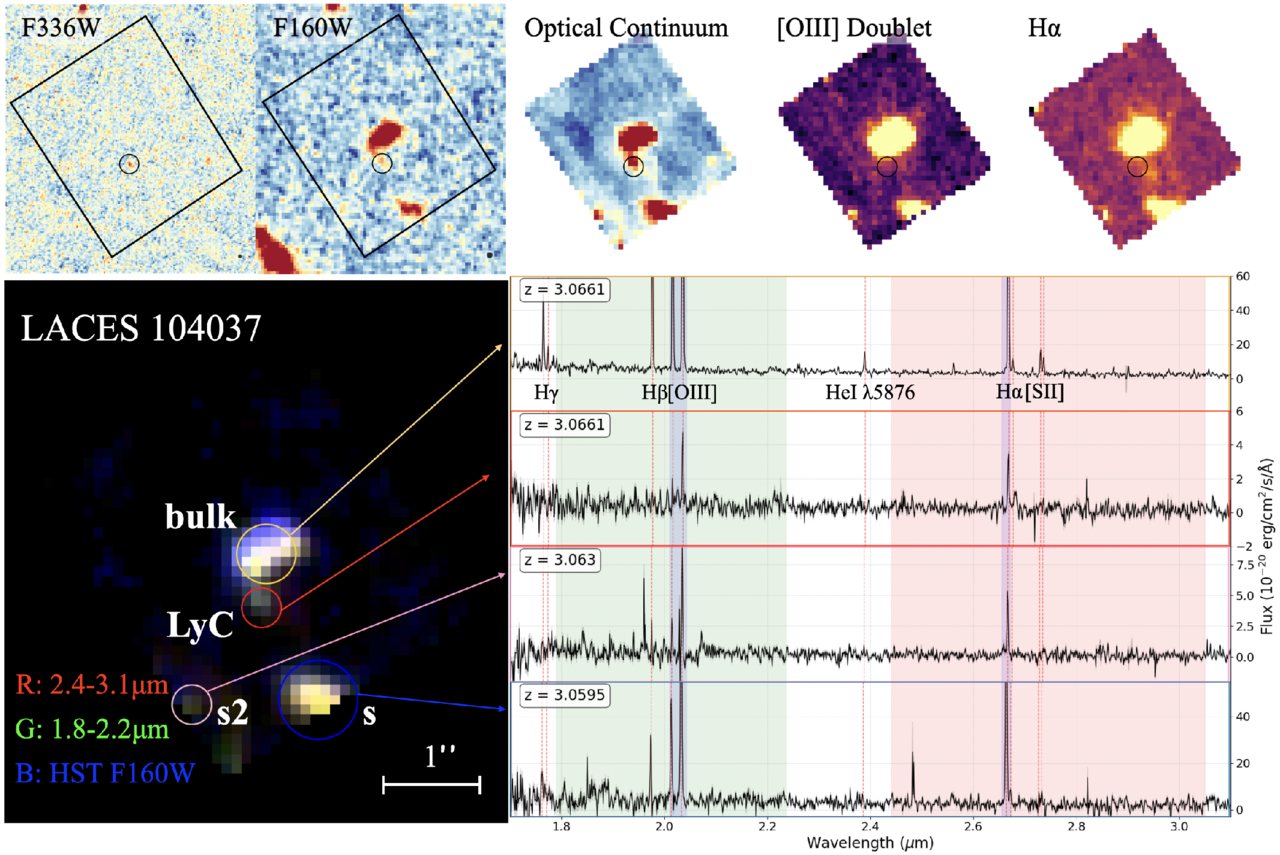
Hubble and JWST observations of LACES104037. The top panels show the Hubble images (first two panels) and the JWST spectral observations (last three panels). The bottom panel shows a composite three-color image marking the location of two primary interacting galaxies and the LyC emission along with the associated spectra. Click to enlarge. [Wang et al 2026]

Based on the JWST spectroscopy, LACES104037 is an early-stage merger system with two primary interacting galaxies (LACES104037-bulk and LACES104037s) with a tidal-tail structure connecting them (LACES104037-LyC) where the LyC emission originates. Using model predictions based on the JWST spectroscopy and photometry from previous studies, the team found that LACES104037-LyC is a star-forming clump in a tidal tail with a stellar age of about 5 million years and an extreme LyC photon escape fraction of approximately 0.99. This points to merger-induced star formation being an extremely efficient way to dump ionizing photons into the intergalactic medium.

LACES104037-LyC represents the first confirmed LyC leaker of its kind: an external clump of star formation in a tidal tail. This discovery aids in our understanding of how mergers can drive high-energy photon emission, and highlights the critical role galaxy mergers may play in the epoch of reionization. Future high-resolution observations will hopefully reveal more knots of LyC-leaking stars within merging galaxies and provide a deeper understanding of this important evolutionary phase of the universe.

Citation

“Confirmation and Refutation of Lyman Continuum Leakers at z ~ 3 with JWST NIRSpec IFU,” Shengzhe Wang et al 2026 ApJL 1006 L17. doi:10.3847/2041-8213/ae8523

The post A Lyman-Leaking Galaxy Merger Confirmed with JWST appeared first on AAS Nova.

  •  

How Galaxies Grow Up

JWST unfolded against a black background.

How do galaxies grow? A massive survey from JWST can help astronomers answer that fundamental question about galaxy evolution.

Time Machines

A photograph of thousands of galaxiesin one frame.

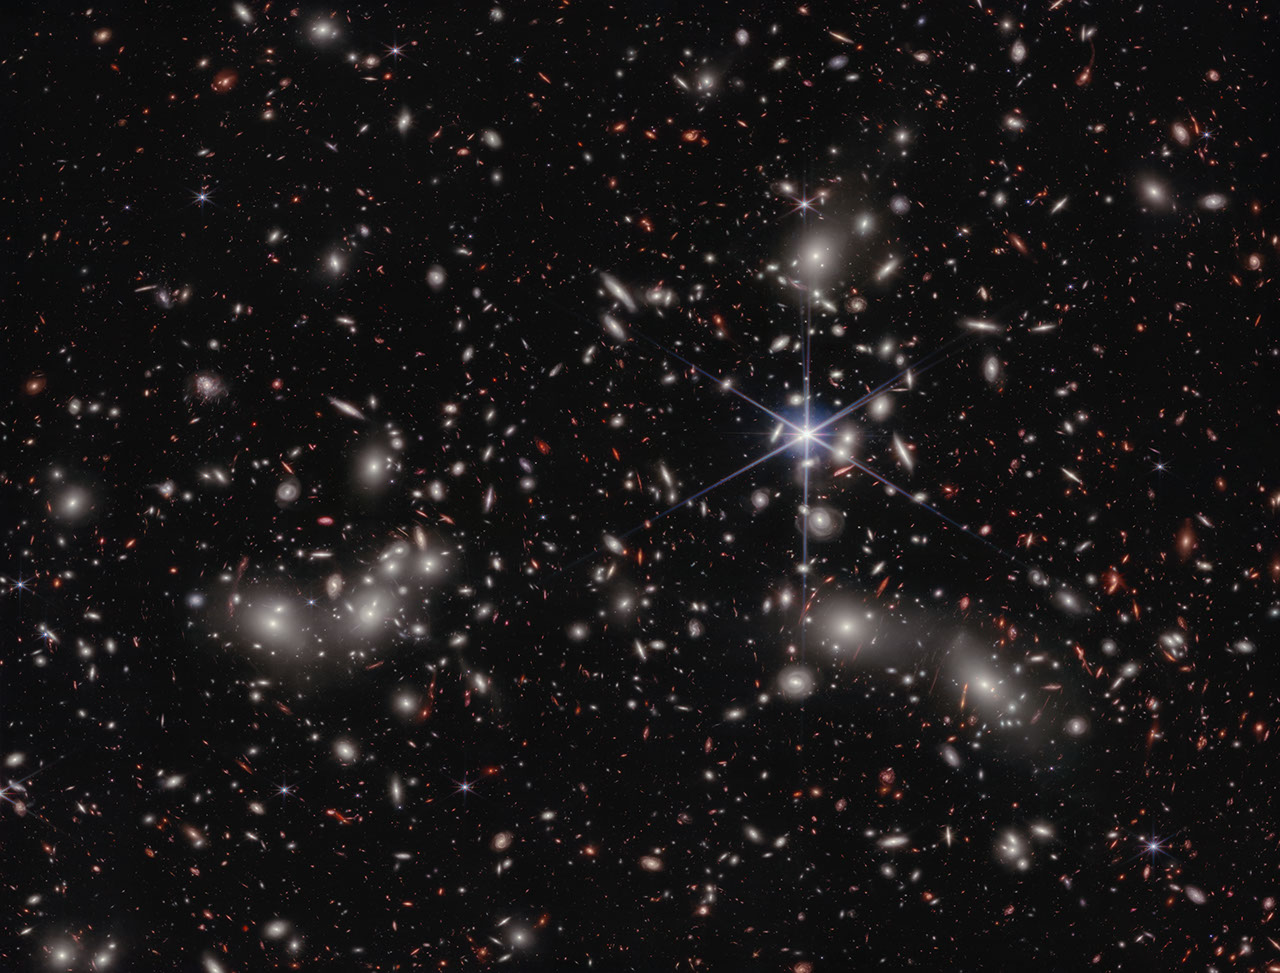
An image taken by JWST’s NIRCam instrument, the primary instrument behind the COSMOS-Web survey, of Pandora’s Cluster. Click to enlarge. [NASA, ESA, CSA, Ivo Labbe (Swinburne), Rachel Bezanson (University of Pittsburgh); Image Processing: Alyssa Pagan (STScI)]

When astronomers look into the night, they are greeted by a sky full to bursting with galaxies. But immediately after the Big Bang, none of these grand structures could have existed in our universe: all of the matter was too hot and dense to collapse into the whirlpools and ellipses we see today. We know that it took time for dark matter to collapse into halos, for gas to cool and fall into those halos, and even more time for those halos to merge together and galaxies to form. However, quantifying that story is tricky. How long did it take for the gas to cool and collapse? How often did small galaxies merge? How did the birth and death of stars play into all of this?

One way astronomers could go about answering these deep, fundamental questions in galaxy evolution would be to look at many galaxies spread across different distances. Famously, since the speed of light is fairly slow (cosmically speaking), we can only see distant objects as they appeared in the past. (This is why any aliens looking toward Earth from 65 million light-years away — from within the Virgo Cluster, perhaps — would see our planet as it was when dinosaurs roamed free.) In principle, then, by looking at a progression of galaxies farther and farther away, astronomers could convert these still images into a sort of movie of how typical galaxies look moving further and further back in time.

Seeing Red

There is a complication to this strategy, however. The farther away an object is, the more the light it emits is stretched towards redder wavelengths. As a consequence, any telescope designed to detect visible light won’t see anything; to take pictures of these galaxies, we need to build detectors that are specifically sensitive to stretched-out, near-infrared light.

This is one of the primary reasons that JWST was designed, constructed, and flung into space. It was purpose-built to collect and analyze near-infrared light from distant galaxies, and now after several years of observations and data crunching, astronomers are finally getting some answers to those fundamental questions.

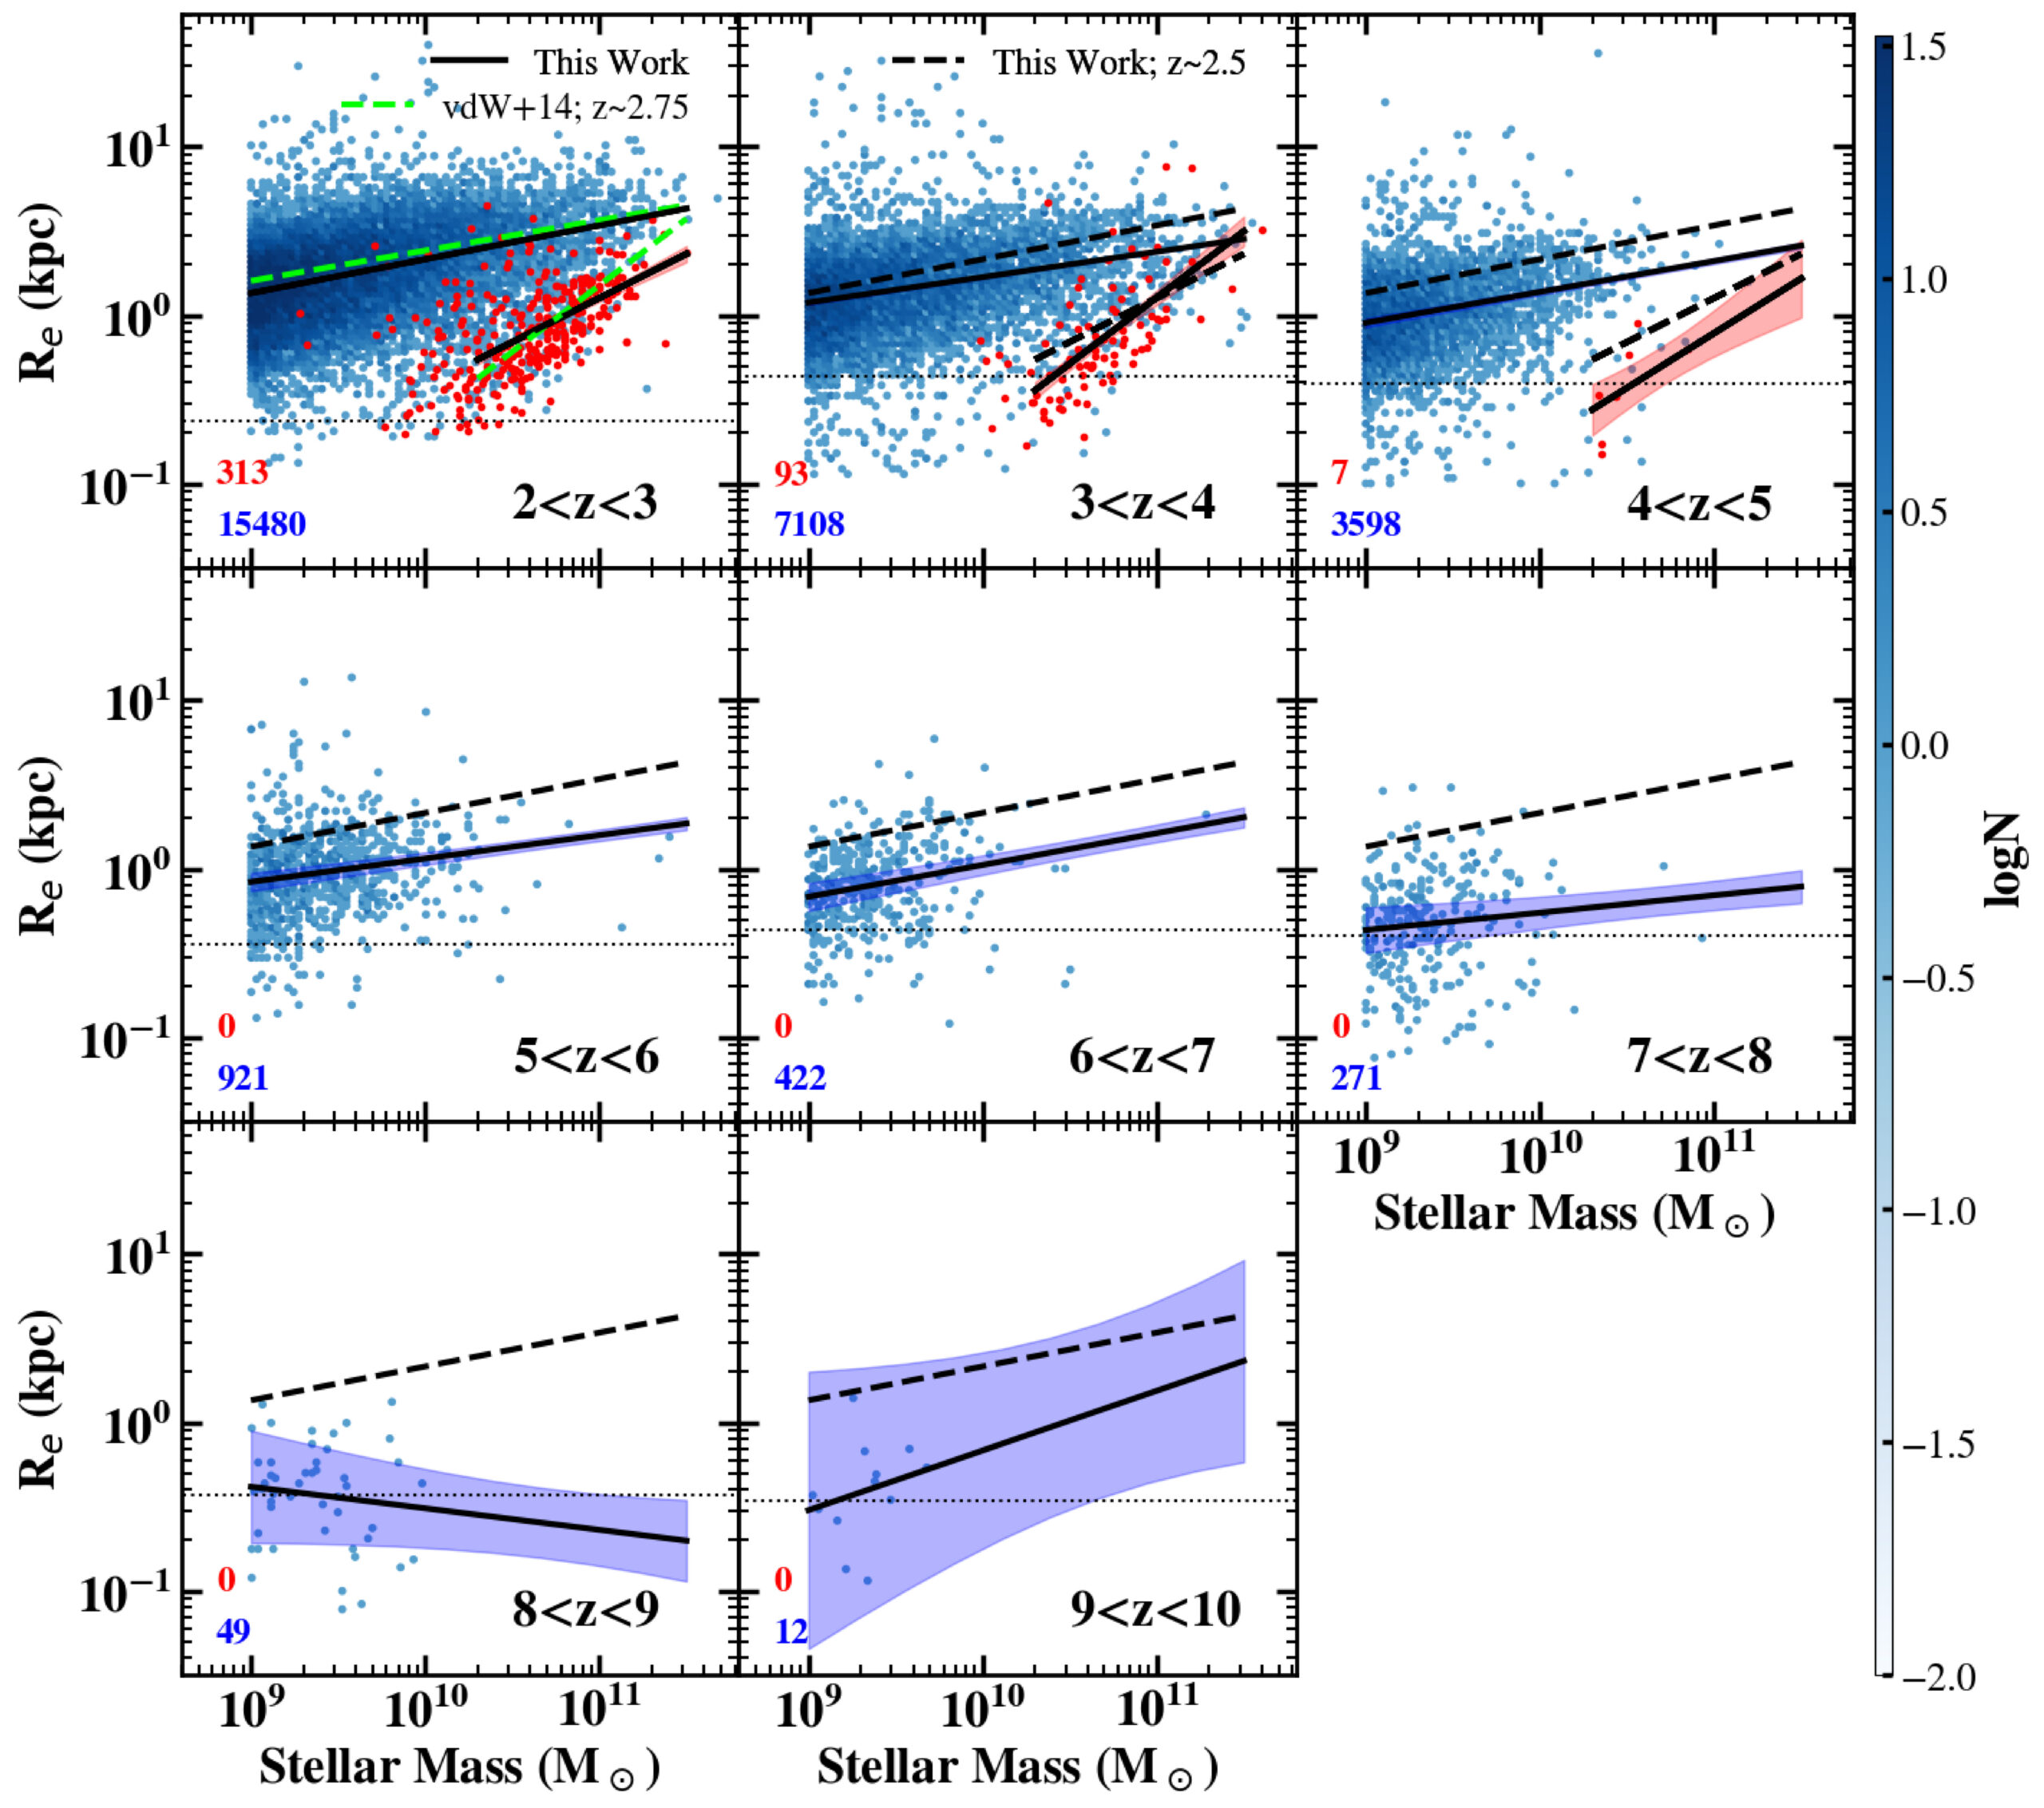
The results of how galaxies’ masses relate to their total size in different redshift bins. Click to enlarge. [Yang et al. 2025]

A Massive Survey

Recently, a team led by Lilan Yang, Rochester Institute of Technology, released their analysis of one of the earliest and largest surveys JWST has undertaken, a program called COSMOS-Web. The researchers mined a patch of sky about the size of the full Moon and extracted more than 30,000 distant galaxies, most of which had never before been seen by human eyes. They measured the brightness and size of each one and grouped them according to their redshift (a proxy for their distance) and whether they were actively forming stars or not.

The team found that, unsurprisingly, galaxies tend to grow over time. Excitingly, however, they also found that for star-forming galaxies, the relationship between a galaxy’s mass and its size is fairly constant for redshifts of z = 2–8. The scaling law between them also nicely matches up with measurements taken by the Hubble Space Telescope at smaller redshifts. Beyond that, though, for redshifts of z = 8–10, it’s possible that the scaling changes, though the authors emphasize that their sample is much smaller in these distant bins.

While more data are needed to confirm whether the youngest of these galaxies grow at a different pace than their later counterparts, we can be comforted that studies like this represent just our very first peek into a whole new era of galactic evolution, and that many more insights are sure to come as JWST keeps snapping images.

Editor’s Note: This article previously contained an error relating to the distance at which aliens would see Earth as it was when inhabited by dinosaurs. This error was corrected on 4 May 2026.

Citation

“COSMOS-Web: Unraveling the Evolution of Galaxy Size and Related Properties at 2 < z < 10,” Lilan Yang et al 2025 ApJS 281 68. doi:10.3847/1538-4365/ae0e1b

The post How Galaxies Grow Up appeared first on AAS Nova.

  •  

A Possible GLIMPSE of the Universe’s First Stars

Population III stars

Editor’s Note: Astrobites is a graduate-student-run organization that digests astrophysical literature for undergraduate students. As part of the partnership between the AAS and astrobites, we occasionally repost astrobites content here at AAS Nova. We hope you enjoy this post from astrobites; the original can be viewed at astrobites.org.

Title: GLIMPSE: An Ultrafaint ≃105 M⊙ Pop III Galaxy Candidate and First Constraints on the Pop III UV Luminosity Function at z ≃ 6–7
Authors: Seiji Fujimoto et al.
First Author’s Institution: University of Toronto; The University of Texas at Austin
Status: Published in ApJ

You, me, your laptop, my $8 matcha, and just about everything else on Earth was forged in the fiery bellies of dying stars. Generations of stars had to live and die before the universe became enriched with any elements heavier than helium (what astronomers call “metals”). The first stars to undergo this cosmic cycle are known as Population III (Pop III) stars. Though their existence has been hypothesized since the 1960s, astronomers have failed to observe these distant metal-free stars or the faint, low-mass galaxies that host them.

The first Pop III stars likely formed around 100 million years after the Big Bang in pristine pockets of hydrogen gas. Although these are too distant for us to observe, we expect that as the universe started to become metal enriched, there were still existing pockets of gas introverted enough to survive unpolluted and form metal-free Pop III stars up to a redshift of z ~ 6–7 (when the universe was around 900 million years old)!

JWST is the perfect instrument to search for these systems. You can read other astrobites on the search for possible Pop III systems with JWST here and here. The authors of today’s article seek to develop the most efficient way of using JWST’s Near-Infrared Camera (NIRCam) to find the galaxies hosting Pop III stars. Using their selection method on existing NIRCam data, the authors identified one promising Pop III galaxy candidate.

I’m Not Like Other Galaxies

In order to find a Pop III galaxy, we need to take a look at galaxies’ spectral energy distributions (SEDs). These are graphs that show the energy emitted by a galaxy at different wavelengths of light. Pop III galaxies are expected to have SEDs that differ from your everyday, metal-enriched galaxy. NIRCam will be especially sensitive to three key spectral features that show up in the SEDs of Pop III galaxies: an absent [O III] line (light emitted by doubly ionized oxygen atoms), a strong H-alpha line (light emitted when a hydrogen atom transitions from its third to its second energy level), and a significant Balmer jump (light absorbed to ionize electrons in the second energy level of a hydrogen atom). To identify these key SED characteristics, the authors use SED fitting and color–color diagrams to execute an efficient Pop III search with NIRCam.

The first selection method involves SED fitting. Astronomers create template SEDs that represent different types of galaxies and then compare these templates to the observed SEDs to see which one matches best. In this work, the authors use metal-rich galaxy templates and Pop III templates to fit the galaxies observed with NIRCam. They then calculate the chi-squared χ2 (a statistical measure of best fit) between the data and all the SED templates. A galaxy is selected as a Pop III candidate if the Pop III model provides a good fit (χ2 < 10) to the photometry and is significantly better than any metal-rich model. It’s kind of like looking for Cinderella by making every woman in the kingdom try on the glass slipper.

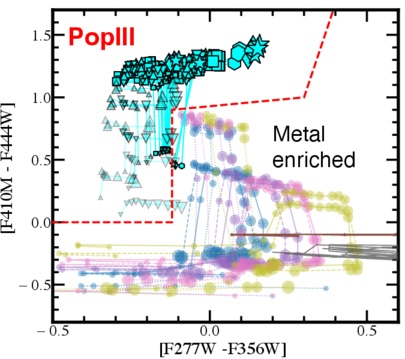
A color-color diagram showing how Pop III models lie in a different parameter space than metal-rich galaxies.

Figure 1: Color–color diagram for selecting Pop III galaxies where the x and y-axes show the different NIRCam filters being subtracted. The cyan symbols are different Pop III models while the other colored dots are different metal-rich galaxy models. [Adapted from Fujimoto et al. 2025]

A color–color diagram plots the difference in magnitude between two filters on each axis. NIRCam filters are specially chosen to emphasize the SED characteristics above. When these filters are chosen, Pop III galaxies occupy a distinct region of this diagram as compared to metal-rich galaxies. For example, subtracting the F356W filter from the F277W filter is sensitive to the presence of the [O III] line and the Balmer jump. Figure 1 demonstrates how this color selection separates Pop III galaxies from typical galaxies.

O Pop III, Pop III, Wherefore Art Thou?

The authors apply their fresh new selection criteria to publicly available NIRCam data from large surveys. And (drum roll please) the slipper fits! The Pop III galaxy candidate GLIMPSE-16043 is an ultra-faint galaxy at z = 6.5. It was imaged in the GLIMPSE survey, which uses the technique of gravitational lensing to observe faint and distant galaxies.

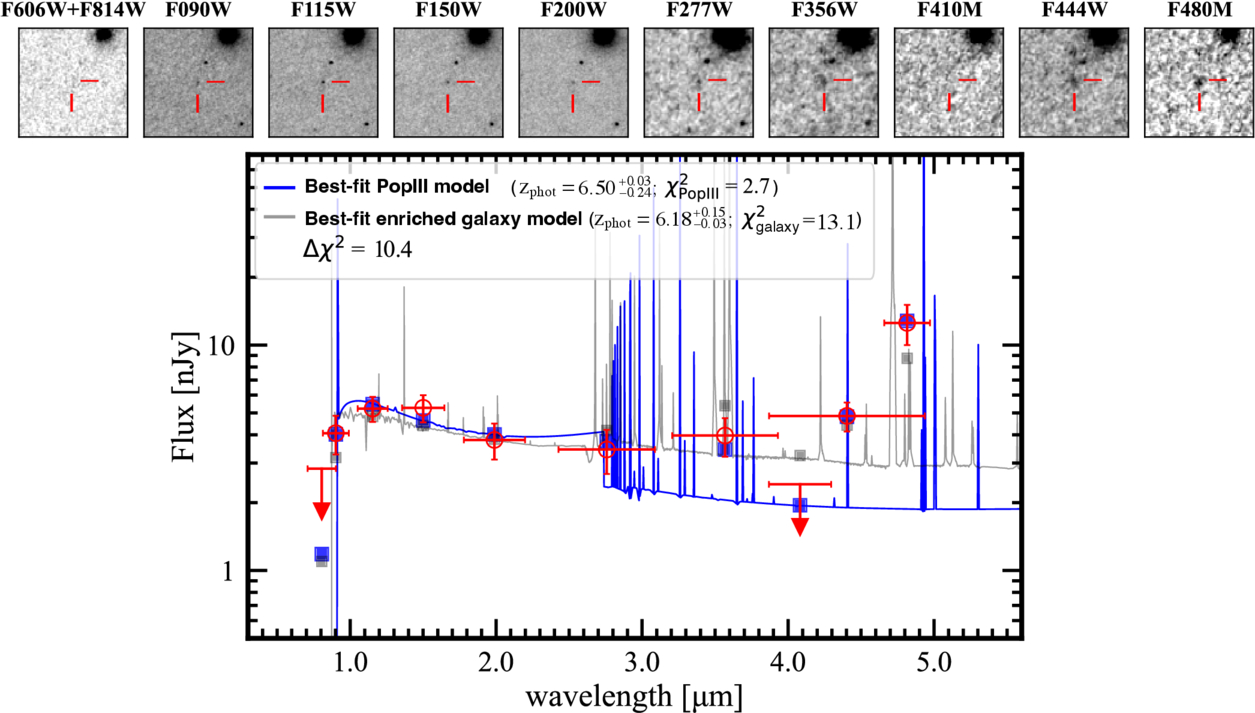
The GLIMPSE survey targeted a massive galaxy cluster, Abell S1063. The cluster bends the light from distant galaxies and, like a giant lens, magnifies faraway objects, providing some of the deepest JWST imaging to date. The Pop III candidate passes both tests: it resides in the Pop III region of the color–color diagram, and its SED is best fit by a Pop III model, not a metal-rich galaxy model (see Figure 2). Next, spectroscopic follow-up is needed to ensure that this galaxy is truly metal free and not just extremely metal poor.

The spectral energy distribution of a Pop III galaxy candidate. This plot shows that the JWST data is best fit by a Pop III model rather than a metal-rich galaxy.

Figure 2: SED of GLIMPSE-16043 with the best-fit Pop III template (blue) and best-fit metal-enriched template (gray). The top panel is the galaxy imaged in different filters from NIRCam and the Hubble Space Telescope. [Fujimoto et al. 2025]

The authors conclude that our best shot at identifying additional Pop III galaxy candidates is using NIRCam to image large numbers of gravitationally lensed clusters. Without magnification from gravitational lensing, it may be impossible to see these ultra-faint Pop III galaxies. Once candidates have been identified, they can be followed up with deep spectroscopy to confirm their redshift and their lack of metals. Who knows? With these new methods, we may soon get a glimpse of the universe’s very first stars.

Original astrobite edited by Chris Layden and Margaret Verrico.

About the author, Madison VanWyngarden:

I am a first-year PhD student in astronomy and NSF Graduate Research Fellow at the University of Arizona. I study galaxy formation and evolution in the distant universe and am particularly interested in dusty star-forming galaxies. In my free time, I love reading, hiking, and baking bread!

The post A Possible GLIMPSE of the Universe’s First Stars appeared first on AAS Nova.

  •  

Starring in the Early Universe: Black Hole Stars and Little Red Dots

NIRCam JADES image

JWST has uncovered a peculiar population of very distant objects known as “little red dots.” The mechanisms powering these objects’ peculiar properties — high luminosities, compact radii, and “V”-shaped spectra — remain uncertain. Could little red dots be the result of supermassive stars, galaxy mergers, or, as a recent study explores, black hole stars?

Direct-Collapse Black Holes and Little Red Dots

Since their discovery, little red dots have been the subject of many studies, but a complete explanation for their unique combination of properties remains elusive. Multiple studies have explored the growing population of peculiar dots, with some postulating that they are the result of stars thousands of times the mass of the Sun, supermassive stars entrenched in gas from a galaxy merger, or black holes embedded in dense accretion disks. 

Even more recently, studies have proposed that little red dots may be the remnants of direct-collapse black holes. In this scenario, a large cloud of gas in the early universe directly collapses into a stellar-mass black hole, and the remaining gas envelops the black hole, forming what is known as a quasi-star (or black hole star). Researchers have suggested that little red dots may be the late stage of this process when the black hole has accreted at least 10% of the total mass of the system. Direct comparisons between quasi-star evolutionary models and JWST observations of little red dots have yet to be explored but are necessary to confirm the potential of quasi-star origins.

Evolutionary Models of Quasi-Stars

Quasi-star HR diagram

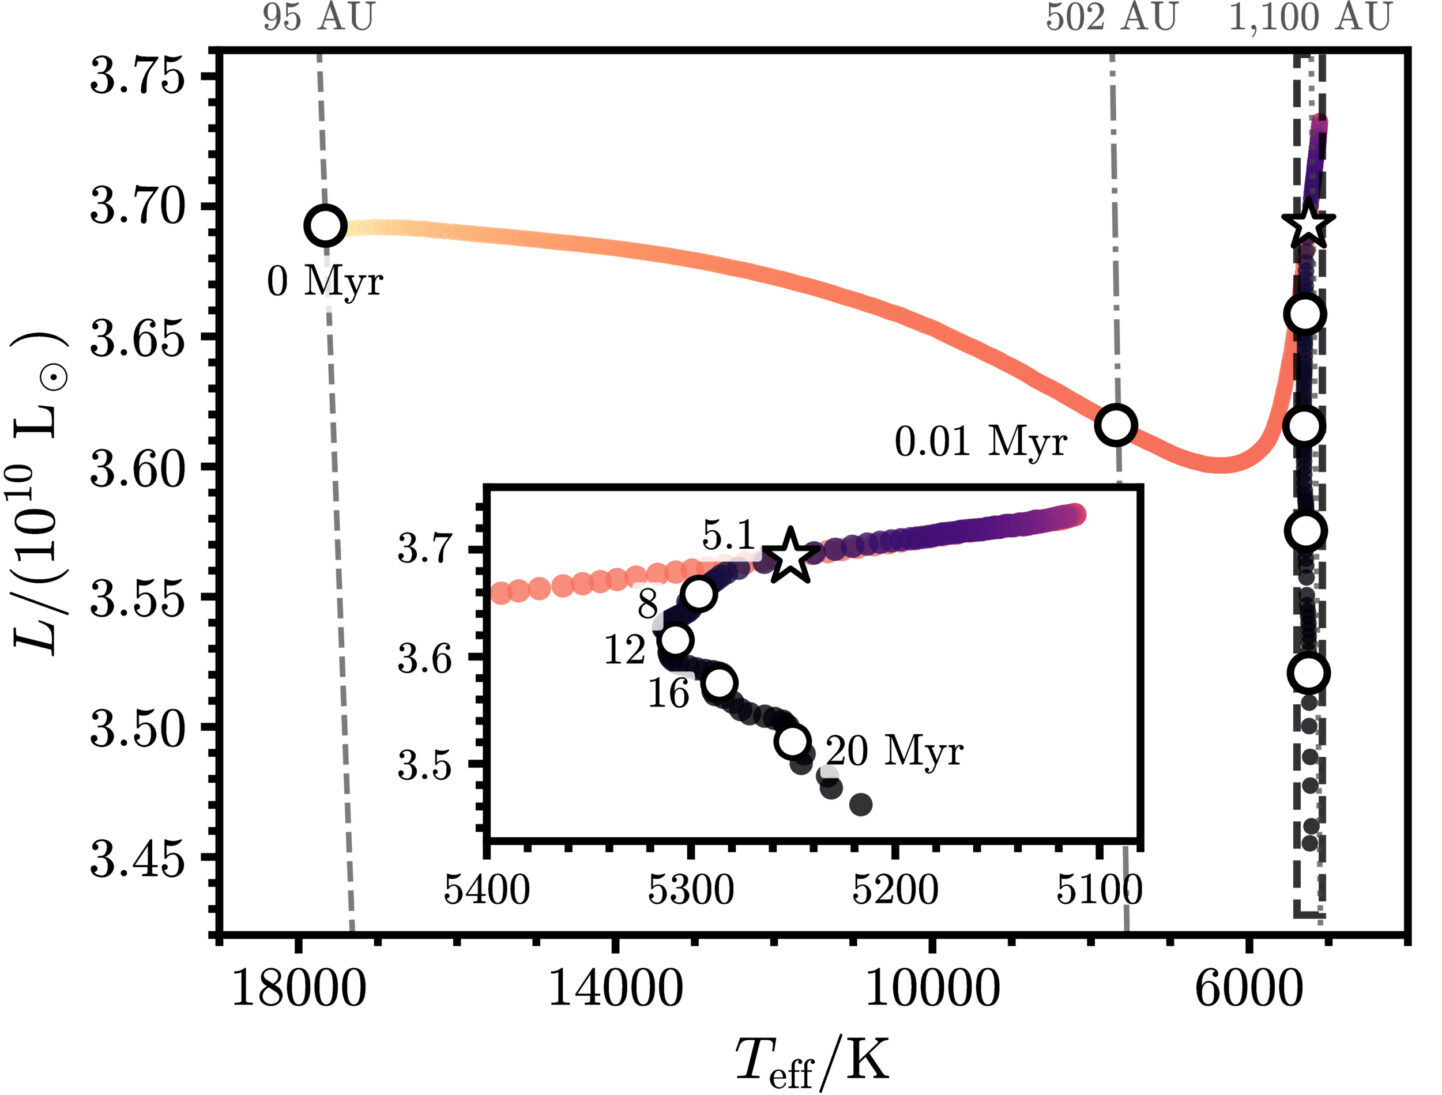
Evolution of a theoretical quasi-star model on a Hertzsprung–Russell diagram. [Modified from Santarelli et al 2026]

Seeking to compare quasi-star evolutionary models to JWST observations of little red dots, Andrew D. Santarelli (Yale University) and collaborators developed a modeling framework to simulate quasi-star evolution. In this framework, a quasi-star is modeled as a black hole at the core of a massive star that accretes material from the stellar envelope over its lifetime. The authors computed models for a range of initial masses and tracked the evolution of the quasi-stars, predicting luminosities, temperatures, surface gravities, and lifetimes of these objects.

After a short initial phase of contraction lasting around 10,000 years, the quasi-star spends the rest of its approximately 20–40-million-year lifetime in the “late stage” as the central black hole continues to eat up the surrounding envelope. In the end, the quasi-star becomes a supermassive black hole a million times the mass of the Sun.

SED comparison of quasi-star + LRDs

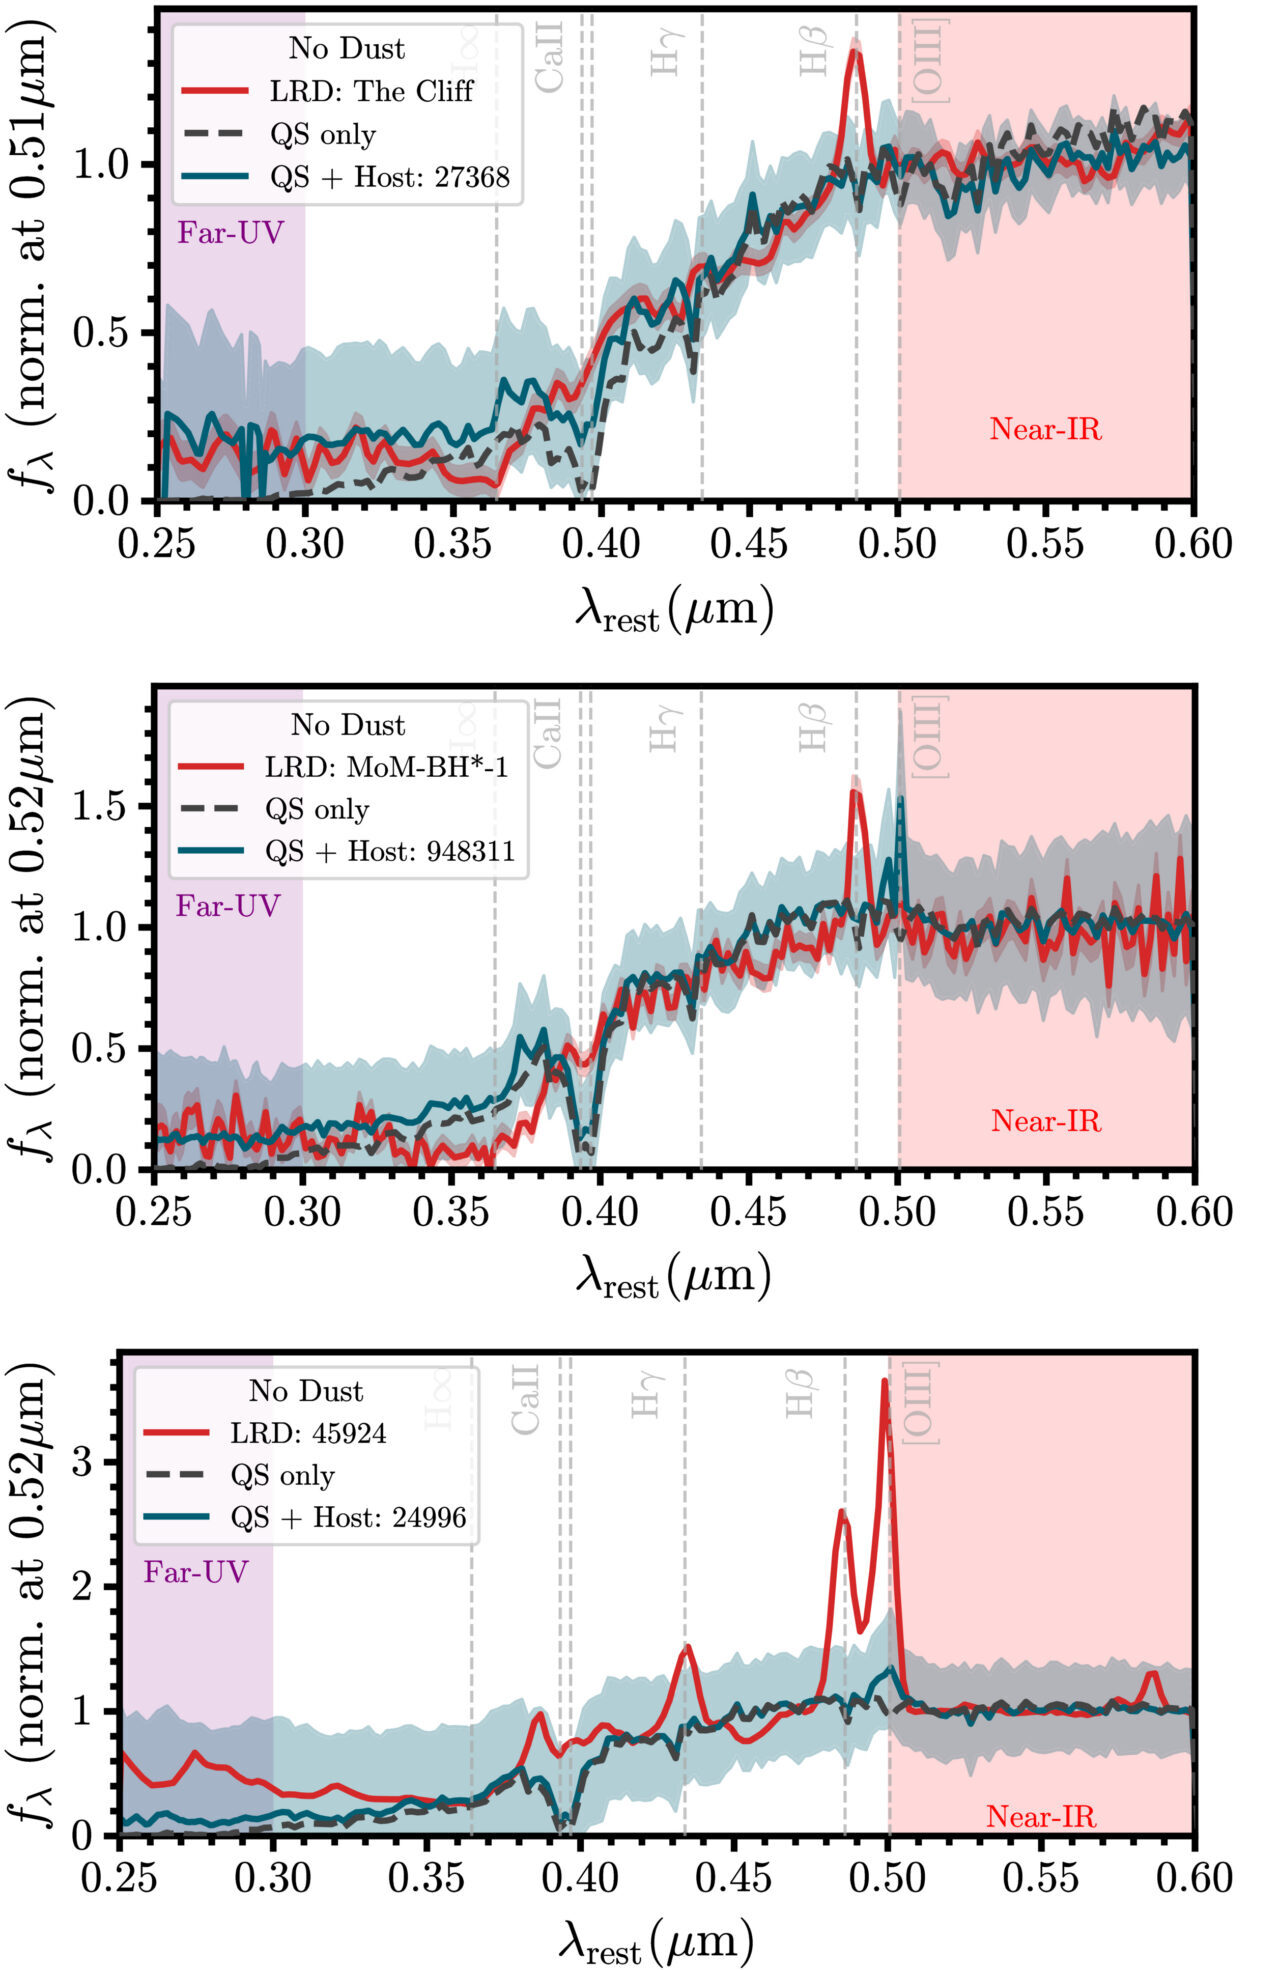
Predicted spectral energy distributions of 1 million solar mass, late-stage quasi-stars both alone (black dashed line) and embedded in a host galaxy (solid blue line). Each panel compares the quasi-star to a little red dot observed by JWST. [Modified from Santarelli 2026]

From these models, the authors extracted synthetic spectral energy distributions for late-stage quasi-stars. In comparing the simulated quasi-star spectra to those of three observed little red dots, the authors found that the synthetic quasi-star spectra generally reproduce the main continuum features seen in all three of the little red dots. While the models do not account for specific emission lines, the continuum slopes of the ultraviolet and near-infrared parts of the spectral energy distributions that form the signature “V” shape generally agree with those seen in the three comparison little red dots.
Plausible Progenitors

The results of this study indicate that late-stage quasi-stars can naturally produce the defining continuum features of little red dot spectra. While further modeling is required to trace specific emission line features, the initial modeling presented in this study establishes quasi-stars as plausible progenitors of not only little red dots but also the universe’s first supermassive black holes. 

As the authors noted, the short lifetimes of quasi-stars shown in their models in conjunction with the observed number density of little red dots implies that a significant fraction of supermassive black holes formed through this mechanism. Continued observations of little red dots and advanced modeling of direct-collapse black holes will aid in determining if these peculiar dots are showing off the birth of supermassive black holes in the universe.

Citation

“Evolutionary Tracks and Spectral Properties of Quasi-stars and Their Correlation with Little Red Dots,” Andrew D. Santarelli et al 2026 ApJL 998 L4. doi:10.3847/2041-8213/ae3713

The post Starring in the Early Universe: Black Hole Stars and Little Red Dots appeared first on AAS Nova.

  •  

Featured Image: An Active Galaxy Cluster Merger at Cosmic Noon

This image from JWST shows the galaxy cluster XLSSU J021744.1-034536. The cluster is at a redshift of z = 1.98, placing it at cosmic noon, when the universe’s star formation was at its peak. To study the formation and evolution of this cluster, Zachary Scofield (Yonsei University) and collaborators collected wide-ranging clues, including signs of weak gravitational lensing, the glow of gas in between the galaxies of the cluster, and an analysis of the cluster members. The image above (click for the full view) indicates the galaxies that are members of the cluster. The brightest galaxy in the cluster is marked with a yellow square, and the remaining cluster members are circled, with the color indicating whether the galaxy’s cluster membership was assigned photometrically (magenta) or spectroscopically (green). Combining all available lines of evidence, Scofield’s team found that XLSSU J021744.1-034536 is undergoing a merger, giving a rare glimpse into this stage of cluster formation. To learn more about this work and what it tells us about galaxy clusters at cosmic noon, be sure to check out the full article linked below.

Citation

“An Active Galaxy Cluster Merger at Cosmic Noon Revealed by JWST Weak Lensing and Multiwavelength Probes,” Zachary P. Scofield et al 2026 ApJL 999 L1. doi:10.3847/2041-8213/ae447a

The post Featured Image: An Active Galaxy Cluster Merger at Cosmic Noon appeared first on AAS Nova.

  •  

Forever Alone: A Black Hole Destined to Stay Too Big

illustration of an accreting black hole

Editor’s Note: Astrobites is a graduate-student-run organization that digests astrophysical literature for undergraduate students. As part of the partnership between the AAS and astrobites, we occasionally repost astrobites content here at AAS Nova. We hope you enjoy this post from astrobites; the original can be viewed at astrobites.org.

Title: The z = 7.08 quasar ULAS J1120+0641 May Never Reach a “Normal” Black Hole to Stellar Mass Ratio
Authors: Meredith A. Stone et al.
First Author’s Institution: University of Arizona
Status: Published in ApJ

The first galaxies in the universe emerged out of an archaic age of darkness. Like luminous factories, they started rapidly churning out stars, spilling light into the cosmos. This process of star formation continues to the present day. In some galaxies, it occurred at astonishing rates, with the equivalent of thousands of times the mass of the Sun being assembled into stars in a single year. At other times, it came to a slow crawl, with all fresh reserves of star-building gas seemingly exhausted. Yet when the gears of star formation ground to a halt, certain events were able to send them spinning again.

One of the most spectacular of these is a merger, a train-wreck collision between two galaxies. Images of these events are often breathtaking, showing arms of light twisting together and vast stellar streams being violently cast away. Mergers directly increase the stellar mass (the mass of all stars) of galaxies by combining two into one. The intense gravitational interactions between the galaxies involved can also disrupt stagnant pools of gas, igniting a new burst of star formation. Thus, interactions between galaxies can be a significant driver of their growth.

Sometimes, a reservoir of matter is driven toward the center of a galaxy due to a “secular” process (one that occurs without external intervention) or from a merger. At the galactic nucleus, the infalling streams of matter encounter a supermassive black hole. The matter falls into a swirling accretion disk, heating to extreme temperatures and furiously glowing. If the black hole is massive enough and the gas falls in quickly enough, the accretion disk can outshine all of the stars in the galaxy, and we call such a source a quasar. The intense radiation produced by a quasar can impact the entire rest of the galaxy, either suppressing the formation of new stars or sometimes igniting it.

Thus, a galaxy has an important role in the growth of its central supermassive black hole, and vice versa. This connection manifests in complicated ways. Most strikingly, it is thought to be the cause of the correlation between a galaxy’s stellar mass and its central black hole mass. In the nearby universe, galaxies have stellar masses around a thousand times greater than their black hole masses. JWST, our most powerful tool for investigating early galaxies, has given us unprecedented insight into whether this holds up in the distant universe. Though the jury is still out, many researchers are convinced that the answer is a resounding no. We’ve found distant black holes that appear to be nearly equal in mass to their host galaxies, something that’s unfathomable in the local universe.

However, this raises a key question. Black holes and their galaxies grow together, and they started on nearly equal footing. So why do all of the galaxies in the nearby universe appear so much more massive than their black holes? Today’s article underscores this puzzle, pushing it to the breaking point. The authors examine a well-studied quasar, ULAS J1120+0641 (hereafter J1120), which we see as it appeared just 750 million years after the Big Bang. This source has a supermassive black hole containing an astounding 20% the mass of its host galaxy. The shocking part is that, even after carefully accounting for all of the ways this galaxy could grow in the future, there appears to be no way for J1120 ever to reach “normal” proportions.

Through the Looking Glass, ULAS J1120

First, the authors analyze the key observations of J1120 obtained to date. In addition to observations from JWST, this source has been targeted by some of the most powerful astronomical facilities, including the Hubble Space Telescope (optical and near-ultraviolet), the Chandra and XMM-Newton observatories (X-rays), the Atacama Large Millimeter/submillimeter Array (radio/millimeter), and numerous other ground-based telescopes. This incredible dataset provides a detailed picture of J1120 across the electromagnetic spectrum, spanning X-rays to radio emission.

The authors compare various measurements of the black hole’s mass and find that multiple methods yield a similar result of about a billion and a half times the mass of the Sun. Turning to the host galaxy, they estimate the mass of the visible stars, which is more complicated than it sounds — you can’t exactly count them, since the enormous distance between us and J1120 causes it to appear as just a fuzzy blob. They combine this mass with the mass of newly forming stars that are buried in dust and obscured from our view. The mass of a nearby galaxy that’s actively merging with J1120 is added to this sum. Finally, the authors compute how many stars could form in the future from all of the gas left in the galaxy, and they throw this into the total.

Even with all of these components, the host galaxy would only be 10 times more massive than the black hole at the center. This ratio is a far cry from the factor of a thousand we expect for normal galaxies in the local universe!

A Train Wreck of Train Wrecks

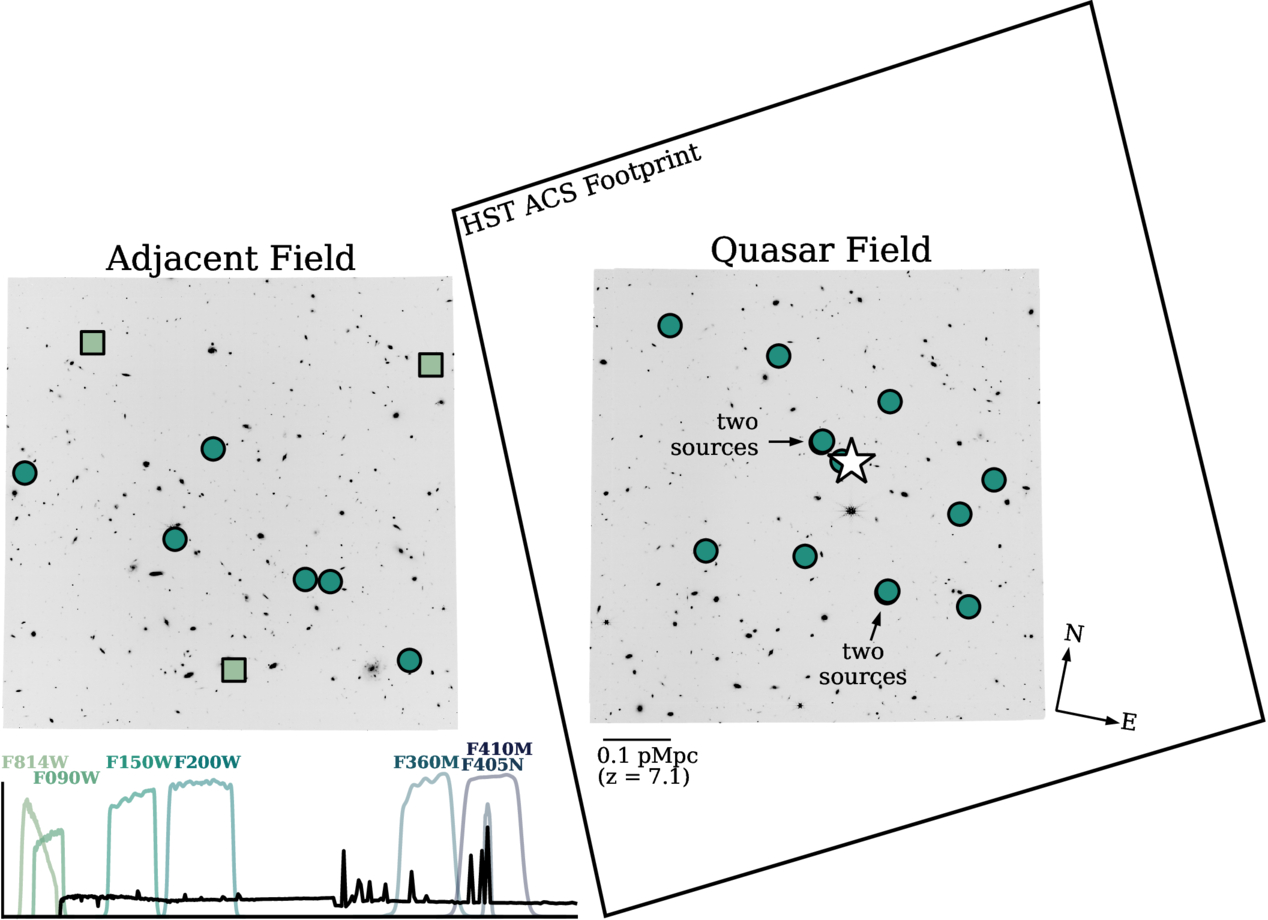
Well, if one merging galaxy won’t do it, what if J1120 merges with literally every single other nearby galaxy? The authors use new JWST data to count all sources near the quasar (Figure 1) and measure their stellar masses. Going further, they estimate how many galaxies their technique may have missed and add all of these to the pile. Not done yet, they finally conclude by making a rough approximation of how much loose gas is in these nearby galaxies, and compute how much extra mass could exist in stars born from this fresh material. Assuming that J1120 survives the full-frontal assault, being battered by mergers from each of its neighbors in turn, its total stellar mass would grow by quite a large factor.

J1120 and nearby galaxies

Figure 1: All of the galaxies found by JWST that are close enough to J1120 to potentially merge with it in the future. The circles mark confident detections, whereas the squares represent galaxies for which the exact distances couldn’t be measured confidently. What would happen if all of these galaxies crashed into J1120? [Stone et al. 2025]

What’s the final result? Shockingly, even after all of this growth, the stellar mass of J1120 would still only be about 40 times that of the central black hole. That’s 25 times less than we’d expect from a nearby galaxy! Even if the black hole never grows again, it appears that this galaxy will never reach “normal” proportions. So why is it that, when we look around at the local universe, there’s nothing like J1120? The authors point out that galaxies near J1120 would be missed by their methods if they are obscured by thick shrouds of gas and dust. Such sources would increase the estimated mass that could be contributed by mergers. On the other hand, maybe J1120 will adopt the strategy of the blue whale, filter feeding on the extremely sparse matter between galaxies, yet growing to enormous proportions.

A fascinating final possibility is that galaxies like this one do exist in the nearby universe. With their black hole switched off, all we would be able to see is a relatively small package of stars. Place such an object far enough away, and we might miss it entirely! Whether galaxies like J1120 achieved normal proportions through unknown mechanisms or are lurking in the far fringes of the local universe, studies like this one shine light on the amazing connection between black holes and their host galaxies. In the future, they will be one key piece in the puzzle of the endlessly complicated past of our own galaxy and the universe at large.

Original astrobite edited by Will Golay.

About the author, Ansh Gupta:

I’m an astronomy graduate student at the University of Texas at Austin working with Steven Finkelstein. I use data from JWST to study the formation and growth of the first galaxies and black holes in the universe. In my spare time, I enjoy playing piano, reading, and making YouTube videos.

The post Forever Alone: A Black Hole Destined to Stay Too Big appeared first on AAS Nova.

  •  

A Black Hole Egg That Forgot to Hatch

galaxies known as little red dots

Editor’s Note: Astrobites is a graduate-student-run organization that digests astrophysical literature for undergraduate students. As part of the partnership between the AAS and astrobites, we occasionally repost astrobites content here at AAS Nova. We hope you enjoy this post from astrobites; the original can be viewed at astrobites.org.

Title: The Discovery of Little Red Dots in the Local Universe: Signatures of Cool Gas Envelopes
Authors: Xiaojing Lin et al.
First Author’s Institution: Tsinghua University and University of Arizona
Status: Published in ApJ

Astronomers are using JWST to search the early universe for strange and captivating objects, and the results so far have exceeded all expectations. For every question we definitively answer, several deeper ones seem to emerge. The study of active galactic nuclei (AGNs), black holes that are actively consuming matter at the centers of galaxies across the universe, is no exception. Our pre-JWST understanding of AGNs has been completely shattered by the discovery of an astounding population of objects called little red dots (LRDs).

We know these objects host active black holes for several reasons. For one, they’re incredibly small despite being extremely energetic (that’s the “little” in their name). The smallest LRD we’ve seen appears to be less than 100 light-years across — for reference, the nearest star to the Sun is 4 light-years away — and yet is still as bright as a galaxy. The most plausible explanation for such brightness and compactness is a supermassive black hole that’s actively consuming matter. As further evidence for this hypothesis, we observe broad Balmer emission lines, spectral features that serve as a clear signature of AGN activity, in the vast majority of LRDs.

However, that’s where the similarities between LRDs and more typical AGNs seem to end. First off, astronomers have been unable to detect any significant X-ray emission from LRDs. This is shocking, since X-rays are a telltale signature of previously known AGNs. Another classic way to identify AGNs is by looking for changes in their brightness over time, since they can show drastic variability in their emission on the scale of years or even days. LRDs buck the trend by showing little to no fluctuation. Other classic AGN signatures that LRDs lack include radio emission and an abundance of hot dust. Explaining all of these unusual features has been incredibly challenging; nevertheless, coming up with a solution is crucial because there appear to be orders of magnitude more LRDs than any other kind of AGN in the early universe!

Wishing on a Star

One leading explanation for LRDs has recently gained significant traction. The hypothesis suggests that early black holes may have been cocooned in shrouds of extremely dense gas. This scenario helps explain the absence of many typical AGN signatures in LRDs. For example, this dense gas could absorb the X-rays generated by the central black hole. The gas-enshrouded model also explains a particular feature in the spectra of many LRDs known as a Balmer break. This feature is usually interpreted as coming from old stars with relatively cool atmospheres. The cocooned AGN hypothesis implies that Balmer breaks could actually be made by a black hole embedded in a cloud of gas, which somewhat resembles an enormous star!

This model helps explain the properties of some puzzling LRDs, including the most distant one we currently know of. However, their enormous distance makes them difficult to study in detail. It would be much easier to examine LRDs if they existed in the nearby universe, since they would appear much brighter and we could probe them on small spatial scales. Unfortunately, previous studies with JWST suggest that LRDs started becoming a lot less common around 12 billion years ago (corresponding to a redshift of about z = 4).

Luckily, less common doesn’t mean extinct! The authors of today’s article leverage data from the Sloan Digital Sky Survey (SDSS), which has taken millions of spectra of objects across the night sky over the past few decades. By mining this rich and diverse dataset, they identify a handful of LRDs in the nearby universe. Although they’re still far beyond our own Local Group, they’re practically in our backyard compared to the distant LRDs we’ve seen before. The authors followed up the new sources with some of the most powerful ground-based telescopes, enabling a detailed study of their properties.

A Chick That Forgot to Hatch

The first major result is that these local LRDs really do resemble many of the distant ones identified by JWST. They show a characteristic “V”-shaped spectrum in the ultraviolet and visible, a key feature in the definition of LRDs. They’re also quite compact. Using existing data from the Hubble Space Telescope, the authors measured the size of one source and found a tiny core embedded within a galaxy only a few thousand light-years across. For comparison, the Milky Way spans about 100,000 light-years.

Using spectroscopy from the Large Binocular Telescope, one of the Magellan Telescopes, and the MMT (formerly Multiple Mirror Telescope), the authors of this article find a rich variety of spectral features. This is where the proximity of these objects is extremely important. Taking spectra of the distant LRDs in this astounding level of detail would be at best prohibitively expensive (multiple full days of JWST observations) and at worst be completely impossible. In contrast, the nearby LRDs appear much brighter than their distant cousins. Their spectra are like intricate tapestries, with each thread revealing new details about their properties.

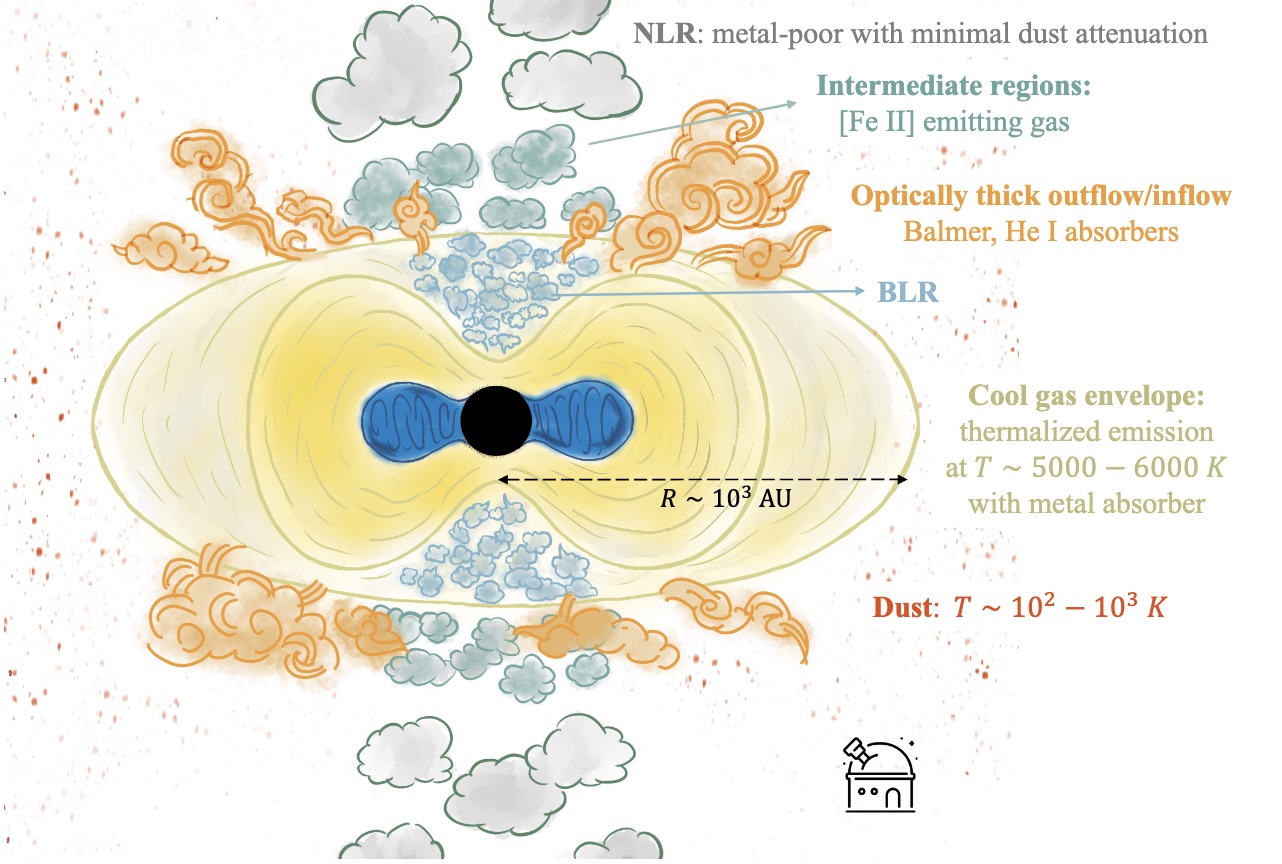
The authors find numerous broadened emission lines, signaling the presence of an active black hole. They also detect several intriguing absorption lines. These are most striking in one source, J1025+1402, nicknamed “The Egg.” In this object, there are clear absorption features from sodium, potassium, iron, and calcium. These elements appear in the observed states only under specific physical conditions. The authors interpret these findings as implying the presence of an envelope of cool gas surrounding the central black hole (see Figure 1). Such a scenario closely resembles the gas-cocooned AGN model proposed to explain distant LRDs!

schematic of a little red dot model

Figure 1: A schematic showing the authors’ interpretation of the nature of LRDs. This scenario is built up based on spectroscopic observations from several ground-based telescopes. Although the local sources differ slightly from the ones in the early universe, this model is strikingly similar to the ones invoked to explain some of the most extreme LRDs. The fact that such objects exist in the nearby universe is intriguing and raises further questions as to how black holes enter such a phase. [Lin et al. 2026]

These observations provide direct evidence for a potentially new kind of AGN. These local objects do differ slightly from their more distant counterparts; for example, they show some emission from hot dust, which is absent in early LRDs. Still, this adds another piece to the puzzle of this cosmic mystery. The authors hope that future observations will further illuminate the inner workings of LRDs across cosmic time. For example, studies may reveal what objects “hatch” from a source like the Egg, offering new insight into the life cycles of these unusual AGNs.

Original astrobite edited by Niloofar Sharei.

About the author, Ansh Gupta:

I’m an astronomy graduate student at the University of Texas at Austin working with Steven Finkelstein. I use data from JWST to study the formation and growth of the first galaxies and black holes in the universe. In my spare time, I enjoy playing piano, reading, and making YouTube videos.

The post A Black Hole Egg That Forgot to Hatch appeared first on AAS Nova.

  •  

Too Much Nitrogen Pops Open the Search for the Universe’s First Stars

Star formation in the early universe.

Astronomers have long sought evidence of the universe’s first generation of stars, and as more distant galaxies come into view, it seems these stars may finally be within reach.

JWST deep field

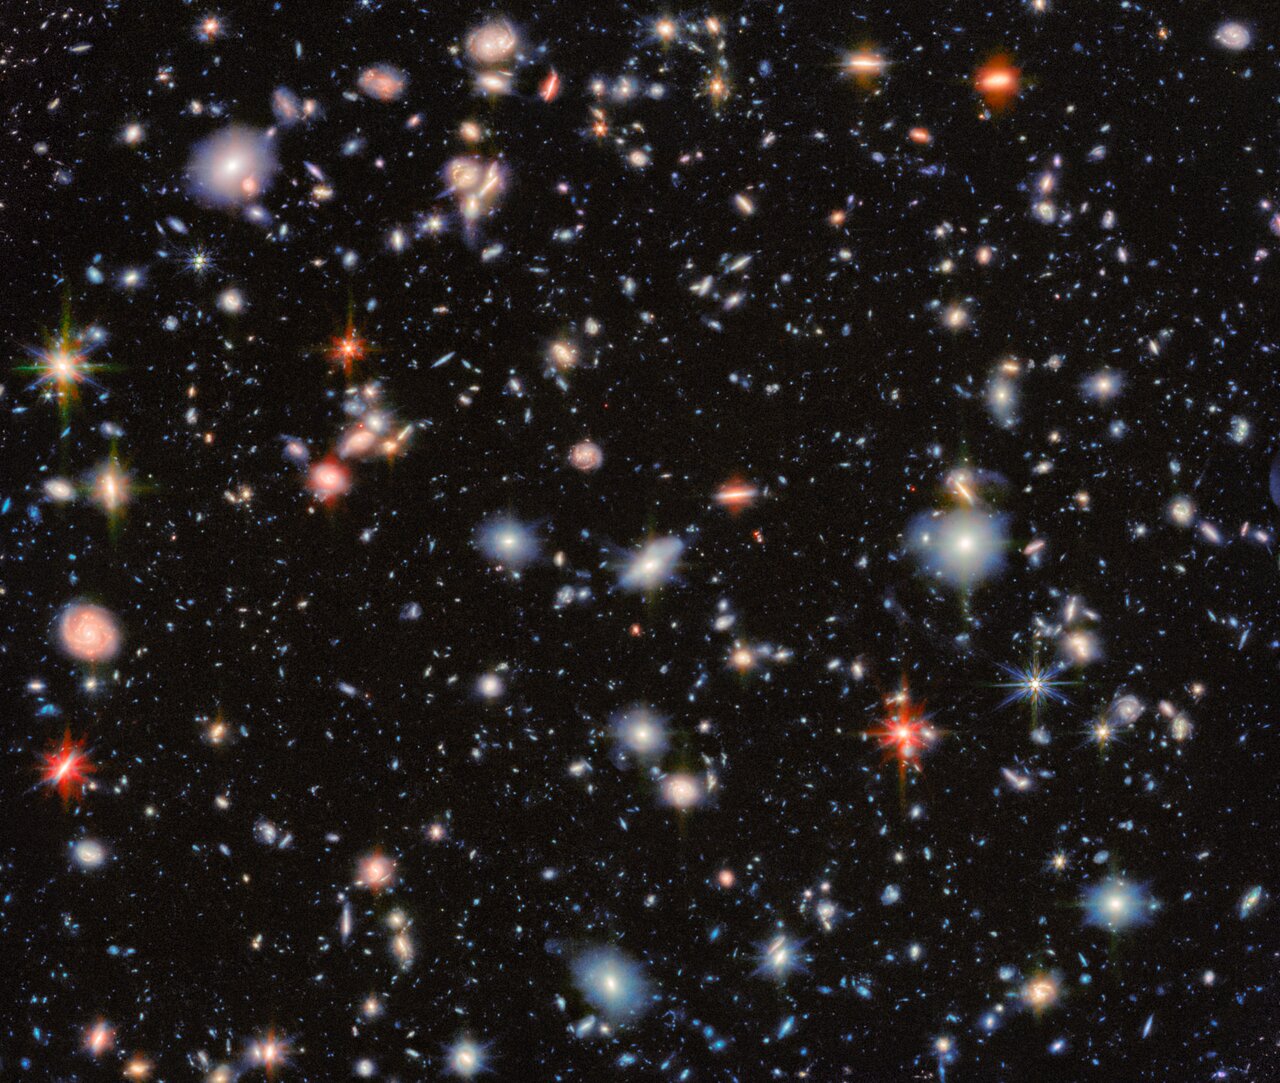
JWST spies thousands of distant galaxies in the classic Hubble Deep Field — many galaxies being uncovered for the first time with the space telescope’s powerful instruments. [ESA/Webb, NASA & CSA, G. Östlin, P. G. Perez-Gonzalez, J. Melinder, the JADES Collaboration, the MIDIS collaboration, M. Zamani (ESA/Webb); CC BY 4.0]

Excess Metals Popping Up

Since its 2021 launch, JWST has given astronomers eyes to peer into the distant past, discovering many galaxies whose light reveals the universe’s early stages of star and galaxy formation. Within the population of newly discovered galaxies are a few with bizarre chemical properties that, upon first pass, seem to be too enriched to exist so early in the universe. These hard-to-reconcile abundances may be a sign of the universe’s first stars. 

Known as Population III (Pop III) stars, the first stars in the universe were born out of giant clouds of pristine gas (hydrogen, helium, and a little lithium) and were able to form at masses hundreds to thousands of times the mass of our Sun. Though they burned bright, they did not burn for very long, ending their lives in violent supernovae and chucking their newly enriched guts back into their surroundings. While these stars are long dead, the chemical imprints they left on their host galaxies can persist  — and understanding how Pop III stars create and distribute metals could clue us in to the odd chemical signatures recently found with JWST.

Too Much Nitrogen in GS 3073

Researchers have identified a few galaxies exhibiting high nitrogen-to-oxygen (N/O) ratios that cannot be explained by stars similar to those in the universe today. A couple of these galaxies could be explained through multiple stellar populations, rapidly rotating stars, massive explosions, or the early stages of globular cluster formation. However, GS 3073, a galaxy with a redshift of z = 5.55 (about one billion years after the Big Bang), has an N/O excess so high that is has, so far, defied explanation.

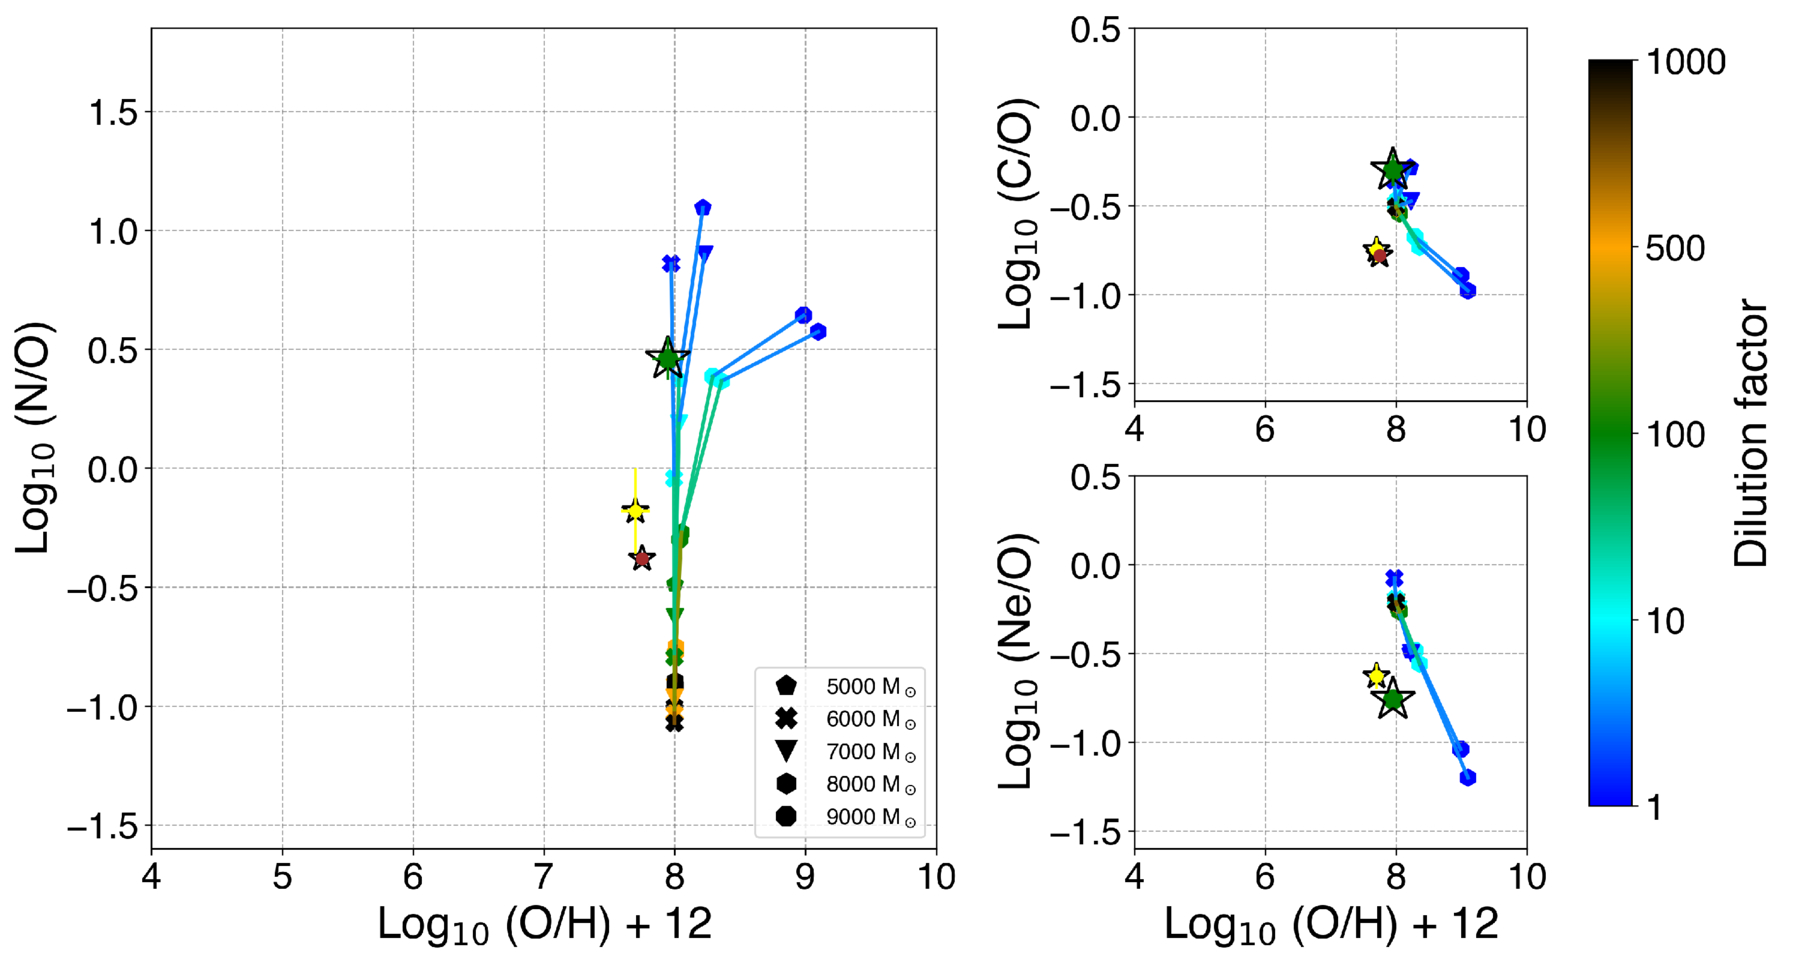
Aiming to make sense of this bizarre phenomenon, Devesh Nandal (University of Virginia; Center for Astrophysics | Harvard & Smithsonian) and collaborators used stellar evolution models to see if Pop III stars could be the culprit. Modeling stars with masses 1,000–10,000 times the mass of our Sun, the authors traced the elemental yields of these supermassive stars as they go through the various stages of nuclear burning. The analysis takes into account mixing within the stars, mass loss throughout their lifetimes, and how the eventual supernova ejecta mixes within the interstellar medium.

N/O, C/O, and Ne/O abundance ratios of five modeled supermassive Pop III stars taking into account the contribution from other stars in the galaxy and the Pop III star losing 10% of its mass over its lifetime. The green star indicates the observed ratios of GS 3073. Click to enlarge. [Nandal et al 2025]

From this modeling, the authors found that massive Pop III stars between 1,000 and 10,000 solar masses can produce the observed elemental abundances measured for GS 3073. Stars less massive do not produce high enough N/O ratios, and stars more massive have much lower oxygen-to-hydrogen ratios — strongly suggesting upper and lower mass limits to the possible supermassive stars that could have produced GS 3073’s chemical composition.

Finally Evidence of Pop III Stars?

This study of GS 3073 is the first of its kind to confirm the chemical imprints of Pop III stars on their host galaxy at this redshift. The unique nitrogen abundance can only be produced through the evolutionary phases of Pop III stars that burn quickly enough to produce and release an excess amount of nitrogen while other elements stay consistent. From their modeling, the authors suggest that galaxies with even higher nitrogen excess could exist, and further observations with JWST may just find them. 

The search for Pop III stars is booming — another recent study (Visbal et al 2025) examines the galaxy LAP1-B. While GS 3073 shows evidence of Pop III stars through chemical abundances, the study of LAP1-B finds that the galaxy matches theoretical predictions for the formation environments and mass distributions of Pop III stars. Both of these recent research works are laying the groundwork for the wealth of discovery possible with JWST, and the universe’s first stars are no longer out of reach.

Citation

“1000–10,000 M⊙ Primordial Stars Created the Nitrogen Excess in GS 3073 at z = 5.55,” Devesh Nandal et al 2025 ApJL 994 L11. doi:10.3847/2041-8213/ae1a63

The post Too Much Nitrogen Pops Open the Search for the Universe’s First Stars appeared first on AAS Nova.

  •  

A Dust Curve That Breaks the Mold

Tarantula Nebula

Editor’s Note: Astrobites is a graduate-student-run organization that digests astrophysical literature for undergraduate students. As part of the partnership between the AAS and astrobites, we occasionally repost astrobites content here at AAS Nova. We hope you enjoy this post from astrobites; the original can be viewed at astrobites.org.

Title: The AURORA Survey: The Nebular Attenuation Curve of a Galaxy at z = 4.41 from Ultraviolet to Near-Infrared Wavelengths
Authors: Ryan L. Sanders et al.
First Author’s Institution: University of Kentucky
Status: Published in ApJ

Imagine a galaxy from 13 billion years ago, long before the Milky Way took its current form. Now picture trying to uncover the secrets of that ancient galaxy. How quickly did it create stars and evolve? Here’s the tricky part: its light has journeyed across an unimaginable distance to get here. On its journey, cosmic dust — tiny grains of carbon and silicates — has scattered and dimmed the light, making the task harder.

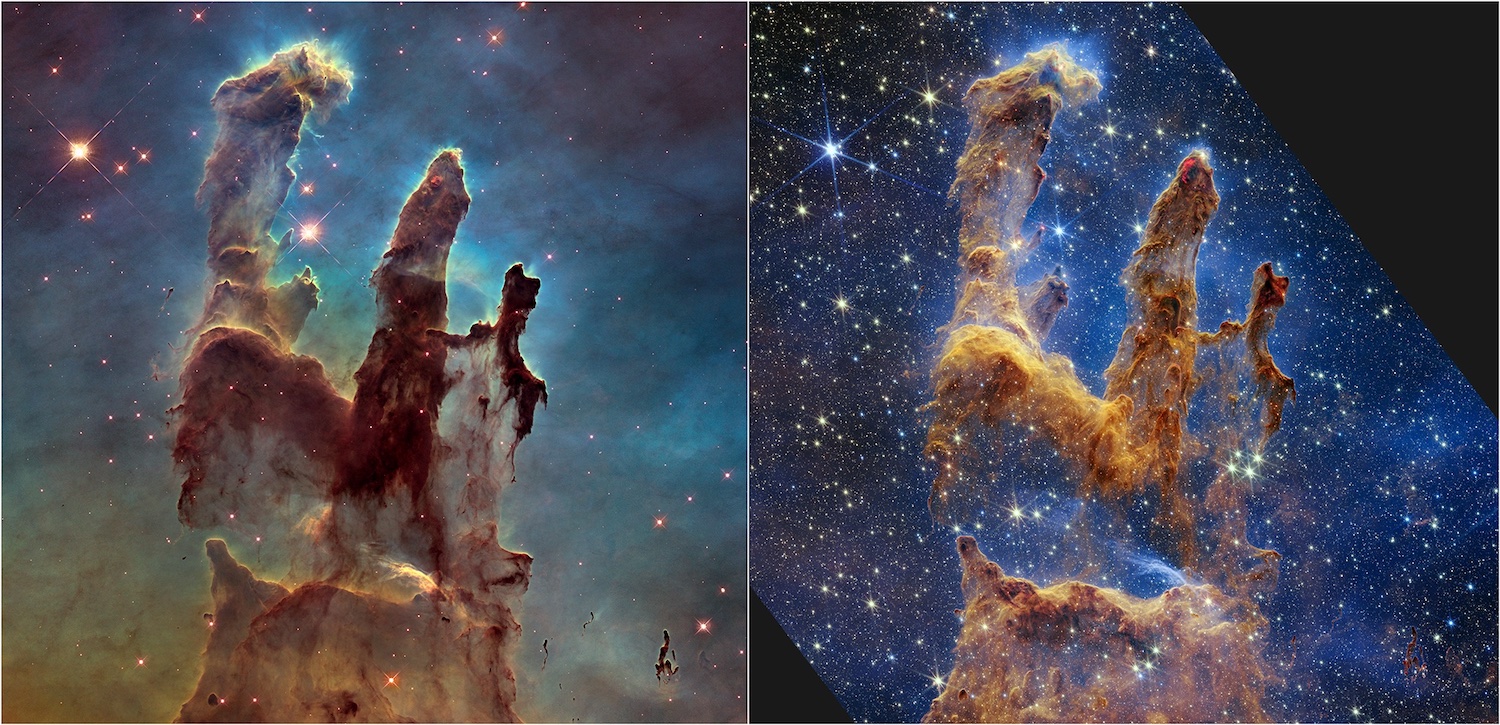
Dust doesn’t just block light — it changes it. Ultraviolet (UV) light gets scattered much more than light at longer wavelengths, which is why galaxies seem redder and dimmer than they truly are. This dual nature can be seen in the “Pillars of Creation,” in Figure 1. A new near-infrared image from NASA’s JWST, shown in the right panel below, helps us peer through more of the dust in this star-forming region. The thick, dusty brown pillars are no longer as opaque, and many more red stars that are still forming come into view.

Pillars of creation as seen by Hubble and JWST

Figure 1: On the left, NASA’s Hubble Space Telescope captures the iconic Pillars of Creation in stunning visible light (2014). On the right, JWST unveils a breathtaking infrared view, revealing even more details hidden within the cosmic dust. [NASA, ESA, CSA, STScI; Joseph DePasquale (STScI), Anton M. Koekemoer (STScI), Alyssa Pagan (STScI)]

To quantify how dust affects light at different wavelengths, astronomers use dust curves — tools that reveal how much light is blocked or scattered, helping them correct for dust-induced distortions. For instance, the Milky Way’s curve stands out with a distinct “bump” around 2175 Å, which comes from tiny carbon-based particles in the dust. But the Small Magellanic Cloud (SMC) tells a different story. Its curve is steeper in the UV and doesn’t have that bump at all. These differences aren’t just random — they give us clues about the size, makeup, and distribution of dust grains in each galaxy. (See Figure 3 below for a visualization of these dust curves.)

But here’s the catch: most of the dust curves we have were designed for galaxies much closer to us, like the Milky Way or the SMC, so they may not apply in the exact same way to distant galaxies. Whether those same curves work for the much younger, chaotic galaxies of the early universe is an open question. The dust in nearby galaxies is well studied and relatively predictable, but does dust behave the same way in galaxies billions of years in the past?

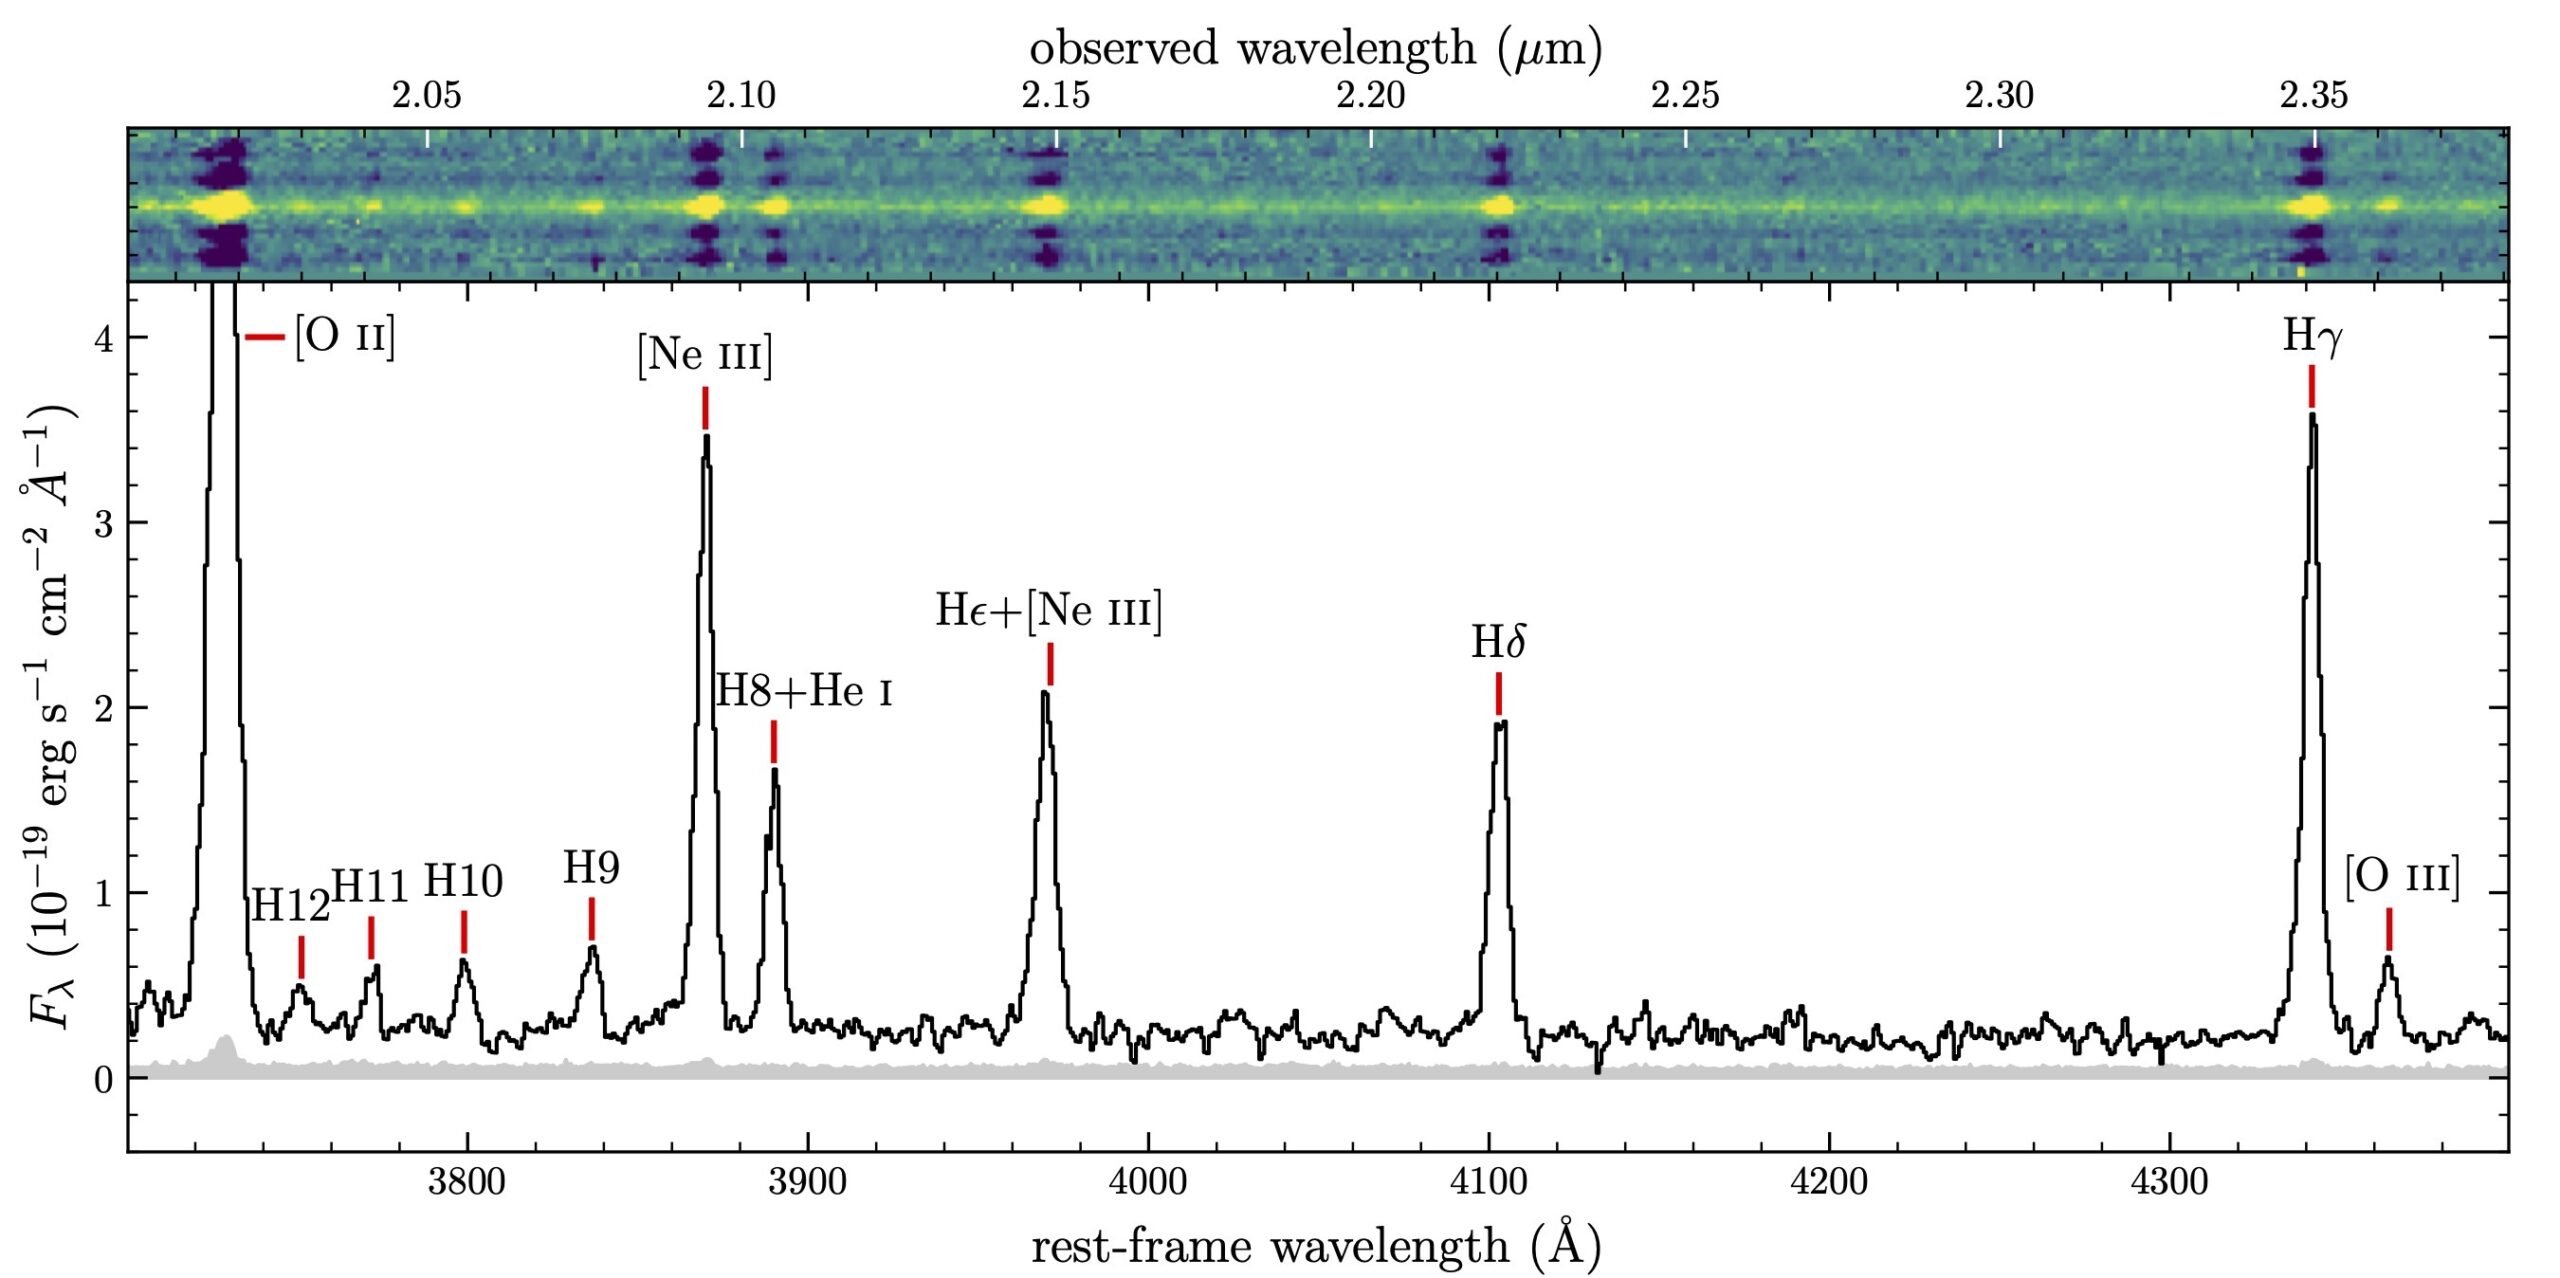
This question drove Ryan Sanders and collaborators to study GOODSN-17940, a starburst galaxy located at a redshift of z = 4.41, when the universe was just 1.36 billion years old. Observed as part of the Assembly of Ultradeep Rest-optical Observations Revealing Astrophysics (AURORA) survey using JWST, this galaxy provided an unprecedented opportunity to investigate how dust behaved in the distant past. Using JWST’s NIRSpec instrument, the team constructed a unique dust curve by studying 11 hydrogen emission lines from Hα to H12 (the twelfth line in the rest-frame optical Balmer series), shown in Figure 2. These lines act like lighthouses, their brightness giving away how much light is being absorbed by dust at each wavelength. By comparing the observed brightnesses of these lines, the researchers created a detailed dust curve tailored to GOODSN-17940.

Spectrum of GOODSN-17940

Figure 2: Spectrum of GOODSN-17940 from the AURORA survey, showing hydrogen Balmer lines. These features help estimate the galaxy’s dust and ionization conditions. The top panel presents the 2D spectrum, showing spatially resolved emission that traces the galaxy’s structure, while the bottom panel shows the corresponding 1D spectrum. [Adapted from Sanders et al. 2025]

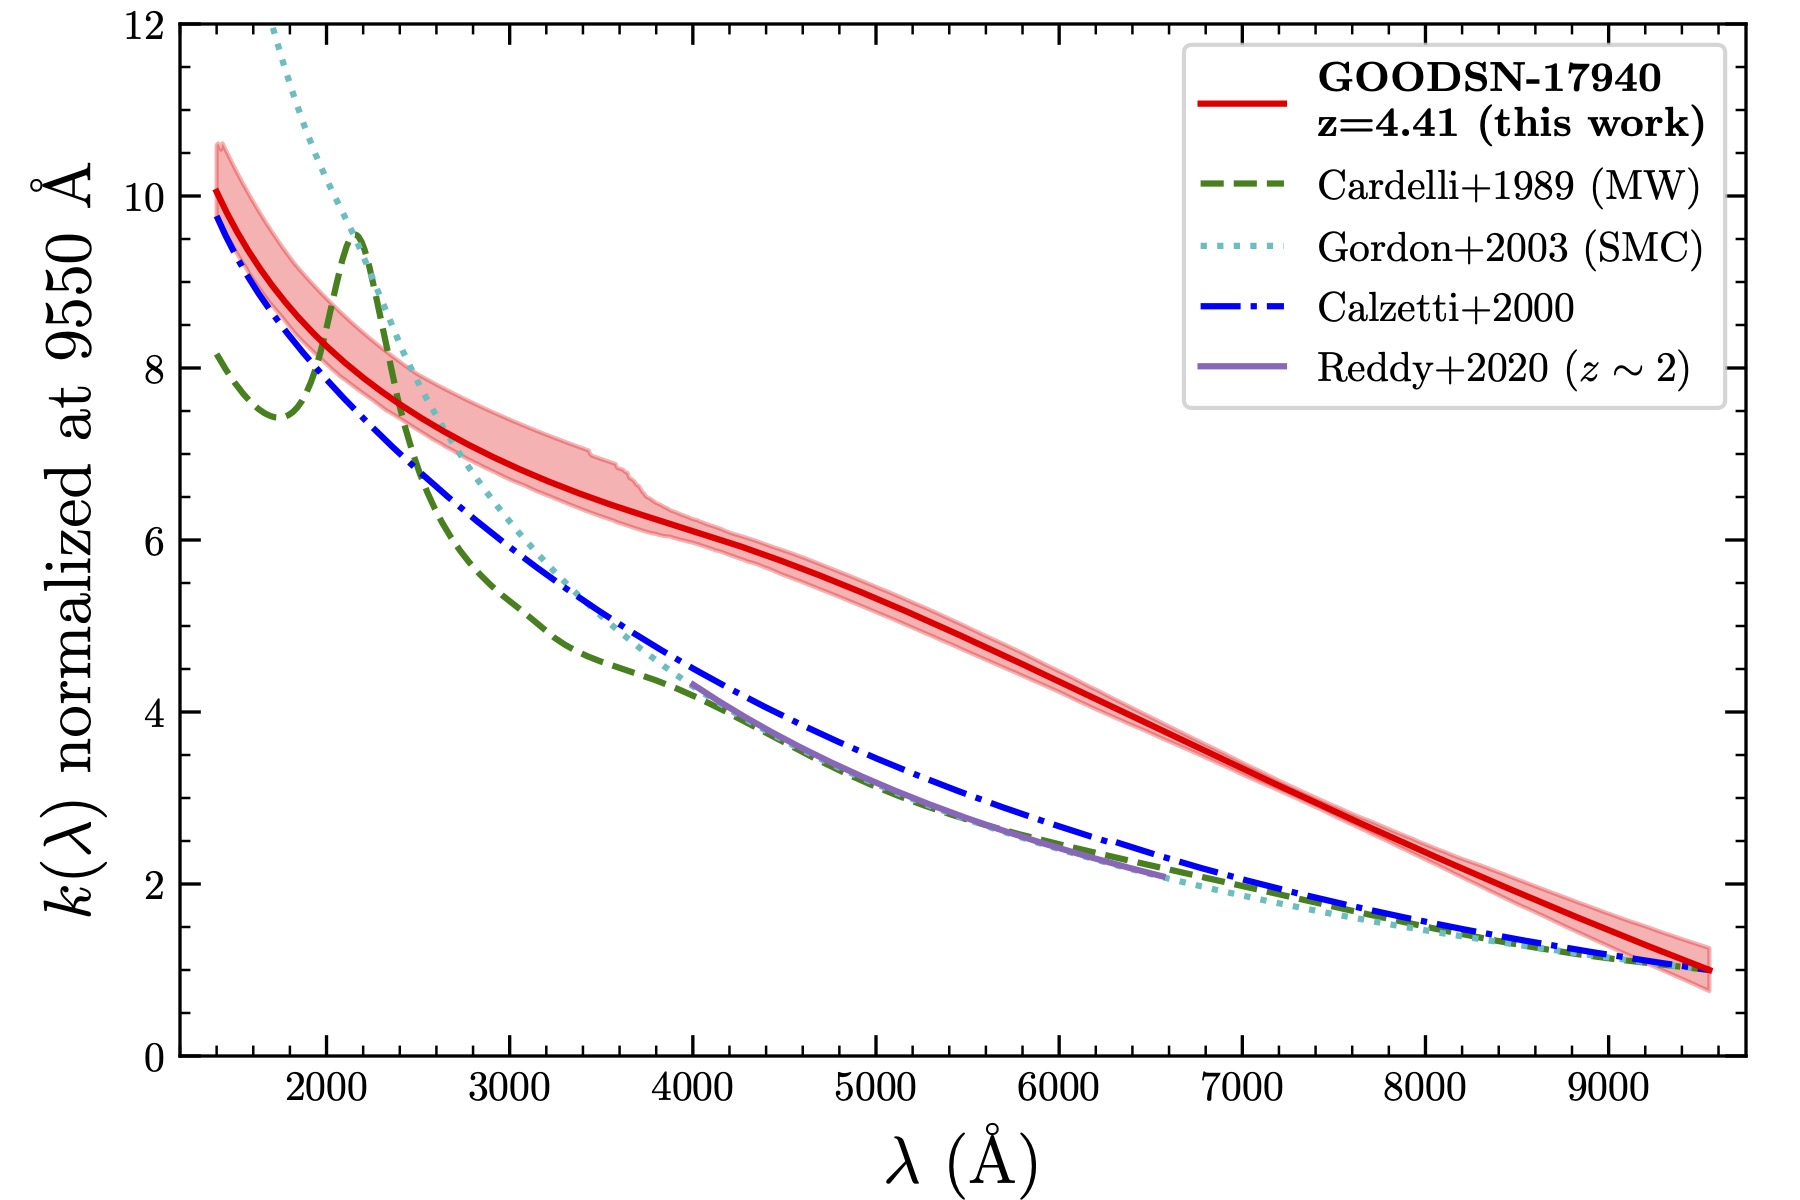
GOODSN-17940’s dust curve is shown in Figure 3. The y-axis represents the factor by which light is blocked/scattered by dust compared to this amount at 9550 Å. For example, a value of 2 means that light at that wavelength is attenuated two times more than light at 9550 Å.
dust attenuation curve of a redshift 4.41 galaxy compared to nearby galaxies

Figure 3: The dust curve of GOODSN-17940 (solid red line) at z = 4.41, derived in this work, compared to established curves for the Milky Way (green dashed), Small Magellanic Cloud (SMC, dotted cyan), Calzetti et al. (blue dot-dashed), and Reddy et al. z ~ 2 galaxies (purple solid). This curve is steeper in the near-infrared and flatter in the UV, highlighting unique dust properties in this galaxy. [Sanders et al. 2025]

This dust curve is surprising. In the near-infrared, it is much steeper than the curves of the Milky Way or SMC. This suggests the galaxy’s dust grains might be smaller or distributed differently. But in the UV, the curve flattens out, showing less absorption than classical models predict. And unlike the Milky Way’s dust, there’s no 2175 Å bump at all. These findings hint at a galaxy with truly unique dust properties, shaped by its extreme youth and chaotic star-forming environment. But here’s the twist — GOODSN-17940 isn’t just any galaxy. Its star formation rate is 40 times higher than typical galaxies at its redshift. While rare at redshifts of z ∼ 2–4, galaxies like this are more common in the epoch of reionization, suggesting that what we’ve learned from GOODSN-17940 could apply to reionization-era galaxies — the ones that played a key role in shaping the early universe.

So, why does this even matter? If you used the Milky Way’s dust curve to adjust for the dust in a galaxy like GOODSN-17940, you’d be way off. In fact, you’d underestimate its star formation rate by up to 50%! This isn’t just a minor detail — it could explain why star formation rates derived from Hα don’t always match those derived from UV luminosity. Such details can completely change how we interpret a galaxy. It’s the difference between a galaxy steadily forming stars and one caught in a dramatic starburst phase. That’s why astronomers focus on creating dust curves tailored to individual galaxies. This study isn’t just about one galaxy — it’s about rethinking how we interpret dust, star formation, and galaxy evolution in the early universe. Before JWST, isolating individual emission lines from distant galaxies was challenging, but it has become much more efficient now. As more galaxies like GOODSN-17940 are studied, we might find that many early galaxies had dust curves breaking the mold, forcing us to refine how we measure star formation and understand cosmic history.

Original astrobite edited by Hilary Diane Andales and Delaney Dunne.

About the author, Niloofar Sharei:

I’m a third-year Astronomy PhD student at University of California, Riverside, where I study bursty star formation histories and how galaxies take shape. When I’m not busy exploring the universe, you can usually find me curled up with a good book, hiking somewhere peaceful, trying astrophotography, or getting lost in Bach’s music and art.

The post A Dust Curve That Breaks the Mold appeared first on AAS Nova.

  •  

All Alone With No AGN to Call Home? New Results for Little Red Dots

little red dots

Among the discoveries JWST has made since its 2021 launch, “little red dots” are one of the most perplexing. Named for their compact size and red color, the origins of these distant galaxies remain unknown. A recent article explores some little red dots’ spectral energy distributions and local environments to better understand what may be lighting up these tiny torches.

Little Red Dot Dilemma

Along with their size and color, little red dots exhibit “V”-shaped spectral energy distributions (how they emit light across wavelengths), broad hydrogen emission lines, and no observed X-ray emission. These properties land them in an untapped parameter space with some similarities to both active galactic nuclei (AGNs) and stellar populations. Some previous investigations have suggested that little red dots contain AGNs, reddened by a dusty accretion disk scattering or blocking AGN light. Other studies have found that models for stellar populations can also fit certain little red dot spectra well. 

Adding to the ambiguity, observations and theory predict AGNs to show broad spectral lines, which are present in little red dots — but if little red dots are AGNs, this implies a much higher density of AGNs in the early universe than previously predicted by ground-based surveys. Furthermore, AGNs are expected to emit in the X-ray and show photometric variability, but neither property has been detected definitively thus far for a little red dot. With a clear dilemma arising for the origins of little red dots, astronomers are still prodding at these curious sources.  

AGN or Not?

AGN vs non-AGN fits

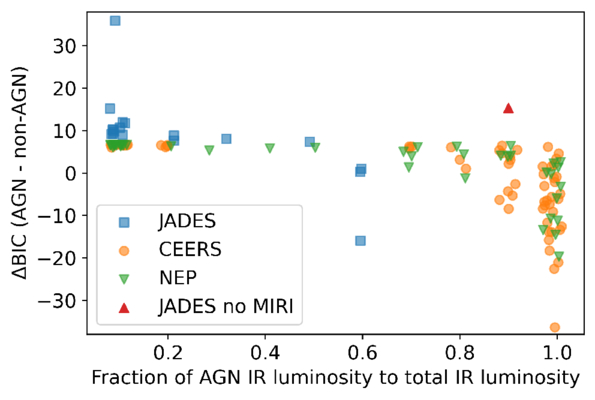
Comparison of AGN versus non-AGN fits using the Bayesian information criterion (BIC). Positive values of ΔBIC favor a non-AGN fit, and ~70% of little red dots have positive ΔBIC. Click to enlarge. [Carranza-Escudero et al 2025]

Leveraging the wealth of data available from recent JWST surveys, María Carranza-Escudero (University of Manchester) and collaborators built a sample of 124 little red dots spanning redshifts of z ~ 3–10. The authors used both AGN and non-AGN models to fit the spectral energy distribution for each galaxy. 

Using a robust statistical analysis, the authors found that AGN models tend to “overfit” the data — with more free parameters, an AGN model can be tweaked in a way that may not actually be physical (e.g., fitting for extremely high dust extinction that would not be possible). Instead, models without AGN components appear to be more appropriate for about 70% of the little red dots in their sample, suggesting that these peculiar objects may have a significant star-forming component powering their emission. 

environments histograms

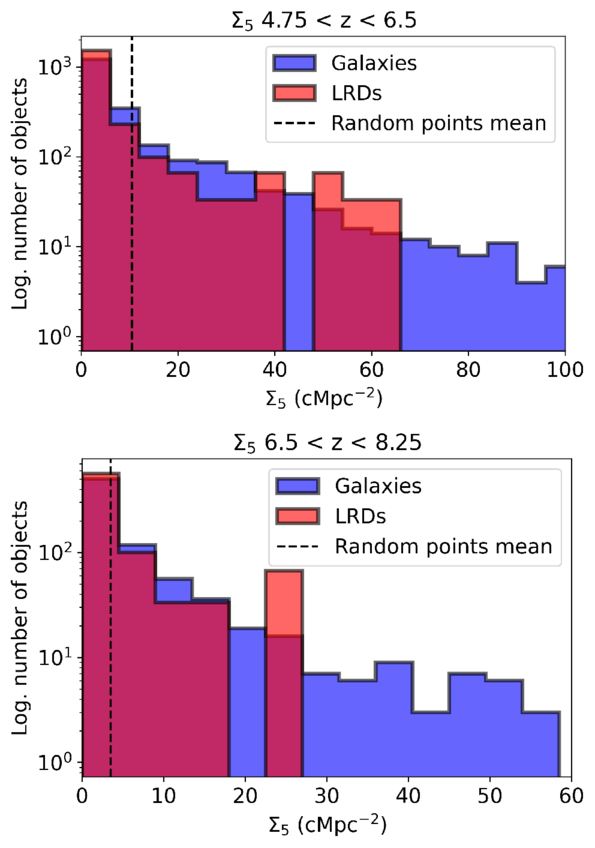
Histograms for two redshift windows showing that little red dots (red) tend to be found in less dense environments than other galaxies (blue) in the same redshift window. Click to enlarge. [Carranza-Escudero et al 2025]

Lonely Neighborhoods

In addition to characterizing little red dots’ emission, the authors analyzed the local environments to compare to other galaxies at similar redshifts. From their analysis, they found that little red dots tend to be found in sparser environments, generally isolated from other galaxies. One explanation for this could be that little red dots in higher-density environments evolve past this peculiar stage faster, which is supported by observations of high-density environments accelerating the evolution of other galaxy types at similar redshifts. However, further investigation is required to better understand the connection between the local environment and little red dot properties. 

More little red dots are yet to be discovered, and continued analysis of their emission and environments will uncover more intriguing characteristics. For now, it seems as though little red dots are still a mystery.

Citation

“Lonely Little Red Dots: Challenges to the Active Galactic Nucleus Nature of Little Red Dots through Their Clustering and Spectral Energy Distributions,” María Carranza-Escudero et al 2025 ApJL 989 L50. doi:10.3847/2041-8213/adf73d

The post All Alone With No AGN to Call Home? New Results for Little Red Dots appeared first on AAS Nova.

  •  

Distant Little Red Dot Hosts a Huge (and Growing) Black Hole

Illustration of an accreting supermassive black hole shrouded by dust

Astronomers have confirmed the discovery of a little red dot galaxy from when the universe was roughly half a billion years old. The galaxy, CAPERS-LRD-z9, is the most distant object to show the tell-tale broad emission lines of gas spiraling around a black hole, opening a new window onto black hole growth in the early universe.

Little Red Dots in the Spotlight

Images of six "little red dot" galaxies from JWST

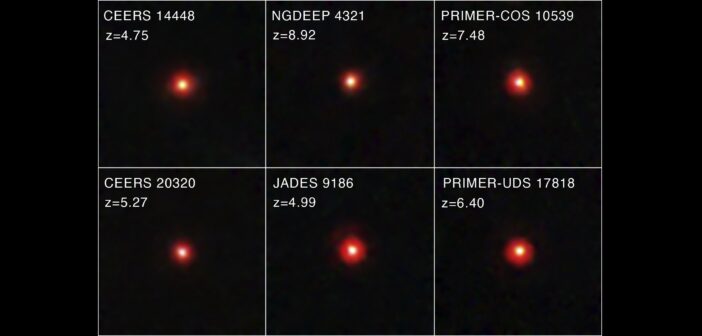
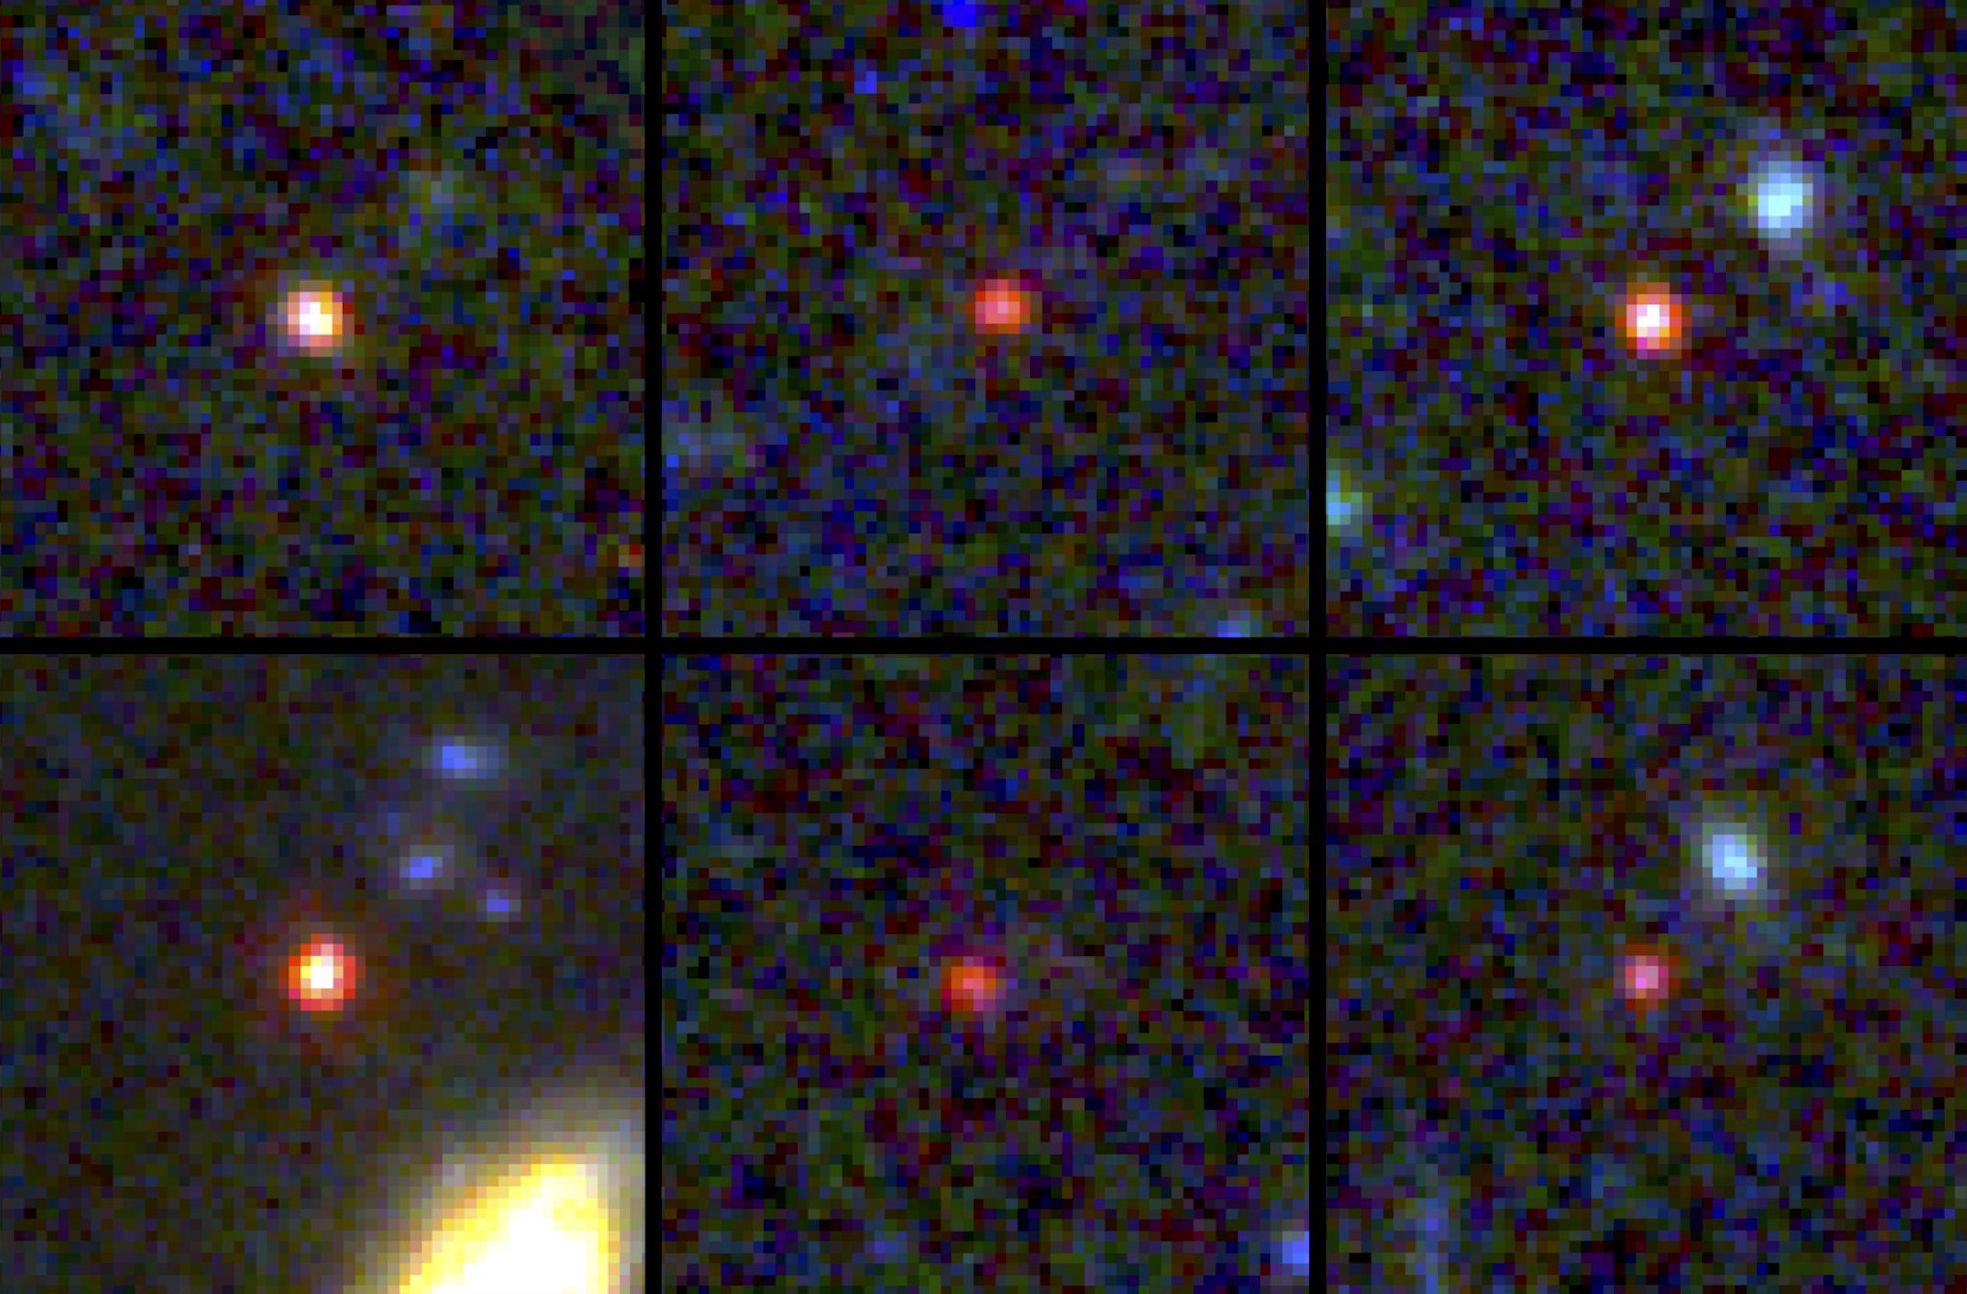
Images of six “little red dot” galaxies from JWST. [NASA/ESA/CSA/I. Labbe]

Of all the discoveries JWST has enabled since its launch, none seems as enduringly mysterious as the tiny, distant galaxies nicknamed “little red dots.” These early universe objects are characterized by their small sizes, red color in JWST images, and V-shaped spectra.

But what are little red dots? Are they growing supermassive black holes busily amassing gas? Compact collections of old stars? Shredded stars spoon-feeding baby black holes? As reported today in the Astrophysical Journal Letters, new JWST data provide answers for one particularly distant dot.

JWST Takes Another Look

CAPERS-LRD-z9 was first identified as a possible high-redshift little red dot when it was observed by the Public Release IMaging for Extragalactic Research (PRIMER) survey with JWST’s Near-Infrared Camera (NIRCam). Anthony Taylor (The University of Texas at Austin) and collaborators followed up on the discovery with JWST Near-Infrared Spectrograph (NIRSpec) observations from the CANDELS-Area Prism Epoch of Reionization Survey (CAPERS). This spectrum pinned the object’s redshift at z = 9.288, corresponding to when the universe was only about half a billion years old.

With CAPERS-LRD-z9 placed along the cosmic timeline, Taylor and coauthors turned to the question of its identity. The JWST spectra revealed a broad emission line from hydrogen gas moving at thousands of kilometers per second — evidence that CAPERS-LRD-z9 harbors an accreting supermassive black hole (an active galactic nucleus or AGN) that is spinning gas into a frenzy around it. CAPERS-LRD-z9 is the most distant object known to show this characteristic signature of a growing black hole.

JWST spectrum of CAPERS-LRD-z9

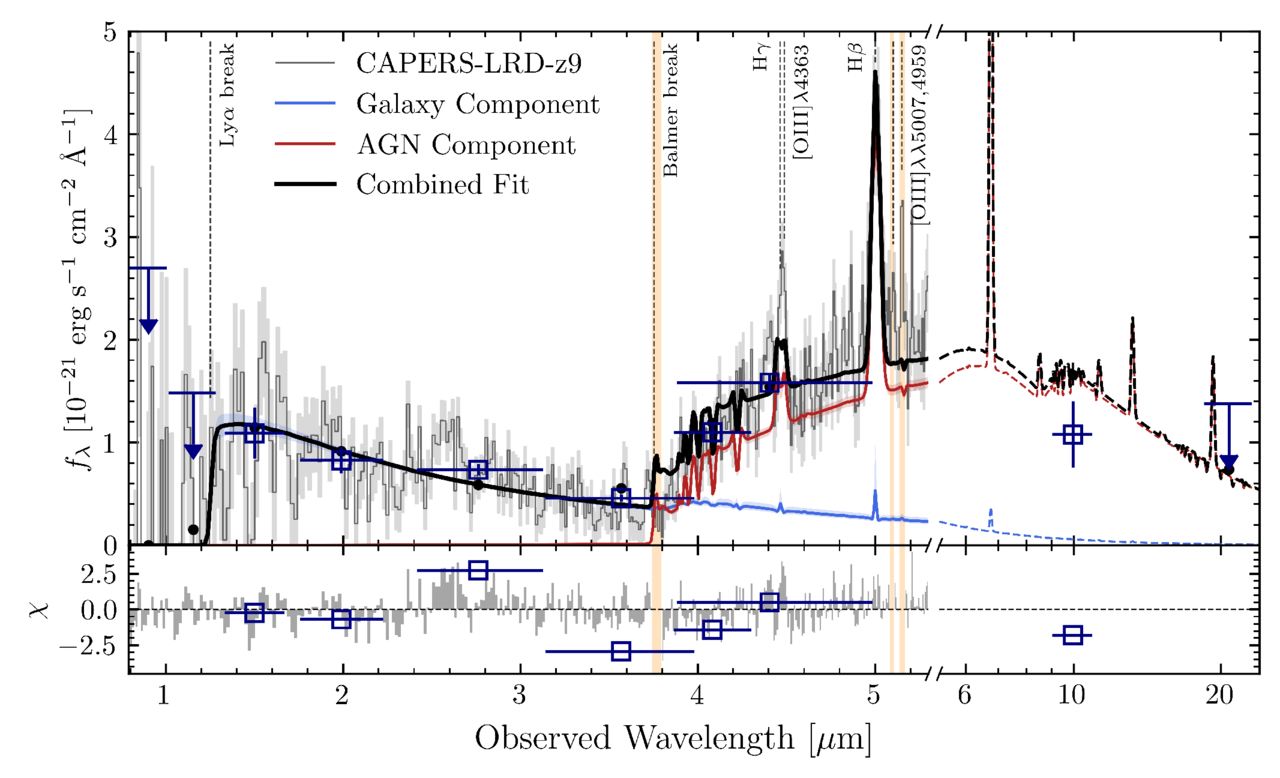
JWST NIRSpec spectrum of CAPERS-LRD-z9 with the fit from the AGN (red) plus stars (blue) model. Click to enlarge. [Taylor et al. 2025]

Next, the team examined the little red dot’s spectral energy distribution, using a model that includes an AGN and a stellar population. To reproduce the step-like discontinuity seen in CAPERS-LRD-z9’s spectrum, they used a model in which the supermassive black hole is shrouded in a shell of dusty gas. The model fit well with a black hole mass of 38 million solar masses (though the authors estimate the mass could be anywhere in the range of 4.5–316 million solar masses), an upper limit of 1 billion solar masses on the stellar mass, and a gas density of 1010 per cubic centimeter surrounding the black hole.

Seeding a Black Hole

plot of black hole mass versus redshift for detected AGN and quasars

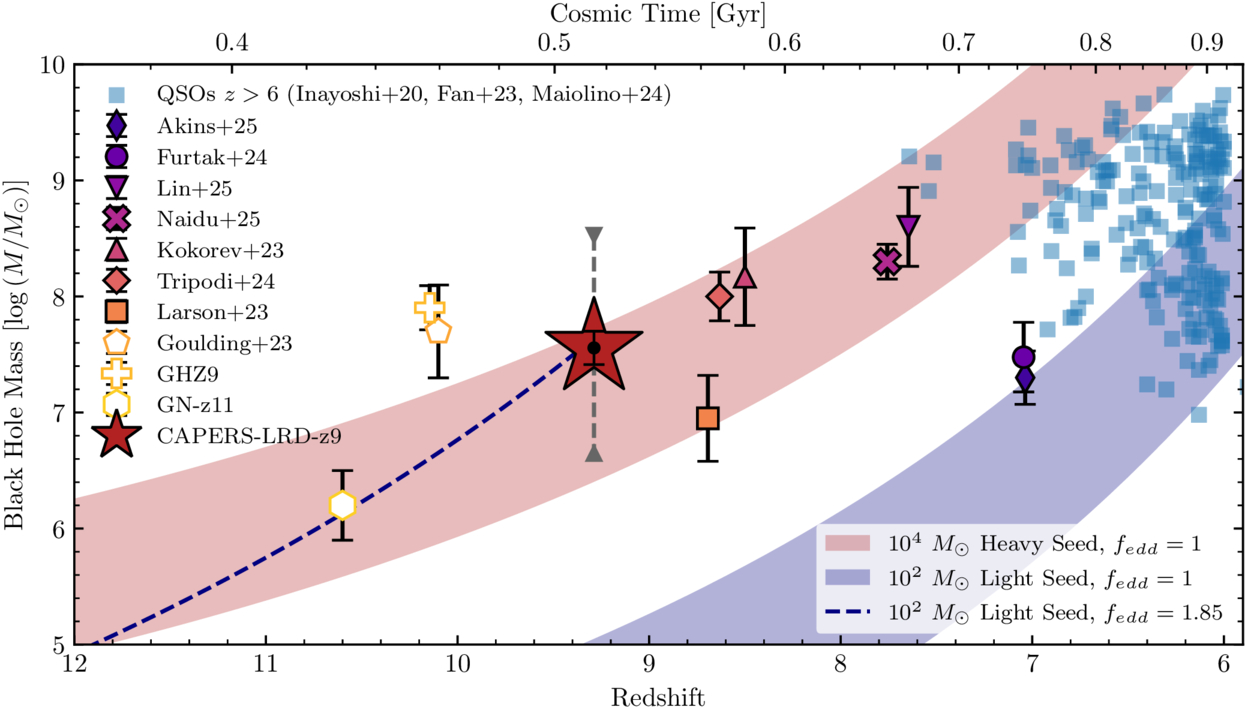
Observed black hole masses and redshifts of several sources, including CAPERS-LRD-z9 (large red star), quasars at redshifts of z > 6 (blue squares), massive spectroscopically confirmed AGN with broad emission lines (filled symbols), and the highest-redshift AGN detected to date via X-ray or ultraviolet emission. The shaded areas show the black hole masses achievable through accretion at the Eddington rate onto a massive (red) or stellar-mass (purple) seed. Click to enlarge. [Taylor et al. 2025]

Since successfully fitting one model doesn’t immediately rule out others, Taylor’s team also applied a stars-only model to the spectrum. This model fit poorly, and combined with the presence of broad hydrogen lines from fast-moving gas, this is strong evidence that CAPERS-LRD-z9 contains an accreting supermassive black hole.

This finding raises the question of how a black hole can grow to millions of solar masses in just 500 million years. The authors showed that this is possible in two scenarios: either the black hole began as a >10,000-solar-mass “seed” that grew at the Eddington rate — the hypothetical limit at which a black hole can accrete matter — or it started out as a smaller, ~100-solar-mass seed that grew at a super-Eddington rate. The observations rule out the possibility that the black hole grew from a ~100-solar-mass seed accreting at or below the Eddington rate.

In addition to setting the record for most distant broad-line AGN known, CAPERS-LRD-z9 gives new intel on the lives of black holes in the early universe. This won’t be the last we hear about this little red dot!

Citation

“CAPERS-LRD-z9: A Gas Enshrouded Little Red Dot Hosting a Broad-Line AGN at z = 9.288,” Anthony J. Taylor et al 2025 ApJL 989 L7. doi:10.3847/2041-8213/ade789

The post Distant Little Red Dot Hosts a Huge (and Growing) Black Hole appeared first on AAS Nova.

  •  

A GLIMPSE of the First Galaxies?

Abell S1063

Editor’s Note: Astrobites is a graduate-student-run organization that digests astrophysical literature for undergraduate students. As part of the partnership between the AAS and astrobites, we occasionally repost astrobites content here at AAS Nova. We hope you enjoy this post from astrobites; the original can be viewed at astrobites.org.

Title: A Glimpse of the New Redshift Frontier Through Abell S1063
Authors: Vasily Kokorev et al.
First Author’s Institution: The University of Texas at Austin
Status: Published in ApJL

JWST has opened up a new era of early universe astronomy. Of particular interest is the hunt for the first galaxies, which are thought to have formed just a couple hundred million years after the Big Bang. But finding these early galaxies has proved to be somewhat of a challenge. While there have been many bright galaxies discovered by JWST at a redshift (z) greater than 10, no galaxies at z > 15 have been confirmed to date. Today’s article goes hunting for these very high-redshift galaxies in the GLIMPSE field, which is home to the strong lensing cluster Abell S1063, shown in Figure 1.

JWST image of Abell S1063

Figure 1: JWST image of the field used for this study. [Kokorev et al. 2025]

The process of identifying galaxies at high redshifts is not exactly a simple one. In this article, all the sources in the field are slowly winnowed down through a series of steps with the ultimate goal of finding extremely high-redshift galaxies.

Step 1: Cut Galaxies by Color

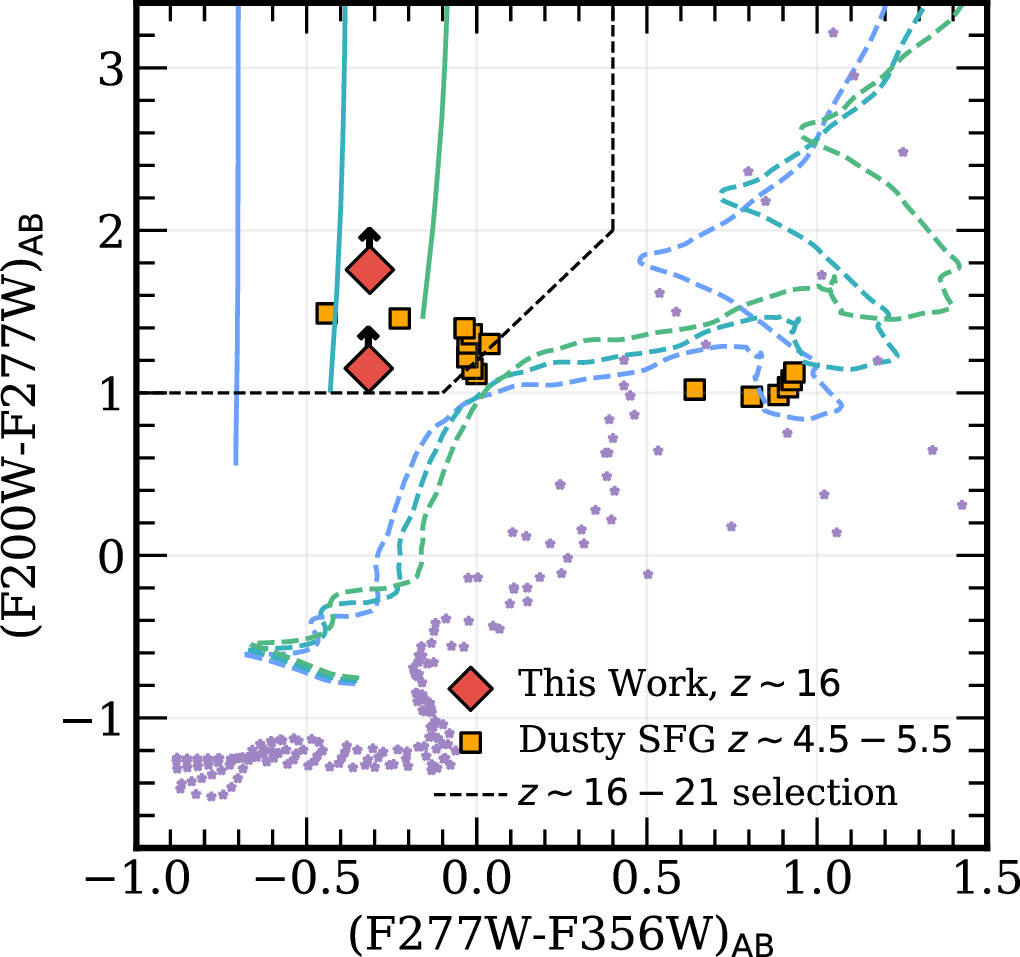
Cutting galaxies by color involves finding the Lyman break. High-energy light is absorbed by neutral hydrogen in the galaxy and in the space between the galaxy and us. Thus, when you look at a galaxy’s spectral energy distribution, there is a drop-off at short wavelengths called a “break.” For distant galaxies, the location of this drop-off gets redshifted, allowing for an estimation of a galaxy’s distance. By comparing how bright sources are between two filters that are adjacent in wavelength, we can look for steep drop-offs that are caused by the Lyman break. Figure 2 shows a color–color plot (showing the difference in brightness between different filters), where the dashed line shows the region galaxies must be in to be considered Lyman-break galaxies at these high redshifts. In the whole field, the authors detect 38 objects in this region.

Color-color plot showing the selection criteria for high redshift galaxies due to Lyman break

Figure 2: Color–color plot showing the selection criteria for high-redshift galaxies due to Lyman break. The upper-left region enclosed by the black dashed line represents the region that satisfies the high-redshift criteria. The various lines show properties of different populations. Solid are potential tracks for starburst galaxies at z = 16, dashed are lower-redshift quiescent galaxies, and dotted are cool stars and brown dwarfs, which can look like high-redshift galaxies in some situations. The two red diamonds show the final two high-redshift candidates in this work. [Kokorev et al. 2025]

Step 2: Calculate Redshift

However, this isn’t the end of the story. Color isn’t the only way to estimate distances to galaxies, as we can also use photometric fitting codes. These codes compare observations to templates of what we would expect galaxies to look like at different redshifts and see which templates fit best. This allows for an estimation of the redshift of each source identified in the field. All sources that the photometric fitting codes thought were at z > 16 were cross-referenced against the 38 color-identified objects, which narrowed the list to eight high-redshift candidates.

Step 3: Hunt for Imposters

But wait, there’s more! Both of these methods (looking at colors and calculating redshift photometrically) are susceptible to false positives. Lower-redshift galaxies, particularly star-forming dusty galaxies, can look just like high-redshift sources. This is apparent in Figure 2, where z ~ 4.5–5.5 dusty galaxies can also be found in the color-selected Lyman-break region. Thus, we need to explore the possibility that the sources might not be at high redshift at all. In this article, the authors do this by fitting their eight sources with a lower-redshift dusty starburst template, finding only five galaxies that match the high-redshift template better than the starburst template.

Step 4: Keep Significant Detections

The authors make one final cut to the last five sources, only keeping those that aren’t at the edges of the observation and thus have strong signals, where they can be confident we’re actually detecting something and it’s not just a hot pixel or noise. So, after all of that, they are left with only two z > 16 candidates in this field.

Figure 3 shows the images and spectral energy distributions of each of these candidates, given the wonderfully poetic names of 70467 and 72839. While there is still a lot to learn about these candidates, with the JWST data presented in this article we can uncover some things about the galaxy properties. Both sources appear to be compact, but still resolved, with effective radii of roughly 650 light-years. These observations can also tell us about the ultraviolet brightness of the two candidates, finding that they are most likely dominated by extended stellar emission, as opposed to active galactic nucleus activity. In general, these galaxy candidates are not very ultraviolet-bright, which is somewhat surprising, as JWST has found many bright galaxies at z ~ 12–14. However, it is not out of the question that galaxies at this slightly earlier epoch are just fainter than we expected, and then formed stars and increased in brightness relatively quickly.

Cutouts and spectral energy distributions for two high-redshift galaxy candidates

Figure 3: Cutouts and spectral energy distributions for the two high-redshift candidates in this work. Squares show images in nine JWST filters, as well as an image of several filters combined, with a cutout width of 1.5″. Spectral energy distribution plots show different template galaxies for high-redshift (orange and red) and low-redshift dusty star-forming galaxy interlopers (blue and green). You can see how these sources are only strongly detected in a few filters, with many detections being just upper limits. [Kokorev et al. 2025]

Overall, these results mark the finding of potentially some of the first galaxies in the universe. But for now, they remain candidates. The photometric data have served their purpose, allowing us to find these candidates and get some information about their properties, but now we need targeted spectroscopic observations to get a more accurate determination of their redshift.

Original astrobite edited by Bill Smith.

About the author, Skylar Grayson:

Skylar Grayson is an Astrophysics PhD Candidate and NSF Graduate Research Fellow at Arizona State University. Her primary research focuses on AGN feedback processes in cosmological simulations. She also works in astronomy education research, studying online learners in both undergraduate and free-choice environments. In her free time, Skylar keeps herself busy doing science communication on social media, playing drums and guitar, and crocheting!

The post A GLIMPSE of the First Galaxies? appeared first on AAS Nova.

  •  

A New Theory for Little Red Dots: Shredded Stars Feeding Growing Black Holes

disk of hot gas swirling around a black hole

When JWST peered back into the early universe, its keen eyes revealed an unexpected population of galaxies nicknamed “little red dots” for their compact size and bright red hue. A new research article proposes that tidal disruption events could be responsible for the surprising appearance of these galaxies.

Galactic Surprises

galaxies known as little red dots

Six “little red dot” galaxies seen by JWST. [NASA, ESA, CSA, STScI, Dale Kocevski (Colby College)]

Using JWST, researchers have discovered more than 300 little red dots. Most of these galaxies are concentrated around when the universe was 600 million years old, though they’ve been spotted out to about 1.6 billion years after the Big Bang. But why do these galaxies look the way they do? Do they host enormous, active black holes, as many researchers suspect? Do they get their characteristic red color from a population of old, evolved stars? Or could rapid, dust-shrouded star formation be the cause?

A successful theory of little red dot identity must account for several observed properties: “V”-shaped spectra, broad H-alpha lines, and little or no emission at X-ray wavelengths. In a recent research article, Jillian Bellovary (Queensborough Community College; CUNY Graduate Center; American Museum of Natural History) has theorized that little red dots get their curious characteristics from stars being torn apart by a young and growing black hole.

A New Hypothesis

In this scenario, little red dots arise in the extremely dense star clusters created in the early universe. Because of their extraordinary density, these star clusters are vulnerable to gravitational collapse, causing the packed-together stars to crash into one another. The colliding stars combine to form a supermassive star that collapses, leaving behind an intermediate-mass black hole — a seed that could someday grow into a supermassive black hole.

Situated at the center of a dense star cluster, an intermediate-mass black hole would be poised to ensnare stars in its gravitational web, pulling the stars apart with its powerful tidal forces and stealing their mass. These star-shredding events are known as tidal disruption events.

predicted number density of intermediate-mass black holes and observed density of little red dots

Predicted number density of intermediate-mass black holes (blue and orange lines). The symbols show the observed number densities of little red dots as a function of redshift. [Bellovary 2025]

Simulations predict that in the era during which little red dots have been observed, a cubic megaparsec should contain about 0.3–1 intermediate-mass black holes. (These intermediate-mass black holes could arise through the cluster collapse scenario outlined above, or through other pathways like the collapse of the first stars in the universe.) Observations show roughly 10,000 fewer little red dots in this same volume.

Because tidal disruption events tend to remain bright for about a year, this implies that a tidal disruption event rate of one per 10,000 years is necessary for tidal disruption events to explain little red dots.

Matching Predictions

predicted tidal disruption event rates

Modeled tidal disruption event (TDE) rates for two different models and various values of velocity dispersion, σ, and stellar density, nstar. [Adapted from Bellovary 2025]

Using analytic and numerical models, Bellovary showed that this tidal disruption event rate is reasonable for intermediate-mass black holes with masses between 1,000 and 100,000 solar masses. But would tidal disruption events provide a match for other little red dot characteristics? Tidal disruption events tend to be faint at X-ray wavelengths and sport broad H-alpha lines, much like little red dots. Another plus is that unlike in the active black hole scenario, the H-alpha emission from a tidal disruption event doesn’t scale with the mass of the black hole; this means that black holes categorized as over-massive based on the strength of their H-alpha emission may not be over-massive after all. One drawback of the tidal disruption event scenario is that it doesn’t necessarily predict the characteristic red color of a little red dot; this color might come from the galaxy’s stars instead.

As Bellovary notes, little red dots could have multiple causes. Some might be due to tidal disruption events, while others could contain active black holes, ancient populations of red stars, or dusty starburst galaxies, as others have suggested.

To verify the tidal disruption event hypothesis, astronomers would need to find evidence for time variability at rest-frame ultraviolet wavelengths, as well as a characteristic decrease in brightness over time. These changes are expected to unfold over the course of years or decades, meaning that while observations may settle this question in due time, there will be plenty of time to ponder the mysteries of little red dots while we wait.

Citation

“Little Red Dots Are Tidal Disruption Events in Runaway-Collapsing Clusters,” Jillian Bellovary 2025 ApJL 984 L55. doi:10.3847/2041-8213/adce6c

The post A New Theory for Little Red Dots: Shredded Stars Feeding Growing Black Holes appeared first on AAS Nova.

  •  
❌