❌

Reading view

Bedrock fractures shape waterfalls

Waterfalls play an essential role in river development and landscape evolution. Researchers are particularly interested in how abrupt changes in the steepness of a river channel, also called knickpoints, develop. Knickpoints vary in size and can be as small as your index finger or as large as Niagara Falls. Researchers from Virginia hypothesized that waterfalls, a type of knickpoint, can influence erosion when a river channel is cut into solid rock, called bedrock. 

The researchers wondered whether fractures and other pre-existing weaknesses can influence how water removes rock slabs from a river channel, via an erosional process called plucking. Fractures can form in many different orientations, but the researchers focused on 3. Imagine a flat tabletop that represents a riverbed. Fractures that are parallel to the flat tabletop are called horizontal fractures. If you tip the table so the low end points downstream, that’s the direction of downstream-dipping fractures. If you tip the table so the low end points upstream, that’s the direction of upstream-dipping fractures. 

First, the researchers tested how fracture orientation changed erosion before an established knickpoint. They used a man-made channel, called a flume, to simulate a natural river system. To set up the experiment, they glued layers of small tiles about the size of an adult’s thumbnail to a plastic frame and put it in the flume. Then, they placed a layer of unglued tiles upstream of the knickpoint. 

To begin the experiment, the researchers incrementally increased the amount of water flowing through the flume every 5 minutes until they reached a maximum flow or all the loose tiles were “eroded.” They considered a tile to be “eroded” once it was transported over the knickpoint and downstream. The researchers measured the water depth at a fixed point upstream of the knickpoint, the number of tiles eroded through plucking, and the volume of water. They repeated this 8 times for each fracture orientation.

The team found differences in the amount and timing of erosion between the 3 orientations. In particular, they saw that erosion began at lower water speeds for horizontal beds than for tilted beds. Based on the observed erosion rates, they concluded that horizontal beds are the most susceptible to erosion, while upstream-dipping beds are the most resistant, and downstream-dipping beds fall between the 2. 

The researchers then tested how a knickpoint would develop and influence water flow if all of the tiles were unglued and free to move. They individually stacked almost 5,000 unglued tiles across the channel. Before starting the experiment, they filled the flume slowly with water to submerge all of the tiles without moving them. Then, they increased the water’s speed to start erosion. Instead of collecting measurements as they did in the first experiment, the researchers filmed this experiment and observed how the knickpoint shape changed and how plucking occurred. 

The researchers observed that the plucked tiles in this experiment formed piles downstream of the knickpoint in a process known as armoring. This armor of tiles, which represents loose rocks near a waterfall in a natural setting, prevents erosion of the underlying river bed. Only when the water transports the armor downstream can it erode the bedrock and develop a knickpoint.

Unlike the first experiment, researchers found no differences in erosion between fracture orientations in this experiment, but did observe differences in armoring. They found that upstream-dipping beds had the least armoring because water quickly transported piles of tiles near the waterfall downstream. Downstream-dipping beds had the most armoring, and their eroded tiles took longer to move downstream. 

The team concluded that waterfalls will erode at different rates based on their fracture orientation and armoring processes. The orientation of bedrock fractures also impacts the shape of the waterfall and the river channel around it. So the next time you see a large waterfall, consider that it may have started as a small fracture the size of your thumbnail.

The post Bedrock fractures shape waterfalls appeared first on Sciworthy.

  •  

125-Million-Year-Old Crocodile Fossil Reveals Skin, Senses and Possible Color Pattern

A tiny crocodile relative that lived about 125 million years ago has given scientists an unusually detailed look at what ancient reptiles may have looked like. A remarkably preserved fossil from northeastern Spain contains traces of skin, soft body parts and even a possible pattern of light and dark bands on its tail. The animal, […]

The post 125-Million-Year-Old Crocodile Fossil Reveals Skin, Senses and Possible Color Pattern appeared first on Knowridge Science Report.

  •  

Scientists Solve a 4,000-Year-Old Mystery About Britain’s Giant Standing Stones

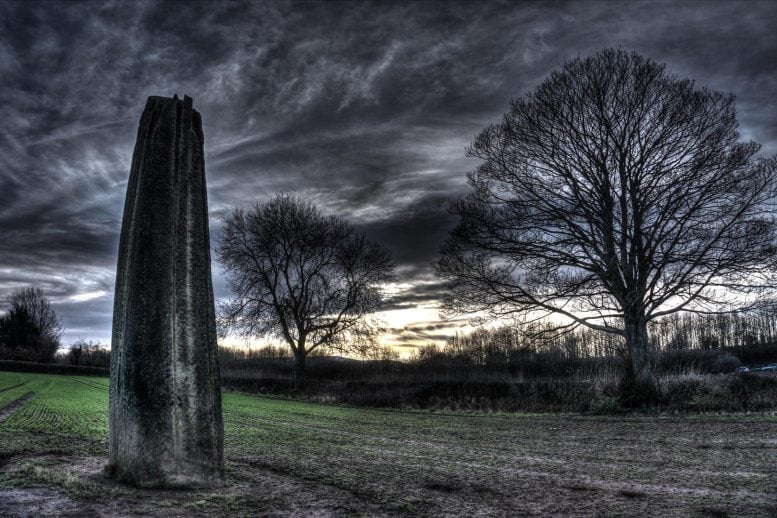
Devil's Arrows Standing Stones DuskPrehistoric builders in Britain went to extraordinary lengths to create one of the country’s most striking ancient monuments. New research shows they intentionally transported enormous stones weighing more than 25 tonnes for at least 18 kilometers (11 miles) before raising them as the famous Devil’s Arrows, Britain’s tallest surviving prehistoric stone row. A study led [...]
  •  

One of Earth’s Driest Deserts Just Turned White

Atacama Desert SnowIn August 2026, a series of powerful winter storms transformed parts of northern Chile’s Atacama Desert, covering the famously dry landscape in an unusual layer of snow. Snow is not unheard of in the Atacama. Significant falls occurred in 2025 and, before that, in 2011. But one of the August 2026 storms stood out because [...]
  •  

Microbes Deep Beneath Earth Survived 378 million Years of Geological Change

Microbial life hidden deep inside Earth’s crust has survived repeated periods of mountain-building, erosion and changing temperatures over hundreds of millions of years, a new study suggests. Researchers uncovered evidence of several bursts of methane-producing microbial activity by examining material from a borehole drilled 2.3 kilometres into the bedrock of central Sweden. Their findings were […]

The post Microbes Deep Beneath Earth Survived 378 million Years of Geological Change appeared first on Knowridge Science Report.

  •  

Melting Arctic Glaciers are Releasing Ancient Methane, Study Finds

Rivers flowing from melting glaciers in Svalbard are carrying ancient methane out of rocks beneath the ice, according to new research. The discovery reveals a natural climate feedback that could become more important as the Arctic warms and glaciers continue to shrink. Methane is a powerful greenhouse gas. Although the amount identified in the study […]

The post Melting Arctic Glaciers are Releasing Ancient Methane, Study Finds appeared first on Knowridge Science Report.

  •  

Is modern farming sustainable?

Since the 1850s, plowing and clear-cutting in modern agriculture have increased how fast soil erodes in the Upper Mississippi River Valley. Across the globe, farming strips soil up to 100 times faster than natural processes. It also removes farmable land and clogs waterways, threatening long-term environmental sustainability. However, scientists in the past have struggled to separate the effects of land-use changes from the transition out of the last ice age over the past 20,000 years. 

To determine whether current farming practices are sustainable, researchers from Minnesota recently measured the speed at which soil eroded during the ice age transition and compared it with modern agricultural erosion. They focused on the Trout Creek tributary of the Mississippi River. This tributary has 2 step-like formations, or terraces, on its bank that represent past floodplains before the river eroded to its current level. 

The oldest, upper terrace is about 14 meters (50 feet) above the lower terrace, which is about 8 meters (26 feet) above the modern floodplain. Scientists studying nearby areas have suggested that the terraces contain sediment from the last ice age, 20,000 years ago, referred to as the Last Glacial Maximum, to today. 

In the upper terrace, the researchers pushed an empty cylinder into the ground, like a straw into a layer cake, to collect a cylindrical sample of sediments about 4 centimeters (1.5 inches) wide and 6 meters (20 feet) deep, called a sediment core. They collected slices of this core from 2 meters (6 feet) and 6 meters (20 feet) to find the terrace’s age. 

Some grains in the sediment trap electrons while buried and release them when exposed to light. So the team shone light on the sediment slices to stimulate these electrons and measure the intensity of light emitted, known as their optically stimulated luminescence. Brighter light emissions indicate the sediment is older and was buried for a longer period of time. Using this method, they confirmed that the deep sediment slice was 22,000 years old, and the shallow sediment slice was 20,000 years old, dating the terrace back to the Last Glacial Maximum.

Next, the team drilled into the upper terrace with an auger to collect 25-centimeter (10-inch) wide plastic tubes of sediment. They pulled 4 samples from 0 to 2 meters (0 to 6 feet), and 1 sample from 6 meters (20 feet) deep. They explained that minerals in the sediment called quartz produce the radioactive form of the element beryllium, known as 10Be, when exposed to the Sun, so low 10Be means the sediment was buried quickly and had little sun exposure. The team measured the concentration of 10Be in each sediment sample and used an online calculator to estimate how quickly it eroded. The researchers calculated that during the Last Glacial Maximum, 0.073 millimeters (0.003 inches) of surface sediment were removed per year.

The researchers collected similar samples from the lower terrace and used optically stimulated luminescence to determine that it was between 22,000 and 14,000 years old. This terrace was the floodplain during the transition out of the Last Glacial Maximum, or deglacial period, where temperatures warmed and permafrost retreated. They measured the concentration of 10Be in samples from this terrace and determined that 0.049 millimeters (0.002 inches) of surface sediment were removed per year. 

Finally, the researchers measured 10Be in a sediment sample from the modern floodplain, deposited between 14,00 years ago and today. They found that the sediment had eroded 0.053 millimeters (0.002 inches) per year during that interval, at a rate slower than it had during the glacial period, but similar to the deglacial period. 

The researchers compared their findings to the average soil loss caused by modern agriculture, as reported by 4 previous scientists studying the area. They saw that modern farming removes an average of 0.60 millimeters (0.02 inches) of soil per year, which is 8 to 12 times greater than all the natural erosion rates they calculated. 

They concluded that the recent spike in soil loss from agriculture greatly exceeds that caused by the largest natural climate transition in recent Earth history. Human-driven erosion shows an upward “hockey stick” trend like the one seen in global temperatures, suggesting that similar trends could exist throughout Earth systems. The team concluded that modern agricultural practices aren’t currently sustainable. While measures like native plant reintroduction can help curb this trend, more research is required to determine how best to limit long-term erosion.

The post Is modern farming sustainable? appeared first on Sciworthy.

  •  

Thawing permafrost is affecting fish health

Temperatures in the Arctic are increasing at a rate 4 times faster than the average global temperature. Scientists have documented the global effects of climate change, but there are still regions where these effects are less well known. This is the case for freshwater ecosystems in the Arctic.  

When the ground has been permanently frozen for 2 years, scientists call it permafrost. Permafrost contains soil, sand, rocks, and organic matter held together by ice. As temperatures rise, permafrost thaws, which can change groundwater flow paths. It can also alter a stream’s temperature, flow patterns, and nutrient loads by introducing new material from the permafrost.  

To determine how thawing permafrost affects Arctic ecosystems, scientists from the U.S. Geological Survey recently studied 10 headwater streams within the Brooks Range in the Noatak National Preserve of Alaska. The scientists studied streams with different amounts of permafrost and ice to test whether connections exist between permafrost, food webs, and populations of fish called the Dolly Varden and Arctic Graylings. They focused on these 2 species of fish because their migrations often indicate ecological shifts in the area.    

The scientists collected fish from the streams by temporarily stunning them, using a method called electrofishing, or by catching them in minnow traps. They manually identified each species they collected, then froze the fish and shipped them to a lab. Once in the lab, the scientists measured the length of each fish and used documented growth patterns to estimate its biomass. To calculate fish abundances, they divided their total biomass by the time spent electrofishing or trapping. Finally, they measured the energy density of each fish by burning it in a device called a bomb calorimeter. 

At each stream, the scientists took manual temperature measurements and deployed loggers that recorded the temperature every 15 minutes. They also deployed equipment at the bottom of each stream to record water pressure in 15-minute intervals and converted the data to depth, since pressure increases with depth. Then, they used wading rods to measure how much water was flowing through each stream at a given spot. 

They combined the depth and wading rod data to determine the flow rate of water in the streams over time. They used these data to identify unstable streams where water rose and fell rapidly. They also collected water samples from each stream and measured their nutrient concentrations, including dissolved organic carbon, nitrogen, and phosphorus, to determine water quality.   

Finally, they measured 2 types of smaller organisms that allow energy to flow through the food web to the fish, called microbial biofilms and macroinvertebrates. They used a hand-held device to estimate the types and amounts of biofilms, and nets to collect macroinvertebrates.

Once they had compiled these data, the team conducted a statistical analysis to compare the studied parameters and fish populations to the extent of permafrost in each area. They found that streams with more permafrost in the area had warmer temperatures, because the permafrost prevented water from infiltrating the soil to cool off. The streams with warmer temperatures, in turn, had lower abundances and biomass of Dolly Varden fish and Arctic Grayling with lower energy densities. They suggested that these results meant that the high temperatures had pushed the fish above their optimum temperature range. 

They also learned that the limited infiltration in permafrost areas caused rainfall to flow straight into the stream. This process created instability as the stream levels rose and fell rapidly. Fish in these unstable streams had lower energy densities, likely due to the harsher environment. 

Areas with greater permafrost also had higher concentrations of dissolved organic carbon and phosphorus, which stimulated the formation of biofilms at the bottom of the food chain. They noted that areas with more biofilms also had more macroinvertebrates and more Dolly Varden biomass. Since the Dolly Varden eats macroinvertebrates, this finding suggested that the lowest levels of the food web shape the health of species higher up. This is called the bottom-up effect, and means that areas with more biofilms and macroinvertebrates will likely have healthier and larger fish populations.  

The scientists explained that knowing how these factors influence Arctic fish populations can help researchers understand how thawing permafrost might affect Arctic ecosystems in the future. They anticipated that their data could help future researchers predict how these and other ecosystems will be impacted by changing landscape dynamics caused by global warming. 

The post Thawing permafrost is affecting fish health appeared first on Sciworthy.

  •  

Lost Mega-Cliff May Explain the Grand Canyon’s Missing Billion Years

A gigantic line of cliffs may once have stretched for thousands of kilometers across ancient North America, helping erase more than a billion years of geological history from rocks now exposed in the Grand Canyon. Scientists led by the University of Southampton in the UK believe this enormous landscape formed about 800 million years ago, […]

The post Lost Mega-Cliff May Explain the Grand Canyon’s Missing Billion Years appeared first on Knowridge Science Report.

  •  

Small Dinosaur Fossil Reveals a More Diverse Prehistoric Coast in Japan

A small dinosaur bone discovered in Fukushima Prefecture more than 25 years ago is giving scientists new clues about the variety of plant-eating dinosaurs that once lived along the ancient coast of Japan. The fossil belonged to an iguanodontian, a large and diverse group of herbivorous dinosaurs that lived from the Late Jurassic through the […]

The post Small Dinosaur Fossil Reveals a More Diverse Prehistoric Coast in Japan appeared first on Knowridge Science Report.

  •  

Can melting ice increase glacial hazards?

Globally, about 1 billion people live near glaciers and depend on glacial water. As temperatures continue to climb due to global warming, glaciers can become unstable and hazardous to nearby communities. These communities risk exposure to a series of linked processes, like ice collapse, flooding, and landslides, which could have life-threatening consequences. Scientists call these events catastrophic glacier hazard chains, or CGHC. So, a team of scientists in China sought to understand the driving forces behind these dangerous phenomena. 

The team focused on a CGHC event that occurred in 2018 at the Sedongpu Glacier, located in the Eastern Himalayas. During this event, the glacier obstructed the flow of 30 million square meters (more than 300 million square feet) of the Yarlung Tsanpo River, one of the main rivers within the region. 

To reconstruct the event, the team observed satellite images of the Sedongpu glacier over time, using a process called remote sensing. They used the images to calculate ice volumes, glacier velocities, and glacier movement between 1961 and 2018, to determine the glacier’s long-term physical properties and how they changed over time. They found that from 1968 to 2013, the Sedongpu Glacier shrank, or retreated, by over 6 football fields. It also lost ice and water volume and increased its velocity.

The scientists also measured earthquake waves on the Earth’s surface, or seismicity, to characterize any downslope rock or debris movements caused by the glacial retreat. They measured seismicity across 11 different seismic stations within 580 kilometers (about 350 miles) of the glacier. Then, they used this data to identify 2 distinct phases of the CGHC event on Sedongpu Glacier: the ice-rock avalanche and the debris flow.

When the ice-rock avalanche occurred, the team detected noticeable increases in seismicity, suggesting it lasted over 30 seconds. During those 30 seconds, over 8 million cubic meters (more than 280 million cubic feet) of ice fell onto the main glacier. The team recorded even more increases in seismicity during the debris flow, which lasted nearly 5 minutes. The debris from the avalanche hit the main valley glacier at nearly 300 kilometers (200 miles) per hour.

The researchers combined these data to describe how the 2018 CGHC event unfolded. First, the backward movement and shrinkage of the glacier produced an unstable sheet of ice hanging over a cliff face. The steep slope and large cracks in the ice caused an ice-rock avalanche. Debris from the avalanche then accumulated on the main glacier, causing it to move faster. As the main valley glacier moved downslope, it picked up even more debris from the bottom and sides of the glacial valley. The melting ice also increased the glacier’s velocity, and its movement eventually transitioned into a debris flow, which obstructed the Yarlung Tsangpo River. 

In total, the CGHC event in the Sedongpu Glacier travelled over 10 kilometers (6 miles) and moved down in elevation for over 3 kilometers (about 2 miles) at a velocity of about 100 kilometers (about 70 miles) per hour. The glacier accumulated enough debris and ice to fill thousands of Olympic-sized swimming pools. Imagine what this could do to a nearby village!

It’s difficult for scientists to estimate when CGHC events will occur, but this team proposed several factors that could help predict them. These factors included the size of the ice-rock avalanche and the glacier velocity, as well as the occurrence of earthquakes, temperature changes, and the melting of the glacier’s underside. They stated that these factors can combine to create a domino effect that drives the CGHC process. They recommended consistent glacial monitoring as temperatures continue to climb, in the Himalayas and globally. 

The team concluded that understanding CGHC events can help scientists mitigate glacial hazards and keep people safe, especially in mountainous areas such as the Eastern Himalayas. They stated that their findings illustrate the dangerous processes behind glacial melting, but further research is needed to accurately assess those processes and ensure nearby communities remain safe.

The post Can melting ice increase glacial hazards? appeared first on Sciworthy.

  •  

Testing local weather knowledge in the Bolivian Altiplano

In the Bolivian Altiplano, fewer Aymara farmers are relying on local weather knowledge to schedule farming tasks, like choosing the best dates to plant crops and predicting a frost or drought. At the same time, there is growing doubt about whether these traditional indicators remain relevant today in the context of rapid social, economic, and climatic changes. 

Farmers are struggling because the National Weather Service of Bolivia (SEHNAMI) fails to provide useful weather forecasts due to the geographical complexity of the Andes and a scarcity of weather stations. In addition, many farmers can’t access this information because SEHNAMI lacks local outreach programs to deliver reports directly to them. In a region with a weak technical forecasting system, local knowledge is a vital resource, but its use is declining.

Scientists in the past focused on preserving local weather knowledge or discussing how it might help communities adapt to climate change. However, very few researchers have scientifically validated local weather indicators, since doing so requires many years of historical meteorological data to establish statistical “skill” in local forecasting. 

Faced with this gap, researchers in the US and Bolivia recently set out to validate indigenous indicators in 2 Bolivian municipalities: Umala in the Central Altiplano and Ancoraimes in the Northern Altiplano. To do this, they paired each traditional weather sign with a measurable variable, like temperature, that could approximate it. This approach allowed them to directly compare traditional observations with scientific data.

The researchers wanted to determine whether traditional weather knowledge is still accurate and relevant under current conditions, since validating these methods would strengthen local knowledge and benefit the schools and policies that promote it. To test this, the researchers worked with 6 Aymara communities. First, they conducted workshops with local leaders and experts to compile a set of weather-forecast indicators. Then, they surveyed 95 farmers to rank the reliability of these indicators. 

Through discussions with these communities, the team identified 13 weather indicators in the Central region and 20 in the Northern region. These indicators included specific plants, animals, and physical factors like constellations or winds that the farmers used to decide when and where to plant crops, and to predict weather conditions for the next season. The researchers focused on 2 key indicators that the farmers ranked as most reliable: the presence or absence of moisture under rocks on the Fiesta de San Juan on June 24th, and the flowering patterns of specific plants, called Thola and Sank’ayu. The farmers used the San Juan indicator to predict whether the upcoming year would be rainy or dry, and the plants to determine the most favorable dates for planting to avoid agricultural risks like frosts.

Finally, the researchers compared forecasts based on these 2 signs with over 30 years of meteorological data from nearby weather stations. In both cases, they used the minimum daily temperature as the measurable way to represent these local signs scientifically. Their results showed that the minimum daily temperature on the Fiesta de San Juan could explain more than half (55.5%) of the changes in rainfall during the growing season. They also confirmed that severe frosts that “burned” Thola and Sank’ayuthe flowers were followed by periods without rain, validating the farmers’ strategy of delayed planting.

The researchers concluded that local weather indicators used by Aymara farmers are most reliable for seasonal planning, especially in predicting the start of the rainy season. They stated that this result helps legitimize traditional knowledge and empower the community. For example, these communities now hold regular meetings to discuss forecasts and share this information with their neighbors via WhatsApp groups. 

However, the team acknowledged that local knowledge was limited to short-term forecasting, as it only provided warnings a few hours in advance. Farmers need alerts several days in advance to effectively reduce their vulnerability to events such as frosts or hail. For this reason, the researchers suggested that the next step will be to co-produce forecasts by combining meteorological science with traditional knowledge.

The post Testing local weather knowledge in the Bolivian Altiplano appeared first on Sciworthy.

  •  

Scientists Trace Modern Human DNA to Two Long-Lost Human Ancestors

Scientists have uncovered new evidence that modern humans inherited DNA from two previously unknown ancient human relatives, revealing another surprising chapter in our evolutionary history. The discovery was made using a new genetic analysis method that can identify traces of long-extinct human groups even when no ancient DNA from them has ever been found. The […]

The post Scientists Trace Modern Human DNA to Two Long-Lost Human Ancestors appeared first on Knowridge Science Report.

  •  

Solar wind creates giant space waves that slowly strip away Mars’ atmosphere

Mars is slowly losing parts of its atmosphere to space, and scientists have discovered that the process may be driven by giant waves created where the solar wind meets the planet’s upper atmosphere. The new research, led by Boston University, shows that these waves act much like wind blowing across the surface of a lake, […]

The post Solar wind creates giant space waves that slowly strip away Mars’ atmosphere appeared first on Knowridge Science Report.

  •  

Predicting microbial antibiotic resistance with AI

Have you ever wondered how researchers use artificial intelligence (AI) in environmental science? Certain AI computer models can learn from scientific data and operate without manual programming, in a process called machine learning. Machine learning models can identify patterns in environmental datasets and help scientists assess public health risks linked to environmental conditions.

One well-known public health risk is the rise in antibiotic-resistant bacteria. These bacteria carry genes called antibiotic resistance genes that protect them from antibiotic medicines. As the number of these genes increases, the medicines become less effective, and diseases spread faster.

Agricultural soils are the largest reservoirs of antibiotic resistance genes, because manure from livestock like cows and pigs often contains leftover antibiotics fed to them. When used as fertilizer, this manure transfers antibiotics into the agricultural soil, where bacteria develop antibiotic resistance genes.

To better understand how antibiotic-resistant bacteria will affect global health in the future, scientists want to develop faster ways to detect antibiotic resistance genes. However, current methods of detection are slow and fail to predict future trends. To address this problem, a group of scientists from Algeria used machine learning models to predict the prevalence of antibiotic resistance genes in soil microbes under future climate scenarios, and to identify the key environmental drivers and high-risk areas.

​The team compiled existing microbial data from 3 public databases: the National Center for Biotechnology Information’s Sequence Read Archive, the Metagenomic Rapid Annotations using Subsystems Technology database, and the Joint Genome Institute’s Integrated Microbial Genomes & Microbiomes database. Their final dataset contained about 2,000 agricultural soil samples from 67 countries across 6 continents. These samples represented a wide range of soil characteristics, climate conditions, and different types of antibiotic resistance genes. 

They integrated the microbial dataset with climate data, including global temperature and precipitation measurements from WorldClim, and land use data, including crop types, irrigation systems, and livestock density from the European Space Agency Climate Change Initiative Land Cover maps. The researchers also included data on future climate projections for 2050 and 2070 from the World Climate Research Programme based on low, medium, and high global greenhouse gas emission scenarios. 

After preparing the datasets, the team set up 6 machine learning models that differ in terms of their data size, model complexity, analytical speed, and customization. These models included Light Gradient Boosting Machine (LightGBM), eXtreme Gradient Boosting (XGBoost), Random Forest (RF), Support Vector Machine (SVM), Deep Neural Network (DNN), and Logistic Regression (LR). 

They ran each model using different combinations of variables from their datasets, including soil properties, microbial community metrics, climate variables, and land use characteristics. To validate the models, the team separated the full dataset into 10 random subsets. They trained the models on 9 of the subsets, then recorded the result of the 10th subset. Each model repeated this process 10 times in a different order so that each subset was evaluated once in the results, using a technique known as stratified 10-fold cross-validation. The researchers scored each model on 5 performance metrics, including precision, sensitivity, and predictive power. Based on these results, they determined that LightGBM was the most accurate model. 

They found that the LightGBM model identified soil temperature as the strongest environmental predictor of antibiotic resistance genes. At soil temperatures above 18°C (about 64°F), the number of antibiotic resistance genes increased dramatically. The model also identified soil acidity, organic carbon content, moisture, and annual precipitation as influential variables, accounting for 71% of the increase in antibiotic resistance genes under future climate scenarios. Likewise, the LightGBM model predicted that the number of high-risk areas would increase by 35% under the high-emissions scenario, with South Asia, Sub-Saharan Africa, and Mediterranean Europe as the most vulnerable regions.

Based on the LightGBM model output, the team concluded that soil conditions will change to favor antibiotic resistance genes under all future climate scenarios. They also suggested that LightGBM is a fast and effective model for environmental predictions that could be used to assess other climate change risks such as natural disasters. They recommended that future researchers explore how to apply machine learning methods to early warning systems and utilize machine learning results in environmental management decisions. 

The post Predicting microbial antibiotic resistance with AI appeared first on Sciworthy.

  •  

Industrial waste solidified a UK beach in just 35 years

Humans have been around for only about 0.01% of Earth’s history, yet we’ve altered natural landscapes and processes that have remained stable for millions of years. A team of researchers from the University of Glasgow recently studied a formerly sandy beach in the UK that highlights how fast these changes can occur.

Industrial steel and iron furnaces operated extensively in the UK from 1856 until the 1980s. During these decades, workers dumped roughly 335 million cubic meters (90 billion gallons) of molten furnace waste, called slag, across the country. Of that, roughly 27 million cubic meters (6 million gallons) now sits on the coast of Derwent Howe in a massive 30-meter (100-foot), solidified cliff. 

The researchers analyzed this region to understand how man-made, or anthropogenic, materials influence the way rocks form. Rocks naturally form and change into different types of rocks over million-year timescales, through a continuous process called the rock cycle. When the team uncovered a soda can tab manufactured in 1989 within the hardened grains, or clasts, of slag, they concluded that the beach had solidified within the last 35 years. Based on this discovery, they proposed a new term for rocks formed from anthropogenic sediments: the anthropoclastic rock cycle. 

The team collected 1,300 grains of sediment from 13 sites in the study area and found that 83% were slag. Natural beach sediments, like quartz sand, comprised only about 17% of the grains. As wind and waves broke down the cliff, slag clasts fell off and became rounded by friction as tides transported them from the cliff to the beach. 

At the boundary where the slag touched the beach, the researchers also saw evidence that the slag had seeped into the underlying wet sediment. The rocks there resembled a type of rock called peperite, which forms when lava flows over wet, loose sediments.  They concluded that this peperite-like rock formed as the molten slag flowed over the still sandy beach. Slag is much thicker than wet sand, so the resulting rock looked like blobs of slag encased in sandy rock. 

The researchers then visually observed how the slag grains were arranged in the solidified rock to reconstruct the tidewater speeds at different points in the coast’s history. The different ways sediments are arranged within a rock are called sedimentary features, and they reflect the processes that formed the rock. For example, as water flows over sand, it forms small, dune-like ripples. When the sand beds harden into rock, the ripples are preserved as features known as trough cross-bedding. 

Faster water erases any ripple formations and instead forms horizontal layers in the sediment, known as planar lamination. The researchers observed both trough cross-bedding and planar laminations preserved in the slag beach rocks. These sedimentary features indicate that the beach at Derwent Howe turned from loose sediment into rock in a generation. 

To investigate why this beach rapidly solidified, the researchers scanned the surfaces of the beach rock with electron beams and X-rays using a scanning electron microscope, or SEM, equipped with an energy dispersive X-ray, or EDX. Every chemical element emits a unique set of X-rays with different wavelengths when hit with EDX, so the researchers could compare the X-rays from their samples to databases of known mineral X-ray signatures. They identified the primary binding agents as calcium- and iron-rich minerals like calcite, goethite, and brucite. These minerals are called cements because they bind grains of sediment together. 

The researchers expected the slag to produce these cement compositions, since extracting metal ores from rock enriches the resultant slag in calcium, magnesium, manganese, and iron, which readily dissolve in water. When water flowing between closely packed slag grains can no longer hold additional dissolved elements, those elements precipitate as solid mineral cements. Since cements only form when the water has very high concentrations of dissolved elements, the introduction of massive amounts of slag caused the cement to form faster than it would in waters with lower concentrations of elements.

The researchers suspected that the anthropoclastic rock cycle they observed at Derwent Howe is not uncommon. Since slag contains all the elements necessary to form rocks when in contact with seawater and air, slag deposits all over the world could be rapidly influencing their local environments. With this in mind, the team suggested that future researchers update geological models to account for human contributions to the natural rock cycle. 

The post Industrial waste solidified a UK beach in just 35 years appeared first on Sciworthy.

  •  

Was Odysseus’ Ithaca Never an Island? Scholars Challenge Centuries-Old Assumption

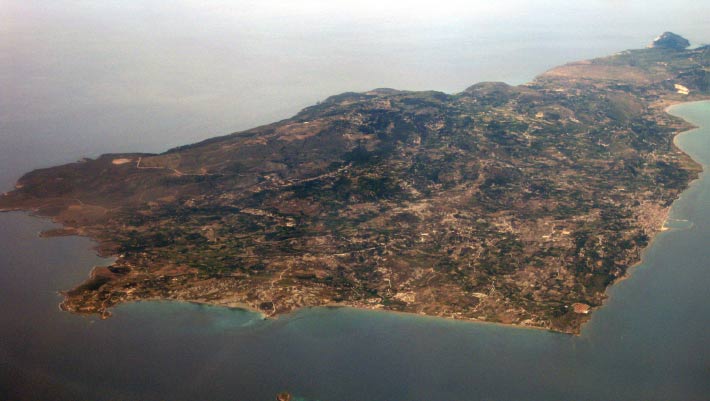
Paliki peninsula on the island of Kefalonia, Ionian Islands, Greece. Image credit: Christos Vittoratos / CC BY-SA 3.0.

For as long as readers have pored over Homer’s Odyssey they have pictured Ithaca, the homeland Odysseus fights for ten years to reach, as an island unto itself.

The post Was Odysseus’ Ithaca Never an Island? Scholars Challenge Centuries-Old Assumption appeared first on Sci.News: Breaking Science News.

  •  

New AI system predicts robberies in US Cities with more than 86% accuracy

Researchers have developed a new artificial intelligence (AI) system that can predict robberies and other crimes more accurately than several existing methods. By studying where crimes happen, when they occur and broader social patterns, the system achieved an accuracy rate of 86.3% when forecasting robberies in several U.S. cities. Predicting crime is extremely challenging because […]

The post New AI system predicts robberies in US Cities with more than 86% accuracy appeared first on Knowridge Science Report.

  •  

Ancient stellar debris is still falling on Earth after 100 million years, study finds

Tiny traces of material from a giant cosmic explosion are still falling to Earth more than 100 million years after the event occurred, according to a new international study published in Nature Astronomy. The evidence comes from an unusual source: a slow-growing chunk of ferromanganese crust collected from the floor of the Pacific Ocean. Hidden […]

The post Ancient stellar debris is still falling on Earth after 100 million years, study finds appeared first on Knowridge Science Report.

  •  
❌