❌

Reading view

Anak Krakatau Rumbles Again

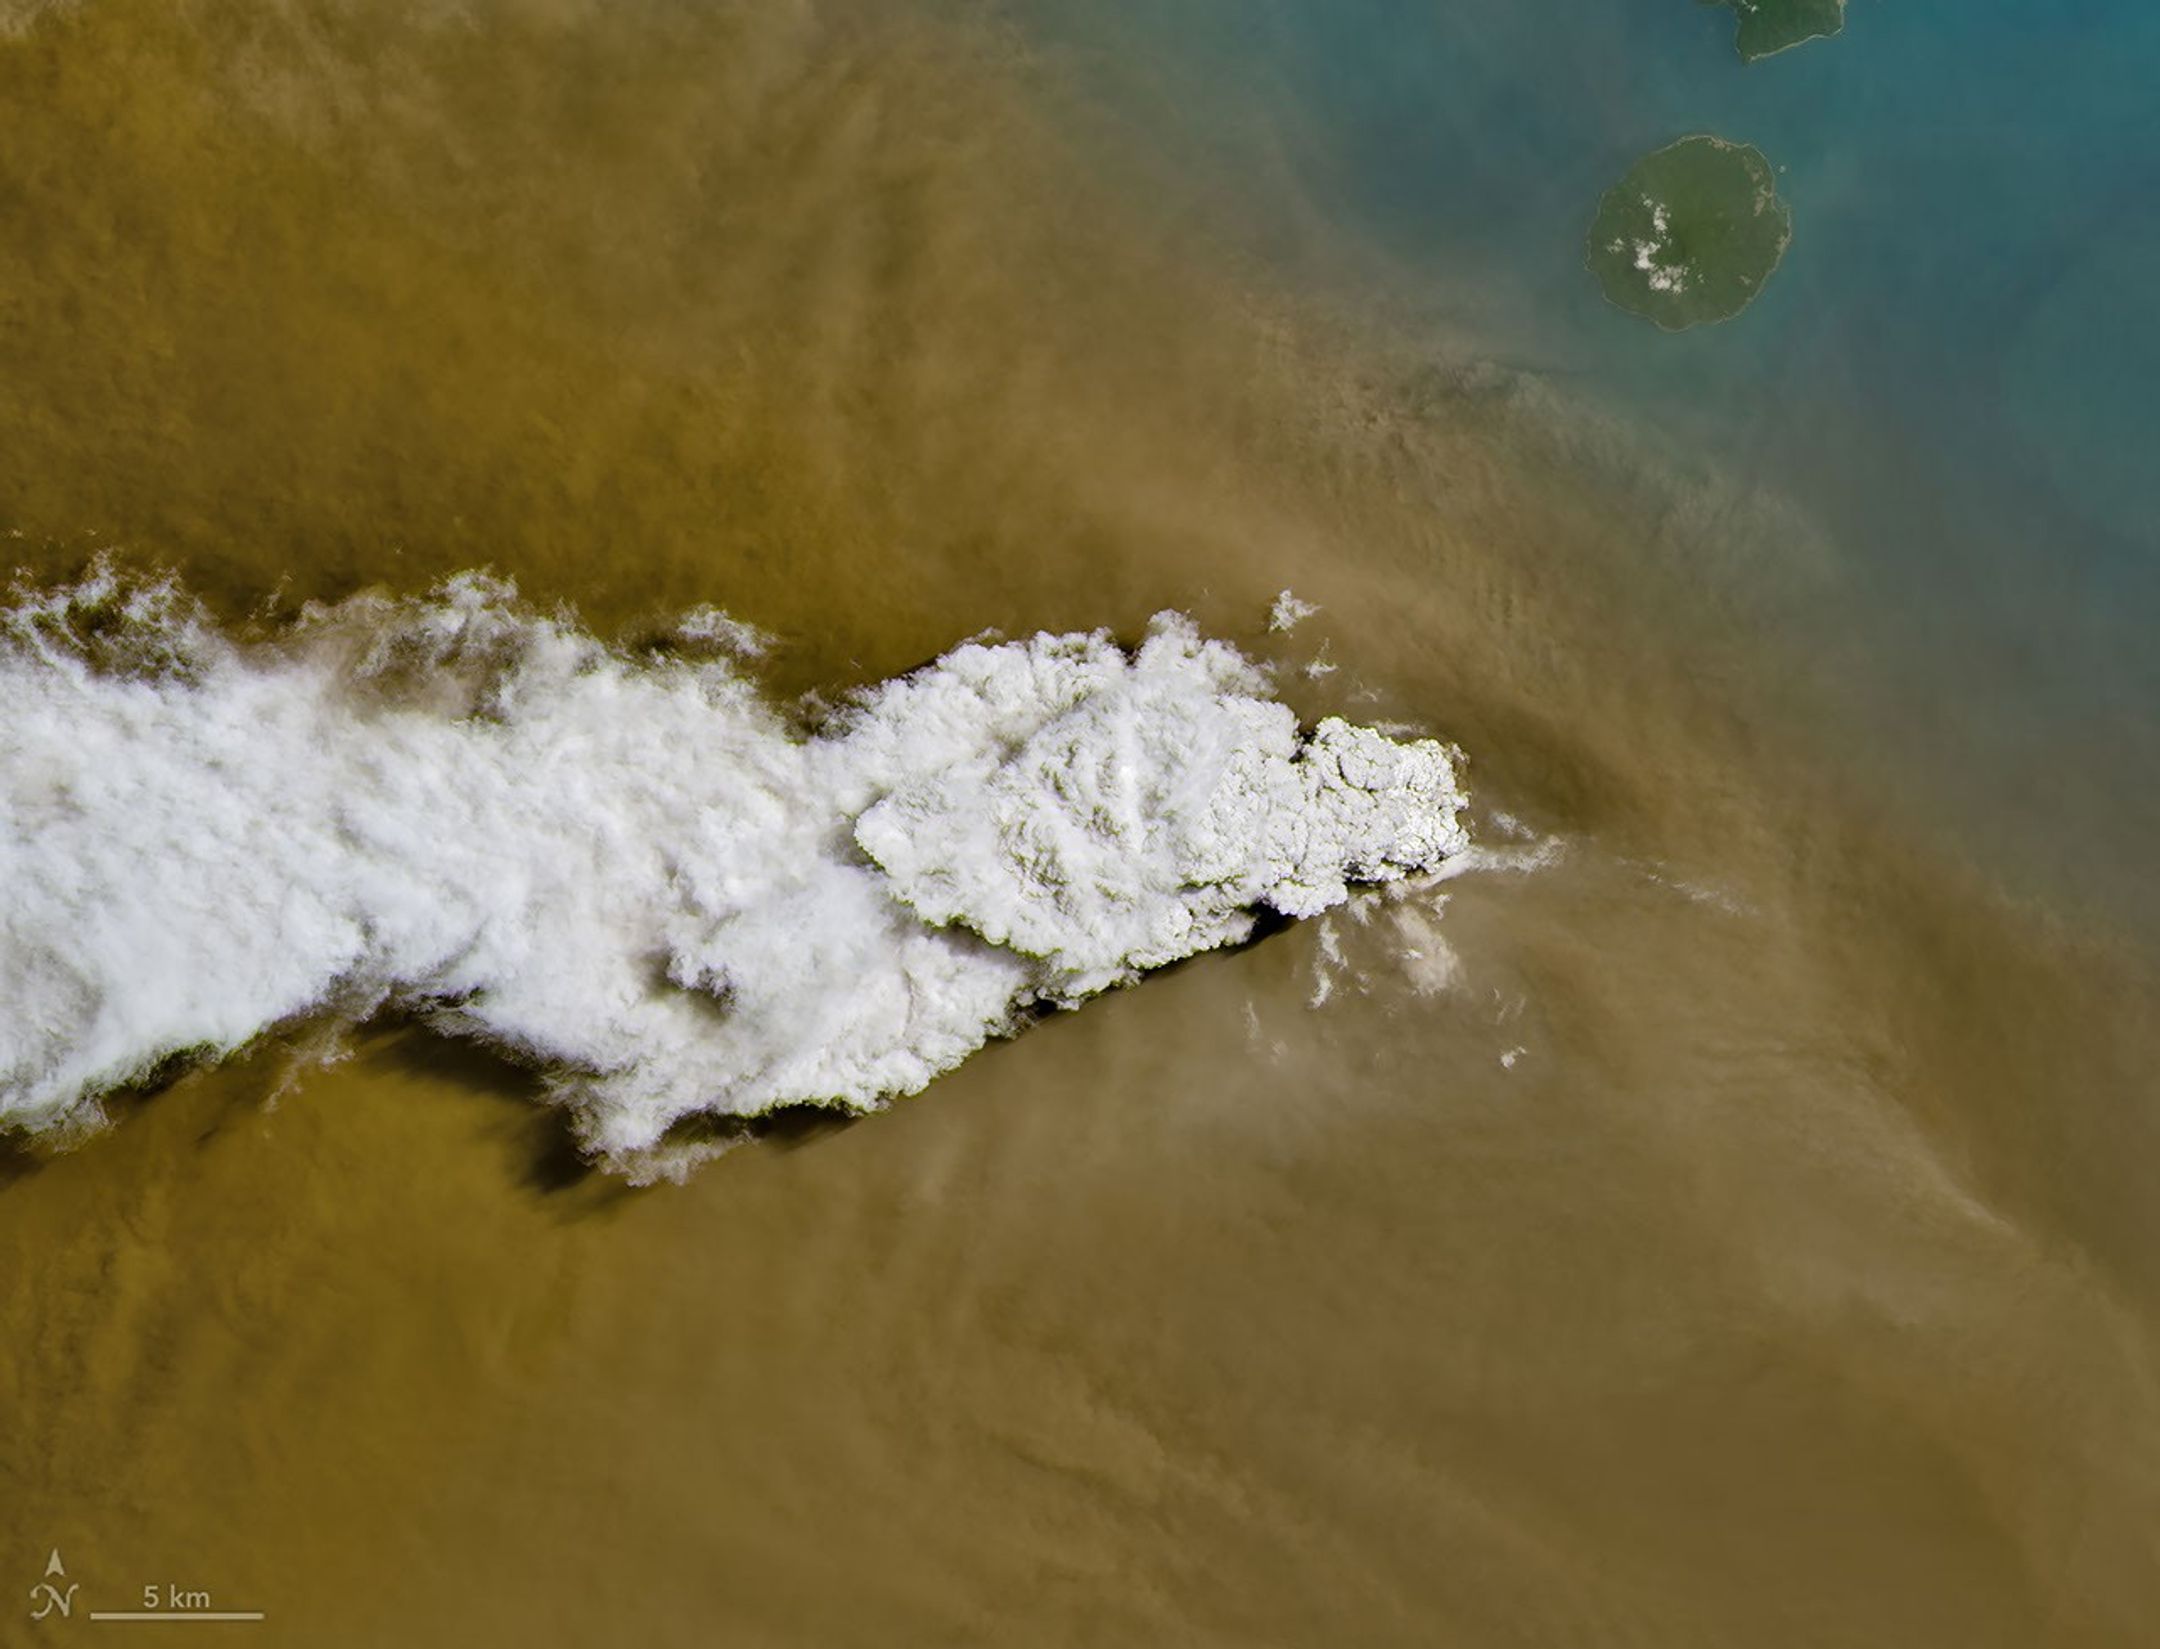
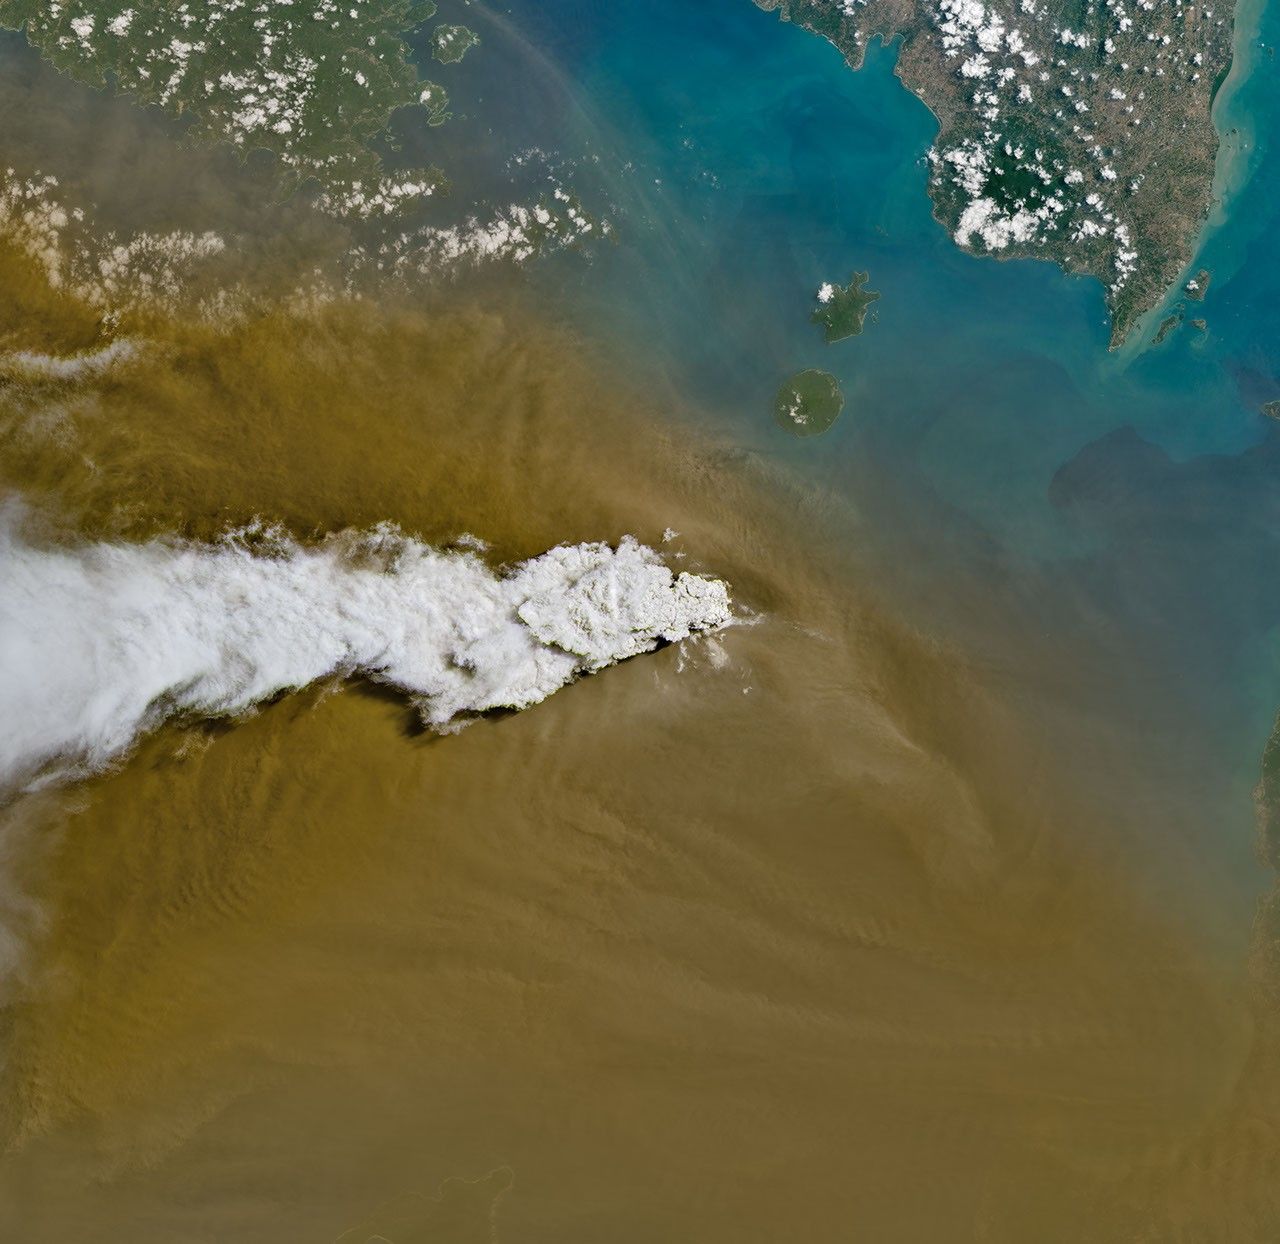
A white volcanic plume streams left over a tan ash cloud that fills most of the image. A small green island and blue water are visible in the upper right.
Anak Krakatau erupts ash and volcanic gases in this image acquired with the OLI (Operational Land Imager) on Landsat 8 on September 5, 2026.
NASA Earth Observatory/Michala Garrison

Eruptions are a regular occurrence at Anak Krakatau, a small volcano between the Indonesian islands of Java and Sumatra. Much of its activity remains relatively mild, but it occasionally puts on more impressive and hazardous shows of force. In early September 2026, a booming eruption lasting more than 24 hours sent gas and ash high into the atmosphere, disrupting thousands of flights and degrading air quality in parts of the country, including the capital city of Jakarta.

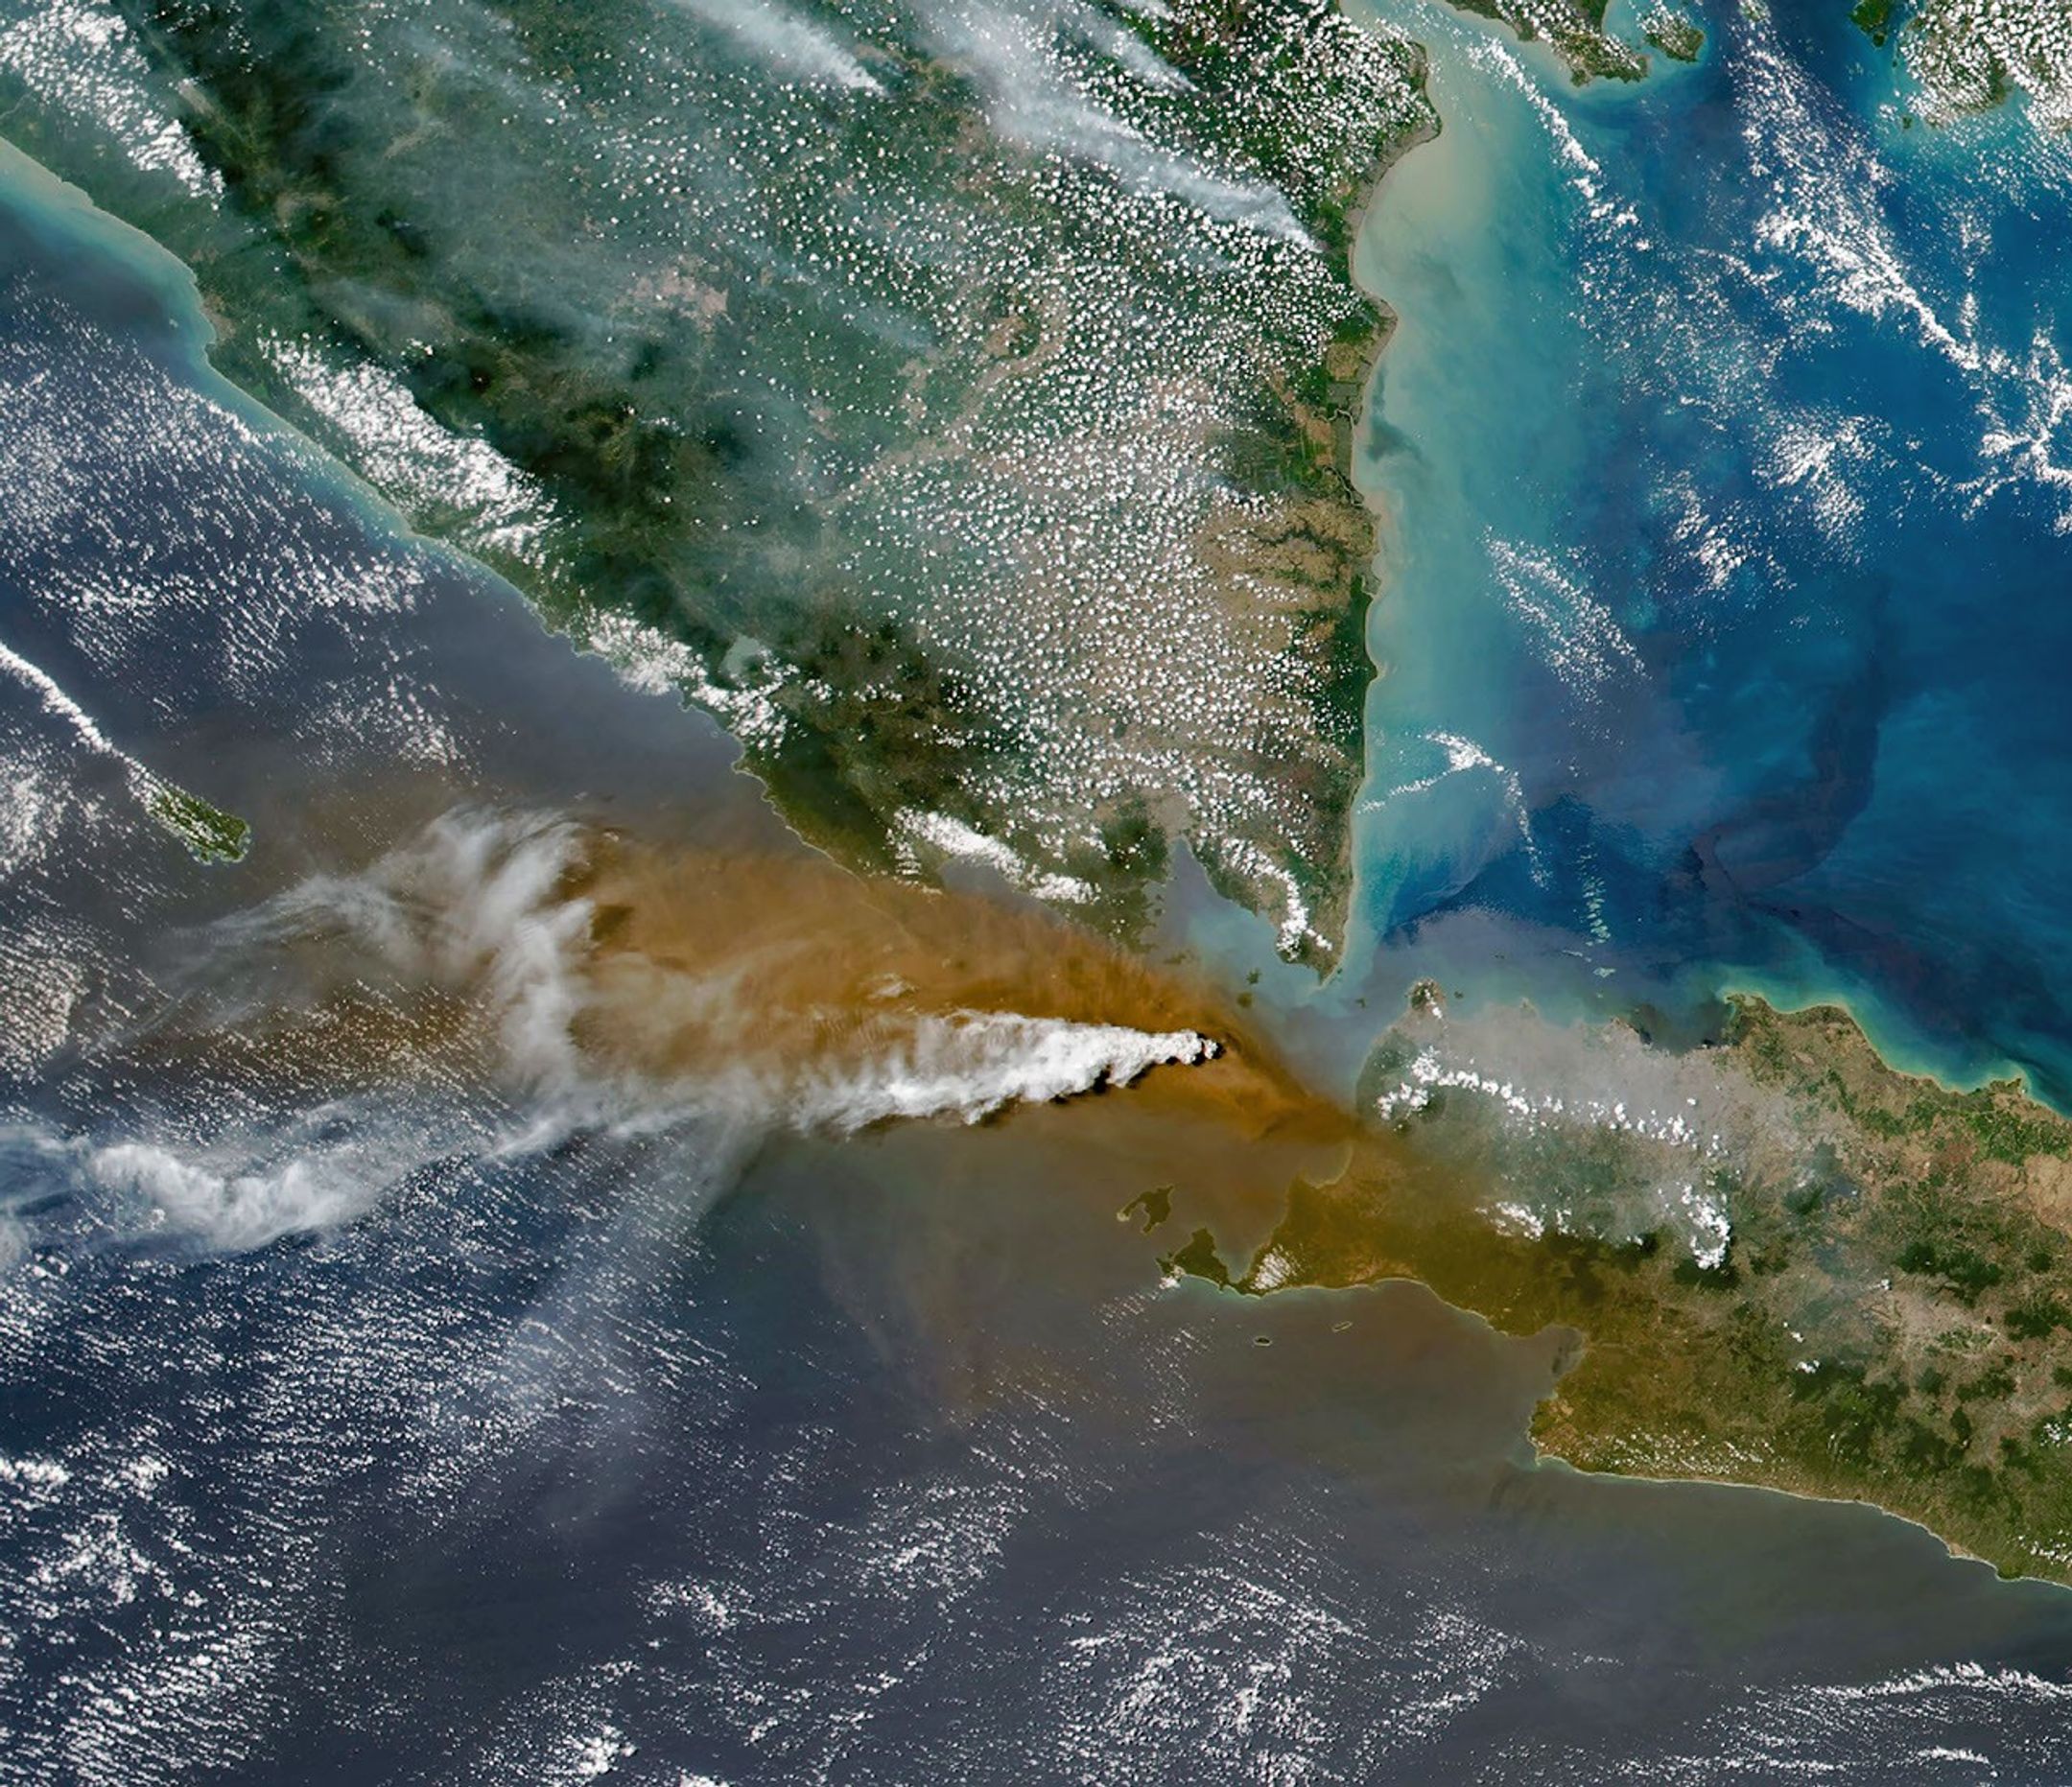
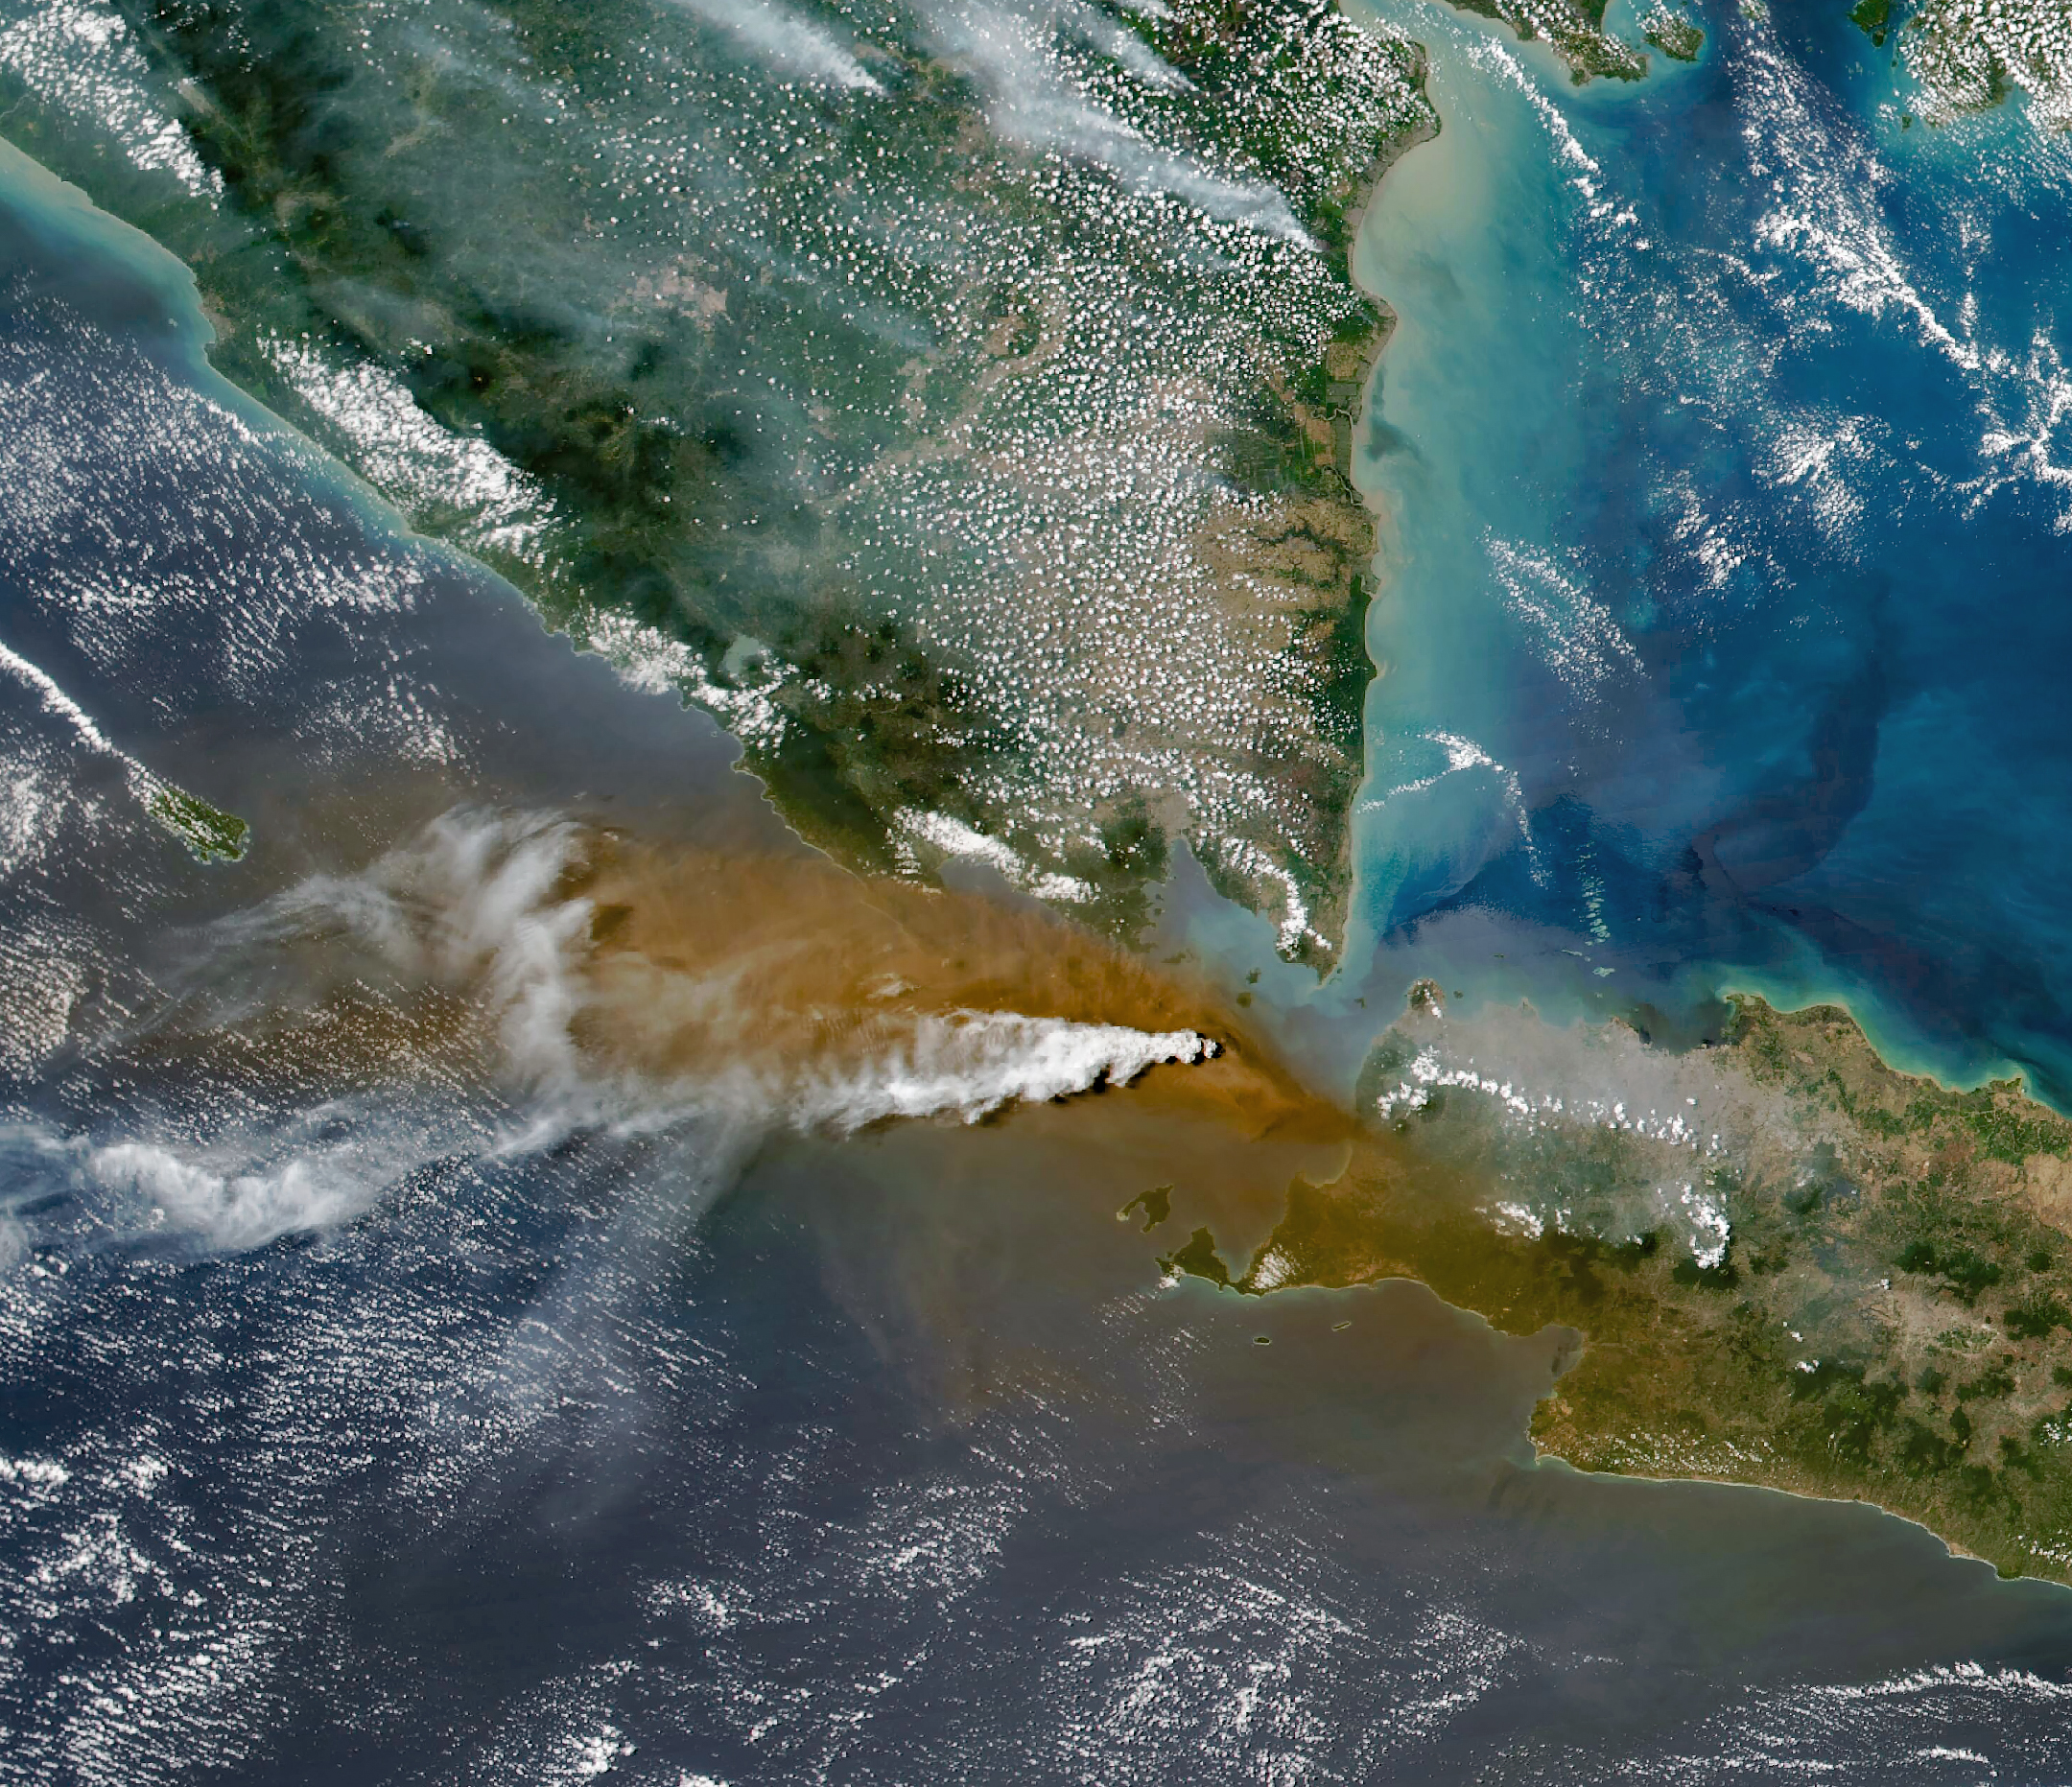
Satellites passing over the area during the eruption on September 5 captured images of the explosive activity. In the scene above, acquired with the OLI (Operational Land Imager) on the NASA-USGS Landsat 8 satellite, a white plume of volcanic gas billows over a brown ash cloud. Below, a wider view captured by the VIIRS (Visible Infrared Imaging Radiometer Suite) on the Suomi NPP satellite shows the volcanic material dispersing over a large area.

Indonesia’s meteorological agency reported that ash had reached altitudes up to 6,000 meters (20,000 feet) to the east of the volcano and 15,000 meters (50,000 feet) to the west by September 6. The presence of ash in the atmosphere prompted the temporary closure of eight airports on Java and Sumatra, disrupting nearly 3,000 flights in and out of the area, according to news reports.
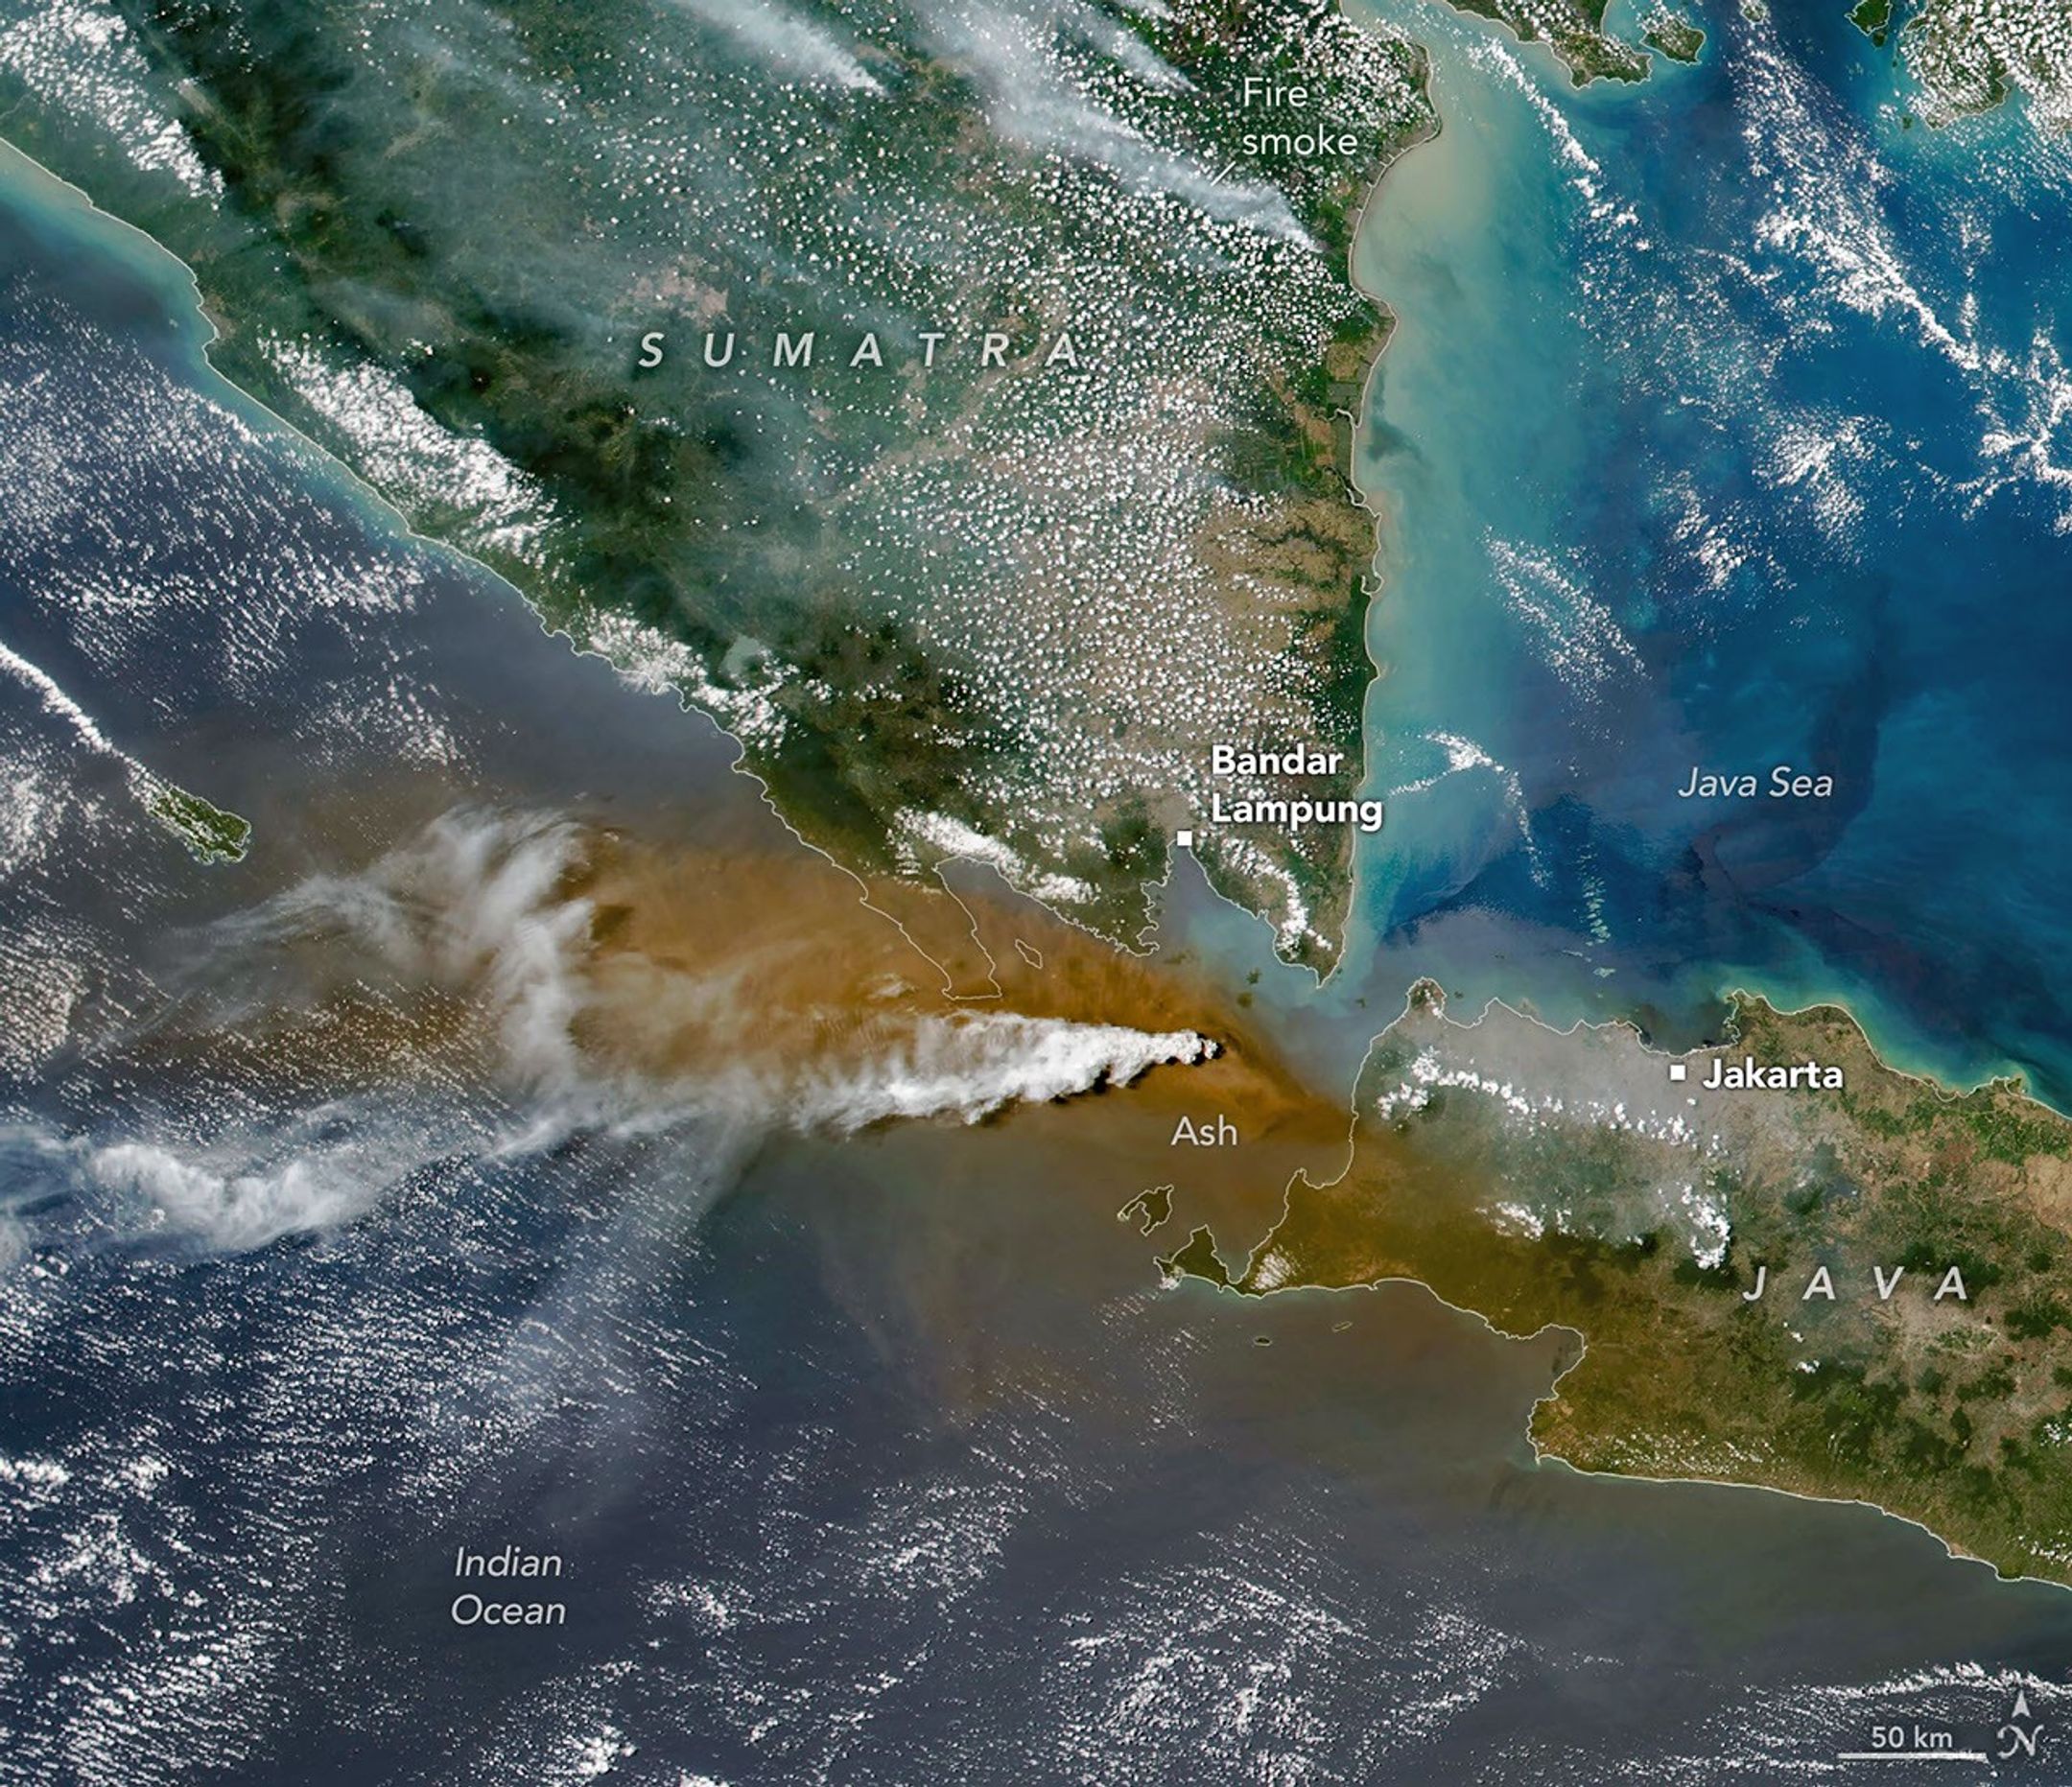
A white plume streams to the left over a larger tan ash cloud, both coming from a volcanic eruption between the Indonesian islands of Java and Sumatra.
Plumes of ash and volcanic gases from Anak Krakatau drift over Indonesia and the Indian Ocean in this image captured by the VIIRS (Visible Infrared Imaging Radiometer Suite) on the Suomi NPP satellite on September 5, 2026.
NASA Earth Observatory/Michala Garrison

Ashfall affected populated areas, particularly to the east of Anak Krakatau in Jakarta and other parts of West Java, the Indonesian Humanitarian Coordination Platform (IHCP) reported. Volcanic ash poses health risks to people and can irritate the respiratory tract, eyes, and skin. However, this air quality hazard differs from the smoke produced by peatland fires elsewhere in the country in terms of particle characteristics, dispersal patterns, and protection measures, the IHCP noted. 

On September 6, the continuous explosive eruption from Anak Krakatau subsided, though the volcano kept rumbling. It returned to a more typical pattern of Strombolian eruptions, characterized by intermittent spurts of ash and volcanic material. Airports had resumed operation by September 8, but the volcano remained at the second-highest alert level on the country’s scale, as it has been since early July.

NASA Earth Observatory images by Michala Garrison, using Landsat data from the U.S. Geological Survey, and VIIRS data from NASA EOSDIS LANCE, GIBS/Worldview, and the Suomi National Polar-orbiting Partnership. Story by Lindsey Doermann.
Downloads

A white volcanic plume streams left over a tan ash cloud that fills most of the image. A small green island and blue water are visible in the upper right.

September 5, 2026: Landsat

JPEG (14.89 MB)

A white plume streams to the left over a larger tan ash cloud, both coming from a volcanic eruption between the Indonesian islands of Java and Sumatra.

September 5, 2026: VIIRS

JPEG (3.38 MB)

References & Resources

You may also be interested in:

Stay up-to-date with the latest content from NASA as we explore the universe and discover more about our home planet.

Ever Restless Mount Dukono Erupts

2 min read

The volcano on Indonesia’s Halmahera Island routinely ejects ash, volcanic gases, and volcanic bombs.
Article

New Eruption in the Bismarck Sea

5 min read

Satellite imagery shows a surge of new volcanic activity in the ocean near Papua New Guinea.
Article

Melting Snow Off Shivelyuch

4 min read

Near-constant activity continues on the volcano in Russia.

Article
  •  

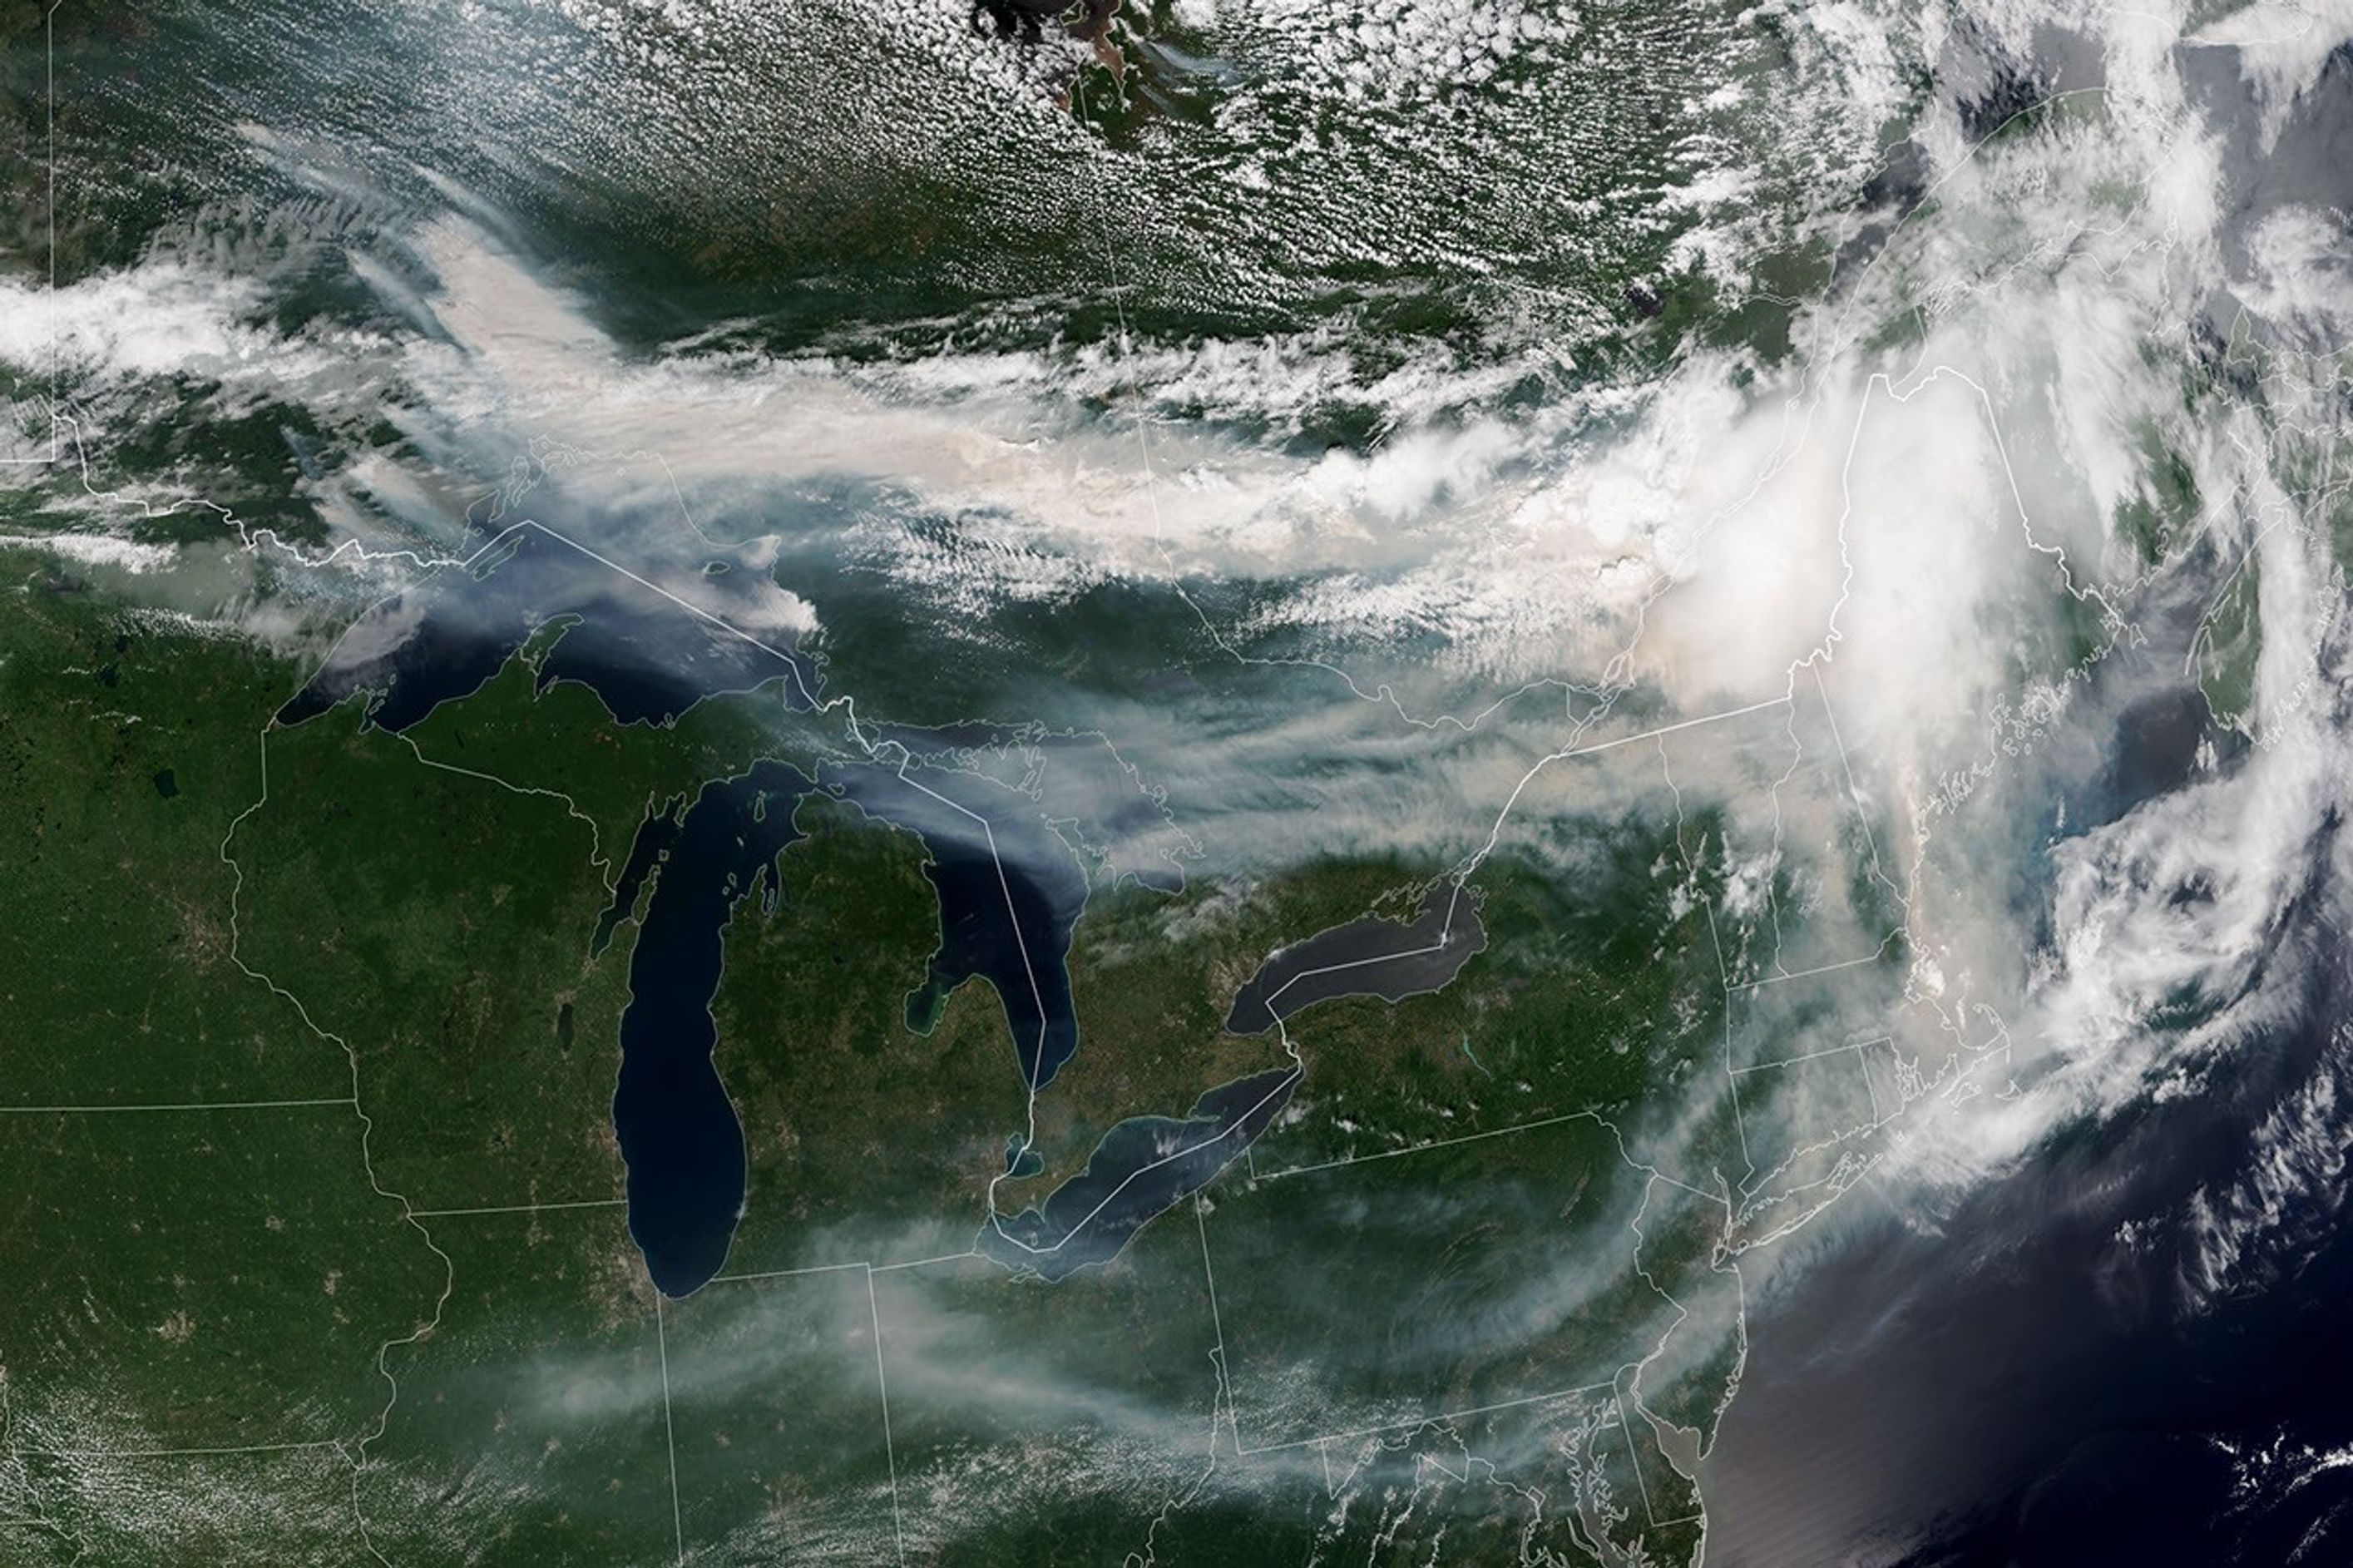
Ontario Wildfire Smoke Moves East

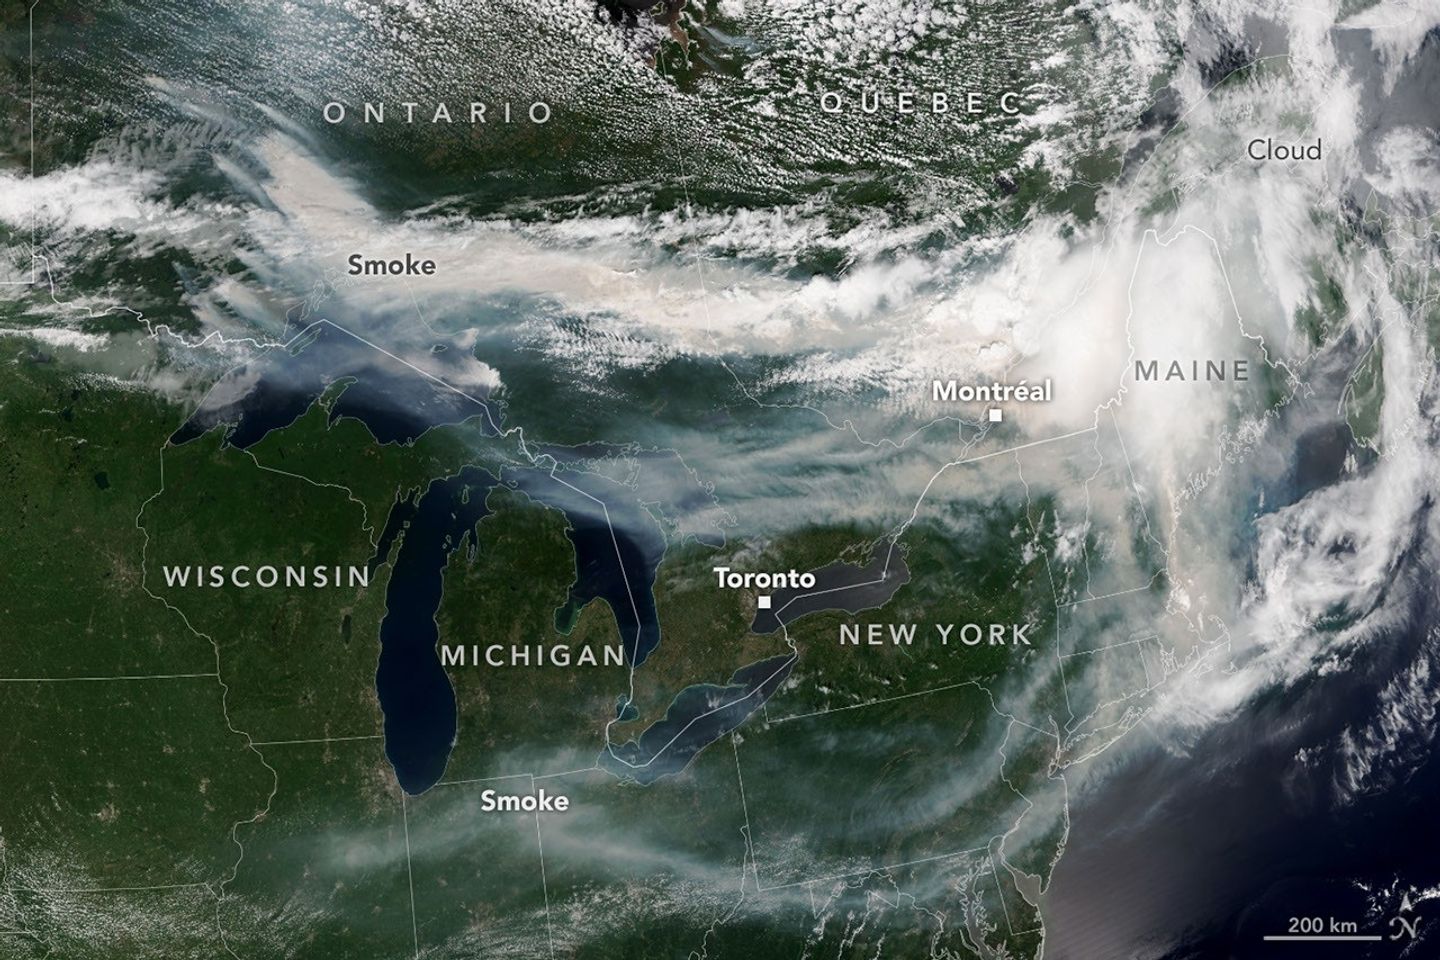
A satellite image shows brown smoke from wildfires in Ontario, Canada, streaming east across parts of Canada and the U.S. Areas of white clouds are mixed in with the smoke.
Smoke from wildland fires pours eastward over Canada and the U.S. in an image captured on the afternoon of July 14, 2026, by the VIIRS (Visible Infrared Imaging Radiometer Suite) on the NOAA-21 satellite.
NASA Earth Observatory/Lauren Dauphin

After a slow start to Canada’s 2026 fire season, activity picked up by the end of June amid dry, warm conditions and returned closer to the 25-year average. By mid-July, almost 850 fires were actively burning across the country, according to the Canadian Interagency Forest Fire Centre. More than 180 of those were burning in Ontario.

This NOAA-21 image, acquired on the afternoon of July 14, 2026, shows smoke billowing from the Ontario fires. Winds carried the smoke primarily southeast over much of the southern part of the province, as well as parts of Quebec and the U.S. Midwest and Northeast, tinting the sky shades of gray and yellow and the Sun orange in many areas.

The smoke’s impact on air quality varied, depending largely on altitude. In areas where smoke was high in the atmosphere, air quality impacts were negligible; where it drifted closer to the ground, conditions worsened. Air quality in Toronto, for instance, reached unhealthy levels, according to AirNow. People in the southern parts of the province were also grappling with a heat wave, compounding the health risks.

Much of the smoke came from fires in Northwestern Ontario, where eight blazes saw significant growth on July 13 and 14. The fires prompted officials to issue evacuation orders for several communities in this part of the province, according to news reports.

As of July 14, fires across Canada have burned 1.9 million hectares (4.7 million acres) since the start of the year—still well below the season totals from the extreme fire years of 2023 and 2025. How the rest of the season plays out remains to be seen. A seasonal fire outlook—compiled by wildland fire experts from the U.S., Canada, and Mexico—shows where fire conditions are more or less likely through July, August, and September.

NASA Earth Observatory image by Lauren Dauphin, using VIIRS data from NASA EOSDIS LANCE , GIBS/Worldview , and the Joint Polar Satellite System (JPSS). Story by Kathryn Hansen.

Downloads

A satellite image shows brown smoke from wildfires in Ontario, Canada, streaming east across parts of Canada and the U.S. Areas of white clouds are mixed in with the smoke.

July 14, 2026

JPEG (3.96 MB)

References & Resources

You may also be interested in:

Stay up-to-date with the latest content from NASA as we explore the universe and discover more about our home planet.

Fighting Fire With Fire
3 min read

In fire-prone ecosystems in Australia’s Northern Territory, prescribed burns are lit to minimize the severity of fires later in the…

Article
Fires Tear Through Nebraska Grasslands
3 min read

Dry, warm, and windy conditions across the U.S. Great Plains led to extreme fire activity in March 2026.

Article
Cottonwood Fire Chars Utah
5 min read

The blaze burned more than 150 square miles and swept through parts of a ski resort.

Article

The post Ontario Wildfire Smoke Moves East appeared first on NASA Science.

  •  

Ontario Wildfire Smoke Moves East

A satellite image shows brown smoke from wildfires in Ontario, Canada, streaming east across parts of Canada and the U.S. Areas of white clouds are mixed in with the smoke.
Smoke from wildland fires pours eastward over Canada and the U.S. in an image captured on the afternoon of July 14, 2026, by the VIIRS (Visible Infrared Imaging Radiometer Suite) on the NOAA-21 satellite.
NASA Earth Observatory/Lauren Dauphin

After a slow start to Canada’s 2026 fire season, activity picked up by the end of June amid dry, warm conditions and returned closer to the 25-year average. By mid-July, almost 850 fires were actively burning across the country, according to the Canadian Interagency Forest Fire Centre. More than 180 of those were burning in Ontario.

This NOAA-21 image, acquired on the afternoon of July 14, 2026, shows smoke billowing from the Ontario fires. Winds carried the smoke primarily southeast over much of the southern part of the province, as well as parts of Quebec and the U.S. Midwest and Northeast, tinting the sky shades of gray and yellow and the Sun orange in many areas.

The smoke’s impact on air quality varied, depending largely on altitude. In areas where smoke was high in the atmosphere, air quality impacts were negligible; where it drifted closer to the ground, conditions worsened. Air quality in Toronto, for instance, reached unhealthy levels, according to AirNow. People in the southern parts of the province were also grappling with a heat wave, compounding the health risks.

Much of the smoke came from fires in Northwestern Ontario, where eight blazes saw significant growth on July 13 and 14. The fires prompted officials to issue evacuation orders for several communities in this part of the province, according to news reports.

As of July 14, fires across Canada have burned 1.9 million hectares (4.7 million acres) since the start of the year—still well below the season totals from the extreme fire years of 2023 and 2025. How the rest of the season plays out remains to be seen. A seasonal fire outlook—compiled by wildland fire experts from the U.S., Canada, and Mexico—shows where fire conditions are more or less likely through July, August, and September.

NASA Earth Observatory image by Lauren Dauphin, using VIIRS data from NASA EOSDIS LANCE , GIBS/Worldview , and the Joint Polar Satellite System (JPSS). Story by Kathryn Hansen.

Downloads

A satellite image shows brown smoke from wildfires in Ontario, Canada, streaming east across parts of Canada and the U.S. Areas of white clouds are mixed in with the smoke.

July 14, 2026

JPEG (3.96 MB)

References & Resources

You may also be interested in:

Stay up-to-date with the latest content from NASA as we explore the universe and discover more about our home planet.

Fighting Fire With Fire

3 min read

In fire-prone ecosystems in Australia’s Northern Territory, prescribed burns are lit to minimize the severity of fires later in the…

Article

Fires Tear Through Nebraska Grasslands

3 min read

Dry, warm, and windy conditions across the U.S. Great Plains led to extreme fire activity in March 2026.

Article

Cottonwood Fire Chars Utah

5 min read

The blaze burned more than 150 square miles and swept through parts of a ski resort.

Article
  •  

Super Typhoon Bavi

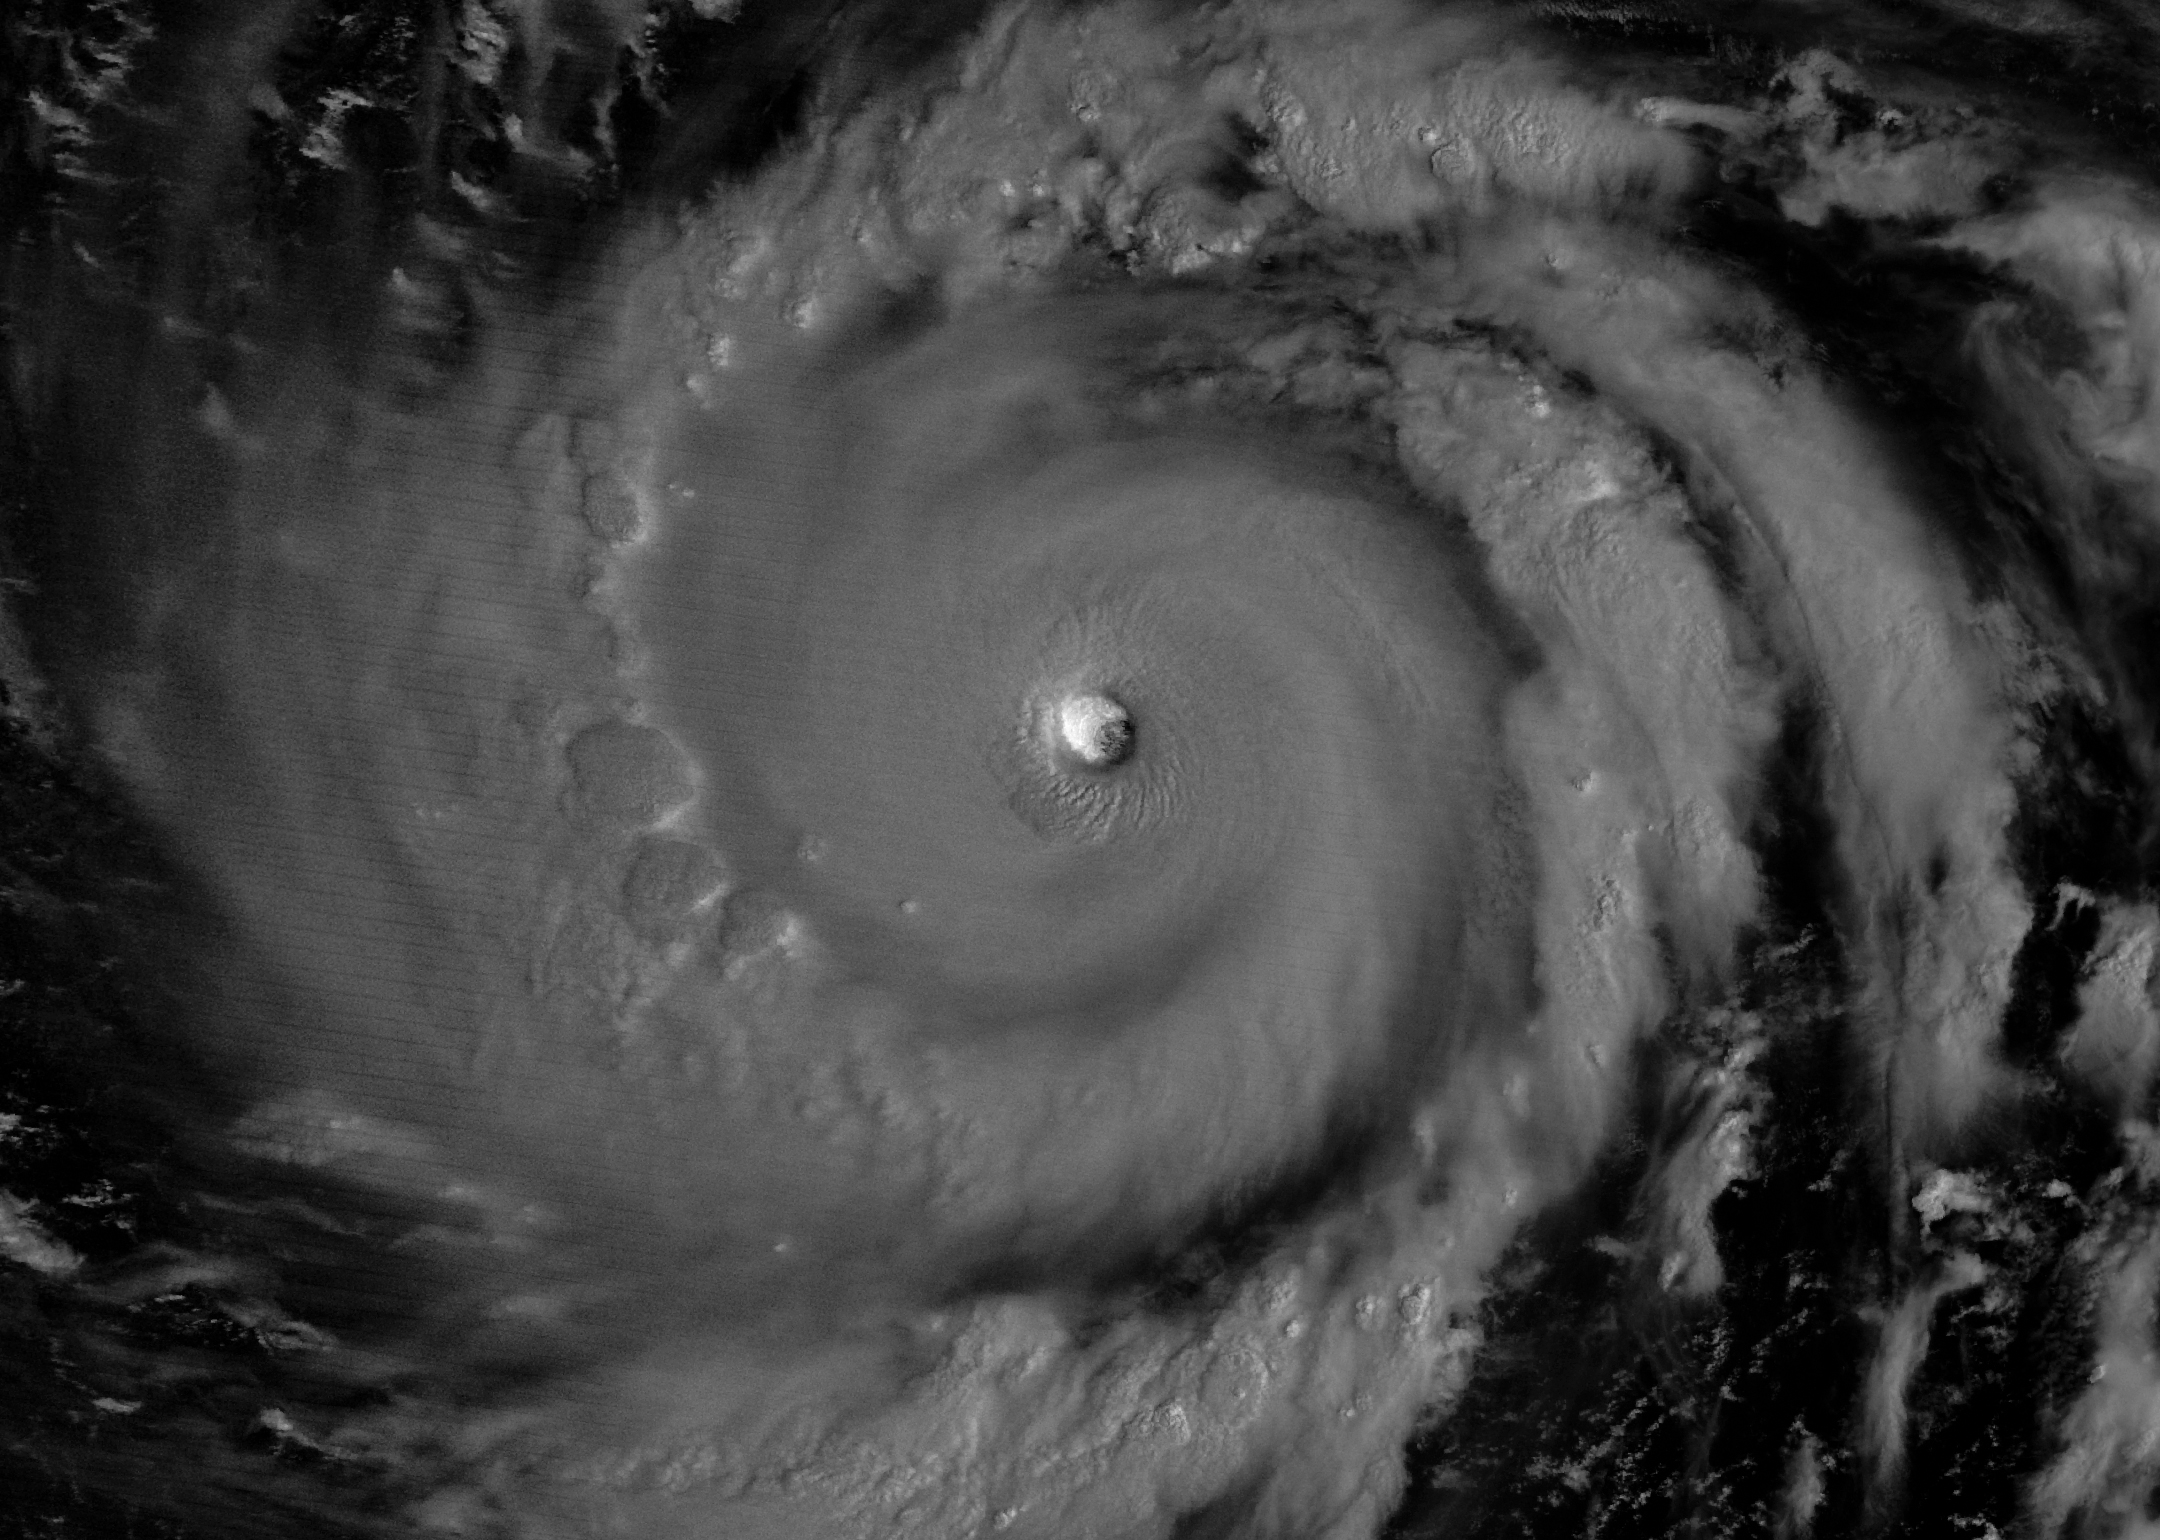
The eyewall of a super typhoon is partially illuminated by moonlight in a nighttime satellite image.
Moonlight illuminates the western side of Super Typhoon Bavi’s eyewall at about 15:30 Universal Time on July 5 (1:30 a.m. local time on July 6). The image was acquired with the VIIRS (Visible Infrared Imaging Radiometer Suite) day-night band on the NOAA-20 satellite.
NASA Earth Observatory/Michala Garrison

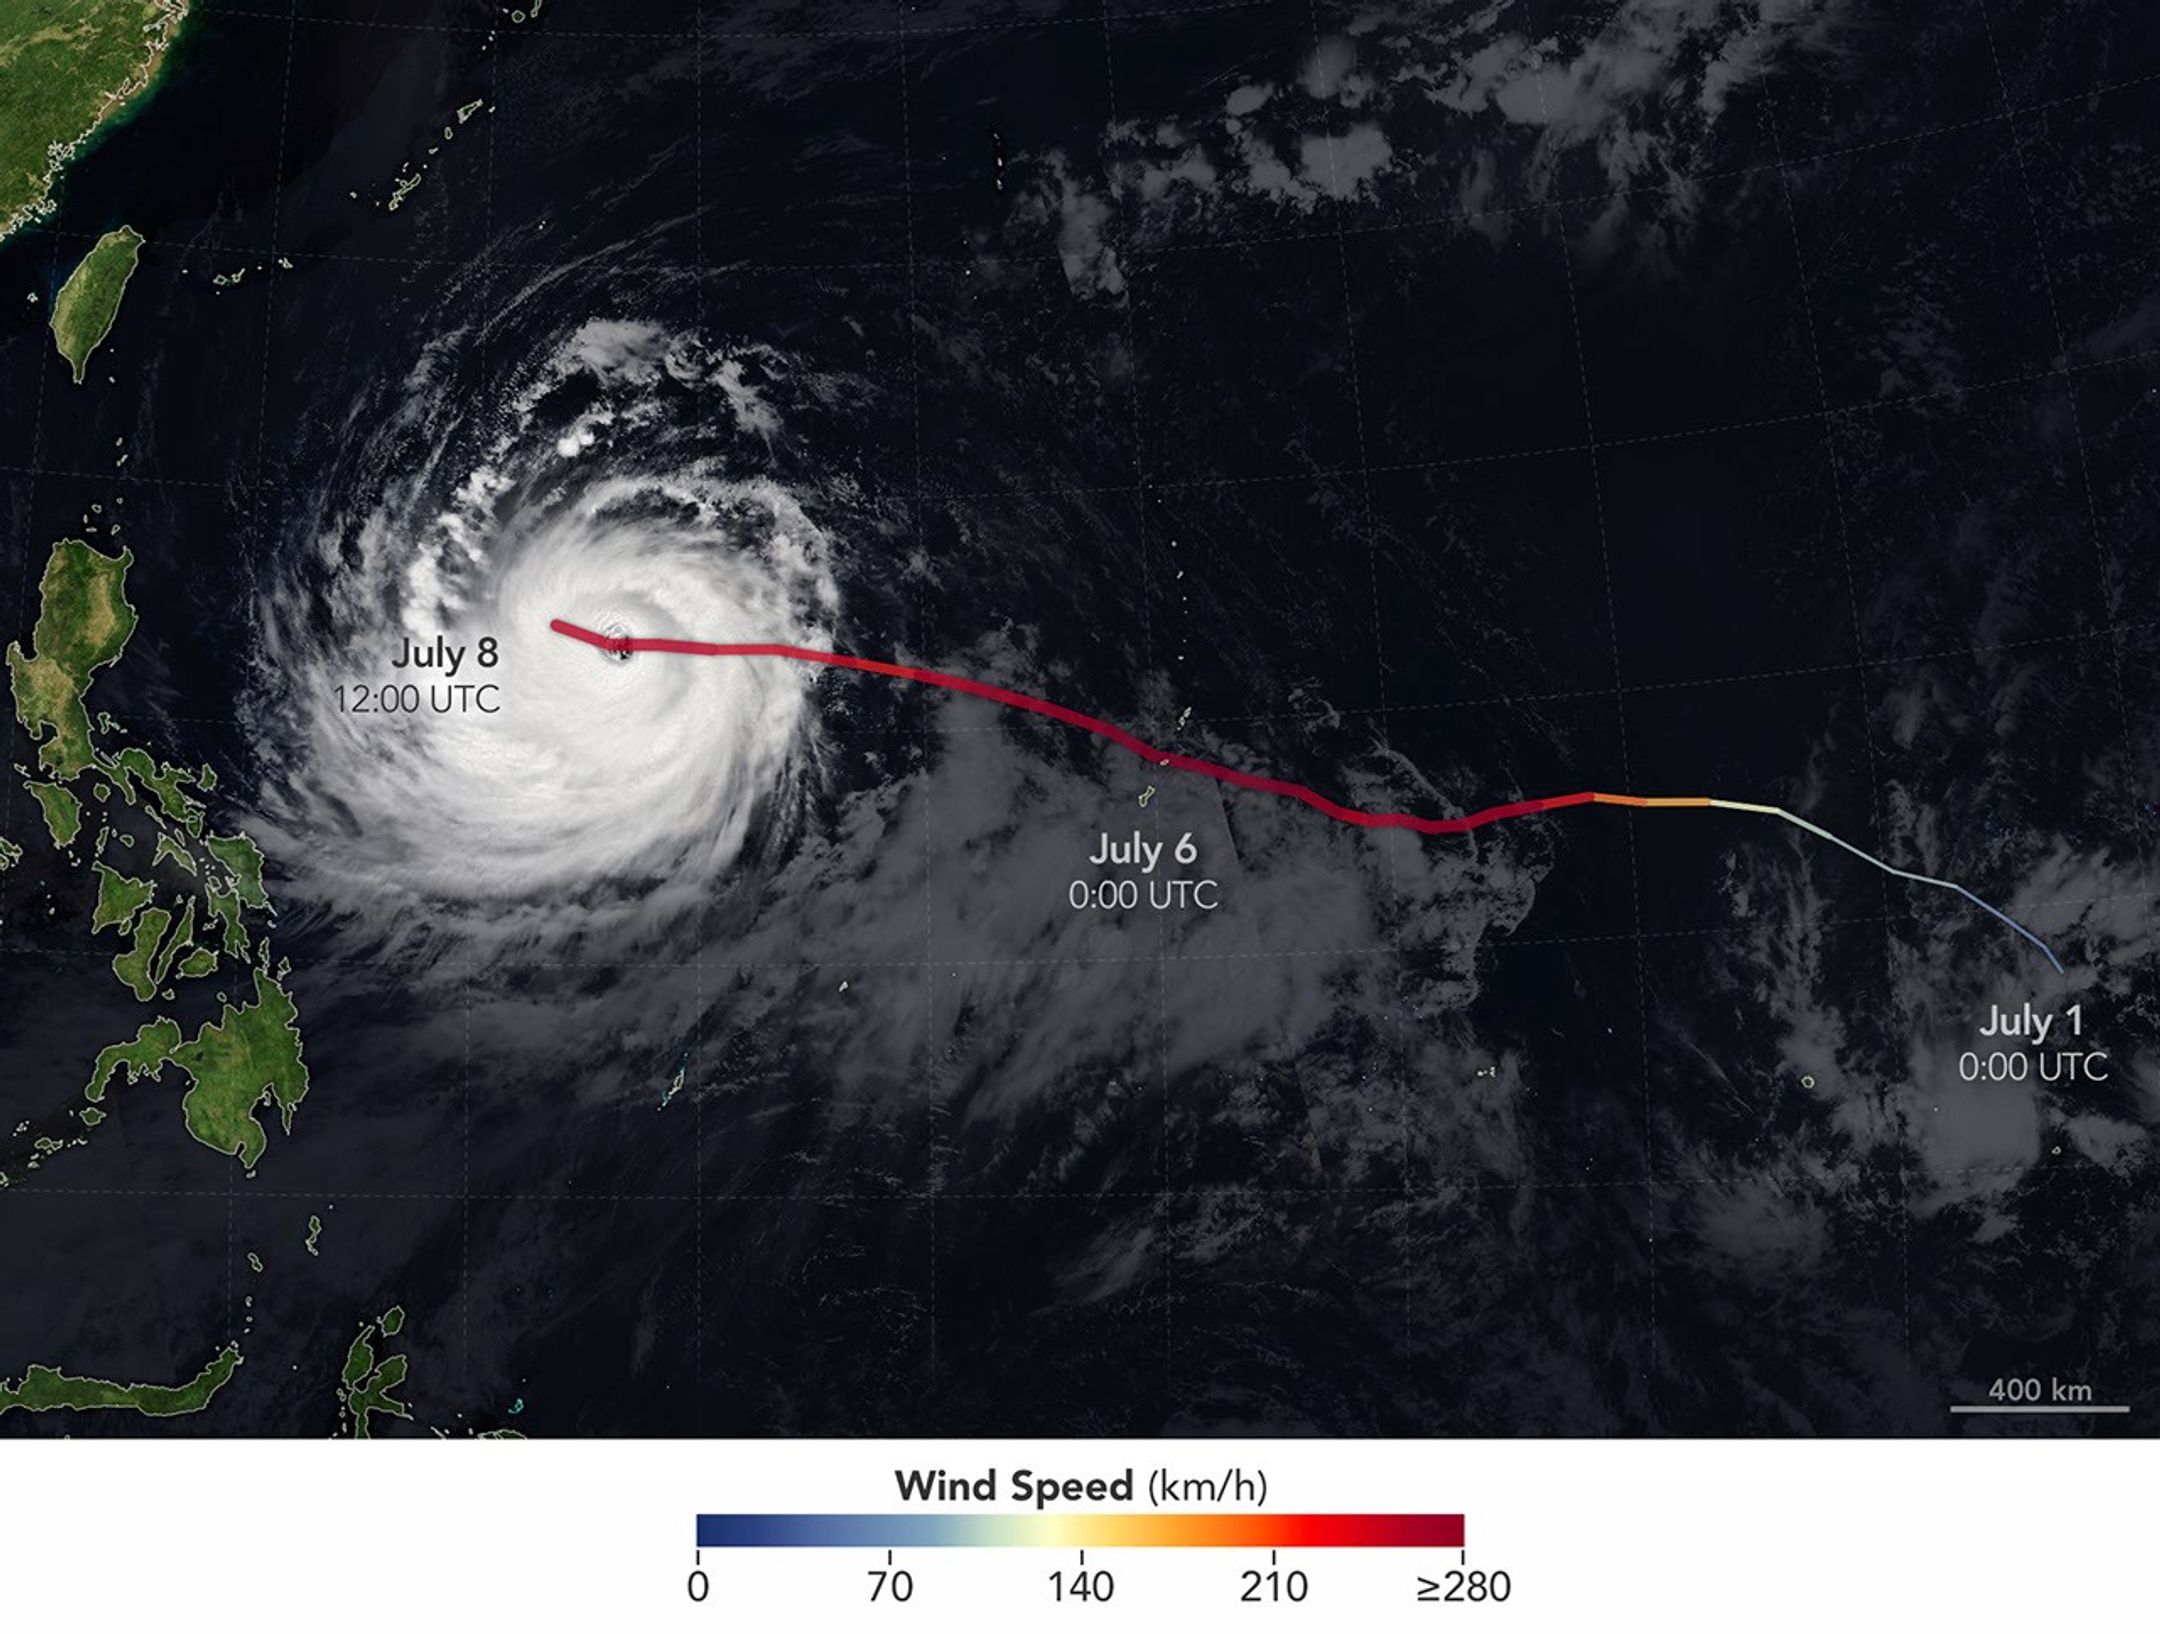
In early July 2026, for the second time in three months, a powerful typhoon crossed the U.S. Northern Mariana Islands and Guam in the North Pacific Ocean. Super Typhoon Bavi was at peak intensity when it neared the islands on the night of July 5, bringing winds of 290 kilometers (180 miles) per hour, along with torrential rain and dangerous storm surge.

This nighttime image, captured by the VIIRS (Visible Infrared Imaging Radiometer Suite) on the NOAA-20 satellite, shows Bavi’s eye at about 15:30 Universal Time on July 5 (1:30 a.m. local time on July 6). Light from the Moon, which was in the waning gibbous phase, illuminates the eyewall’s western side. The eye passed over Rota, north of Guam, several hours after the image was acquired.

Bavi became a super typhoon in the early hours of July 4 local time while tracking west over the warm ocean. Satellite observations indicated that sea surface temperatures were around 30 degrees Celsius (86 degrees Fahrenheit) in the region. Bavi was the third tropical cyclone in 2026 to reach category 5 intensity on the Saffir-Simpson wind scale.

The typhoon caused extensive damage across Guam, Rota, and Saipan, according to news reports, downing power poles and lines; flooding roads and littering them with debris; and damaging buildings, including a water distribution station on Rota. U.S. Coast Guard crews worked to clear navigation hazards in the waterways around Guam and the Northern Marianas and reopen ports as dangerous marine conditions subsided, according to reports. This damage comes on top of destructive winds and flooding from Super Typhoon Sinlaku, which crossed the islands in mid-April.

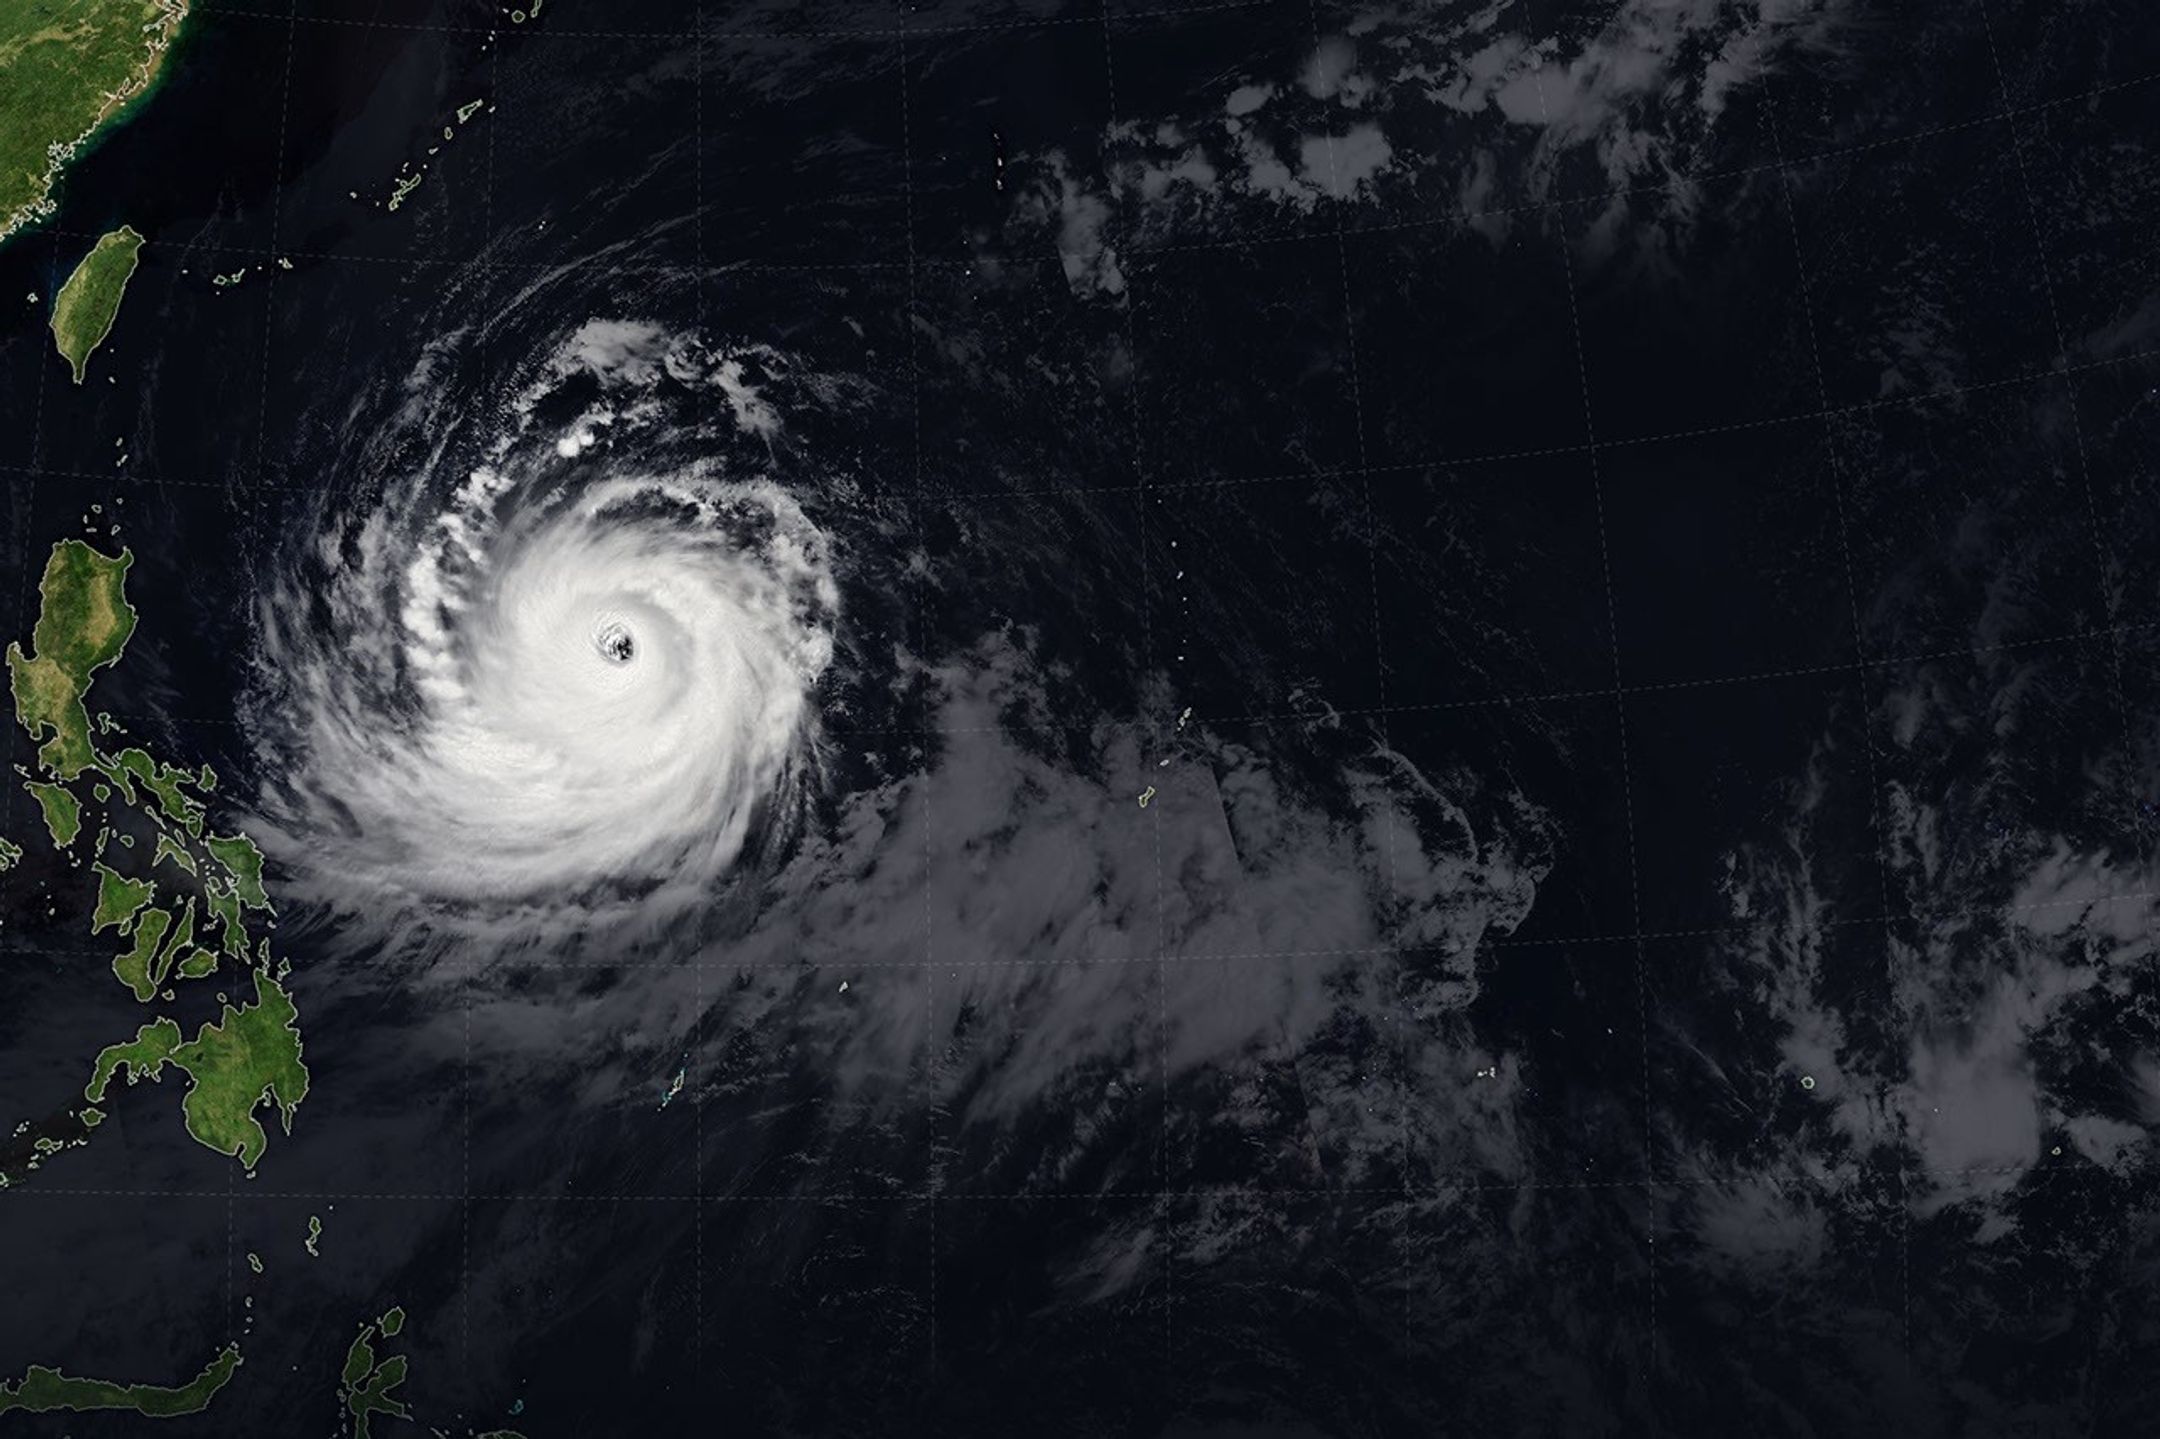
The spiraling clouds of Super Typhoon Bavi appear over the Philippine Sea southeast of Taiwan. The storm’s westward track is shown in colors corresponding to wind speed.
Super Typhoon Bavi tracked west over the Northern Mariana Islands toward Asia in early July 2026. The storm’s clouds and path are overlaid on a Blue Marble: Next Generation image built from scenes captured by the MODIS (Moderate Resolution Imaging Spectroradiometer). The image of the storm was captured by the VIIRS (Visible Infrared Imaging Radiometer Suite) on the NOAA-21 satellite on July 8, 2026, at about 04:30 Universal Time.
NASA Earth Observatory/Michala Garrison

On July 8, Bavi remained a powerful typhoon as it moved west over the Philippine Sea. In the early afternoon, when the image above was captured, the National Weather Service reported maximum sustained wind speeds of 250 kilometers (155 miles) per hour. Forecasts indicated the typhoon’s track could bend northwest toward Taiwan, the Ryukyu Islands of southern Japan, and mainland China and weaken over the next several days.

Writing in Yale Climate Connections, meteorologist Jeff Masters said that Bavi is the type of storm that might be expected when a strong El Niño event is building, which is currently the case. El Niño-year typhoons may form farther east, giving them more time over warm water to intensify before curving toward Asia, Masters explained, “resulting in a greater chance of reaching Category 5 intensity.”

NASA Earth Observatory images by Michala Garrison, using data from NASA EOSDIS LANCE, GIBS/Worldview, and the Joint Polar Satellite System (JPSS), and hurricane track data from the U.S. Naval Research Laboratory. Story by Lindsey Doermann.

Downloads

The eyewall of a super typhoon is partially illuminated by moonlight in a nighttime satellite image.

July 5, 2026

JPEG (1.47 MB)

The spiraling clouds of Super Typhoon Bavi appear over the Philippine Sea southeast of Taiwan. The storm’s westward track is shown in colors corresponding to wind speed.

July 8, 2026

JPEG (1.54 MB)

References & Resources

You may also be interested in:

Stay up-to-date with the latest content from NASA as we explore the universe and discover more about our home planet.

Super Typhoon Sinlaku

3 min read

The violent storm aimed at the U.S. Northern Mariana Islands and Guam in mid-April 2026.

Article

Typhoon Jangmi

2 min read

The sprawling storm promised to deliver torrential rain across a wide swath of southern Japan.

Article

Gravity Waves From Super Typhoon Sinlaku

4 min read

Satellites observed striking upper-atmosphere phenomena generated by an intensifying tropical cyclone.

Article
  •  
❌