❌

Reading view

El Niño Alters Marine Life in the Pacific


june 2025
june 2026

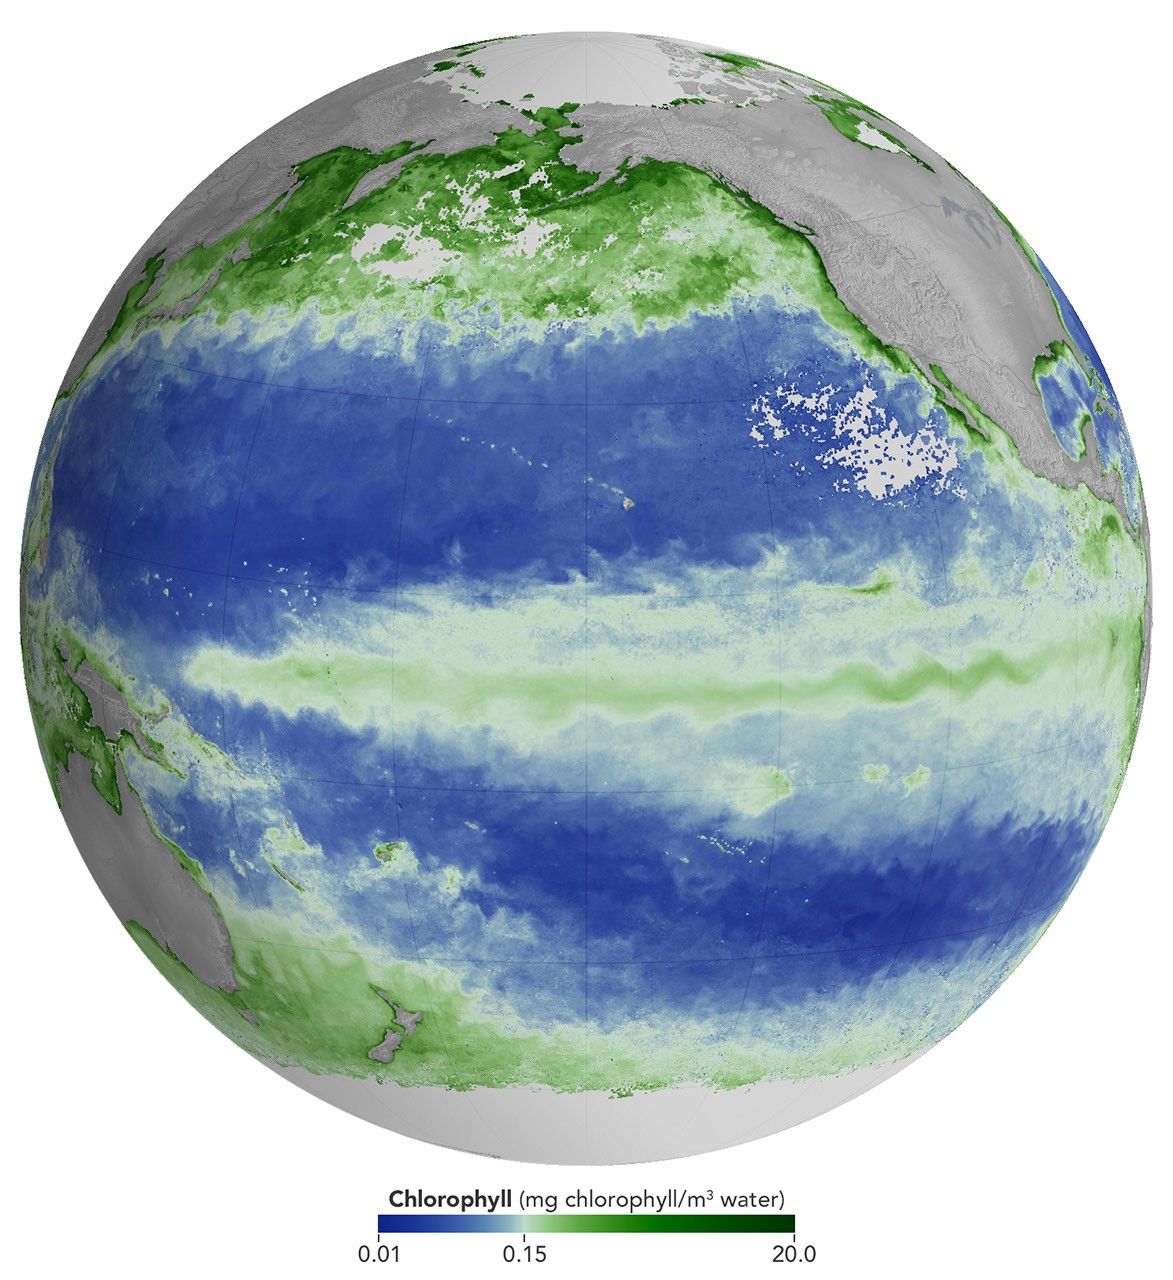
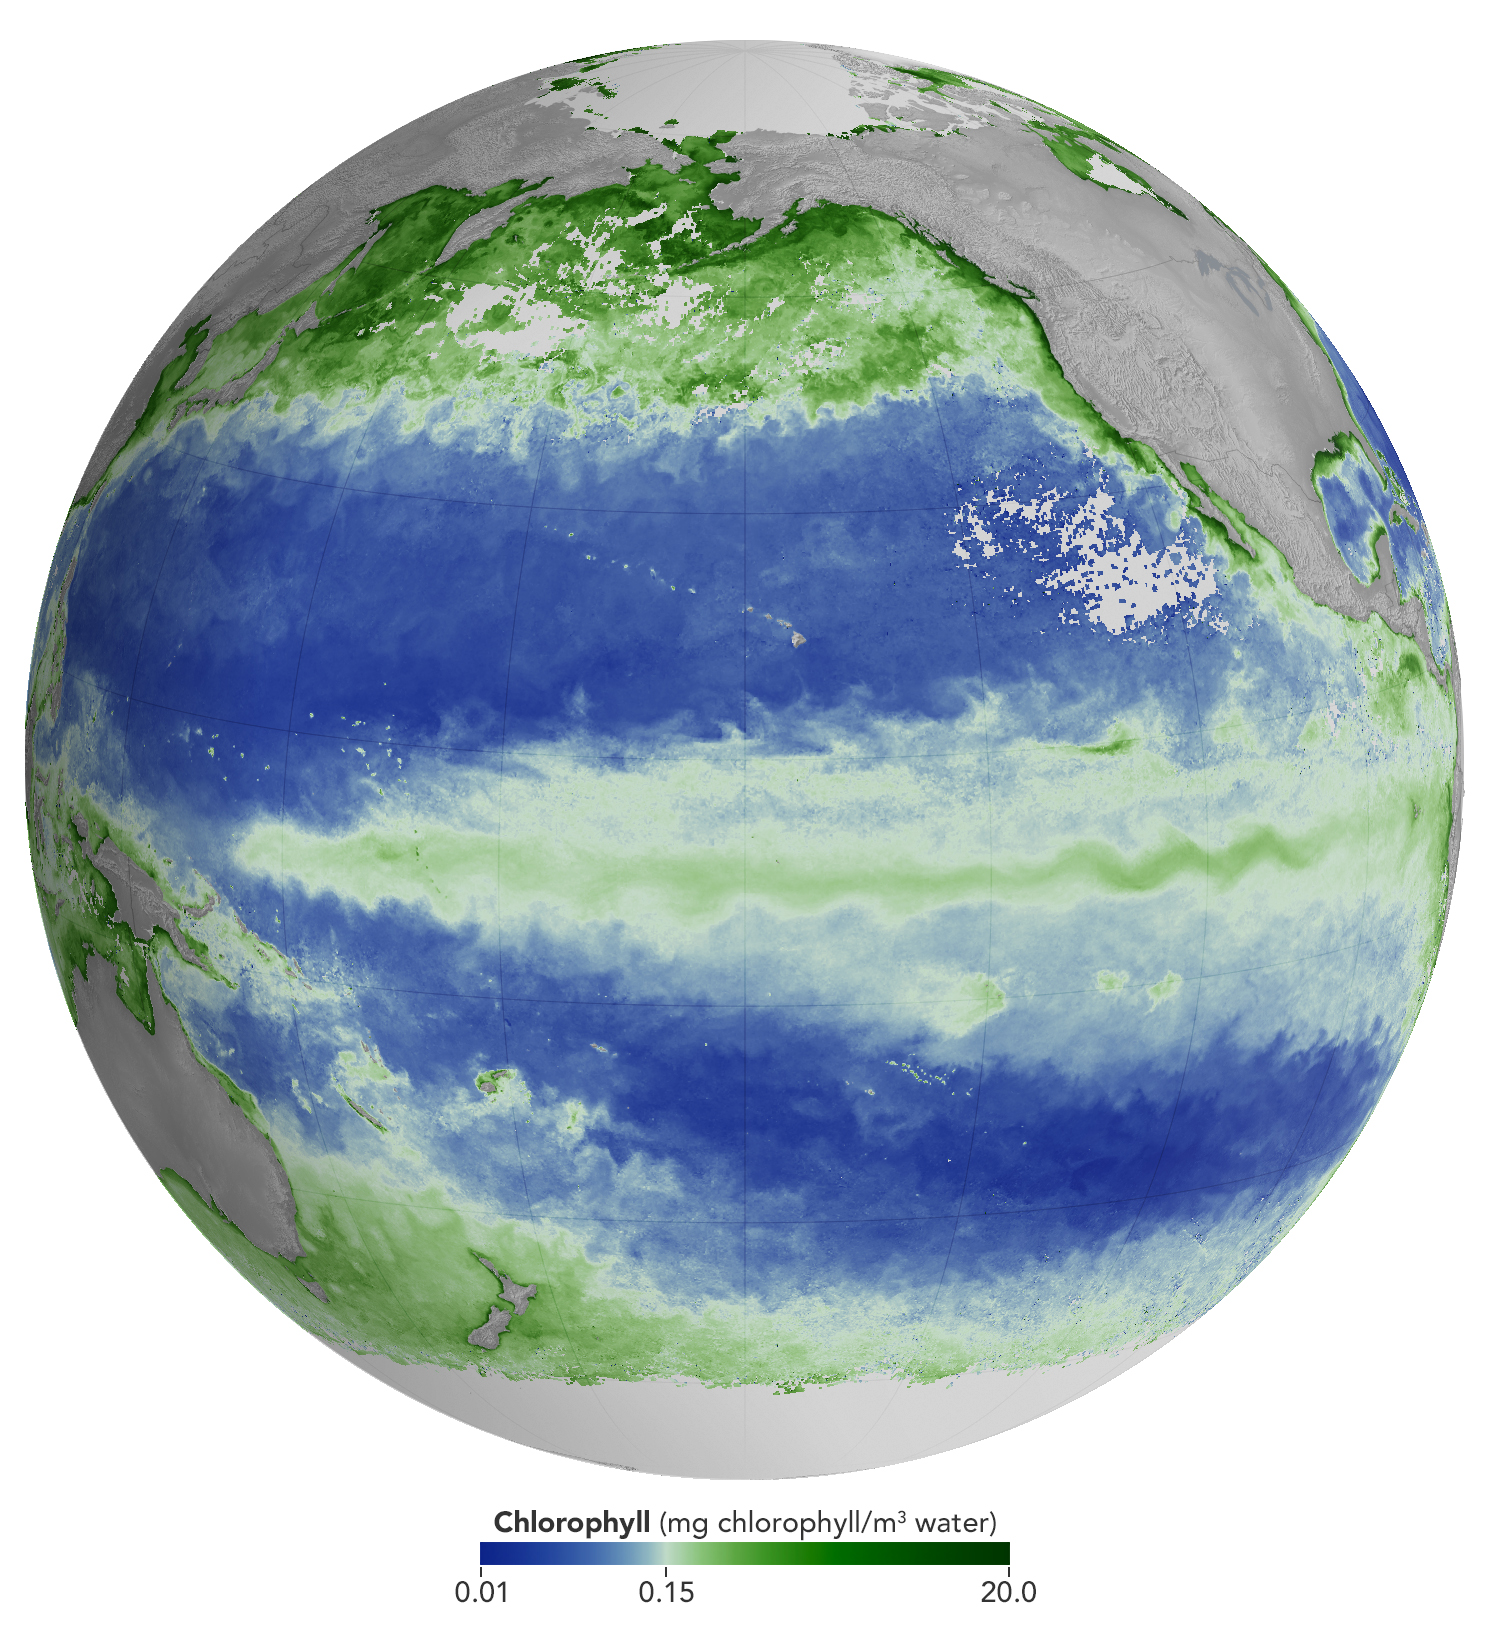
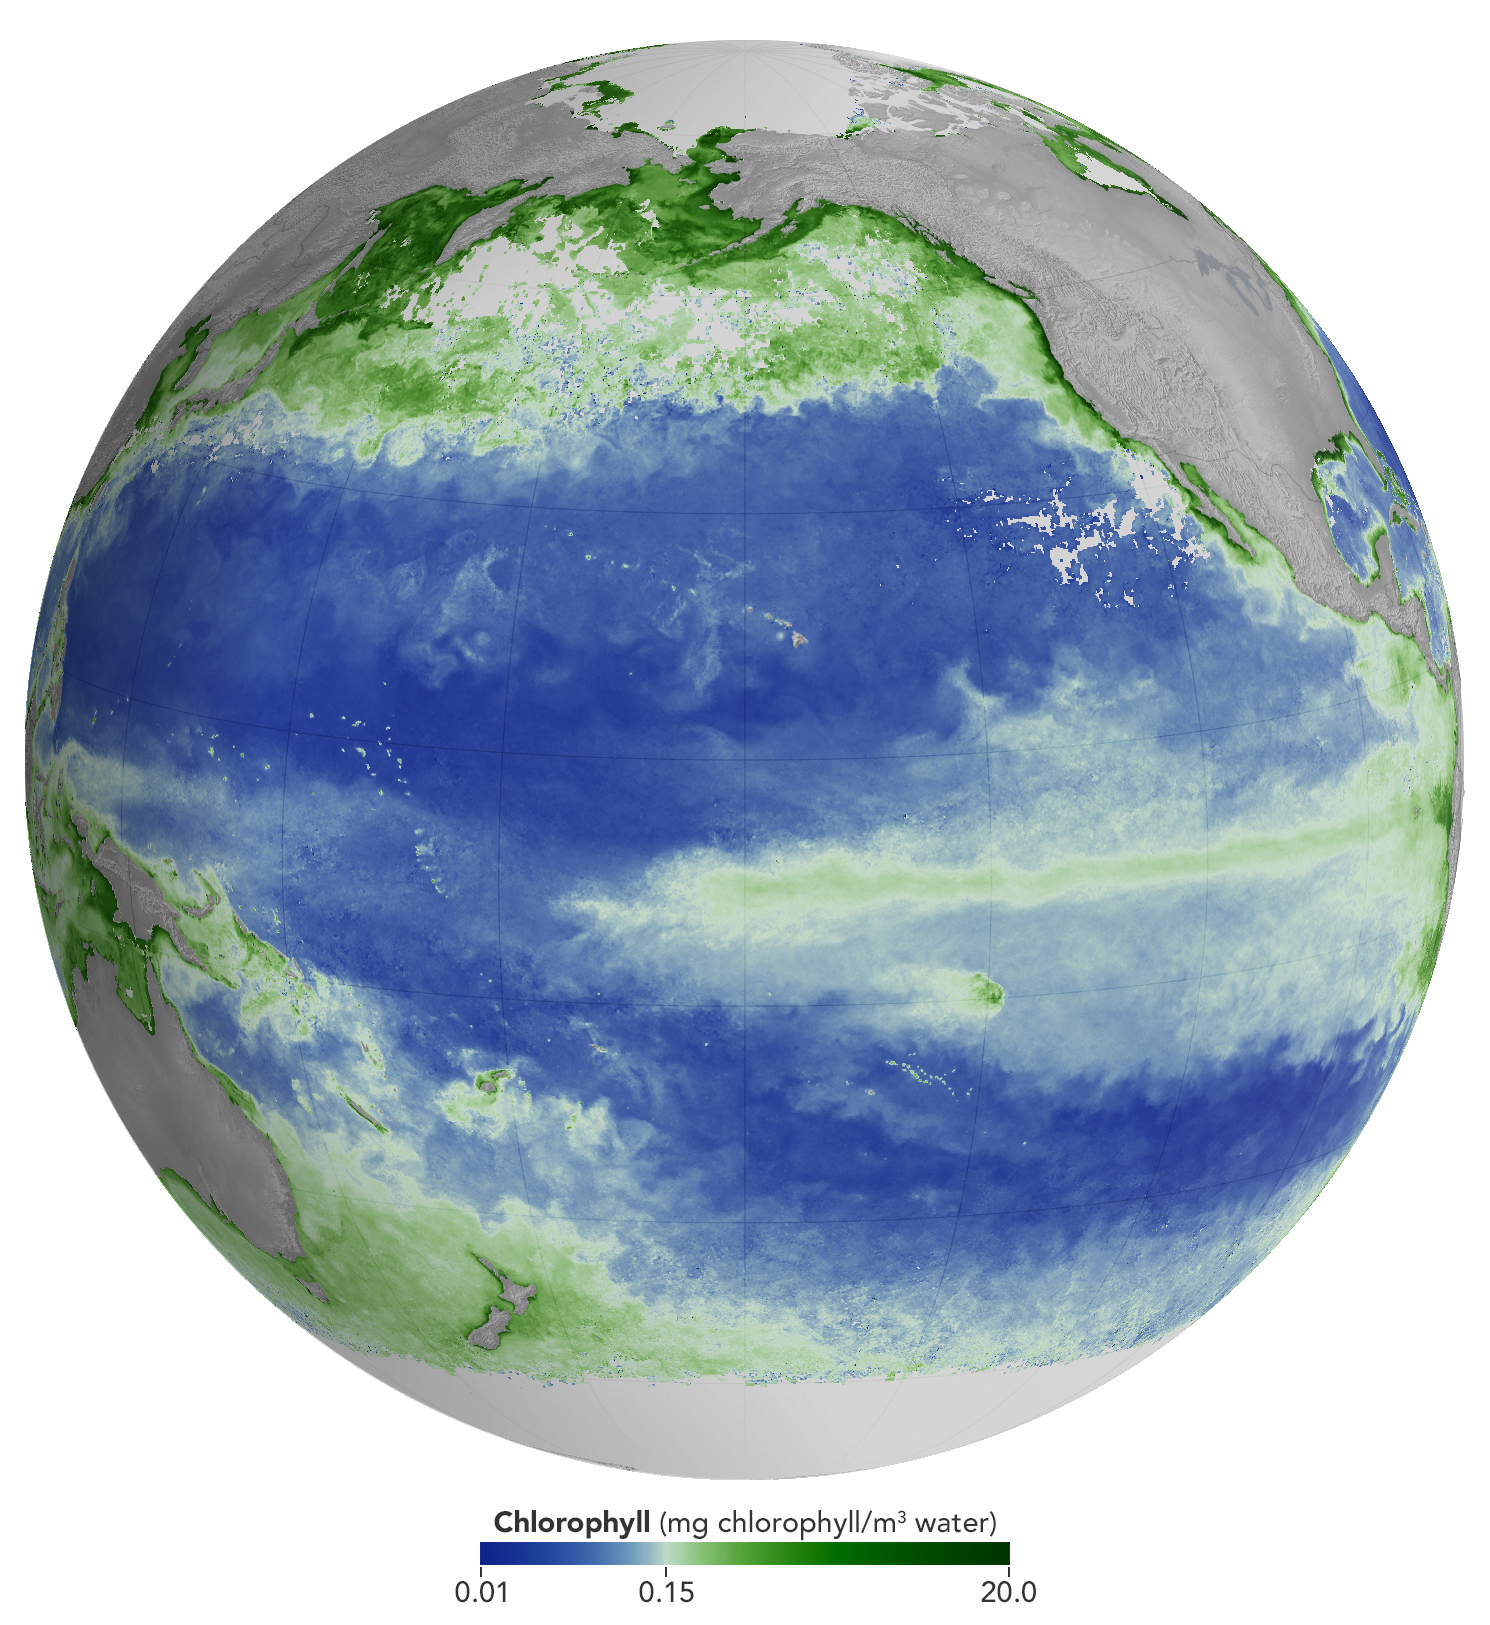
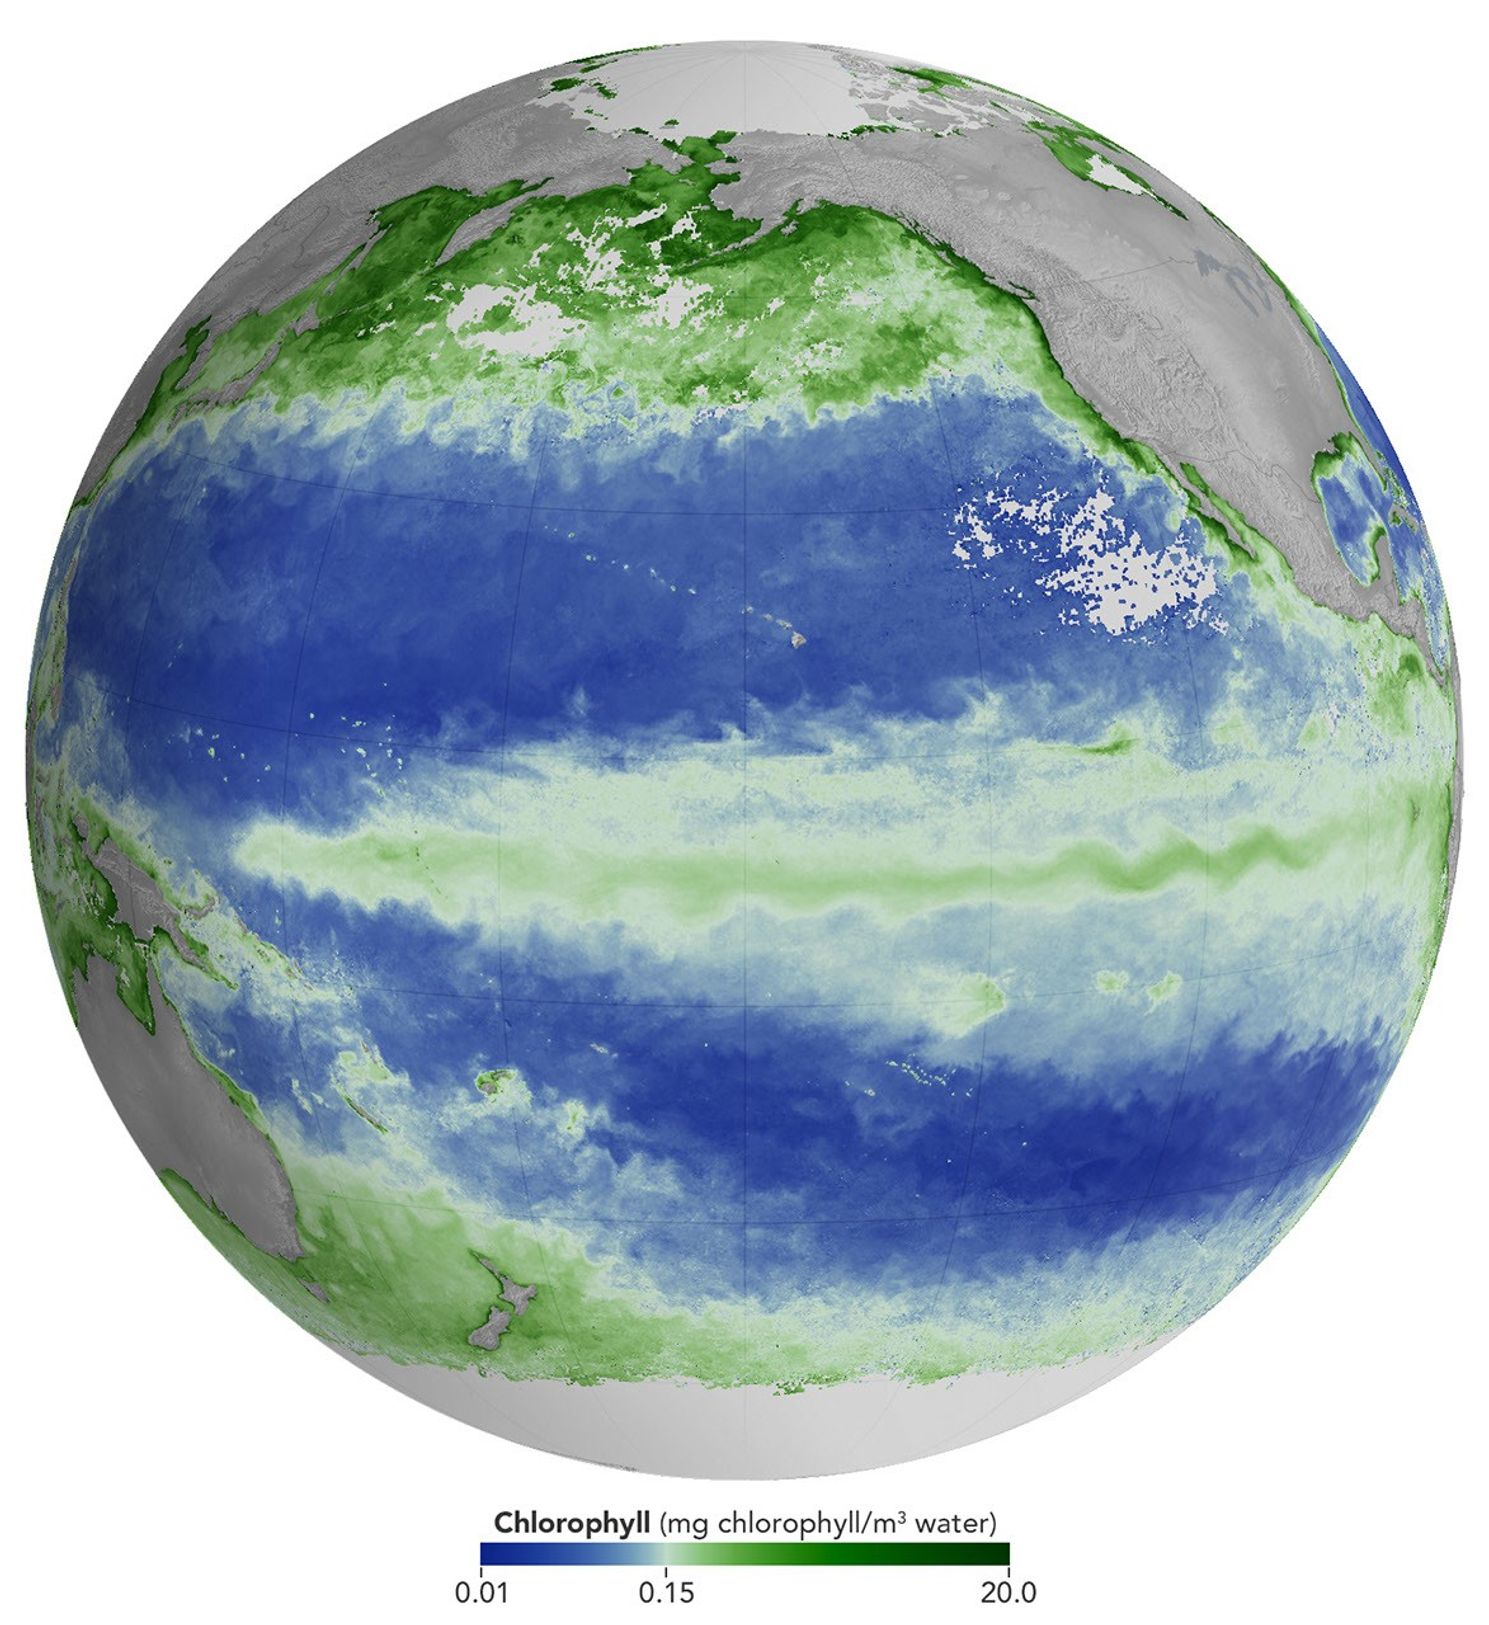
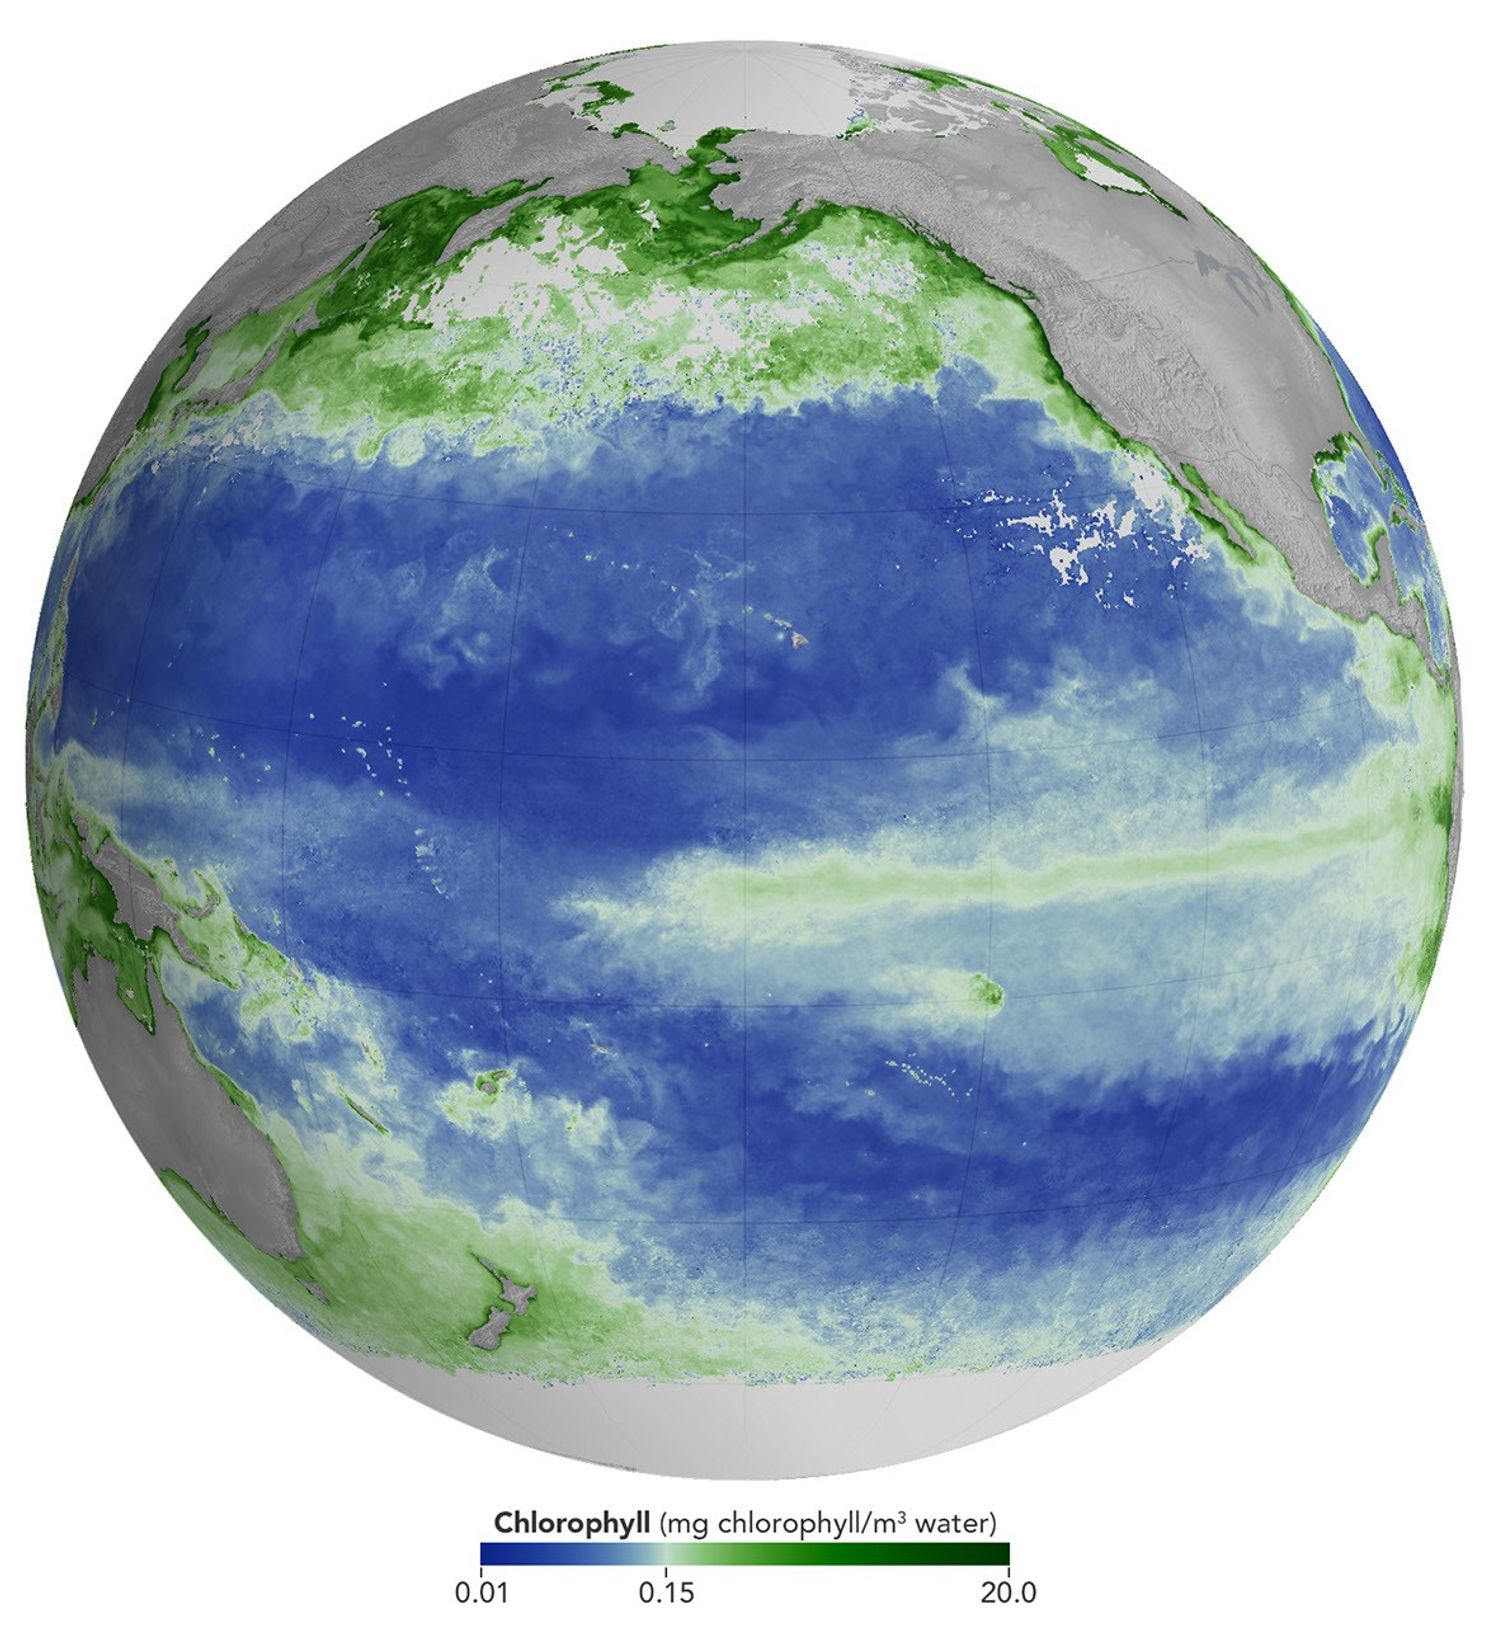
A global map centered on the Pacific Ocean shows a band of green across the equatorial region, indicating the presence of chlorophyll in surface waters.
NASA Earth Observatory/Michala Garrison

A global map centered on the Pacific Ocean shows a narrow band of green in the eastern equatorial region, indicating the presence of chlorophyll in surface waters. The central equatorial Pacific appears blue, meaning chlorophyll concentrations are low.
NASA Earth Observatory/Michala Garrison

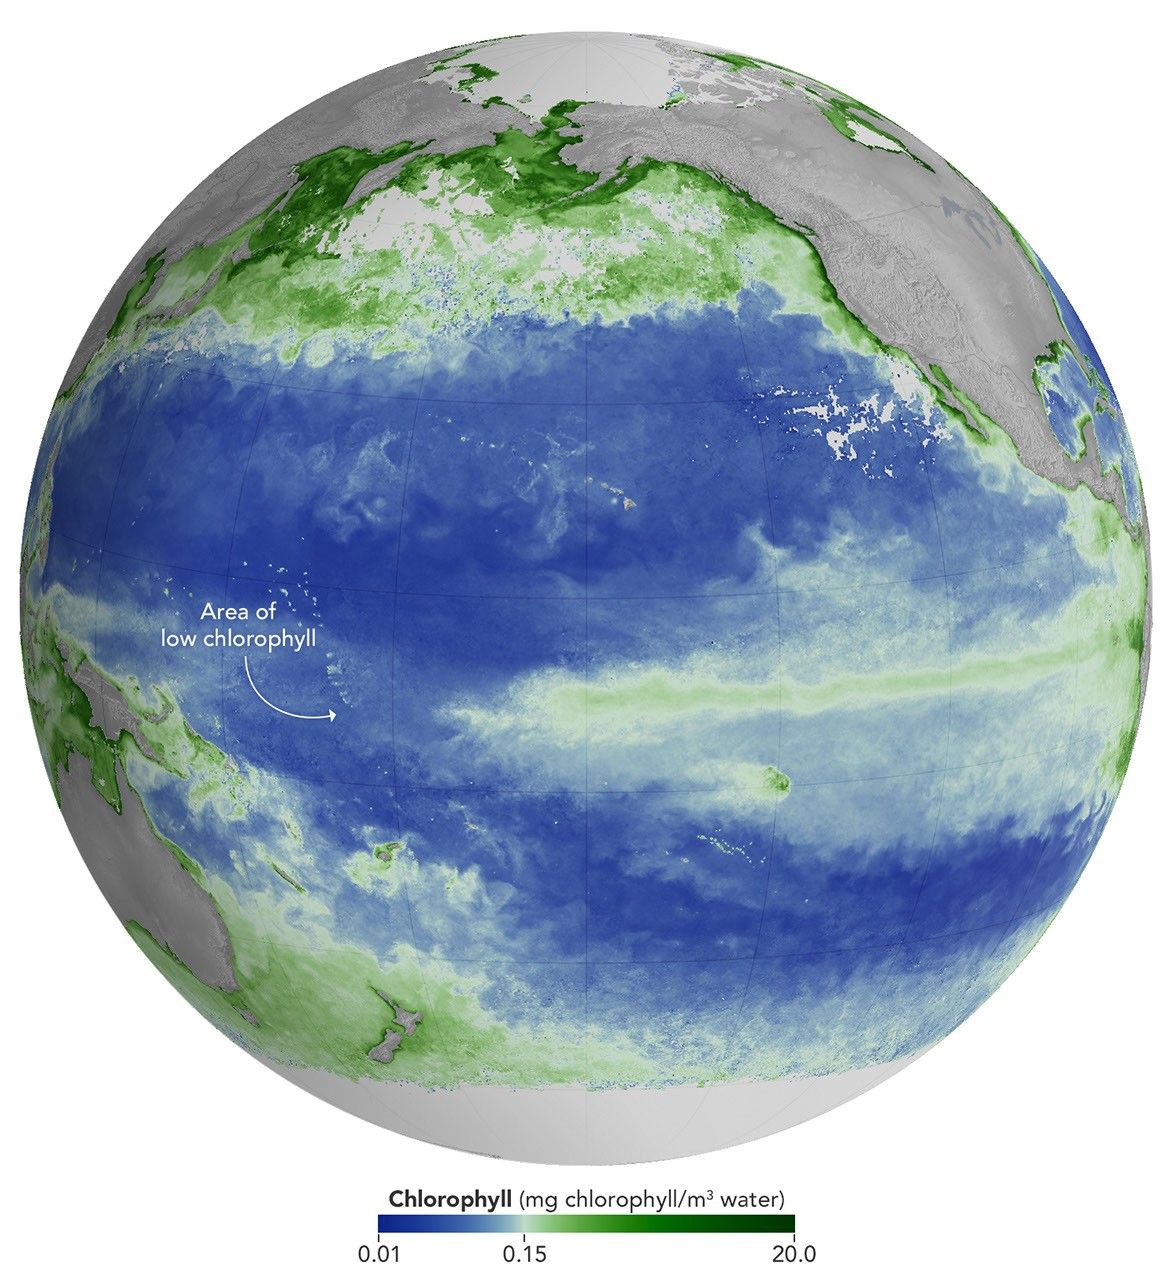
A global map centered on the Pacific Ocean shows a band of green across the equatorial region, indicating the presence of chlorophyll in surface waters.
NASA Earth Observatory/Michala Garrison
A global map centered on the Pacific Ocean shows a narrow band of green in the eastern equatorial region, indicating the presence of chlorophyll in surface waters. The central equatorial Pacific appears blue, meaning chlorophyll concentrations are low.
NASA Earth Observatory/Michala Garrison

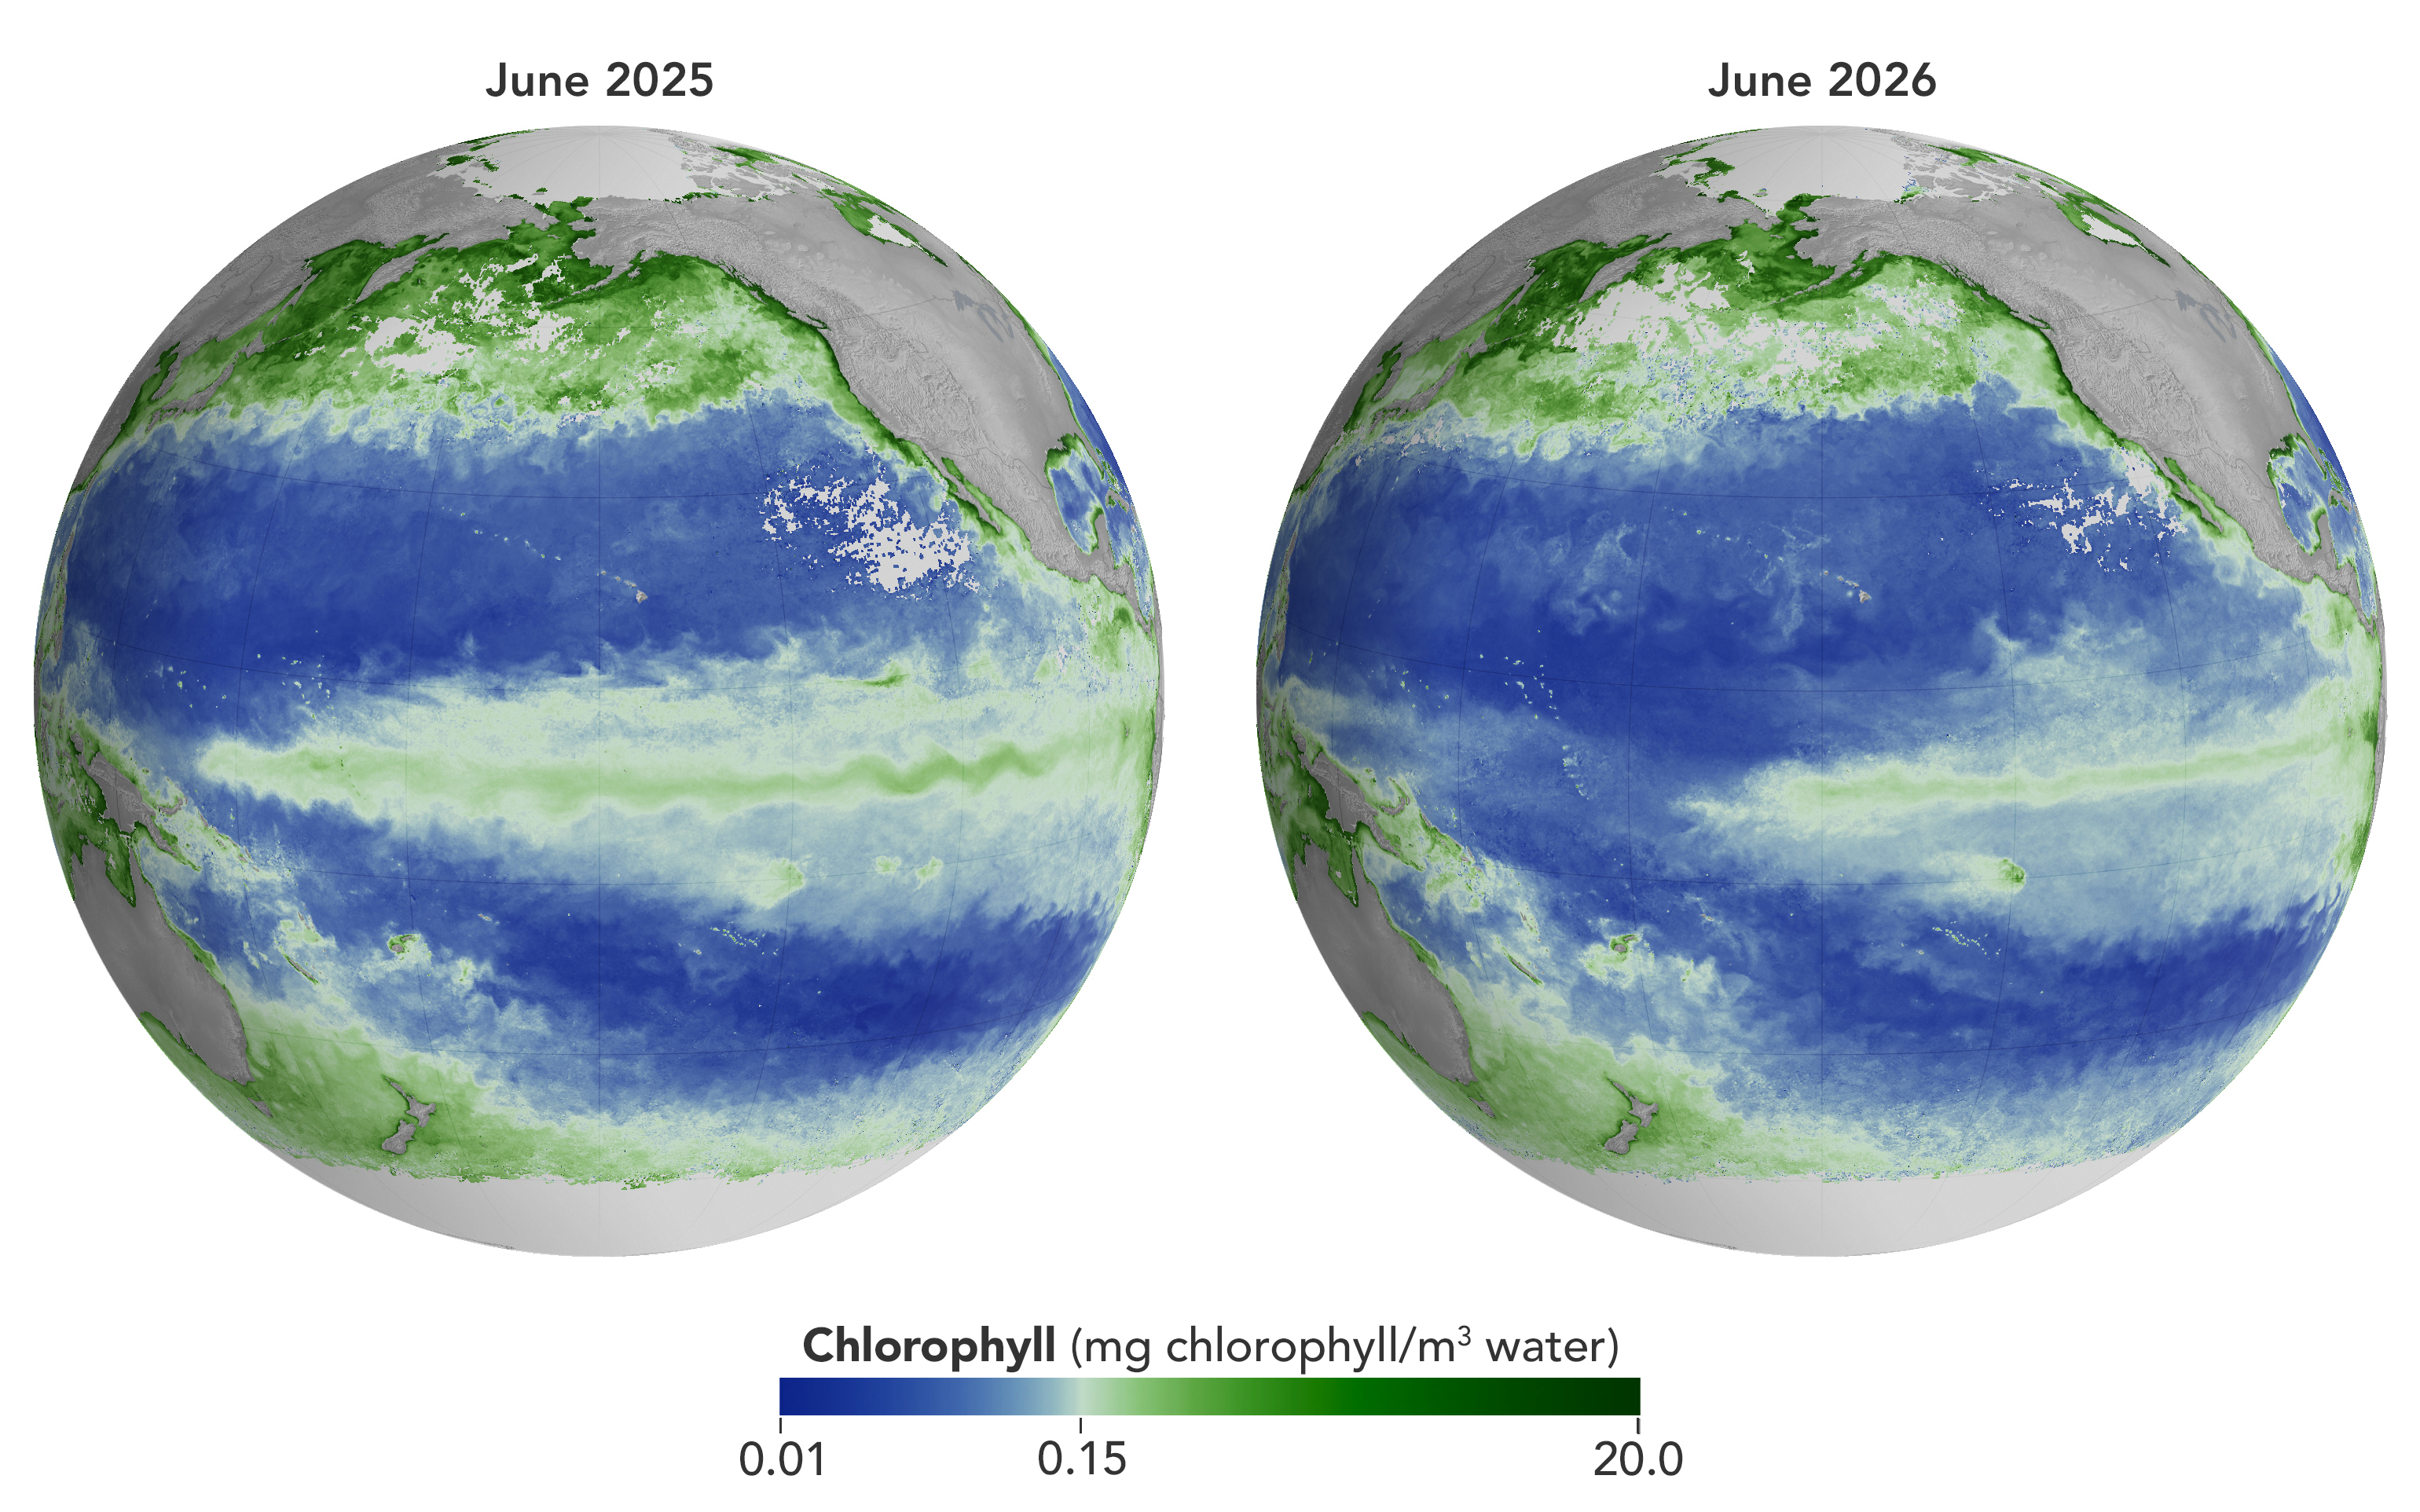
june 2025

june 2026


Concentrations of chlorophyll in the equatorial Pacific deviate from normal during El Niño events. These maps depict monthly average chlorophyll concentrations for June 2025 (left), under neutral conditions, and June 2026 (right), as El Niño was strengthening. Data come from the OCI (Ocean Color Instrument) on NASA’s PACE (Plankton, Aerosol, Cloud, ocean Ecosystem) satellite and are based on measurements of green and blue light from the ocean reflected back to the sensor. NASA Earth Observatory images by Michala Garrison.

As of June 2026, El Niño has officially arrived. This naturally recurring phenomenon is characterized by warmer-than-normal water temperatures in parts of the equatorial Pacific along with changes to atmospheric and oceanic circulation patterns. Its regional effects range from desert floods to delayed monsoons to shifts in where tropical cyclones are more likely to form.

NOAA’s Climate Prediction Center expects the current El Niño to continue to strengthen through the end of 2026, with a 97 percent chance of lasting through early Northern Hemisphere spring 2027. Even during El Niño’s early stages, satellites have observed characteristic changes along the equatorial Pacific, such as warmer-than-normal sea surface temperatures and higher-than-normal sea surface height.

Among the first ecological downstream effects are changes to the marine food web. The maps above show chlorophyll-a concentrations—the pigment present in most phytoplankton—as observed by the OCI (Ocean Color Instrument) on NASA’s PACE (Plankton, Aerosol, Cloud, ocean Ecosystem) satellite. In June 2025 (left), conditions were neutral, while in June 2026 (right), El Niño was strengthening.

The most noticeable difference appears in the central Pacific, around the equator due north of New Zealand: chlorophyll concentrations, an indication of phytoplankton abundance, are substantially lower in 2026. This change is expected, said Matthew Kehrli and Graham Trolley, oceanographers in the Ocean Ecology Laboratory at NASA’s Goddard Space Flight Center. That’s because during an El Niño, easterly equatorial trade winds weaken, the warm surface layer of the ocean extends deeper, and the upwelling of cool, nutrient-rich water that typically fuels phytoplankton growth is suppressed.  

As the El Niño progresses, the scientists anticipate the differences in the central Pacific will become more pronounced. “This may manifest as a greater difference in values across the current region, as a broadening region of reduced surface chlorophyll-a concentration, or both, depending on the behavior of the equatorial trade winds,” they said.

Reductions in phytoplankton have ripple effects through the marine food web, including in coastal regions. Less food is available for zooplankton, as well as for fish, seabirds, and marine mammals. Peru’s anchovy fisheries have seen profound declines in catch during past El Niños, driven similarly by warmer surface waters, reduced upwelling, and lower phytoplankton abundance. In 2026, Peru’s Ministry of Production repeatedly suspended the fishery to safeguard the country’s main fishing resource. Pelicans have been seen venturing into Peruvian ports and urban areas in search of food.

Although the disruptions to marine life can be severe, a post-El Niño “chlorophyll rebound,” with higher-than-normal concentrations in the equatorial Pacific, can occur. Research suggests that higher iron concentrations delivered in ocean currents, as well as dust arriving from drier land in parts of Central and South America, help fuel the resurgence—a rebound that doesn’t require a follow-on La Niña. La Niña, which often follows El Niño events, can also produce elevated chlorophyll concentrations. A strong La Niña in 1998–1999 set off a large phytoplankton bloom in the eastern Pacific and a dramatic increase in fish populations.

Scientists have new tools available for studying this sort of variability. The PACE mission launched in February 2024, making this the first complete El Niño event for which the satellite will gather global, near-daily hyperspectral measurements. “The scientific community will be able to observe the 2026 El Niño with data across more wavelengths of light than ever before,” Kehrli and Trolley said.

To better understand effects on life in the ocean, researchers hope to use PACE data to gauge the responses of specific phytoplankton communities to El Niño. And the possibilities extend beyond the marine realm, the scientists note. PACE’s sensors can measure plant pigment composition on land and clouds and aerosols in the atmosphere, all of which are influenced by El Niño.

NASA Earth Observatory images by Michala Garrison, using PACE data from the NASA Ocean Biology Distributed Active Archive Center OB.DAAC and processed by Matthew Kehrli. Story by Lindsey Doermann.
Downloads

A global map centered on the Pacific Ocean shows a band of green across the equatorial region, indicating the presence of chlorophyll in surface waters.

June 2025

JPEG (1.40 MB)

A global map centered on the Pacific Ocean shows a narrow band of green in the eastern equatorial region, indicating the presence of chlorophyll in surface waters. The central equatorial Pacific appears blue, meaning chlorophyll concentrations are low.

June 2026

JPEG (1.37 MB)

A global map centered on the Pacific Ocean shows a narrow band of green in the eastern equatorial region, indicating the presence of chlorophyll in surface waters. The central equatorial Pacific appears blue, meaning chlorophyll concentrations are low.

June 2025 + June 2026

JPEG (2.85 MB)

References & Resources

You may also be interested in:

Stay up-to-date with the latest content from NASA as we explore the universe and discover more about our home planet.
El Niño Is Underway

4 min read

Satellite observations of sea surface height indicated that the 2026 event continued to strengthen in early June.
Article

Color Off the Mid-Atlantic Coast

4 min read

Something is brewing in shallow waters offshore of Delaware, New Jersey, Maryland, and Virginia.
Article

Sizing Up the Sargassum Belt

6 min read

Seaweed composing the Great Atlantic Sargassum Belt hit near-record levels in June 2026, with the Caribbean Sea and Gulf of…

Article
  •  

El Niño Is Underway

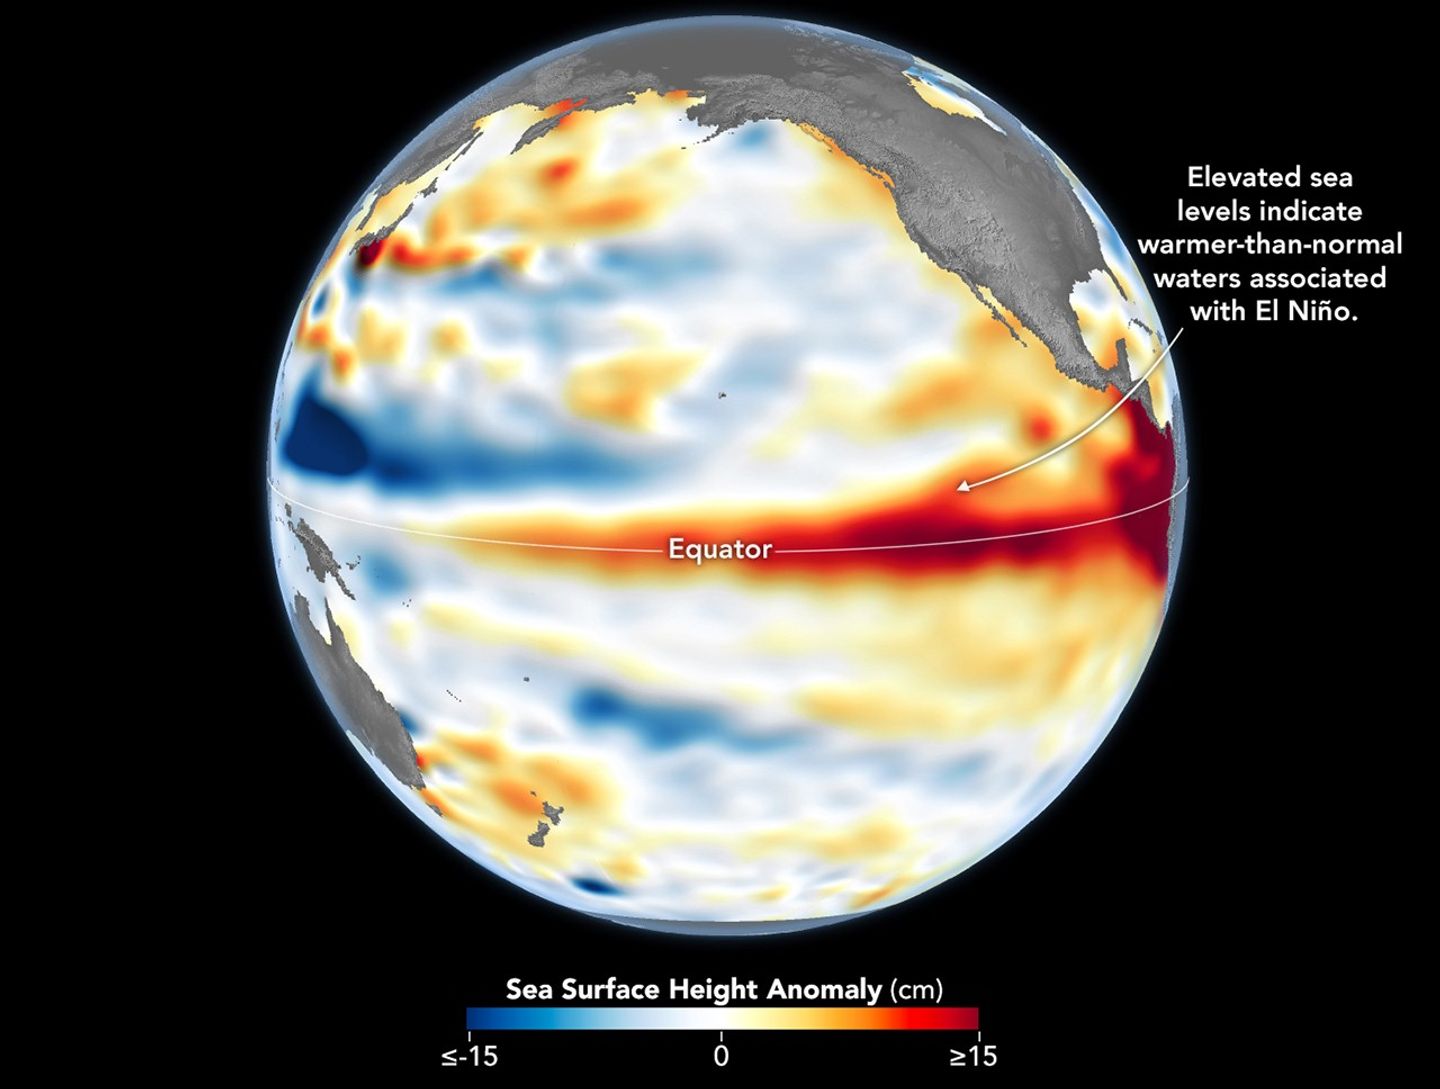
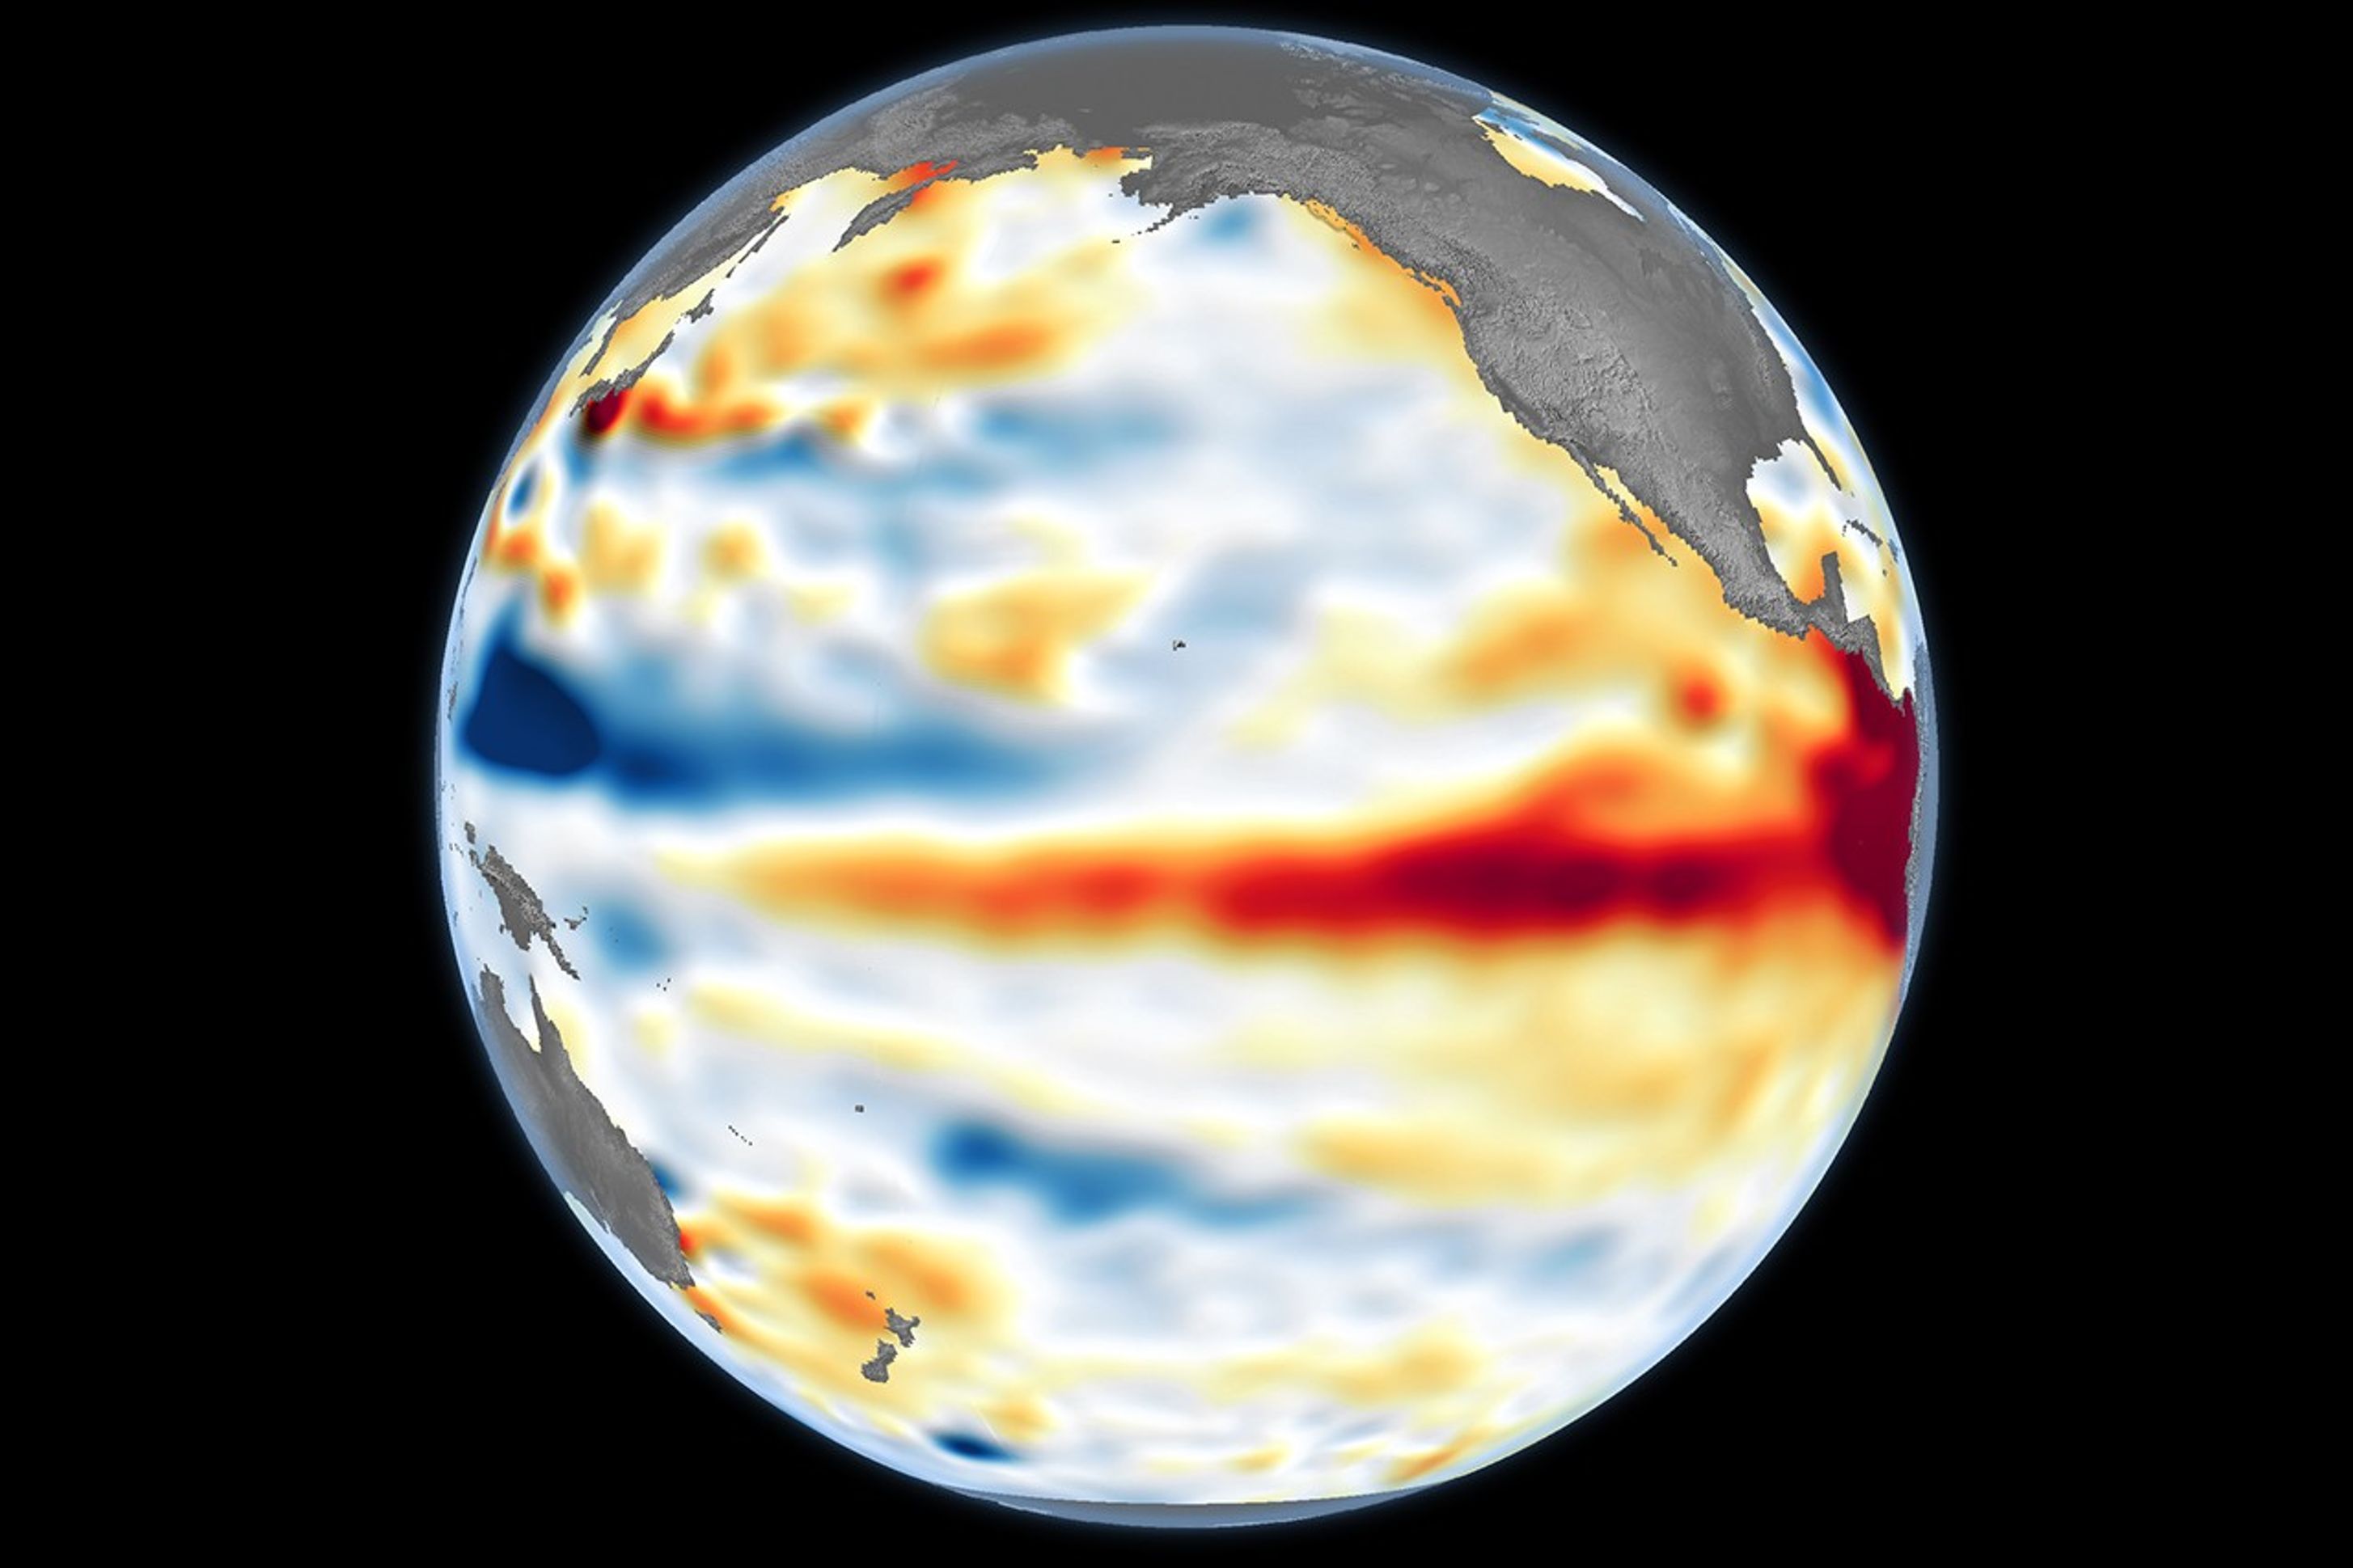
A global map centered on the Pacific Ocean shows a band of red, higher-than-normal water levels across the central and eastern equatorial Pacific and a broad patch off the coast of South America.
Higher-than-normal sea surfaces (red) are visible in the central and eastern Pacific on June 8, 2026, a few days before El Niño was declared. Data for the map were acquired by the Sentinel-6 Michael Freilich satellite and processed by scientists at NASA’s Jet Propulsion Laboratory (JPL).
NASA Earth Observatory/Lauren Dauphin

El Niño, characterized by warmer-than-normal water temperatures in parts of the equatorial Pacific, made its return in June 2026. Observations of sea surface height from the Sentinel-6 Michael Freilich satellite that month indicated that the 2026 event was continuing to strengthen.  

The natural, recurring phenomenon can have widespread effects, typically bringing wetter conditions to the U.S. Southwest and drought to countries in the western Pacific, such as Indonesia and Australia. NOAA declared an El Niño on June 11, after sea surface temperatures in the central and eastern equatorial Pacific measured at least 0.5 degrees Celsius above average for several consecutive months.

Meanwhile, NASA scientists have been observing a complementary sign of El Niño: areas of elevated sea surface height. When ocean water warms, it expands in volume and causes the sea surface to rise—making the water’s height a reliable indicator of ocean temperatures. Warmer-than-normal temperatures, hence higher sea surface heights, in parts of the equatorial Pacific Ocean are associated with El Niño.

The map above depicts sea surface height anomalies across the central and eastern Pacific Ocean as observed on June 8, 2026. Shades of red indicate sea levels that were higher than average. Normal sea level conditions appear white, and lower areas are blue.  

Data for the map were acquired by the Sentinel-6 Michael Freilich satellite—launched in 2020 by NASA and led by ESA (European Space Agency)—and processed by scientists at NASA’s Jet Propulsion Laboratory (JPL). Note that signals related to seasonal cycles and long-term trends have been removed to highlight sea level anomalies associated with El Niño and other short-term natural phenomena.

Earlier in spring 2026, the satellite started to detect precursor signs of El Niño as swells of warm water hundreds of miles wide, known as Kelvin waves, moved from the western Pacific to the eastern Pacific. That happens when trade winds in the western equatorial Pacific weaken and then temporarily reverse to blow from the west. Warm water piles up in the east, deepening the warm surface layer, lowering the thermocline, and suppressing the upwelling that usually keeps waters along the Pacific coasts of the Americas cooler.

This buildup of heat beneath the water’s surface is what sea surface height observations capture. It goes beyond surface temperature measurements to indicate how much heat is stored in the subsurface. That’s important because a shallow warm layer might not have much impact on climate and weather, while a large reservoir of heat below the surface can matter more.

According to JPL sea level researcher Severine Fournier, deputy project scientist for Sentinel-6 Michael Freilich, conditions in the western Pacific on June 8 looked similar to those from the same time in 1997, a year when an exceptionally strong El Niño emerged. Warm conditions in the eastern Pacific in 2026 have lagged behind, however, with fewer Kelvin waves built up by the same date.

Still, more warm Kelvin waves appeared to be approaching the eastern Pacific, meaning El Niño was still strengthening. Whether it catches up to 1997 depends on ocean activity in the coming weeks. “For now, it looks like it’s going to be a big one—more so than I would have said last week—but we still need more observations to know what’s going to happen.”

NASA Earth Observatory image by Lauren Dauphin, using modified Copernicus Sentinel data (2023) processed by the European Space Agency and further processed by Josh Willis, Severin Fournier, and Kevin Marlis/NASA/JPL-Caltech. Story by Kathryn Hansen.

Downloads

A global map centered on the Pacific Ocean shows a band of red, higher-than-normal water levels across the central and eastern equatorial Pacific and a broad patch off the coast of South America.

June 8, 2026

JPEG (1.19 MB)

References & Resources

You may also be interested in:

Stay up-to-date with the latest content from NASA as we explore the universe and discover more about our home planet.

Barents Sea Tied to Low Arctic Sea Ice
4 min read

Patches of open water in the region contributed to low sea ice extent across the Arctic in March 2026, which…

Article
New Eruption in the Bismarck Sea
5 min read

Satellite imagery shows a surge of new volcanic activity in the ocean near Papua New Guinea.

Article
Color Off the Mid-Atlantic Coast
4 min read

Something is brewing in shallow waters offshore of Delaware, New Jersey, Maryland, and Virginia.

Article

The post El Niño Is Underway appeared first on NASA Science.

  •  

El Niño Is Underway

A global map centered on the Pacific Ocean shows a band of red, higher-than-normal water levels across the central and eastern equatorial Pacific and a broad patch off the coast of South America.
Higher-than-normal sea surfaces (red) are visible in the central and eastern Pacific on June 8, 2026, a few days before El Niño was declared. Data for the map were acquired by the Sentinel-6 Michael Freilich satellite and processed by scientists at NASA’s Jet Propulsion Laboratory (JPL).
NASA Earth Observatory/Lauren Dauphin

El Niño, characterized by warmer-than-normal water temperatures in parts of the equatorial Pacific, made its return in June 2026. Observations of sea surface height from the Sentinel-6 Michael Freilich satellite that month indicated that the 2026 event was continuing to strengthen.  

The natural, recurring phenomenon can have widespread effects, typically bringing wetter conditions to the U.S. Southwest and drought to countries in the western Pacific, such as Indonesia and Australia. NOAA declared an El Niño on June 11, after sea surface temperatures in the central and eastern equatorial Pacific measured at least 0.5 degrees Celsius above average for several consecutive months.

Meanwhile, NASA scientists have been observing a complementary sign of El Niño: areas of elevated sea surface height. When ocean water warms, it expands in volume and causes the sea surface to rise—making the water’s height a reliable indicator of ocean temperatures. Warmer-than-normal temperatures, hence higher sea surface heights, in parts of the equatorial Pacific Ocean are associated with El Niño.

The map above depicts sea surface height anomalies across the central and eastern Pacific Ocean as observed on June 8, 2026. Shades of red indicate sea levels that were higher than average. Normal sea level conditions appear white, and lower areas are blue.  

Data for the map were acquired by the Sentinel-6 Michael Freilich satellite—launched in 2020 by NASA and led by ESA (European Space Agency)—and processed by scientists at NASA’s Jet Propulsion Laboratory (JPL). Note that signals related to seasonal cycles and long-term trends have been removed to highlight sea level anomalies associated with El Niño and other short-term natural phenomena.

Earlier in spring 2026, the satellite started to detect precursor signs of El Niño as swells of warm water hundreds of miles wide, known as Kelvin waves, moved from the western Pacific to the eastern Pacific. That happens when trade winds in the western equatorial Pacific weaken and then temporarily reverse to blow from the west. Warm water piles up in the east, deepening the warm surface layer, lowering the thermocline, and suppressing the upwelling that usually keeps waters along the Pacific coasts of the Americas cooler.

This buildup of heat beneath the water’s surface is what sea surface height observations capture. It goes beyond surface temperature measurements to indicate how much heat is stored in the subsurface. That’s important because a shallow warm layer might not have much impact on climate and weather, while a large reservoir of heat below the surface can matter more.

According to JPL sea level researcher Severine Fournier, deputy project scientist for Sentinel-6 Michael Freilich, conditions in the western Pacific on June 8 looked similar to those from the same time in 1997, a year when an exceptionally strong El Niño emerged. Warm conditions in the eastern Pacific in 2026 have lagged behind, however, with fewer Kelvin waves built up by the same date.

Still, more warm Kelvin waves appeared to be approaching the eastern Pacific, meaning El Niño was still strengthening. Whether it catches up to 1997 depends on ocean activity in the coming weeks. “For now, it looks like it’s going to be a big one—more so than I would have said last week—but we still need more observations to know what’s going to happen.”

NASA Earth Observatory image by Lauren Dauphin, using modified Copernicus Sentinel data (2023) processed by the European Space Agency and further processed by Josh Willis, Severin Fournier, and Kevin Marlis/NASA/JPL-Caltech. Story by Kathryn Hansen.

Downloads

A global map centered on the Pacific Ocean shows a band of red, higher-than-normal water levels across the central and eastern equatorial Pacific and a broad patch off the coast of South America.

June 8, 2026

JPEG (1.19 MB)

References & Resources

You may also be interested in:

Stay up-to-date with the latest content from NASA as we explore the universe and discover more about our home planet.

Barents Sea Tied to Low Arctic Sea Ice
4 min read

Patches of open water in the region contributed to low sea ice extent across the Arctic in March 2026, which…

Article
New Eruption in the Bismarck Sea
5 min read

Satellite imagery shows a surge of new volcanic activity in the ocean near Papua New Guinea.

Article
Color Off the Mid-Atlantic Coast
4 min read

Something is brewing in shallow waters offshore of Delaware, New Jersey, Maryland, and Virginia.

Article
  •  
❌