❌

Reading view

Dust Deal with It

zodiacal light

Editor’s Note: Astrobites is a graduate-student-run organization that digests astrophysical literature for undergraduate students. As part of the partnership between the AAS and astrobites, we occasionally repost astrobites content here at AAS Nova. We hope you enjoy this post from astrobites; the original can be viewed at astrobites.org.

Title: The Exozodi Spectral Effect: Residual Habitable Zone Dust May Bias exoEarth Characterization
Authors: Miles H. Currie et al.
First Author’s Institution: NASA Goddard Space Flight Center
Status: Published in AJ
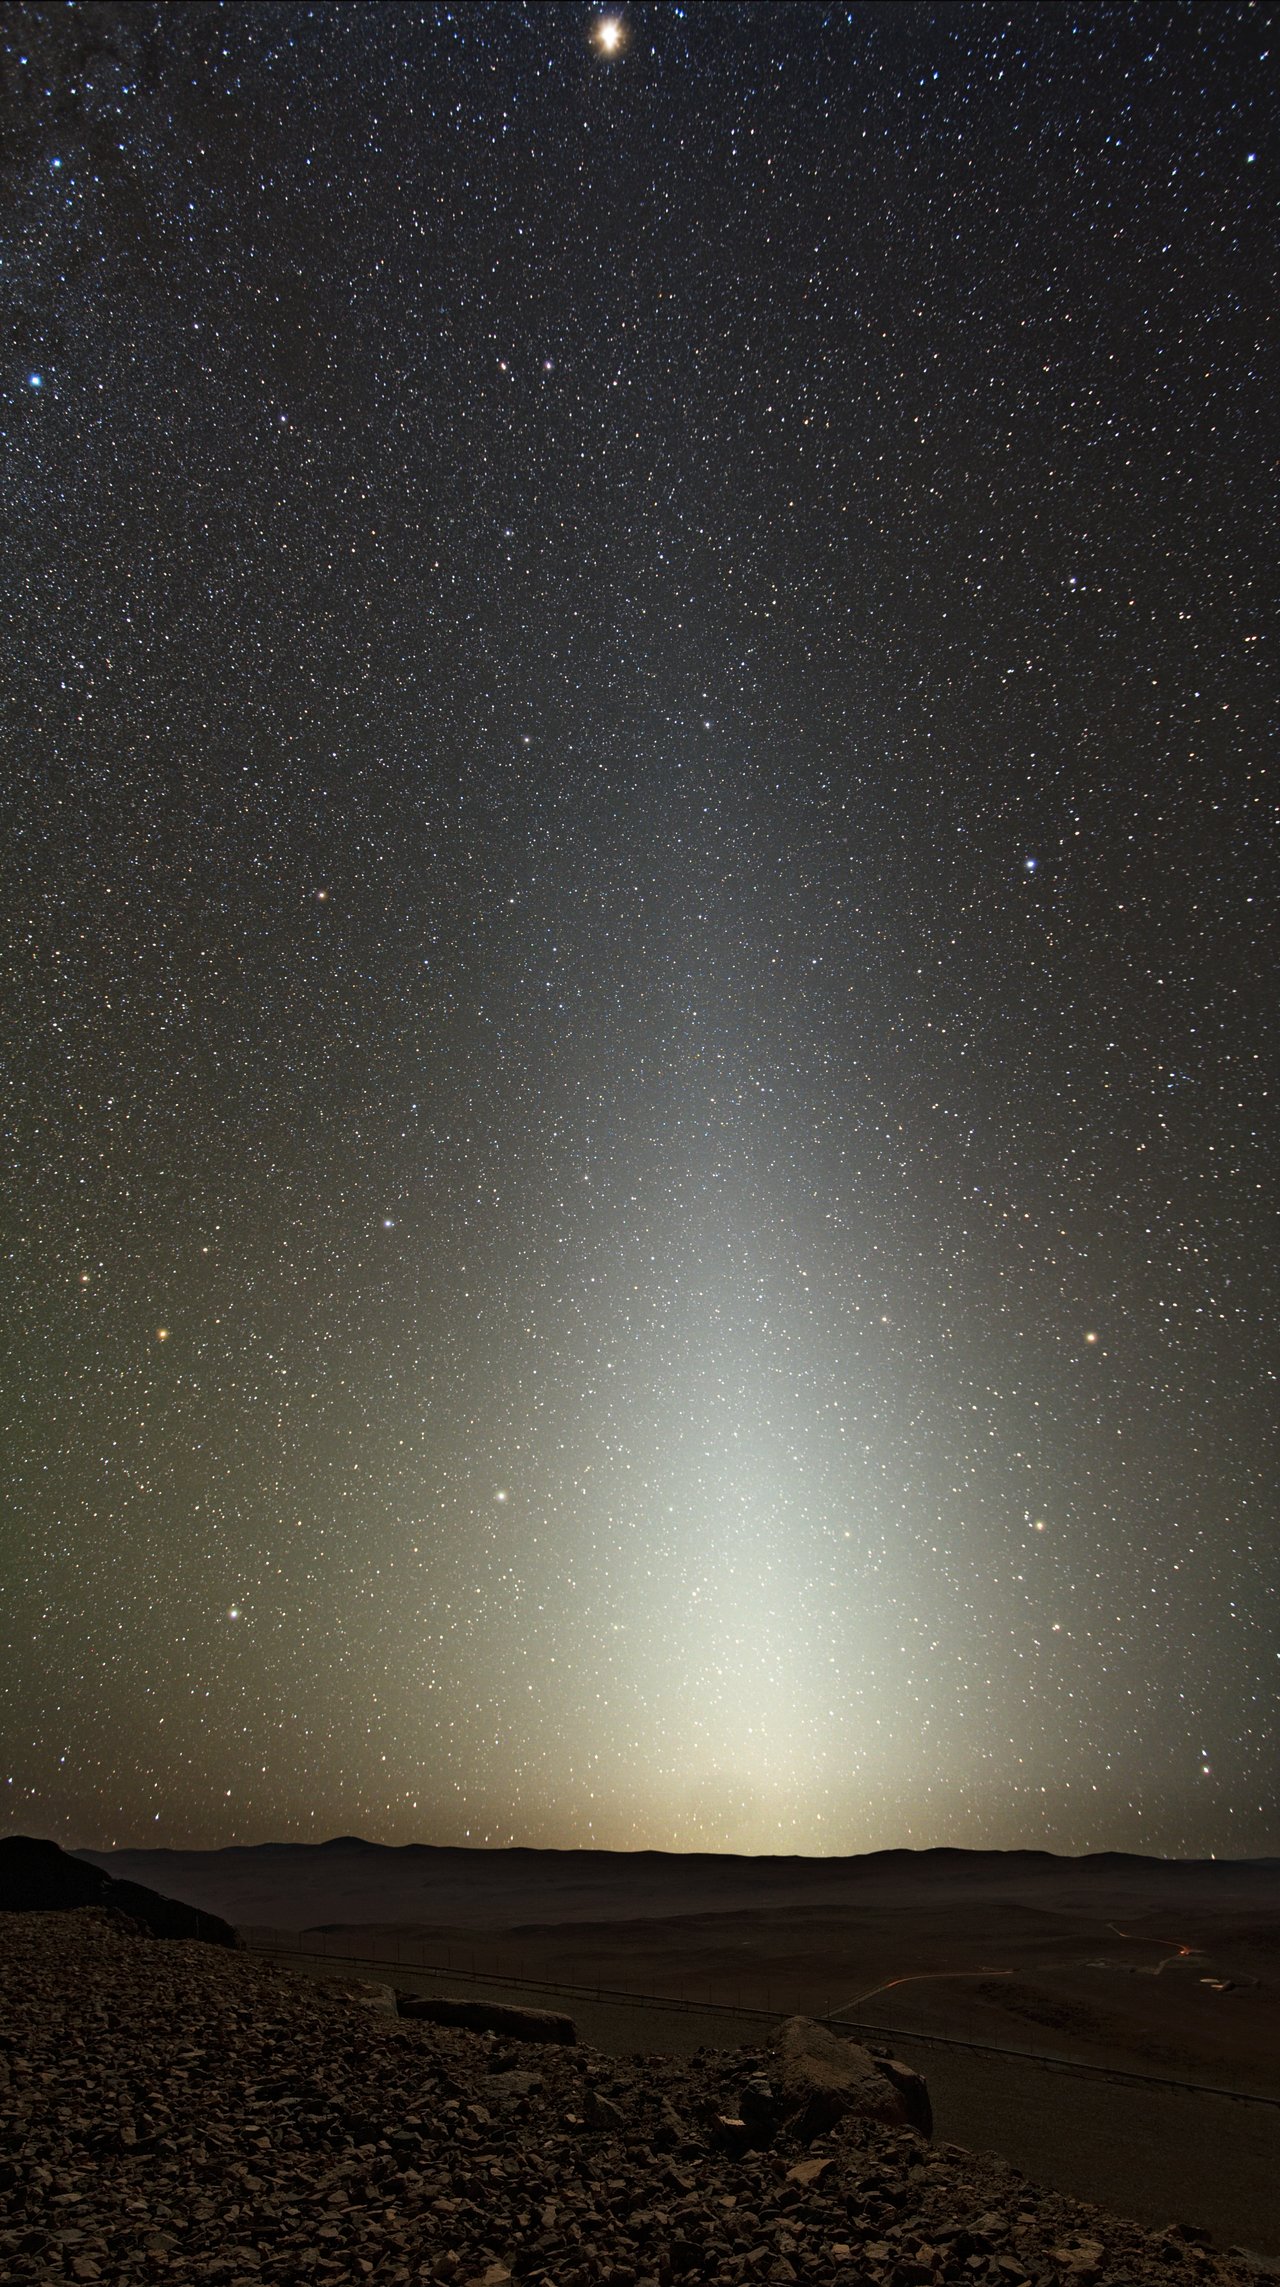
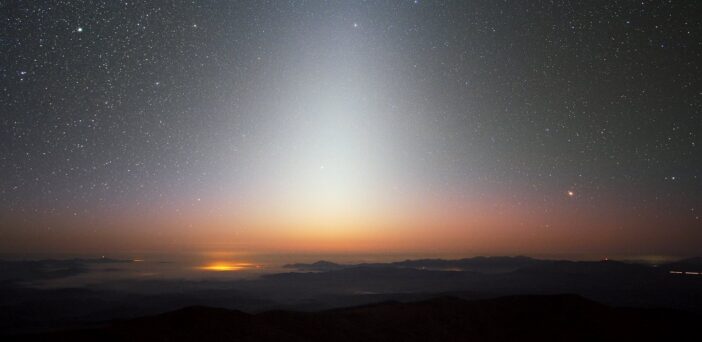
Figure 1: Zodiacal light as seen from Cerro Paranal. [ESO/Y. Beletsky; CC BY 4.0]

We have dust in our solar system — a huge cloud of it that permeates every corner. The dust itself is thought to be the product of many different processes including comet tails, collisions between asteroids, leftover debris from planetary formation, and gravitational collisions induced by planets. It’s small (on the order of 10–100 microns), made up of different silicates, and creates a noticeable triangle-shaped light that can be seen on the darkest nights (see Fig.1). This zodiacal dust is aptly named since the scattered light from the dust grains follows the line of the zodiac, or the ecliptic plane, across the sky. Its structure is quite complicated, with dust rings and trails and clumps near larger planetary bodies. For more information on the solar system’s zodiacal dust, you can read these bites here and here!

This zodiacal dust is not exclusive to the solar system. Other star systems, such as Tau Ceti and Vega, have been found to host similar clouds of interplanetary dust. This means planets imaged in these systems will also have emission from this dust mixed into the light that we observe from the planets. The Habitable Worlds Observatory (HWO) is a future space telescope mission under development by NASA. One of its primary science goals is to directly image 25 Earth-like planets in the habitable zones of nearby stars and look for signs of life (or biosignatures) in these planets’ atmospheres. Exozodiacal dust (aka exozodi) represents the biggest source of astrophysical noise that will need to be subtracted out from HWO observations of exoEarths. The authors of today’s article look at the potential impact of exozodi emission on the spectra of exoEarth atmospheres.
exozodiacal dust models

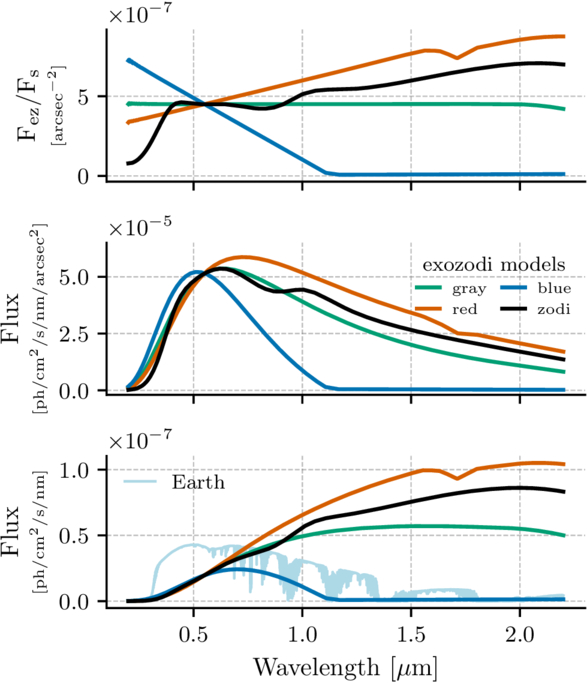
Figure 2: Different models of three “zodis” of dust observed at an inclination of 60 degrees plotted across HWO’s potential wavelength range. The gray scattering model is shown in green, the solar system’s model is shown in black, with the red and blue debris disk models shown in their respective colors. The top panel shows the flux contrast between the dust and the star. The middle panel shows the flux per area. The bottom panel shows the total flux captured with a 7.2-meter HWO with the thin blue line representing the spectrum of an Earth twin 10 parsecs (33 light-years) away for comparison. [Currie et al. 2026]

Show Me the Zodi

The authors first assume four different models of exozodi dust and how the dust’s emission changes with wavelength. The first model assumes a dust cloud that acts as a gray scatterer, meaning the particles scatter all wavelengths of light with no preference, and the second model’s dust acts just like the solar system’s does. However, it’s unknown whether the composition of exozodi will be the same as the solar system’s. Therefore, they adopt two more models of exozodi that act just like debris disks that have different compositions. One model is bluer in color because it is made up of smaller particles that preferentially scatter blue light, and the other model is redder in color because it is made up of bigger dust particles or different chemical compositions. Each of these models over HWO’s wavelength range can be seen in Figure 2. The authors then simulate a modern Earth atmosphere (both clear and 50% cloudy) as well as an Archean Earth atmosphere to understand how different exozodi models will affect observations of different exoplanet atmosphere conditions and compositions.

There’s Dust in My Spectra

In general, the effect that zodiacal dust has on the spectra of Earth-like planets can be broken down into two categories: its effect on the continuum and on the spectral features. The continuum is the object’s light emitted over all wavelengths and uninterrupted by spectral features. Spectral features are absorption and emission lines. These create either a dip or peak in the spectrum where atoms have either absorbed or emitted light at that particular wavelength. Lines at specific wavelengths tell us that a certain material is there, providing a list of possible chemicals that could be present in the planet’s atmosphere. For a brief summary of spectroscopy more generally, see here.

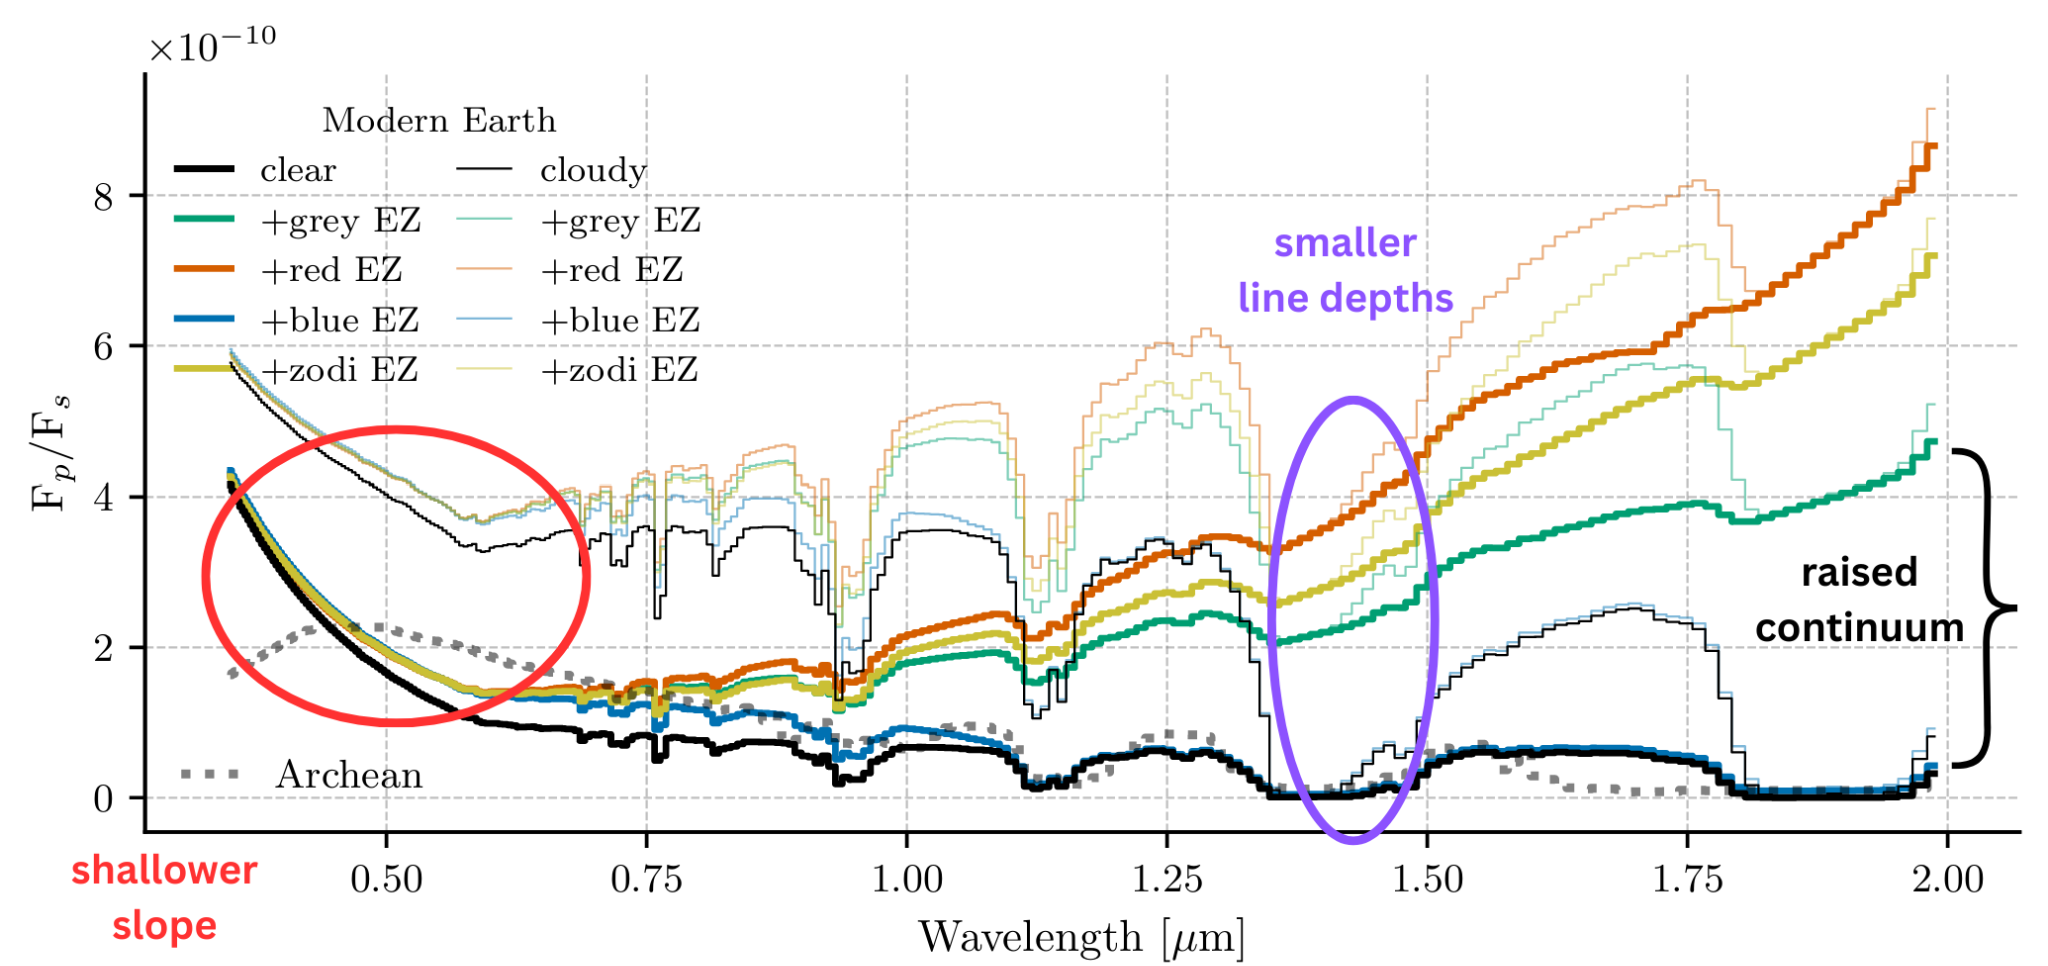
In the case of the continuum, exozodiacal emission raises the continuum, meaning the base flux of the planet is raised and absorption lines become more shallow. These effects can be seen in Figure 3, where the authors’ simulated spectra are plotted with and without zodiacal dust included. Not only is the continuum elevated for all models including zodiacal dust, notice how the dips become shallower at longer wavelengths. Because dust primarily radiates thermally, the red debris disk model nearly smooths out all dips beyond 1.25 microns! Molecules that absorb at these longer wavelengths, such as water or methane, may not be correctly identified with this type of exozodiacal emission.
simulated spectra of Earth-like planets with varying atmospheres and types of exozodiacal dust

Figure 3: Spectra of simulated modern-Earth atmospheres for clear (solid bright lines) and cloudy (solid dimmer lines) scenarios. The Archean Earth atmosphere is plotted in dotted gray. The redder exozodiacal spectrum has an elevated continuum and smoothed spectral features as opposed to the original, zodi-free spectrum plotted in black. [Currie et al. 2026, with annotations by Kaz Gary]

Additionally, the slope of the spectra between 0.25 and 0.75 microns (called the Rayleigh scattering slope) becomes shallower with zodiacal dust emission, which may bias our models toward lower-molecular-weight atmospheres. The slope at these wavelengths is dependent on the size distribution of molecules in the atmosphere, meaning it can tell us how much the average molecule in an atmosphere weighs.

From Figure 3, the effects of zodiacal dust are minimized with a bluer zodiacal dust model. This means systems with “bluer” zodiacal dust may be more optimal for HWO observations, as bluer dust does not scatter as much starlight as gray, solar system–like, or red dust. From their results, the authors recommend that the residual exozodi-to-planet flux ratio (in the V-band wavelengths) be kept to less than 10-2 in order to correctly understand the line depths (identify if a molecule is present or not) and 10-3 in order to accurately retrieve molecular abundances (understand how much of a molecule is present in the atmosphere). Dust is pesky enough here on Earth, but to find life on another planet like ours, we’ll dust have to deal with it.

Original astrobite edited by Anavi Uppal.

About the author, Kaz Gary:

I am a fourth-year PhD candidate at The Ohio State University with a passion for planets. My current work focuses on modeling exoplanet observations for the Habitable Worlds Observatory and understanding planetary atmospheres. Outside of research, I help develop planetarium shows and love all forms of science communication. In my free time, I enjoy playing tabletop RPGs, painting, watching terrible reality TV, and hanging out with my pet hedgehog.

The post Dust Deal with It appeared first on AAS Nova.

  •  

Thermal Electrons Can Explain the Mysterious Radio Behavior of a Tidal Disruption Event

illustration of a tidal disruption event

Editor’s Note: Astrobites is a graduate-student-run organization that digests astrophysical literature for undergraduate students. As part of the partnership between the AAS and astrobites, we occasionally repost astrobites content here at AAS Nova. We hope you enjoy this post from astrobites; the original can be viewed at astrobites.org.

Title: Thermal Electrons in the Radio Afterglow of Relativistic Tidal Disruption Event ZTF22aaajecp/AT 2022cmc
Authors: Lauren Rhodes et al.
First Author’s Institution: McGill University
Status: Published in ApJ

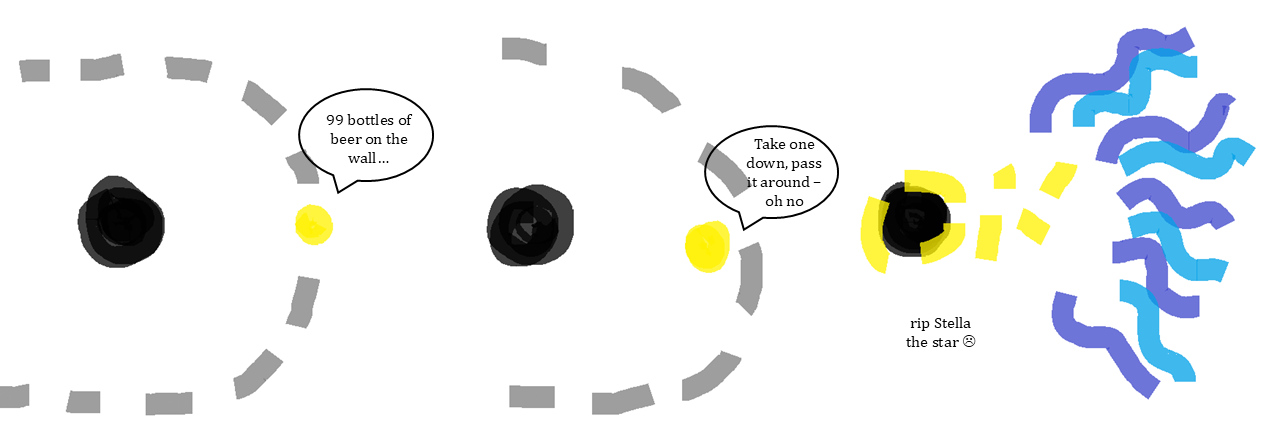
Tidal disruption events (TDEs, see Figure 1), which occur when a star gets a little too close to a supermassive black hole (SMBH) and gets ripped apart, are a hot topic across the electromagnetic spectrum. During a TDE, the star can no longer hold itself together under the gravitational pull of the SMBH. Some bits of the star end up accreting onto the black hole, which can launch a temporary outflow, or, in especially dramatic cases, a relativistic jet.

cartoon of a star orbiting a black hole, getting to close, and being ripped apart

Figure 1: Timeline of events leading to a tidal disruption event. [Chloe Klare]

Aside from being cool transients (as far as spectacular stellar deaths go, they are rivaled only by the supernova), TDEs are valuable to study for a variety of reasons. They likely play a role in galaxy evolution, SMBH growth, and even the life cycles of active galactic nuclei (AGN, in which material is constantly swirling onto the SMBH). Not to mention, they are a great tool for eyeballing the mass of the SMBH responsible for the TDE; if the black hole is any bigger than about 1 billion times the mass of the Sun, its event horizon — the point at which not even light can escape its gravity — extends too far, and a star will disappear across the event horizon before it ever gets ripped apart.

How to Spot a TDE

Usually, TDEs are discovered in the X-ray (after all, not many transients are powerful enough to generate an X-ray flare) or in the optical (thanks to high-cadence, wide-field surveys like the Zwicky Transient Facility and the Legacy Survey of Space and Time). However, radio is a particularly useful regime for TDE searches, especially in dusty host galaxies where we cannot see the optical TDE signatures at all; while dust obscures optical light, the radio is unaffected! There is just one catch: how exactly can we identify a TDE based on only its radio emission?

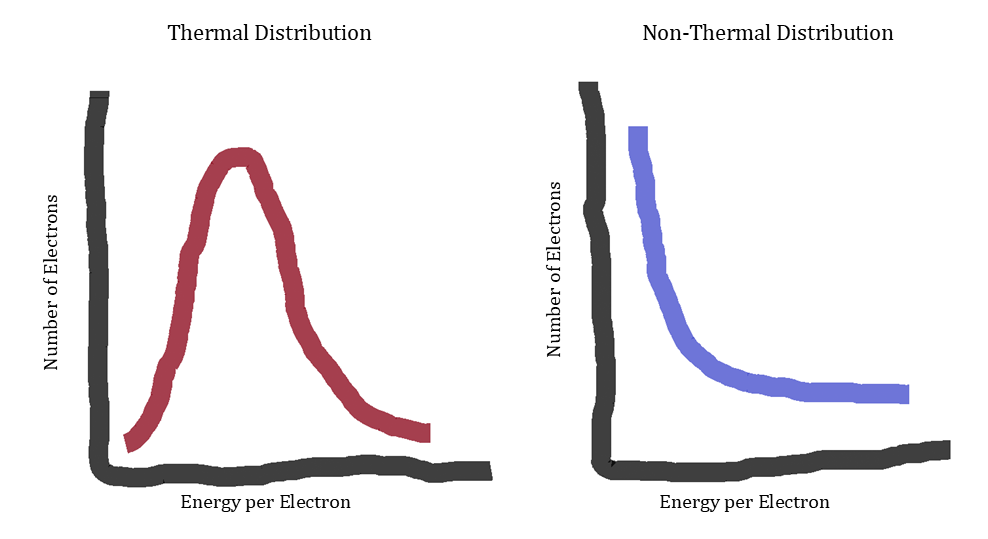
The radio light in a TDE is generated via synchrotron radiation — which is caused by fast moving electrons in strong magnetic fields — and originates in jets or shocks. Unfortunately, this is also the case in AGN, the primary extragalactic source of variable radio emission, and it can be difficult to distinguish between the two. Additionally, the amount of light we see from synchrotron radiation at a given frequency depends on how energy is distributed among the electrons in the source, which is unknown. Perhaps the simplest case — or at least the one you’ll learn about first in your undergraduate statistical mechanics course — is that the energy is distributed among the electrons thermally (left panel in Figure 2). However, most radio transients associated with black holes are assumed to have non-thermal electron energy distributions, usually where there are exponentially many more low-energy electrons than high-energy electrons (right panel in Figure 2).

cartoon showing thermally distributed and non-thermally distributed electrons

Figure 2: Energy can be distributed among the electrons in a source either thermally (left panel), where most electrons have a medium amount of energy, or non-thermally (right panel), where most electrons have a small amount of energy. Often, extragalactic radio transients are assumed to originate from non-thermal electrons, but today’s article argues why we shouldn’t ignore thermal electrons. [Chloe Klare]

As a further challenge, very few TDEs have had extensive follow-up observations in the radio, so we don’t have strong constraints on how most TDEs should behave, especially in the long term. Luckily, some astronomers are working to change this.

This includes today’s authors, who have focused on one particular TDE, ZTF22aaajecp/AT2022cmc (I’m sure everyone mispronounces her name), or 2022cmc for short. 2022cmc is a special TDE: it is one of only five TDEs suspected to have launched a relativistic jet, and it has the highest redshift (z ~ 1.2) of the five. It was observed first in the optical and then in the X-ray and radio. The X-ray emission was highly variable for 400 days post-TDE, and then disappeared, and the first 100 days of radio emission indicated there was a relativistic outflow. At the time, it was concluded that the jet shut off and the X-ray emission ceased. However, the story doesn’t end there; the authors of today’s article continued to observe 2022cmc in the radio for an additional 900 days at frequencies spanning about 1–100 GHz.

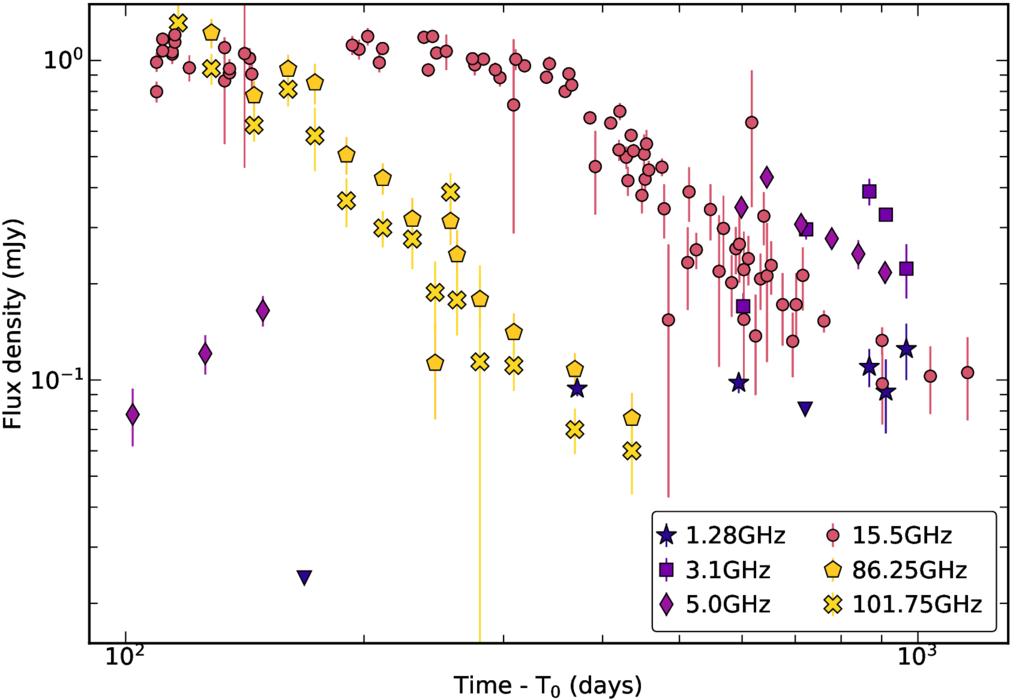
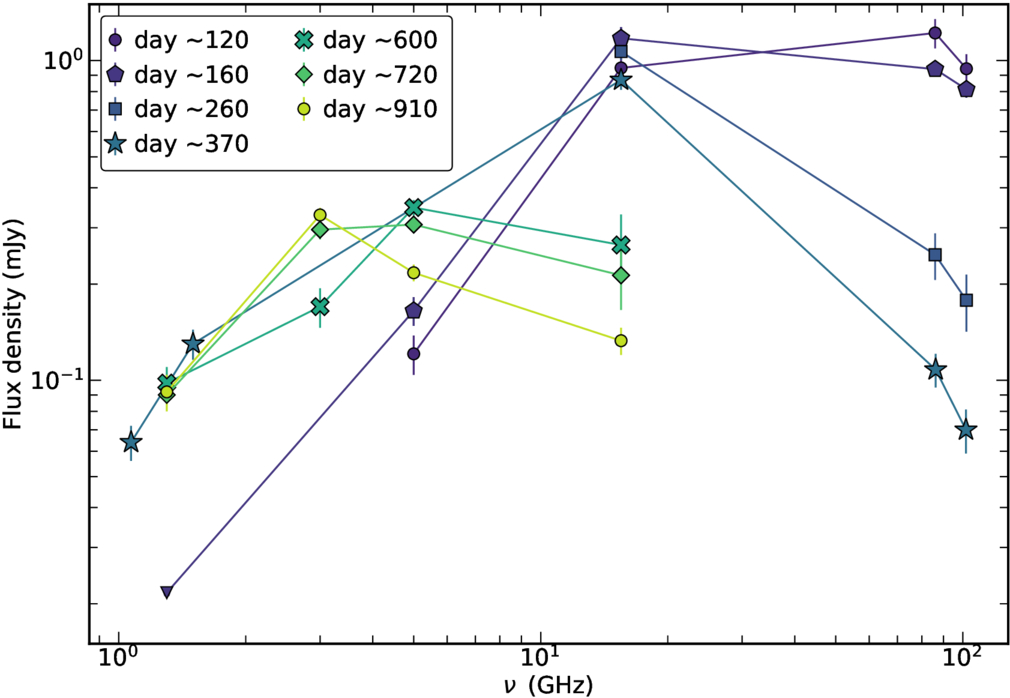
Our authors had two key observing strategies: wide frequency coverage and long duration. Measuring the change in brightness with observing frequency, or the spectral energy distribution (SED), is important for determining which processes are responsible for the radio emission, since thermal electrons and non-thermal electrons will produce different SEDs. On the other hand, measuring the change in brightness over time, or the light curve, is important for determining what is happening at the source, such as whether there is a jet and, if so, how long it lasts. Here, our authors combine light curves at six different frequencies (Figure 3) and SEDs at nine different epochs (Figure 4) to investigate both.

Plot of flux density over time

Figure 3: Light curves spanning six frequencies and 900 days obtained by today’s authors. [Rhodes et al. 2025]

Plot of flux density as a function of frequency

Figure 4: Nine epochs of radio SEDs, which show the peak moving to lower frequencies over time. [Rhodes et al. 2025]

The Findings

Our authors find a couple of interesting results. First, in the time domain, they find the highest-frequency light curves fade with time, while the lower-frequency light curves increase initially, hit peaks at different times (after 300 days at 15.5 GHz, and after 800 days at 1.3 GHz), and then begin to decay. The spectral evolution is even more intriguing; the SED is always peaked, and the peak shifts to lower frequencies over time, which is typical for an expanding emission region. At frequencies below the peak, the SED doesn’t change much. However, the high-frequency side of the SED shows confusing behavior: early on, it has a very steep slope (the amount of light drops off sharply at higher frequencies), but it eventually flattens.

Investigations Begin

Next, our authors consider three possibilities to explain these observations. They first consider synchrotron radiation from only non-thermal electrons in a relativistic jet (Figure 5), which is the canonical model for a gamma-ray burst radio afterglow. Initially, the jet is so fast that all its radio light is relativistically beamed in one direction (like a flashlight), and we can only see the jet if it’s pointed directly at us. Eventually, the jet slows down enough that it is no longer beamed, and light is emitted in all directions (like a light bulb). At this point, we see the light fade over time, which is exactly what happened in the high-frequency light curves. However, there is one glaring problem: this model cannot possibly explain the observed long-lasting steep SED at high frequencies. So, our authors discard this theory.

cartoon showing the jets of a black hole with and without relativistic beaming

Figure 5: The left image shows what a black hole–generated jet looks like in the rest frame of the jet itself. As long as the jet isn’t moving too fast, this is what we see too. However, if the material in the jet is moving near the speed of light, we observe a relativistically beamed jet (right image). [Chloe Klare]

Instead, our authors consider a jetted outflow that has non-thermal and thermal electrons both independently generating synchrotron emission1, giving us the superposition of two radio spectra. This model also doesn’t fit the data well. The peak of the SED moves too slowly, a very dense local environment is required, and, once again, the authors cannot reconcile that steep high-frequency SED.

Lastly, our authors keep the thermal/non-thermal electrons combo and ditch the jet entirely, modeling a spherical outflow. Excitingly, this model best fits the observations, and, most importantly, can explain the mysterious high-frequency behavior. Initially, most of the radio emission originates in the thermal electron population, which produces more light at higher frequencies. As the outflow expands, the non-thermal electrons begin to dominate, and the SED transforms into the classic non-thermal synchrotron shape.

Next Steps

Ideally, our authors want to compare 2022cmc to other TDEs, but few TDEs have such thorough follow-up observations. They speculate that thermal electrons were important in the radio evolution of one of the few such TDEs, Swift J1644, and recommend we revisit its emission models. More broadly, they recommend two future priorities: first, we need extensive radio observations for larger samples of TDEs, especially around 100 GHz, where the thermal electrons contribute most to the SED; secondly, we should stop neglecting thermal electrons not just in TDE models, but in models of any black hole jets, including gamma-ray bursts and X-ray binaries. While this work addresses only one event, one thing is clear. For theorists and observers alike, there is a myriad of exciting work to be done, so it’s no wonder TDEs have garnered so much attention lately.

  1. A convenient property of extragalactic synchrotron sources is that all their electrons radiate independently of one another, even if they are part of the same electron population. This is called incoherent emission. (Galactic sources are another story, but I’ll save that for another time.) ↩︎
Original astrobite edited by Flavia Pascal.

About the author, Chloe Klare:

I’m a PhD student in astronomy and astrophysics at Penn State (with a physics minor, so I get to use my semester spent in QFT for something!). I study active galactic nuclei (in the radio!), and I’m currently looking for baby synchrotron jets in active galactic nuclei.

The post Thermal Electrons Can Explain the Mysterious Radio Behavior of a Tidal Disruption Event appeared first on AAS Nova.

  •  

Hitchhiking PAHs Caught Catching a Ride on Galactic Winds

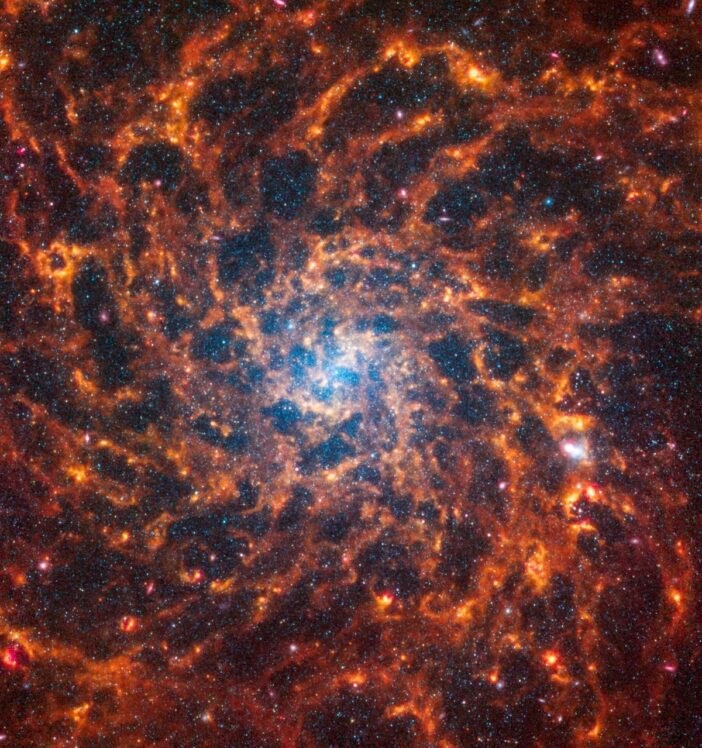
IC 5332

Editor’s Note: Astrobites is a graduate-student-run organization that digests astrophysical literature for undergraduate students. As part of the partnership between the AAS and astrobites, we occasionally repost astrobites content here at AAS Nova. We hope you enjoy this post from astrobites; the original can be viewed at astrobites.org.

Title: JWST Discovery of Warm Dust in the Circumgalactic Medium of the Makani Galaxy
Authors: Sylvain Veilleux et al.
First Author’s Institution: University of Maryland
Status: Published in ApJ

The Windy Galaxy

Billions of light-years away lies Makani, a record-breaking galaxy discovered in 2019 by researchers at the Keck Observatory atop Maunakea, Hawaiʻi. The galaxy shows evidence of a large merger event, where two galaxies collided to form a larger galaxy. This event triggered starburst activity, or several waves of intense star formation, that changed the makeup of not just Makani, but the region around it.

There are several processes that can create galactic winds. An active supermassive black hole at the center of the galaxy can slingshot particles out of the galaxy at close to the speed of light, or supernovae leftover from previous starburst activity can help to expel material from the galaxy. Makani, whose name in Hawaiian just so happens to mean “wind,” has both factors contributing to its galactic winds: massive amounts of star formation and a very active black hole in its center.

This contributes to some of the strongest galactic winds discovered to date, stretching approximately 100 kiloparsecs (330,000 light-years) beyond the galaxy, roughly ten times the extent of a typical galactic wind. These galactic winds remove gas from the galaxy and help to enrich the circumgalactic medium around the galaxy. There is still much to discover about how galactic winds change the makeup of such galaxies, and what exactly they take with them on their way out.

Earth’s Favorite Carcinogen: Polycyclic Aromatic Hydrocarbons

Polycyclic aromatic hydrocarbons (PAHs, pronounced P-A-Hs or “paws”) are small flat dust grains scattered into every corner of the universe, from the atmosphere of Earth in the form of exhaust and wildfire smoke to the circumgalactic medium (the mostly empty space between galaxies). These PAHs contribute to regulating the temperature of the interstellar medium, but astronomers have long wondered how they migrate across galaxies.

Even though they are smaller than a human hair, PAHs are still easily observable even in very distant galaxies.  These dust grains emit infrared light, and if there are enough PAHs in a region, they are bright enough to be observed with modern telescopes, such as JWST. By combining multiple observations across multiple filters, astronomers can calculate ratios that reveal information about the PAHs’ size, temperature, and charge, allowing reserachers to further discern properties about the regions in which these PAHs reside.

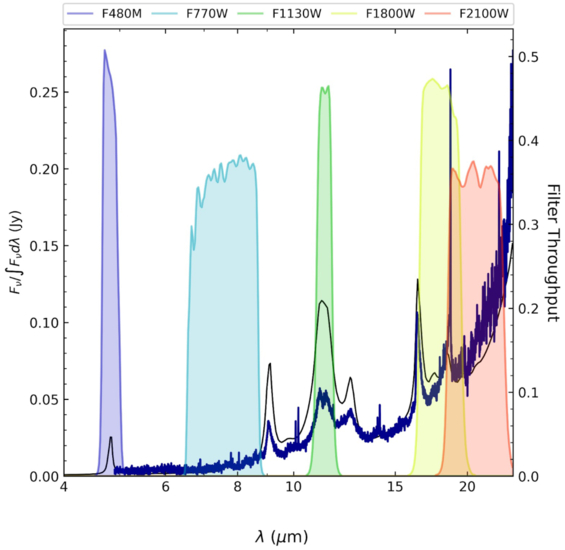
With redshifted galaxies like Makani, the light from PAHs is stretched beyond its usual wavelength, but fortunately for today’s authors, the light was stretched just enough to land known PAH features well within JWST filters, as seen in Figure 1. The authors were then able to use this information to track the distribution of these PAHs across Makani.

JWST spectrum of the galaxy Makani

Figure 1: Makani’s spectrum overlaid on top of the JWST filters. The peaks in the spectrum are PAH features that neatly overlap with JWST’s observing bands. [Veilleux et al. 2025]

PAHs Gone Extragalactic

Using JWST, the authors scrutinized Makani for any signs of PAHs. They found that not only did PAHs exist within the galaxy, these molecules were found up to 30 kpc (~100,000 light-years) outside the galaxy. Makani’s strong galactic winds were ejecting the dust grains from the galaxy over an estimated timescale of a billion years.

Previously, astronomers had not expected to find high quantities of dust grains outside the protection of a galaxy. The journey across a galaxy is long and hot, with temperatures in the millions of degrees. A dust grain would likely not survive the trip, as it would be destroyed by high-energy photons. This suggests that the PAHs were somehow shielded from the hotter parts of the interstellar medium and circumgalactic medium in large enough volumes to make it beyond the edge of Makani.

This answered questions about how galaxies enrich the circumgalactic medium, but it also added several more. Since today’s authors were limited by the sensitivity and range of their instruments, they were unable to confirm if there were PAHs along Makani’s entire wind structure, or just the first 35 kpc (114,000 light-years) of it. They also would like to turn their sights towards the intergalactic medium to see if PAHs could make it even farther beyond the reach of their host galaxy.

Original astrobite edited by Chloe Klare.

About the author, Natalie Price:

As a first-year master’s student at Wesleyan University, I study how stellar winds interact with the local interstellar medium. Outside of the observatory, you can find me dancing, with my nose in a book, or running at non-relativistic speeds.

The post Hitchhiking PAHs Caught Catching a Ride on Galactic Winds appeared first on AAS Nova.

  •  

Galaxies of Many Colors

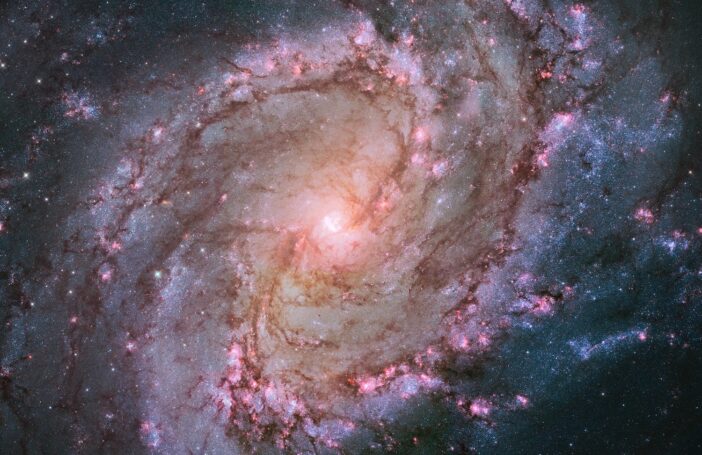
Messier 83

Editor’s Note: Astrobites is a graduate-student-run organization that digests astrophysical literature for undergraduate students. As part of the partnership between the AAS and astrobites, we occasionally repost astrobites content here at AAS Nova. We hope you enjoy this post from astrobites; the original can be viewed at astrobites.org.

Title: Unbreaking the Universe: MINERVA Measurements of Color Gradients in Massive Quiescent Galaxies Can Help Ease Too-Early Star Formation Tensions
Authors: Sam E. Cutler et al.
First Author’s Institution: Tufts University
Status: Published in ApJL

Universe Breakers

JWST launched in 2021, and one of its key goals was to observe the first galaxies as they formed. Early results from JWST found something surprising: extremely massive galaxies in the early universe that had “quenched,” or stopped making new stars, much faster than was expected. These early results led some to believe that our understanding of how quickly massive galaxies can form and quench was fundamentally wrong.

Before concluding that our understanding of the universe is broken, it’s important to find other reasons why we might see very massive galaxies in the early universe. One theory is that these galaxies are actually less massive than we think. To “weigh” a galaxy, astronomers first measure the amount of light being emitted by that galaxy. If all the light in a galaxy comes from stars (which should be true in the early universe, though active black holes can contribute a lot of light in some galaxies), you can infer the total number of stars by accounting for the average amount of light emitted per star of a certain mass; this is called the “mass-to-light ratio.” Since massive stars emit a lot more light than low-mass stars, and high-mass stars die out faster than low-mass stars, the mass-to-light ratio is higher for older stellar populations. To accurately “weigh” a galaxy, scientists therefore need both a good measurement of the total amount of light in the galaxy and how old its stellar population is. The authors of today’s article suggest that the uncertainty in these measurements might be leading to overestimates of galaxy masses and underestimates of galaxy star formation rates, possibly explaining the existence of the earliest massive quiescent (non-star-forming) galaxies.

The Impact of Color Gradients

Previous works about the massive quiescent galaxies in this study used spectroscopy to determine the galaxies’ masses and star formation rates. These spectra were taken with a “slit,” which introduces a source of error: if the slit is smaller than the image of the galaxy, some of the galaxy’s light will be missed in the spectrum. Astronomers usually correct for this by checking how much of the total light of a galaxy image is covered by the slit and scaling up the spectrum to account for the missing light, but this correction assumes that the spectrum is basically the same across the entire galaxy.

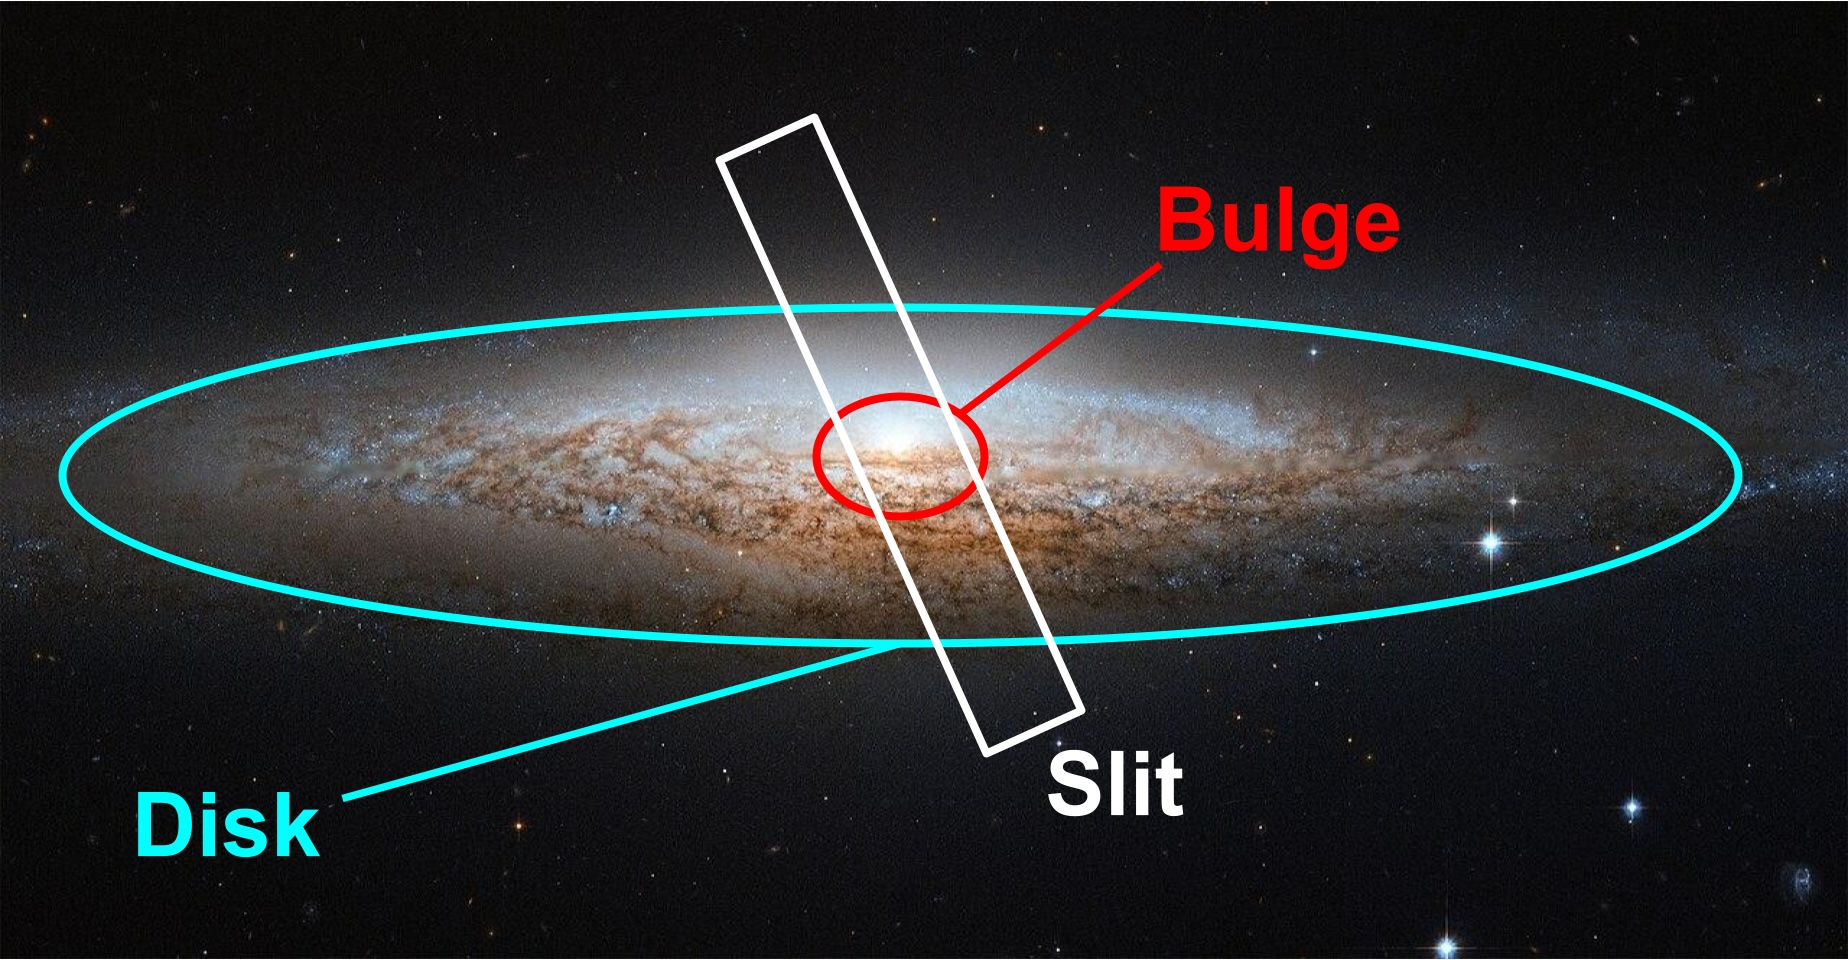
However, this assumption is rarely correct. In the local universe, star-forming spiral galaxies like the Milky Way tend to be made of a central “bulge” surrounded by a “disk” (see Figure 1). The bulge is no longer actively forming new stars, leading to a red-to-blue color gradient as you move out from the center of the galaxy. In astronomy, this is considered a “negative” color gradient. A slit that only covers the galaxy center would lead to an overall overestimate of the stellar mass and underestimate of the star formation rate. If the galaxies instead had a positive color gradient, with more star formation in the center of the galaxy, the mass would be underestimated and the star formation rate would be overestimated. Galaxies with both positive and negative color gradients have been found in the distant universe. By measuring the color gradient for each individual galaxy in their sample, the authors can correct the mass and star formation rate calculations from spectra taken with a slit spectrograph.

NGC 2683 with annotations

Figure 1: The spiral galaxy NGC 2683 with its bulge and disk labeled. The inner part of the galaxy (“bulge”) contains older, redder stars; the outer part of the galaxy (“disk”) contains bright blue stars that indicate that star formation is ongoing. Here, the slit spectrograph only covers the galaxy’s bulge, leading to incorrect mass and star formation rate measurements. [ESA/Hubble & NASA (CC BY 4.0) with annotations by Margaret Verrico]

Results

Instead of using spectra, the authors of today’s article use imaging in different filters to measure color gradients for a sample of four galaxies in the early universe that had previously been found to be extremely massive and no longer forming stars. They use medium-band filters, or filters that let in only a small part of a galaxy’s spectrum, to produce a spectral energy distribution at each radius. This spectral energy distribution is less informative than a spectrum (think a handprint versus a fingerprint), but it’s detailed enough to model the likely stellar population at each radius to determine whether the galaxies have positive, negative, or no color gradients, allowing for better corrections to the properties measured from the galaxies’ centers. They also model the stellar population from the central part of the galaxy that would normally be covered by a slit, as well as from the actual spectrum, to test whether any differences in their results come from their choice of modeling techniques.

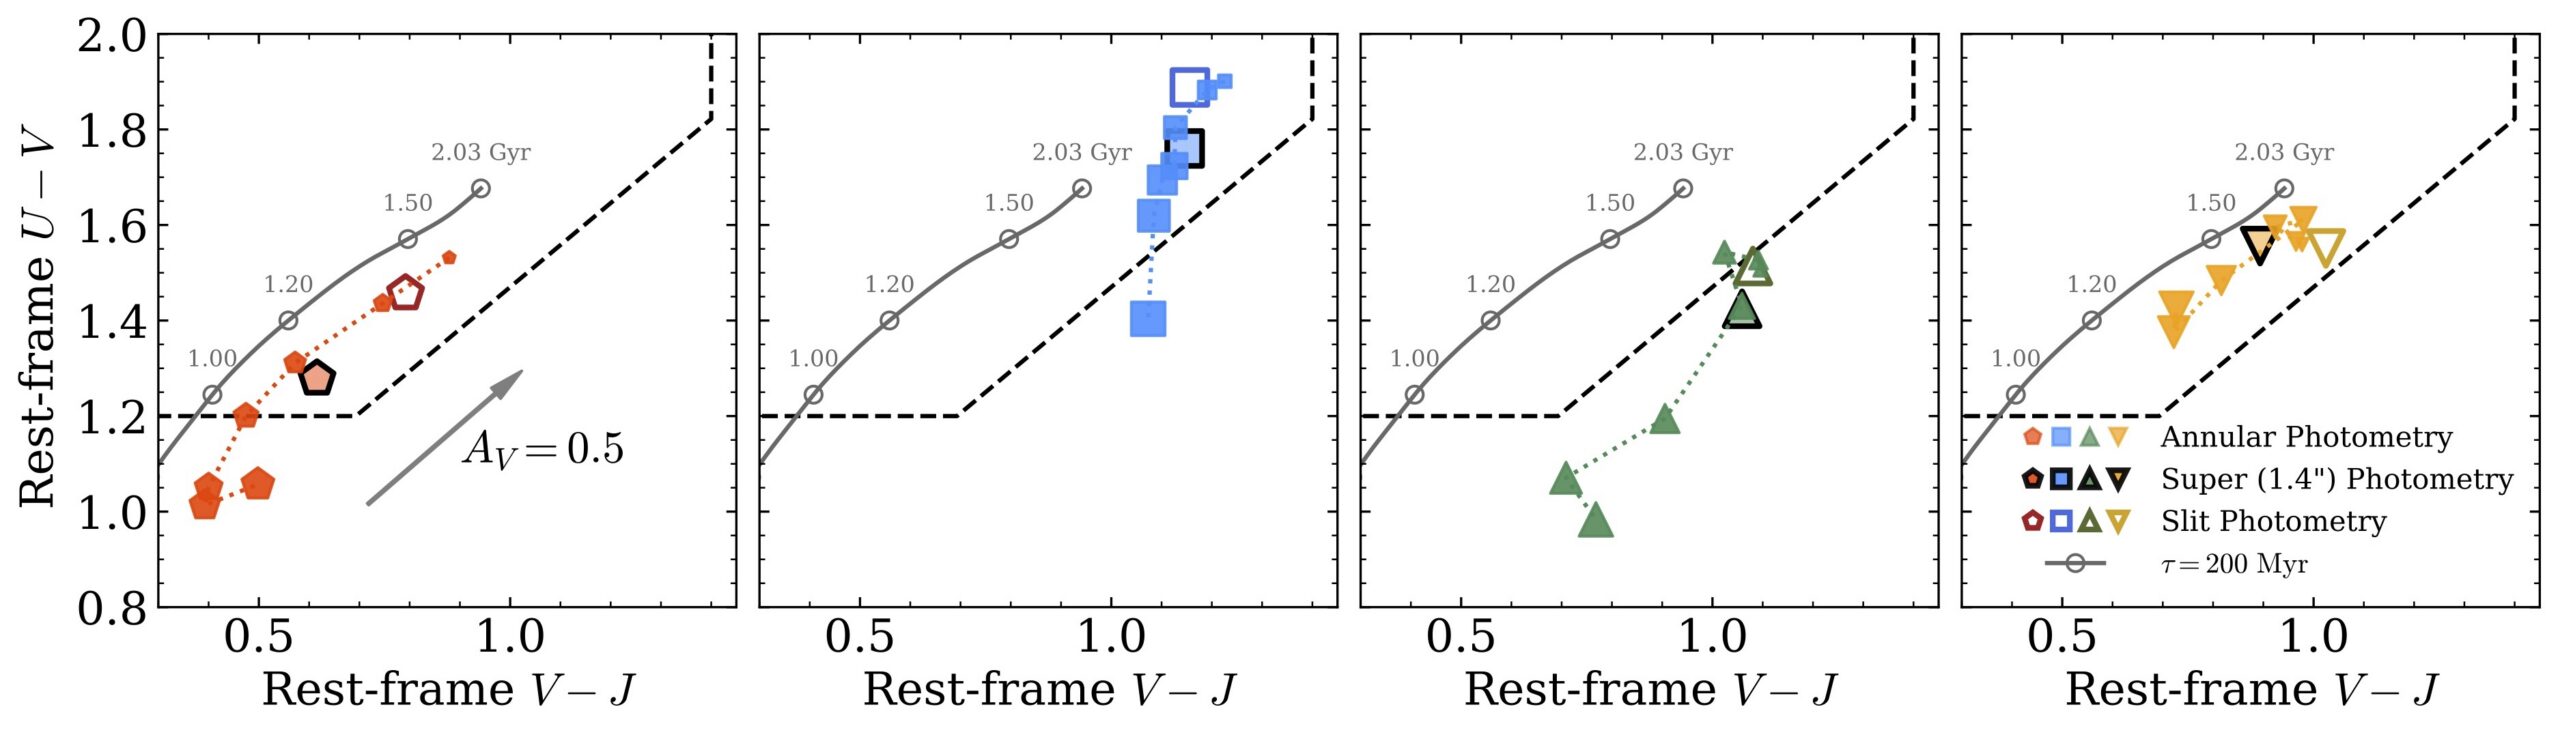
The authors find that three of the four galaxies have a negative color gradient in at least some areas. The fourth galaxy has a relatively flat color gradient, though this measurement is less certain due to the object’s redshift. When the authors plot the galaxies’ colors on a diagnostic diagram that separates red and old galaxies from young and blue galaxies, they find that three of the four galaxies have centers that appear red and old but outskirts that appear young and blue (Figure 2). This means previous measurements of the mass may have been overestimated, and previous measurements of the star formation rate may have been underestimated.

color-color diagram for the galaxies studied

Figure 2: The location of each of the four galaxies on a color–color diagram that separates red galaxies (above/to the left of the dashed lines) from blue galaxies (below/to the right of the dashed lines). The open markers indicate the galaxy color as measured from the center of the galaxy; the filled-in markers show the color at different radii from the galaxy center. For all but one galaxy, the color at several radii is bluer than at the center, indicating that the galaxy might have younger stars at least at some radii. [Adapted from Cutler et al. 2026]

Next, the authors model the stellar ages across the galaxies using spectral energy distribution modeling. This technique compares the measured spectral energy distribution to libraries of stellar spectra, rules about how different dust or chemical composition impact galaxy appearance, and observational effects to predict the actual stellar makeup of a galaxy. In this case, the authors can’t know for sure whether the redder colors at galaxy centers come from an older stellar population, more dust, or changes in the chemical composition (the so-called “dust–age–metallicity degeneracy”). To account for this, the authors try modeling the stellar population two ways: once by assuming all change in color comes from a change in stellar age, and again by allowing the dust and chemical composition of the galaxy to change with radius. They find that if only the stellar age varies across the galaxy, age gradients in the galaxy stellar population can bring the estimated galaxy masses and star formation rates back toward agreement with models of galaxy evolution in the early universe, though not all the way. However, allowing dust and chemical composition to change across the face of the galaxy lead to higher stellar masses and less star formation, meaning the mystery may not yet be solved.

Is the Universe Broken?

To determine whether these galaxies still count as “universe breakers,” the authors use a cosmological model to predict the largest expected galaxy mass in the observed area at different periods in cosmic time. The previous results had less than a 0.3% chance of occurring under current cosmological models; with their updated numbers and stellar population models, the authors find that the observed galaxies sometimes have more than a 5% chance of occurring, though there is still tension. They point out that their analysis ignores processes that could help galaxies grow and quench in the early universe, like galaxy mergers; still, the existence of these massive galaxies with such low star formation rates remains a puzzle.

Original astrobite edited by Ansh Gupta.

About the author, Margaret Verrico:

I am a fourth-year graduate student at the University of Illinois Urbana-Champaign. I study the connection between supermassive black hole transients and their host galaxies. I am also an avid knitter and reader, and I am passionate about opening up STEM opportunities for people of all backgrounds.

The post Galaxies of Many Colors appeared first on AAS Nova.

  •  

Do Galaxies Really Glow in Sync — or Are We Just Tilting Our Heads?

NGC 1068

Editor’s Note: Astrobites is a graduate-student-run organization that digests astrophysical literature for undergraduate students. As part of the partnership between the AAS and astrobites, we occasionally repost astrobites content here at AAS Nova. We hope you enjoy this post from astrobites; the original can be viewed at astrobites.org.

Title: Geometry, Not Calorimetry, Drives the Radio–Infrared–γ Ray Correlation
Authors: T. A. Porter, I. V. Moskalenko, and G. Jóhannesson
First Author’s Institution: Stanford University
Status: Published in ApJ

Galaxies emit light not only in the visible band, but also across other wavelengths via different physical mechanisms. Finding correlations between emissions at different wavelengths is a powerful tool for astrophysicists to explore the underlying mechanisms of galaxy formation. One of the most famous examples is the infrared–radio continuum correlation, which holds across several orders of magnitude in luminosity.

The typical explanation for this correlation is that both infrared light and radio synchrotron emission share the same energetic origin: star formation. Young stars emit ultraviolet radiation, which is absorbed by interstellar dust and re-radiated in the infrared. When these stars end their lives in core-collapse supernovae, the resulting shock waves accelerate cosmic-ray electrons, which then interact with the magnetic field to produce synchrotron emission.

For this correlation to hold, cosmic-ray electrons must radiate away all their energy within the galaxy, unable to escape and carry away some of their energy. Otherwise, the amount of radio emission would depend on how quickly cosmic rays escape and would no longer correlate with the infrared emission. This assumption is called the “electron calorimeter” model, which assumes that electrons lose all their energy due to radiation without escaping the galaxy. However, observations show that the infrared–radio correlation persists even in low-density galaxies where cosmic rays can easily escape, suggesting that the calorimeter model may not be the full story. To reconcile this, previous studies proposed “conspiracy-like” scenarios in which cosmic-ray injection, transport, magnetic-field amplification, and gas density are all coupled in a finely self-regulating way to maintain the correlation across diverse galactic environments — a somewhat awkward explanation that requires multiple unrelated physical processes to conveniently work together.

With the increased sensitivity of the Fermi Large Area Telescope, high-energy gamma-ray (or γ-ray) detections add new information to this picture. A galaxy’s γ-ray emission is produced by two different sources: cosmic-ray protons interacting with the interstellar medium gas, and cosmic-ray electrons inverse-Compton scattering off of nearby starlight or photons from the cosmic microwave background. Since both processes involve cosmic rays, the total γ-ray emission should also reflect the amount of star formation and therefore correlate with infrared and radio emission.

Because all three wavelengths trace different pieces of the same cosmic-ray population, studying them together reveals how the galaxy’s total cosmic-ray energy budget is distributed across its multi-wavelength emission.

The infrared–radio correlation has been established not only at the scale of entire galaxies, but also locally, down to patches roughly 100 parsecs across. Think of it like the relationship between a city’s electricity consumption and its population: we have long known they track each other city-wide, but it turns out the same relationship holds block by block. The infrared–radio correlation works the same way: zoom into any 100-pc region within a galaxy, and the correlation is still there. Unfortunately, the resolution of γ-ray observations is still stuck at around the kiloparsec scale. It is therefore unclear whether the local infrared–radio correlation reflects a genuine local physical coupling, one that would extend to γ-rays if we had sufficient resolution, or whether it is simply a spatial average of the emission, smoothed out by insufficient resolution. The answer determines whether radio and γ-ray emission can be used as reliable tracers of star formation, or whether they are just smeared out by cosmic-ray propagation over kiloparsec scales.

In this study, the authors numerically model galactic cosmic-ray transport, building a suite of physically motivated three-dimensional models of the Milky Way. They consider two variants for each of the four key inputs: 1) the cosmic-ray source distribution, 2) the interstellar gas, 3) the amount of starlight within the galaxy (the interstellar radiation field), and 4) the galactic magnetic field. Crucially, every model is normalized to reproduce the locally observed cosmic-ray data to within 5%, so that any differences in the predicted emission come purely from the large-scale geometry of each input, rather than from variations in the total cosmic-ray budget.

After evolving cosmic-ray transport for these realistic models, the authors then compute synthetic observations at radio, infrared, and γ-ray bands from various viewing inclinations to investigate how the underlying galactic model and the viewing angle affect the correlations between these emissions.

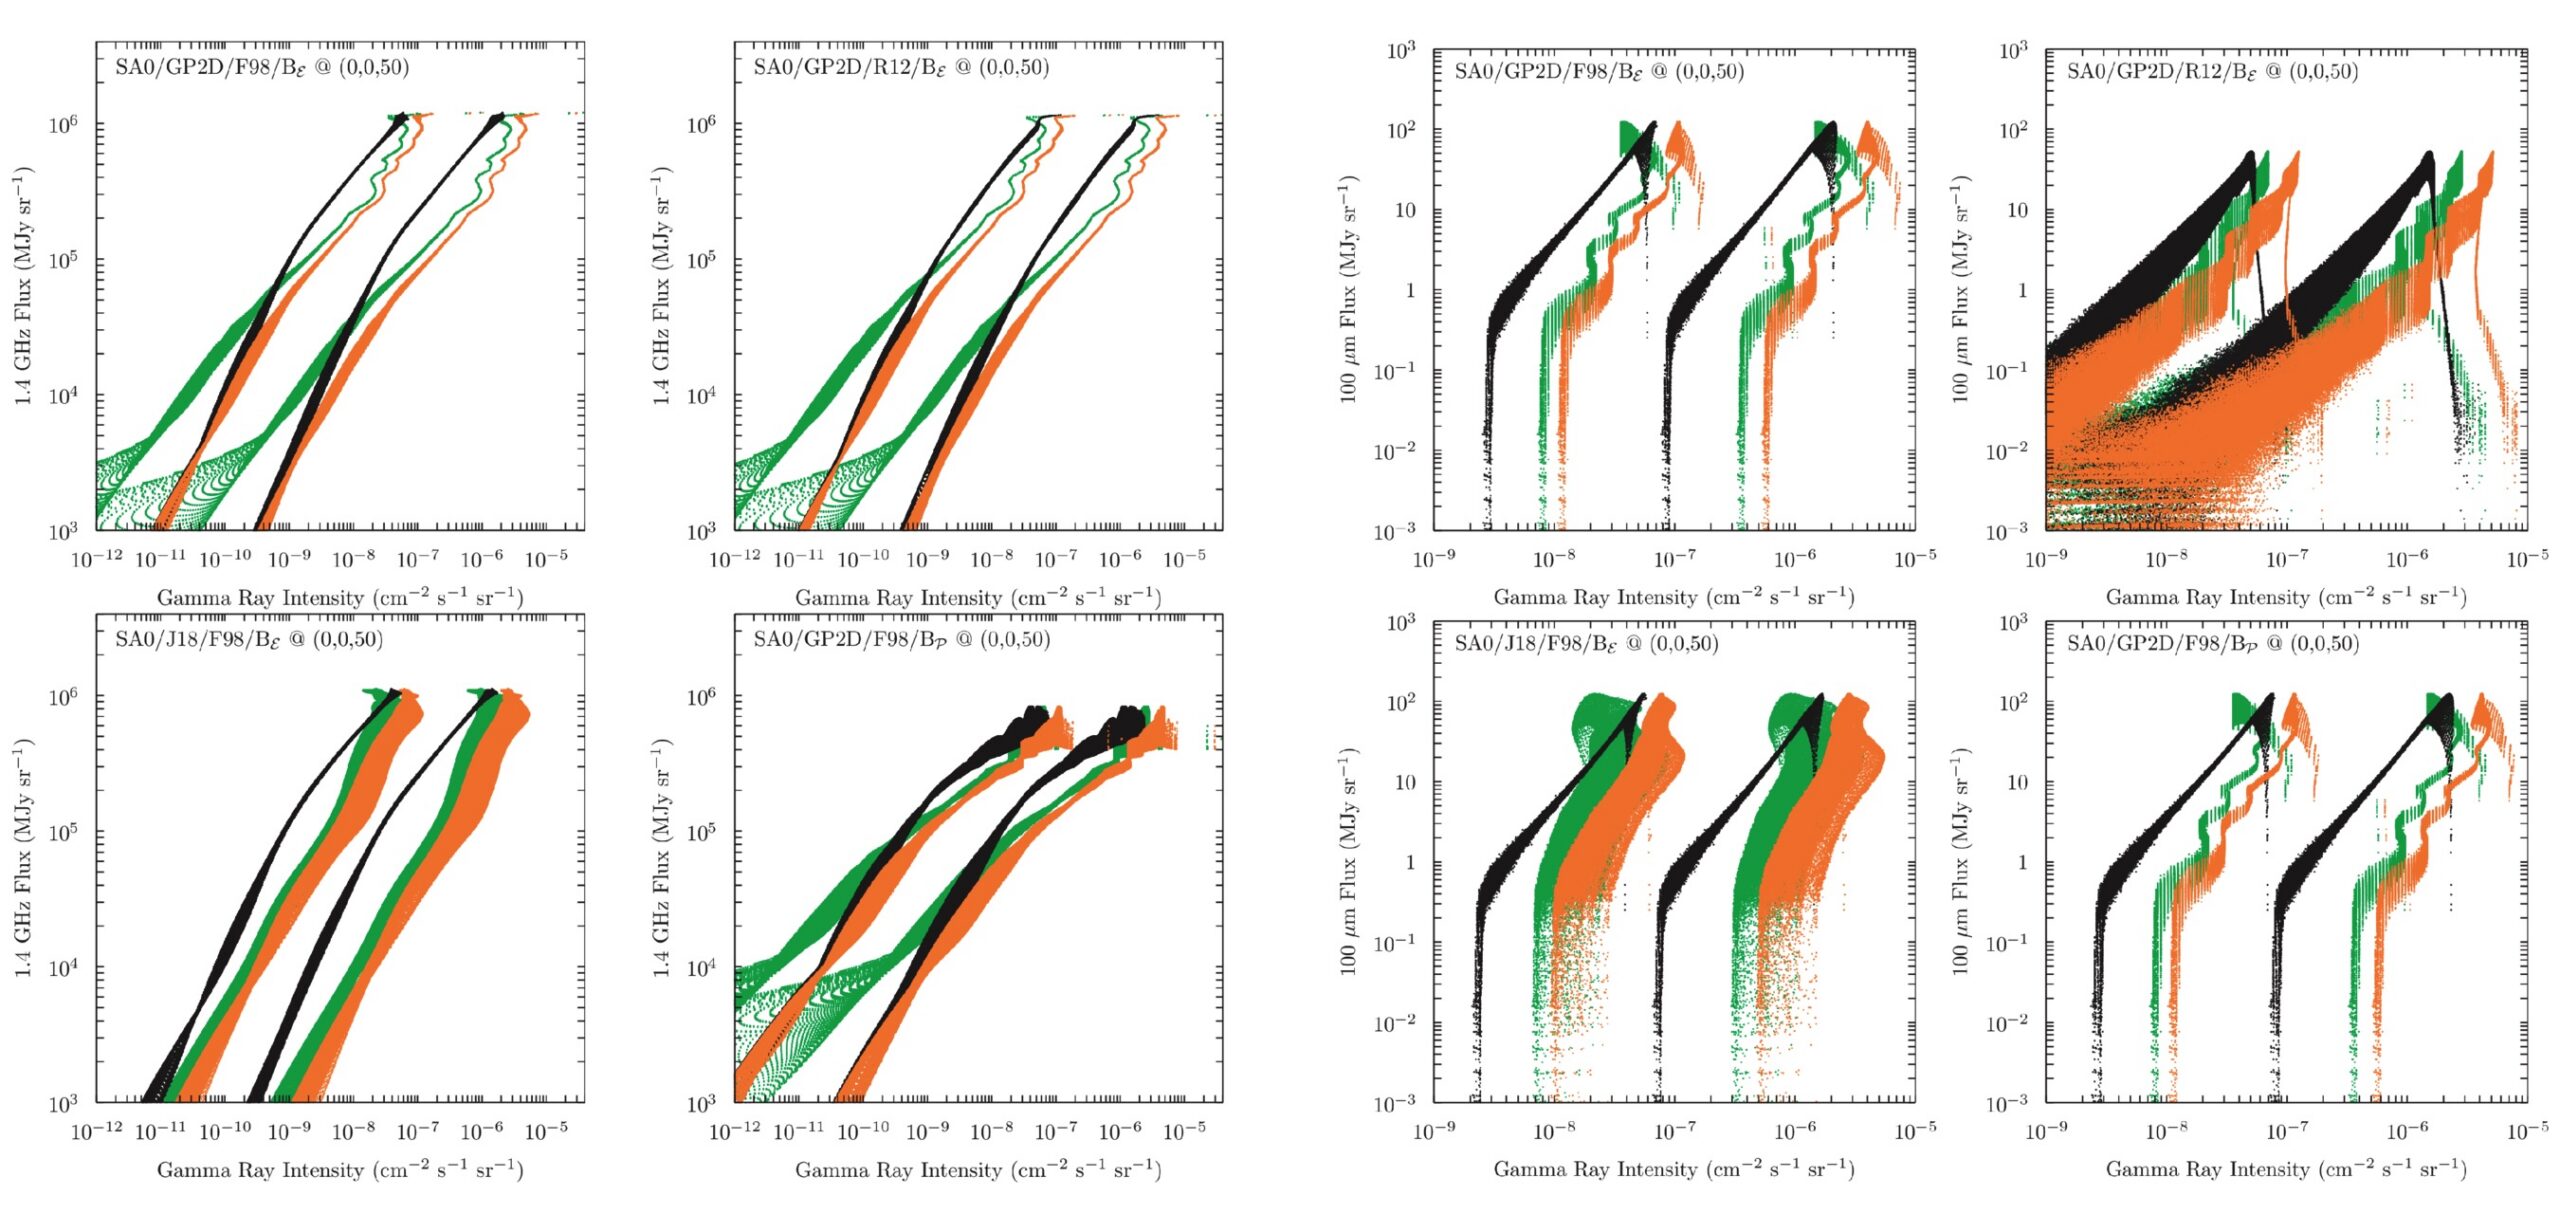
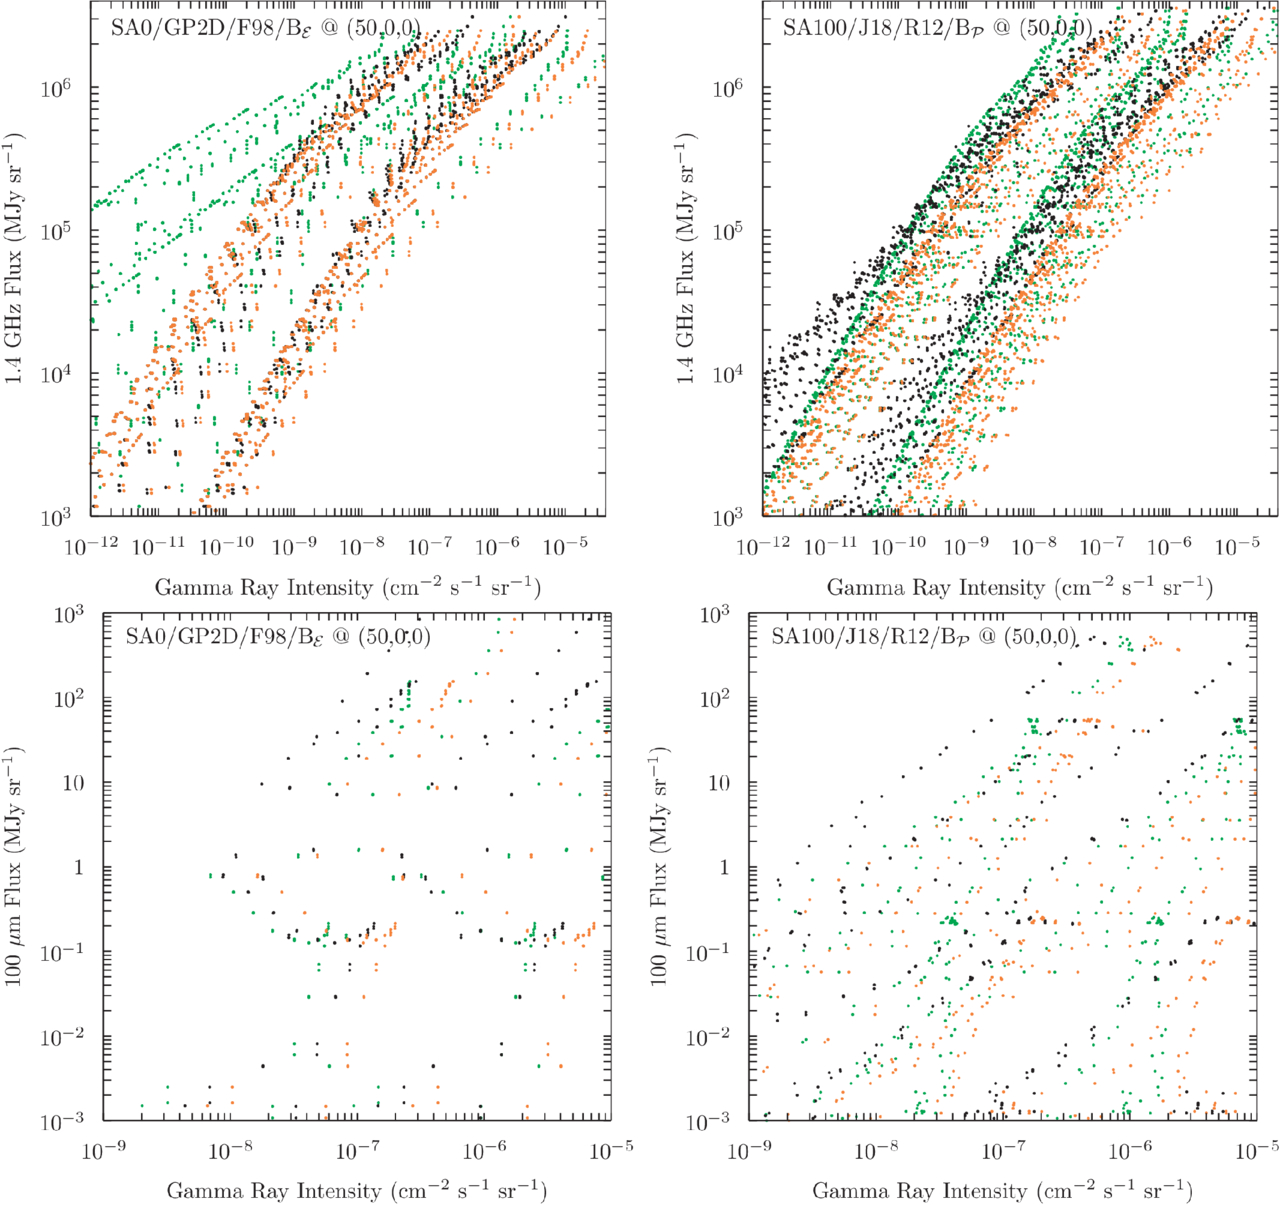
Surprisingly, inclination plays the most important role — more so than the cosmic-ray source distribution, the radiation field, or the magnetic field. Figure 1 shows the correlation plots between the radio and γ-ray emission (left two columns) and between infrared and γ-ray emission (right two columns) when viewing the galaxy face-on (i.e., viewing the galaxy from directly above the disk). Different colors represent γ-ray emission components from different physical mechanisms, with orange showing the total γ-ray emission. For both sets of correlation plots, starting from the upper-left panel, each panel modifies one physical input and recomputes the emission. Although there is some variation, one can see that the γ-ray emission correlates with both the radio and the infrared emission over several orders of magnitude, regardless of the underlying input model.

plots of radio and infrared flux versus gamma-ray intensity

Figure 1: Radio (left two columns) and infrared (right two columns) vs. γ-ray correlation plots for a galaxy viewed face-on from 50 kpc. Each panel modifies one input — the cosmic-ray source distribution, gas, radiation field within the galaxy, or magnetic field — relative to a baseline model. Colors indicate γ-ray production mechanisms (green: proton–gas; black: inverse-Compton; orange: total). Across all variations, both the radio–γ-ray and infrared–γ-ray correlations remain quasi-linear over several orders of magnitude, showing that the correlations are robust to the choice of underlying galactic model. [Adapted from Porter et al. 2026]

In contrast, Figure 2 shows the correlation plot between radio and γ-ray emission (upper panels) and between infrared and γ-ray emission (lower panels) when viewing the galaxy edge-on (viewing the disk from the side). The radio–γ-ray correlation is preserved, while the infrared–γ-ray correlation is no longer observed. This is because, at this inclination, geometric projection separates the emission components. Infrared-emitting dust and γ-ray emission from cosmic ray–interstellar medium interactions are confined to the disk, while synchrotron radio emission and γ-ray emission from inverse-Compton scattering extend to larger distances above and below the disk. As a result, in an edge-on view, a sight line passing through the disk sees strong infrared emission, while a sight line that misses the disk sees zero infrared but still some γ-ray emission, breaking the infrared–γ-ray correlation. On the other hand, because radio emission is more extended than infrared emission, sight lines that miss the disk can still see both radio and γ-ray emission together, preserving the radio–γ-ray correlation.
relationships between infrared, radio, and gamma-ray flux for two types of galaxy models

Figure 2: Correlation plots for two galaxy models viewed edge-on from 50 kpc — simple axisymmetric (left) and complex with spiral arms (right). Top: radio vs. γ-ray; bottom: infrared vs. γ-ray. Colors indicate γ-ray production mechanisms (green: proton–gas; black: inverse-Compton; orange: total). The infrared–γ-ray correlation breaks down, while the radio–γ-ray correlation is broadened but partially preserved. [Porter et al. 2026]

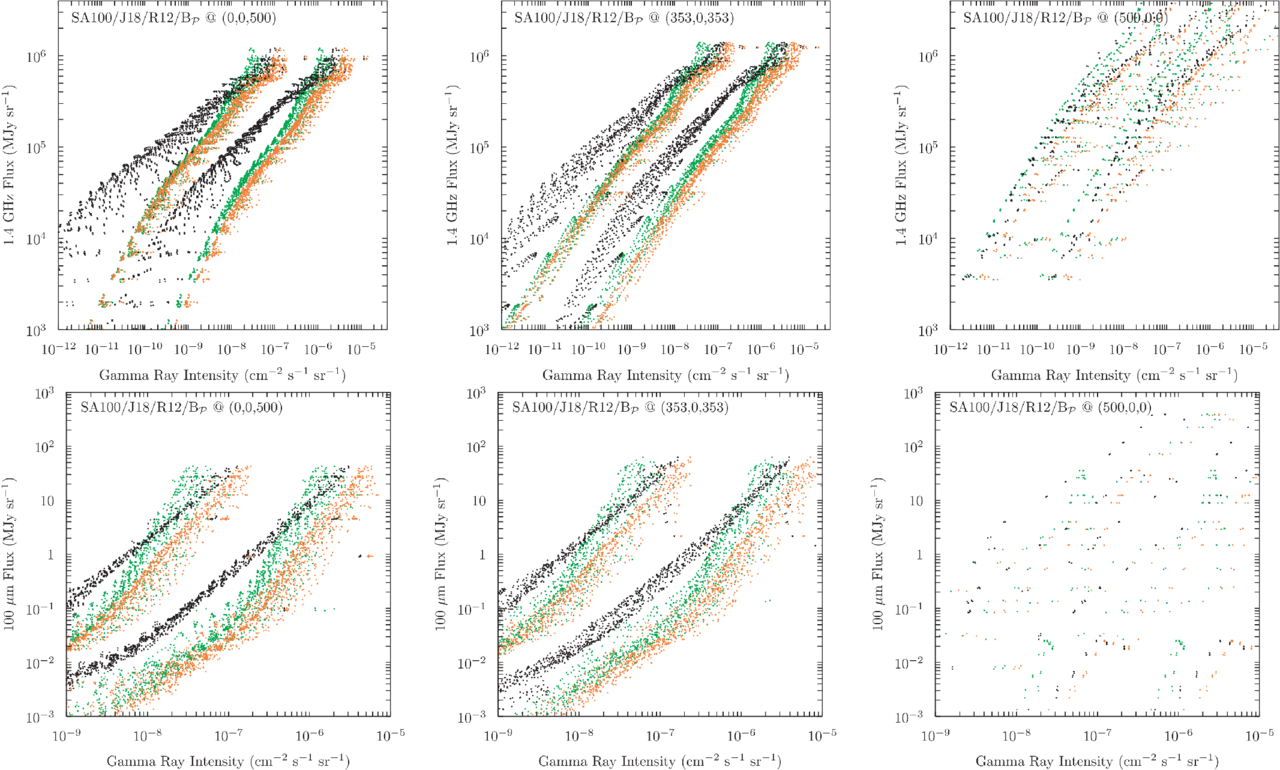
However, there is one situation where the edge-on correlation comes back: when the observer is far enough away that the image becomes too blurry to resolve the galaxy’s internal structure. Figure 3 shows the same galaxy model viewed from 500 kpc, roughly the distance to Messier 31, our nearest large neighbor. At this distance, a single pixel in the image covers about 1 kpc, large enough for everything along the line of sight. The messy, broken-up pattern seen in the closer 50 kpc edge-on view (lower-right panel of Fig. 2) disappears, and a tight, nearly linear correlation comes back. This explains why nearly all distant, unresolved galaxies show tight radio–infrared–γ-ray correlations: the tightness is simply what you get when you blur everything together, not evidence that cosmic rays are actually losing all their energy locally inside those galaxies.
relationships between infrared, radio, and gamma-ray flux for simulated galaxies viewed from 500 kiloparsecs

Figure 3: Correlation plots from a complex galaxy model viewed from 500 kpc, at three different inclinations (face-on, 45°, edge-on). Top row: radio vs. γ-ray; bottom row: infrared vs. γ-ray. Colors indicate different γ-ray production mechanisms (green: proton–gas; black: inverse-Compton; orange: total). At this distance, the blurring effect of large pixels restores a tight correlation even in the edge-on view. [Porter et al. 2026]

Now we have a consistent picture of the radio–infrared–γ-ray correlation: the authors conclude that this correlation is not a direct signature of cosmic-ray calorimetry, but a geometric projection effect. In face-on systems, a single sight line integrates emission from both the disk and off-disk regions, naturally producing a linear correlation, even when cosmic rays do not lose all their energy locally to radiation (i.e., local calorimetry is absent). In edge-on systems, the correlation breaks down because geometric stratification separates the different emission components. The practical implication is significant: for unresolved galaxies, the tightness of the global correlation alone cannot be used as evidence for cosmic-ray calorimetry, and the physically meaningful information about cosmic-ray transport and escape efficiency is encoded in the scatter around the mean trend, not in the correlation itself.

Original astrobite edited by Kelsie Taylor.

About the author, Sandy Chiu:

I’m a PhD candidate at the University of Michigan, Ann Arbor. I’m interested in numerical simulations of cosmic rays feedback in galaxies and their comparison with observation.

The post Do Galaxies Really Glow in Sync — or Are We Just Tilting Our Heads? appeared first on AAS Nova.

  •  

EXCELlent Work, Detectives! Solving the Murder of Star Formation in Galaxies with JWST

Arp 142

Editor’s Note: Astrobites is a graduate-student-run organization that digests astrophysical literature for undergraduate students. As part of the partnership between the AAS and astrobites, we occasionally repost astrobites content here at AAS Nova. We hope you enjoy this post from astrobites; the original can be viewed at astrobites.org.

Title: The JWST EXCELS Survey: Insights into the Nature of Quenching at Cosmic Noon
Authors: Maya Skarbinski et al.
First Author’s Institution: Johns Hopkins University
Status: Published in ApJ

How to Quench a Galaxy

Look at an image of the sky taken with a sufficiently sensitive telescope, and you’ll quickly notice that galaxies tend to cluster into two main types: blue spiral galaxies, which have flat disk shapes with a central bulge, and red elliptical galaxies, which look like spherical or elliptical balls of red stars. Blue spiral galaxies can form tens to hundreds of stars every year, while elliptical galaxies have completely stopped forming stars, meaning that some process has to transform star-forming spirals into non-star-forming, or “quiescent,” elliptical galaxies. To form the current population of massive elliptical galaxies, this process had to be common about 2–3 billion years after the Big Bang at “cosmic noon,” the period when star formation in the universe peaked. The processes that “quench” star formation in massive galaxies are still being studied, and one of the best ways to study them is to find galaxies that recently quenched and look for clues about the processes that quenched them.

Post-starburst galaxies are galaxies that have rapidly quenched after a short burst of star formation. Because these galaxies quenched so quickly and so recently, it’s often possible to find signs of whatever quenched them, like the signatures of past galaxy mergers, feedback from supermassive black hole accretion, or the shutoff of gas flowing into the galaxy. Rapid quenching is pretty uncommon now, but it was a much more common way for galaxies to quench at cosmic noon. Understanding post-starburst galaxies at cosmic noon is therefore critical for understanding the formation of massive elliptical galaxies in the local universe.

The Quest for Quenched Galaxies

Today’s article uses data from the JWST Early eXtragalactic Continuum and Emission Line Survey (EXCELS) to identify post-starburst galaxies at cosmic noon and try to determine why they quenched. EXCELS is a spectroscopic survey, so the authors get a spectrum for every galaxy. The spectrum encodes information about the galaxy’s stellar population, including the mass of stars in the galaxy, the number of stars forming every year, and the history of star formation throughout the galaxy’s life.

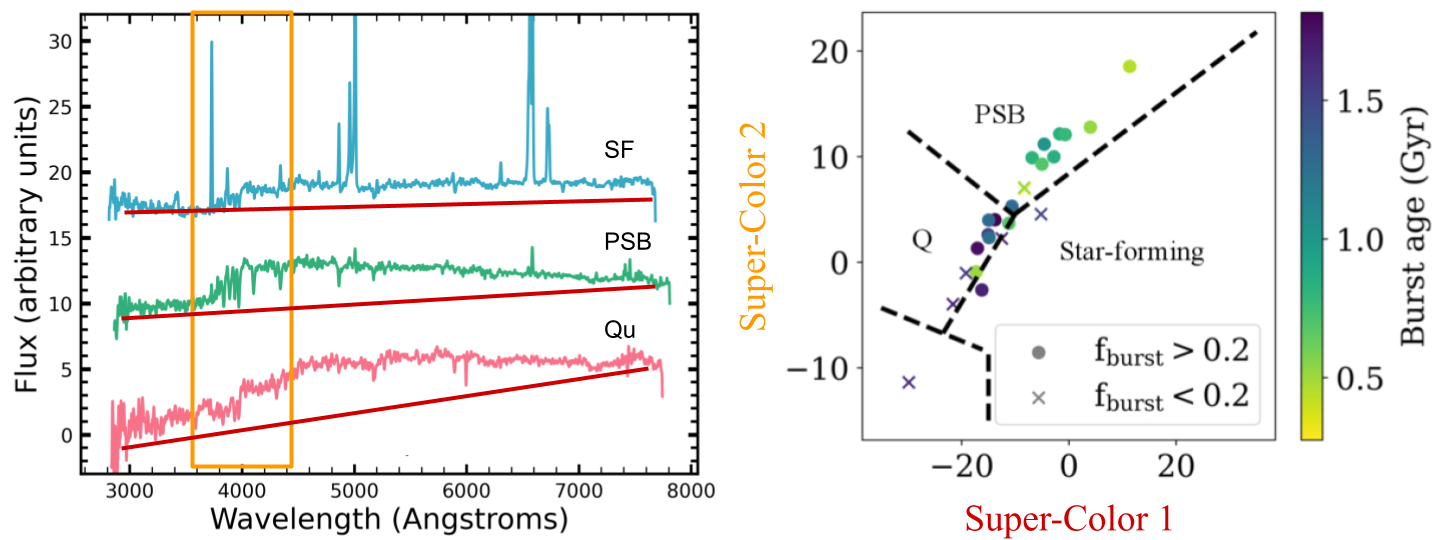
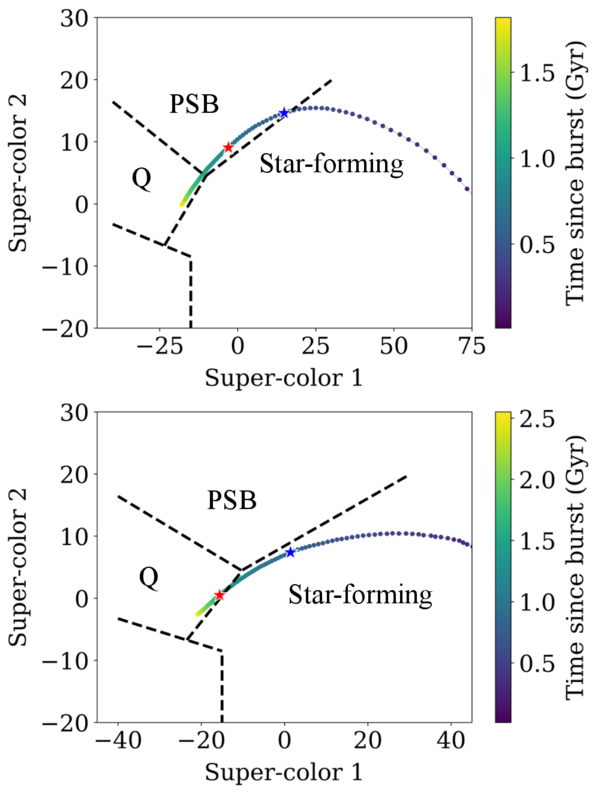
The authors use a technique called principal component analysis to further divide the sample into young and old post-starbursts. Principal component analysis is a machine-learning technique that learns the most important features of a data set. This technique is used for “dimension reduction,” or reducing the number of data points needed to learn something about the object. A typical spectrum has hundreds or even thousands of data points, which means performing data analysis on a spectrum can be very computationally expensive. Principal component analysis takes these thousands of data points and learns broad patterns that correlate with each other. These patterns are called “supercolors” in the context of spectral data, and they encode things like the overall shape and color of the spectrum as well as the spectral shape around key features (see Figure 1 for a visualization). Since the overall shape, color, and emission/absorption line features of a spectrum come from the galaxy’s stellar population, this method can be used to identify galaxies with lots of star formation a billion years ago but very little star formation today — in other words, post-starburst galaxies.

demonstration of principal component analysis for spectra of different types of galaxies

Figure 1: An example of principal component analysis for sample star-forming (SF), quiescent (Qu), and post-starburst (PSB) galaxy spectra (left-hand side). Principal component analysis simplifies a many-dimensional data set (for example, spectra) into fewer dimensions. In this case, Super-Color 1 measures the overall color of the spectrum (shown on the left-hand side as the slope of the spectra, marked with red lines), while Super-Color 2 measures the shape of the spectrum around 4,000 angstroms (orange box). The authors use principal component analysis to identify post-starburst galaxies for further analysis (right-hand side). [Adapted from Skarbinski et al. 2026]

The authors apply principal component analysis to the galaxies in their sample and find that 11 of the galaxies in their sample are classified as post-starburst, 9 are quiescent, and 4 still have some star formation. To further analyze the stellar populations of the post-starbursts in their sample, the authors use a program called Bagpipes to fit the galaxies’ spectra. Bagpipes is a spectral energy distribution fitting software, which means that it takes the observed spectrum of a real galaxy and tries to match it to a library of different stellar spectra. By measuring the relative contribution of different kinds of stars (which all have different lifetimes), Bagpipes can compute the likely history of star formation in the galaxy (e.g., when the star formation rate peaked) as well as the present-day properties of the galaxy (things like the mass in stars versus dust and the current star formation rate). The authors use the galaxies’ star formation histories to try to find clues as to how they quenched.

How Quickly Do Post-Starbursts Quench?

First, the authors measure something called a “quenching timescale,” which they define as the length of time between when the galaxy’s star formation rate peaked and when it fell low enough that the galaxy was quenched. The quenching timescale depends on which process shut down star formation in the galaxy — feedback from black hole accretion or star formation should cause fast quenching, while galaxies that are starved of gas from the intergalactic medium should quench more slowly. The authors find that 15 of their galaxies quenched in under 500 million years, 6 took between 500 million and 1 billion years, and 3 took longer than 1 billion years to quench. The galaxies that had the highest peak star formation rates quenched the fastest, suggesting that feedback from star formation could have played a role in quenching these galaxies.

plots showing possible evolutionary tracks for two example galaxies

Figure 2: Possible evolutionary tracks in supercolor for two example galaxies as they quench. The galaxy in the top panel quenches quickly and has post-starburst supercolors for about a billion years, while the galaxy in the bottom panel quenches without ever going through the post-starburst phase. The authors use these tracks to determine how important the post-starburst phase is for quenching massive galaxies. [Skarbinski et al. 2026]

Next, the authors measure how important the post-starburst phase is to form massive quiescent galaxies. Not all galaxies that quench go through a post-starburst phase; some objects, especially those that quench slowly, will transition directly from star forming to quiescent. The authors use the star formation histories from their spectral energy distribution fits to predict how the galaxies’ supercolors changed after their star formation peaked (Figure 2) and find that six of the nine quiescent galaxies went through a post-starburst phase in the past, while the other three did not. For the objects that went through a post-starburst phase, the median time spent as a post-starburst was around 600 million years.The authors can use this measured “visibility timescale” to constrain whether the post-starburst phase is important for forming massive quiescent galaxies. If the fraction of post-starburst galaxies in a sample is high, that can be for two reasons: either a larger fraction of galaxies will eventually go through a post-starburst phase, or the post-starburst phase is very long, making it easy to find post-starburst galaxies. Using the measured timescale of 600 million years and combining with results from another article, the authors find that 40% of quiescent galaxies likely went through a post-starburst phase; for the more massive end of the sample, this fraction increases to around 73% due to the shorter visibility timescale. This suggests that the post-starburst phase is very important for forming the kind of massive quiescent galaxies we see in the local universe.

While the post-starburst phase is important, the different quenching timescales present across the sample suggest that multiple pathways existed to quench galaxies at cosmic noon, similar to what has been found in less-distant galaxies and at cosmic noon in other samples. This is also supported by the fact that four of the five galaxies with sufficient data show evidence of an actively accreting supermassive black hole that may help shut down star formation in many (but perhaps not all) massive galaxies. While the precise processes that quench massive galaxies are still uncertain, one thing is clear: JWST EXCELS at solving the mystery!

Original astrobite edited by Anavi Uppal.

About the author, Margaret Verrico:

I am a fourth-year graduate student at the University of Illinois Urbana-Champaign. I study the connection between supermassive black hole transients and their host galaxies. I am also an avid knitter and reader, and I am passionate about opening up STEM opportunities for people of all backgrounds.

The post EXCELlent Work, Detectives! Solving the Murder of Star Formation in Galaxies with JWST appeared first on AAS Nova.

  •  

The “Rhythm” of the Interstellar Medium

Messier 17

Editor’s Note: Astrobites is a graduate-student-run organization that digests astrophysical literature for undergraduate students. As part of the partnership between the AAS and astrobites, we occasionally repost astrobites content here at AAS Nova. We hope you enjoy this post from astrobites; the original can be viewed at astrobites.org.

Title: The Rhythm of the ISM: Tracing the Timescales of Gas Evolution and Star Formation Across Galactic Environments
Authors: Zuzanna Kocjan and Vadim A. Semenov
First Author’s Institution: University of Maryland
Status: Published in ApJ

The Connection Between Gas and Star Formation in Galaxies

Stars are born in the interstellar medium (ISM) when cold, dense clouds of gas become unstable and collapse under gravity. Despite their plentiful reservoirs of gas, galaxies convert only a small fraction of this material into stars, making star formation a surprisingly inefficient process. A key factor behind this inefficiency is stellar feedback: radiation, stellar winds, and supernova explosions from young stars can inject energy and momentum into the surrounding gas, heating, stirring, and dispersing it. In this way, stellar feedback shapes future star formation across scales ranging from individual regions in the ISM to whole galaxies.

An important tool astronomers use to study star formation is the Kennicutt–Schmidt relation, which links the amount of gas in a galaxy to the rate at which stars form. More specifically, it relates the gas surface density, Σgas, to the star formation rate surface density, ΣSFR. (For more on this relation, see this Astrobites article on a classic research article.) However, this law is underpinned by a crucial ingredient: timescales. In particular, the pace of star formation depends both on how quickly galactic gas is cycled into star-forming material and on how rapidly those regions convert gas into stars once they form. Today’s article investigates the physical origin of star-formation scaling relations behind the Kennicutt–Schmidt law by building on a simple theoretical framework for the ISM.

Consider a Kettle of Boiling Water…

In a given region of a galaxy, the ISM consists of gas in either an actively star-forming state or an inert, non-star-forming state, depending on whether it is dense and unstable enough to collapse (as illustrated in Figure 1). The transition of non-star-forming gas into the star-forming state occurs on the supply timescale, τ+. Conversely, the dispersal of star-forming gas back into a non-star-forming state is characterized by the removal timescale, τ–. As a helpful analogy, the authors compare this process to water boiling in a kettle: the ISM is continuously “boiling,” with gas moving between active and inactive states. Meanwhile, the total gas reservoir gradually decreases, analogous to water slowly evaporating as the kettle boils. The gas depletion time, τ*, therefore represents the timescale over which the available gas would be exhausted by star formation.

Schematic of the gas cycling framework

Figure 1: Schematic of the gas cycling framework used in the authors’ theoretical model for how gas is converted into stars, which takes into account a supply, removal, and depletion timescale. [Adapted from Kocjan and Semenov 2026]

Building on this picture of gas cycling, the authors turn to simulated galaxies, where the motion and evolution of the gas can be followed directly. By tracking how gas flows through the ISM in the simulations, they derive the three characteristic timescales above — τ+, τ–, and τ* — that describe how gas is supplied to, removed from, and ultimately consumed by star formation. The goal is to connect the small-scale physics of the ISM to the large-scale star formation efficiencies and scaling relations observed across galaxies.

The Timescales of the Interstellar Medium

To explore how gas and star formation are connected across different galactic environments, the authors analyze three simulated systems: a dwarf galaxy, a Milky Way–like galaxy, and a gas-rich starburst galaxy, as shown in Figure 2. Despite spanning very different physical regimes, the galaxies exhibit remarkably similar trends in the fraction of gas actively forming stars as a function of Σgas​. This suggests that the amount of star-forming gas is governed primarily by local interstellar conditions, since regions with higher gas surface densities tend to contain denser, more strongly self-gravitating gas.

galaxy simulations and star-forming gas fraction

Figure 2: Using simulations (left to right) of an isolated intermediate-mass dwarf galaxy, Milky Way–like galaxy, and gas-rich galaxy, the authors measure the star-forming gas fraction versus the gas surface density (right). [Adapted from Kocjan and Semenov 2026]

To further understand this trend, this study then applies the authors’ theoretical framework to determine the timescales of ISM gas cycling on the scales of individual star-forming regions. These include the timescales for the formation, dispersal, and local depletion of star-forming gas as described above: τ+, τ−, and τ∗, which also exhibit strong correlations with the gas surface density (see Figure 3). Specifically, the timescale for supplying gas into the star-forming state is linked to the rate at which turbulence redistributes material through the galactic disk. The depletion timescale, over which star-forming gas is turned into stars, decreases at higher Σgas​, since denser regions more efficiently collapse and form stars. By contrast, the removal timescale is comparatively short, reflecting how quickly feedback and changes in local equilibrium can disrupt star-forming clouds. In this way, the “boiling kettle” framework is able to capture the major processes driving small-scale gas evolution.
Scaling relations between the supply, depletion, and removal times

Figure 3: Scaling relations between the supply (left), depletion (middle), and removal (right) times in kiloparsec-scale regions of the simulated galaxies (shown in different colors). Based on the measurements from the simulations, the authors introduce a parameterized model for the gas cycling framework, as defined in the equations. [Adapted from Kocjan and Semenov 2026]

The cycling of gas through different phases of the ISM offers a useful framework for understanding how galaxies form stars. In the relatively well-ordered systems studied here, this balance can be described in simple terms; however, it is likely to become more complex in extreme environments where additional physical processes — such as those operating in the early stages of galaxy formation — play a significant role. Even so, these results highlight how key galactic properties can emerge naturally from the interplay between galaxy-scale dynamics, ISM turbulence, and the state of star-forming gas.

Original astrobite edited by Jayde Willingham.

About the author, Shalini Kurinchi-Vendhan:

After studying astrophysics and literature at Caltech, I moved onto a Fulbright Fellowship in Heidelberg, Germany. I’m passionate about using computer simulations to explore supermassive black holes and galaxy evolution — but I also love poetry and traveling.

The post The “Rhythm” of the Interstellar Medium appeared first on AAS Nova.

  •  

What if Mars Were a Stranger (Thing)?

Mars from Mars Global Surveyor

Editor’s Note: Astrobites is a graduate-student-run organization that digests astrophysical literature for undergraduate students. As part of the partnership between the AAS and astrobites, we occasionally repost astrobites content here at AAS Nova. We hope you enjoy this post from astrobites; the original can be viewed at astrobites.org.

Title: Mars as an Exoplanet: Lessons from a Planet at the Edge of Habitability
Authors: Stephen R. Kane et al.
First Author’s Institution: University of California, Riverside
Status: Published in PSJ

Mars in the Upside Down

If you’re a fan of Stranger Things like me, you’ll know of the Upside Down: a mirror world similar to our own, but with very different rules. Imagine Mars in the Upside Down, where it is no longer our next-door neighbor but a planet hundreds of light-years away. An astronomer on this Upside Down Earth would be looking at a distant speck with a transit signal barely distinguishable from noise. In this world, Mars would no longer be familiar but completely foreign, with unknown properties. Kane et al. suggest that treating Mars as if it were a stranger is a useful way to think about exoplanet science today.

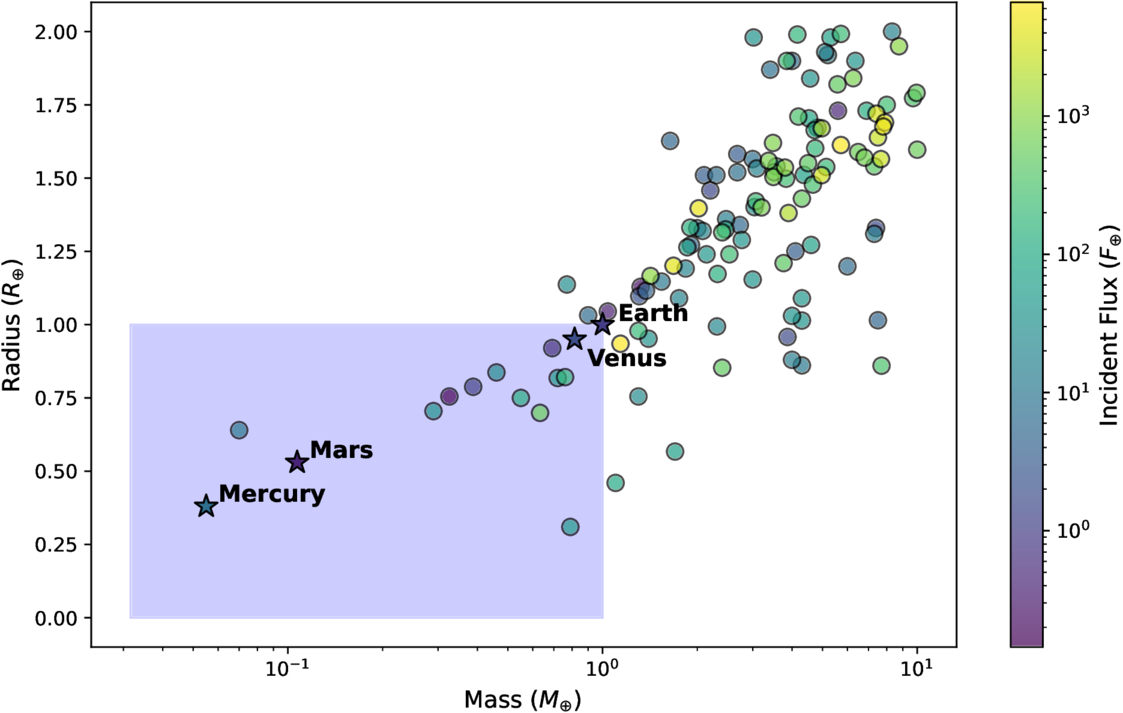
JWST is hunting for atmospheres on small rocky planets around other stars. However, only a select few Mars-like exoplanets have been discovered (Figure 1). This is because sub-Earth planets are small and hard to detect, testing the bounds of current technology. The ones that have been discovered, such as TRAPPIST-1h and Kepler-138b, were detected due to favorable geometry. They happen to orbit very close to a low-mass star or sit in resonant multi-planet systems, which amplify the signal we are looking for. True Mars analogs with low flux and moderate orbital periods remain out of reach. This is precisely what makes Mars itself so important scientifically — it is the only planet of this type we can study up close.

Plot of planetary radius versus planet mass, with symbols colored by incident stellar flux.

Figure 1: A plot of confirmed exoplanets by mass and radius. Most confirmed exoplanets are larger and more massive than Earth. Mars-like planets (dots in the blue box) are rare in confirmed exoplanet detections. [Kane et al. 2026]

Getting to Know Mars, Getting to Know All About Mars

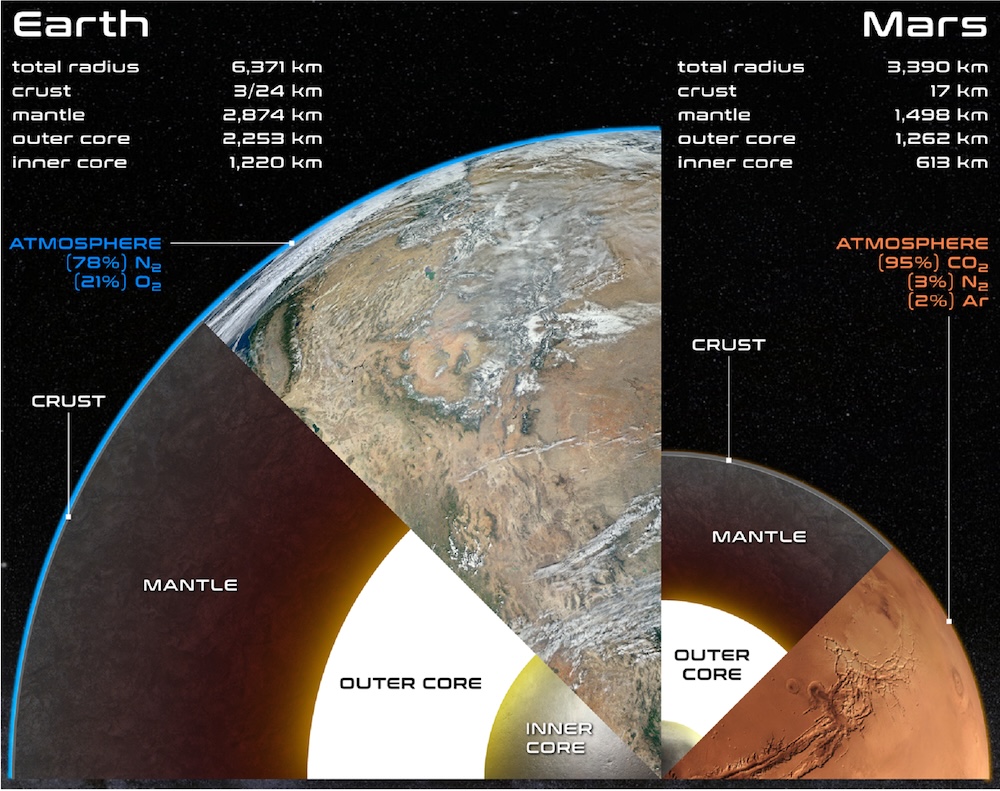
We know a lot about Mars in comparison to other planets thanks to rovers (such as Curiosity and Perseverance), atmospheric orbiters (such as Mars Atmosphere and Volatile EvolutioN and the Mars Orbiter Mission), and other science missions (Figure 2). We know it once had water features with neutral pH and favorable chemistry for life from sedimentary evidence at the Gale and Jezero craters. We know its atmosphere is 95% CO2 with a surface pressure less than 1% of Earth’s. We know it once had an active magnetic dynamo, but the dynamo died out about 4 billion years ago, leading to solar wind steadily stripping away Mars’s atmosphere over time.

Diagram showing Earth and Mars to scale

Figure 2: Earth and Mars to scale, showing their internal structures and atmospheres. Despite being neighbors, Mars is dramatically smaller with a thin CO2 atmosphere, similar to the planets JWST is struggling to characterize. [Kane et al. 2026]

But in the Upside Down, we would know none of this since Mars would be so distant. With current technology, this Upside Down Mars would be essentially undetectable using transit signals, radial velocity measurements, and spectrographs.

Beyond Our Backyard

JWST is currently studying the small rocky TRAPPIST-1 planets and is finding little evidence of atmospheres. The authors of today’s article explore the idea that these exoplanets are similar to Mars and perhaps are undergoing processes that strip away their atmospheres and create optimal conditions for life only for short durations. Using Mars as a blueprint, the authors show how we can better understand exoplanet processes, including volatile delivery and loss, photochemistry, climate evolution, obliquity forcing, planetary architecture, and intrinsic magnetism. For example, measurements of noble gases directly fingerprint Mars’s atmospheric escape process, and the authors argue these give us a calibration framework for interpreting future exoplanet spectra.

The upcoming Nancy Grace Roman Space Telescope’s microlensing survey will start revealing how common true Mars analogs actually are throughout the galaxy, while the future Habitable Worlds Observatory will attempt direct imaging of nearby candidates with unprecedented precision. Together, these missions will tell us whether Mars-like outcomes (brief habitability, catastrophic atmospheric loss, barren surfaces, etc.) are the default fate for small rocky planets. Interpreting that data will require the exact framework this article builds: one grounded in the only Mars analog we can study in detail.

Original astrobite edited by Sandy Chiu.

About the author, Ben Sherwin:

I am a physics PhD student and a National Science Foundation Graduate Research Fellow at Stanford University, working with Josh Frieman. I am interested in theoretical and observational cosmology, specifically in cross-correlations between the cosmic microwave background and tracers of large-scale structure.

The post What if Mars Were a Stranger (Thing)? appeared first on AAS Nova.

  •  

Can Arid Planets Keep Their Cool?

side-by-side images of Venus's surface today and an imagining of what its surface might have looked like in the past

Editor’s Note: Astrobites is a graduate-student-run organization that digests astrophysical literature for undergraduate students. As part of the partnership between the AAS and astrobites, we occasionally repost astrobites content here at AAS Nova. We hope you enjoy this post from astrobites; the original can be viewed at astrobites.org.

Title: Carbon Cycle Imbalances on Arid Terrestrial Planets with Implications for Venus
Authors: Haskelle T. White-Gianella and Joshua Krissansen-Totton
Authors’ Institution: University of Washington
Status: Published in PSJ

The Carbon-Cycle Thermostat

When discussing the habitability of planets, we usually focus on the habitable zone, the region around a star where a planet can host a temperature suitable for supporting liquid water on its surface. Yet, being in the right place doesn’t necessarily guarantee that a planet will be habitable.

A planet also needs the right atmospheric composition to sustain the necessary temperatures for hosting liquid water. A key mechanism found on Earth for maintaining this composition is the geologic carbon cycle, which acts as a built-in climate control system. This cycle begins with volcanic eruptions releasing carbon dioxide (CO2), which then dissolves in rainwater and forms a weak acid that weathers rocks on continents. The weathering products wash into oceans, where they form carbonate rocks, locking carbon away. Eventually, plate tectonics recycles some of that carbon back to volcanoes. The weathering process works faster when the planet is warmer, thus regulating the amount of CO2 and stabilizing the climate over long periods of time (but it should be noted that it can take up to a few hundred thousand years to rebalance this slow carbon cycle through the weathering process).

An important caveat is that the weathering process requires sufficient liquid water on the planet’s surface, so what happens in the case for planets with shallower oceans? Low-mass M dwarfs, the most common type of star found in the galaxy, are expected to host less-massive disks and therefore lower water inventories for forming planets. If more “dry” planets are indeed a more likely outcome of planet formation, we’d want to know how their arid conditions influence their long-term evolution and habitability.

Creating Carbon-Tracking Models

The authors built a model that tracks how water and CO2 move between a planet’s interior, oceans, and atmosphere over 4.5 billion years. The model notably includes the following:

  • A sophisticated weathering model that accounts for how runoff can limit rock weathering, improving upon previous models that only included a temperature dependence on weathering
  • Wind-driven evaporation limits that influence the amount of water evaporation in addition to sunlight-driven evaporation
  • Multiple deep water cycle parameterizations that explore how water moves between the interior and the surface

The model tests for four initial surface water inventories (0.1%, 1%, 10%, and 100% of Earth’s oceans) and then simulates how the surface water, atmosphere, and climate evolve over time.

A Critical Water Threshold

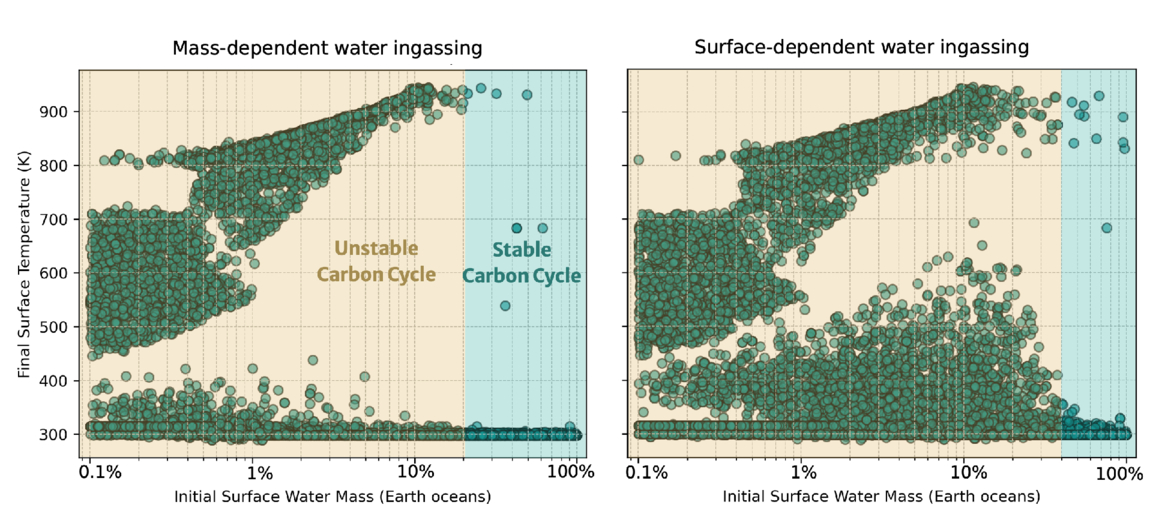
The models reveal that planets require at least 20–50% of Earth’s ocean mass to maintain a balanced carbon cycle. Below this threshold, the carbon cycle becomes unbalanced, leading to devastating consequences for habitability (Figure 1).

two plots of final surface temperature as a function of initial surface water mass

Figure 1: Final surface temperature after simulating 4.5 billion years of evolution as a function of initial water inventory for Earth-like planets. Each dot represents a model run with different assumptions (total carbon inventory, temperature dependence of weathering, soil age, etc.). The yellow region shows where most simulations result in uninhabitable surface temperatures from an unbalanced carbon cycle, and the cyan region shows where most simulations result in habitable surface temperatures and a balanced carbon cycle. The left and right plots show the results for two different parameterizations of the deep water cycle implemented in the model. [White-Gianella & Krissansen-Totton 2026]

For the more arid planets, models reveal a concerning runaway process. Limited surface water reduces precipitation and slows rock weathering. Weathering cannot keep up with volcanic CO2 release, causing CO2 buildup and warming of the atmosphere. The cycle repeats, driving runaway warming until all water evaporates.

Important Implications (Within and Outside Our Solar System)

Looking within the solar system, the results offer an explanation for how a potentially habitable Venus could have transitioned into its current inhospitable state. If Venus had formed with an initial water inventory below this critical threshold of 20–50% of Earth’s ocean mass, then its carbon cycle would have become unbalanced, creating the CO2 inferno seen on Venus today.

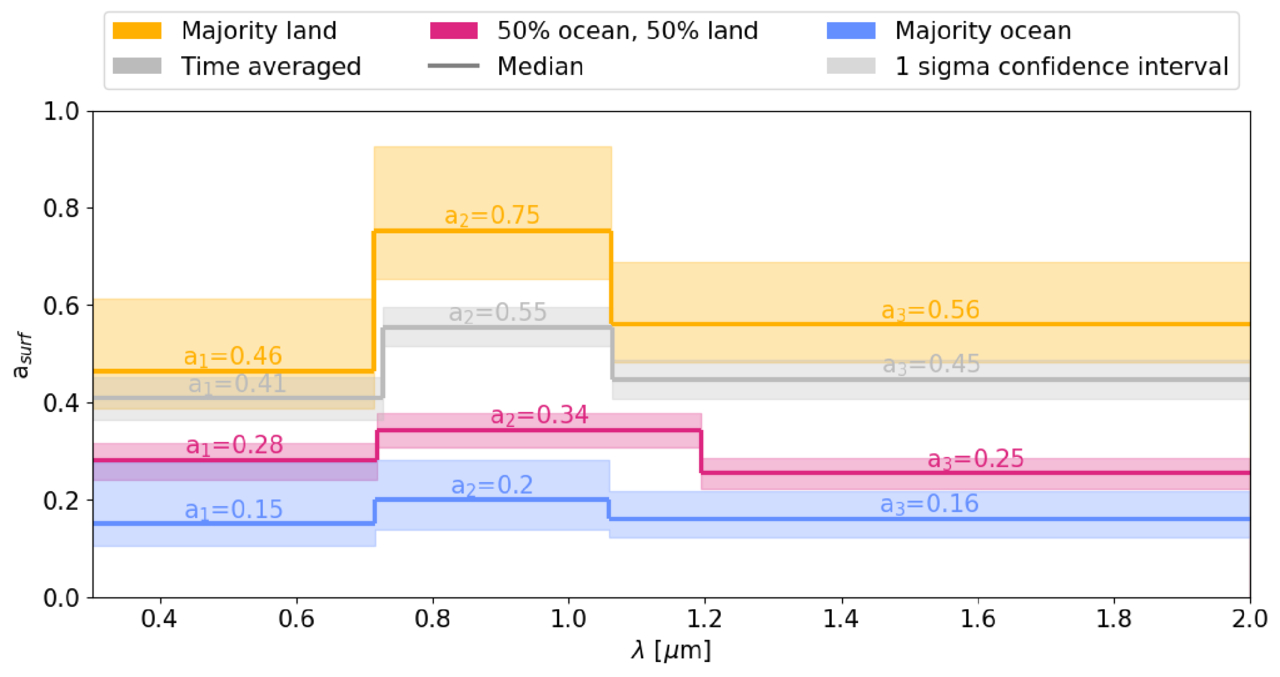
In future exoplanet studies, telescopes like the Habitable Worlds Observatory might detect ocean glint (specular reflection from liquid water) or measure land fraction from light curves. Finding a planet in the habitable zone but with limited ocean coverage would likely be bad news, as the planet could be quietly losing its grip on habitability. Astronomers may want to be more careful when looking at seemingly promising planets within their habitable zones.

Original astrobite edited by Natalie Price.

About the author, Jared Bull:

I am a 2nd-year PhD student at Johns Hopkins University. I study brown-dwarf variability and am interested in using time-series observations to uncover dynamic processes within their atmospheres. In my free time I like to read, cook, and do astrophotography.

The post Can Arid Planets Keep Their Cool? appeared first on AAS Nova.

  •  

Distant Galaxies: Dead or in Disguise?

distant starburst galaxies

Editor’s Note: Astrobites is a graduate-student-run organization that digests astrophysical literature for undergraduate students. As part of the partnership between the AAS and astrobites, we occasionally repost astrobites content here at AAS Nova. We hope you enjoy this post from astrobites; the original can be viewed at astrobites.org.

Title: MAGAZ3NE: Confirming Dust Deficiency and Quiescent Nature of Ultramassive Galaxies at 3 < z < 4 with ALMA Observations
Authors: Wenjun Chang et al.
First Author’s Institution: University of California, Riverside
Status: Published in ApJ

Distant galaxies offer a unique window into how stars, gas, and dust evolve over cosmic time. Tracing this evolution requires understanding not only how galaxies form, but also how and when they stop forming stars, a process known as quenching. Understanding how, when, and why galaxies quench is a fundamental question in astrophysics, and one that requires observations of star-forming, quenching, and fully quenched galaxies alike. Unfortunately, one complication is that identifying truly quenched galaxies is challenging: galaxies that appear “dead” may instead be actively forming stars, hidden behind a thick veil of dust.

In today’s article, the authors use observations from the Atacama Large Millimetre/submillimetre Array (ALMA) to investigate five ultramassive galaxies at redshifts, z, between 3 and 4, and ask a deceptively simple question: are these massive red galaxies genuinely quenched, or are they secretly forming stars behind the scenes?

Meet the Suspects: Ultramassive Galaxies at the Edge of Cosmic Noon

The five galaxies in this study are drawn from the Massive Ancient Galaxies at z > 3 NEar-infrared (MAGAZ3NE) survey, which targets some of the most massive galaxies known at early cosmic times. All five have stellar masses exceeding 100 billion solar masses and have been confirmed at z > 3. At these redshifts, we are observing the galaxies as they were when the universe was less than 2 billion years old. This is just before an epoch known as cosmic noon, when star formation across the universe reached its peak.

These galaxies also benefit from extensive multiwavelength observations from a range of observatories, including the ground-based Visible and Infrared Survey Telescope for Astronomy and the Spitzer Space Telescope. By combining imaging across wavelengths from the ultraviolet to the near-infrared, astronomers can measure the “colours” of galaxies and use these colours to infer the galaxies’ star-forming activity.

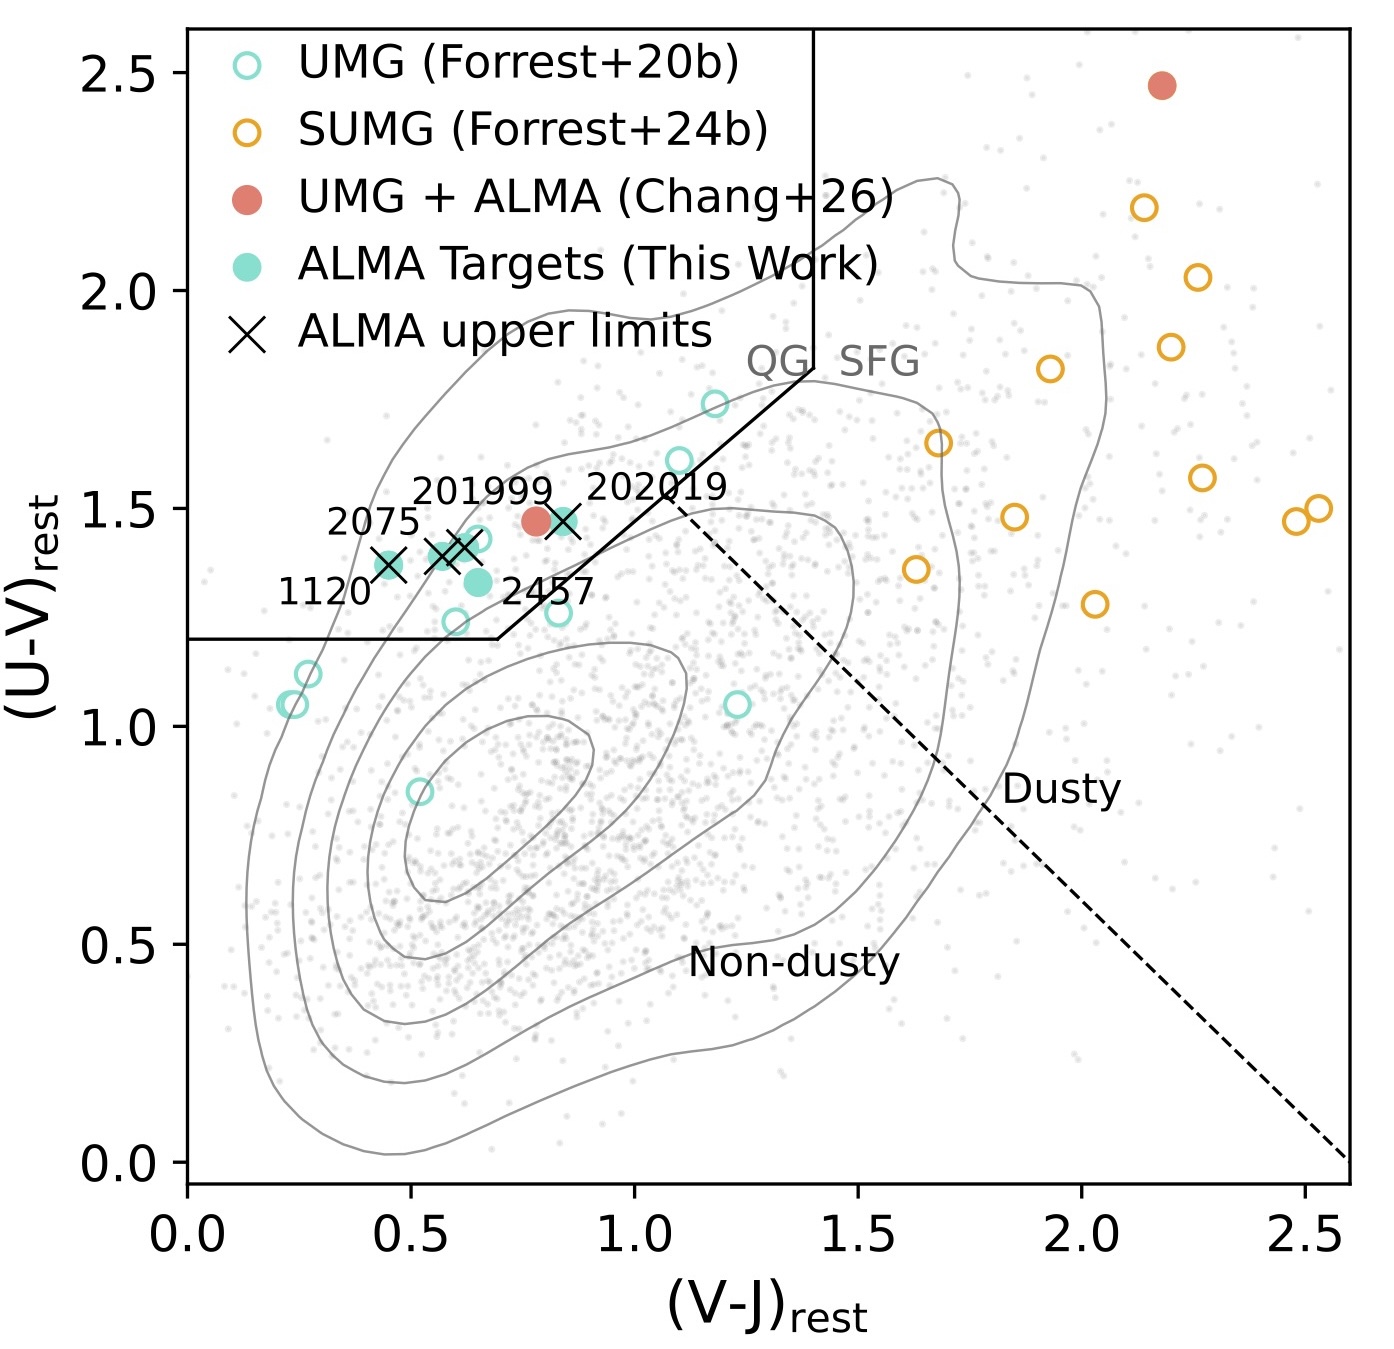
Galaxies that have quenched their star formation are dominated by older stellar populations, which makes them appear red (hence why they are often referred to as “red and dead” galaxies). However, dust can redden galaxies in a similar way by absorbing blue light and re-emitting it at longer wavelengths — meaning that a dusty, star-forming galaxy can easily masquerade as a quenched one. To uncover any hidden star formation, the authors turn to ALMA to search for far-infrared dust emission. The sample of galaxies investigated with ALMA is shown in Figure 1.

UVJ color–color diagram

Figure 1: UVJ colour–colour diagram, which uses galaxy colours in the ultraviolet (U), visible (V), and near-infrared (J) to identify quenched galaxies. The five ultramassive galaxies (UMGs) studied here (filled cyan circles) lie firmly in the quenched region (QG), consistent with a lack of ongoing star formation. Crosses indicate galaxies undetected in ALMA dust emission, while other massive galaxies at similar redshifts are shown in grey for comparison. [Chang et al. 2026]

ALMA on the Scene

ALMA observes light at sub-millimetre wavelengths, which at these redshifts traces emission from star-forming regions that are obscured by dust. Of the five ultramassive galaxies in this sample, only one is detected with ALMA. Even when the remaining four galaxies are stacked together, no dust emission is recovered, indicating that if any dust is present, it must be extremely faint.

To better quantify what these ALMA non-detections imply, the authors perform spectral energy distribution fitting (see a recent overview bite on spectral energy distribution fitting) using the Code Investigating GALaxy Emission, or CIGALE, a code that enforces energy balance between absorbed starlight and dust emission to estimate physical properties such as a galaxy’s star formation rate and dust content. With the ALMA constraints included, all five galaxies are found to lie more than 10 times below the star-forming main sequence. Even the single ALMA-detected galaxy remains formally quenched, showing only weak residual star formation.

In other words, these galaxies really are dead (or at least extremely dormant).

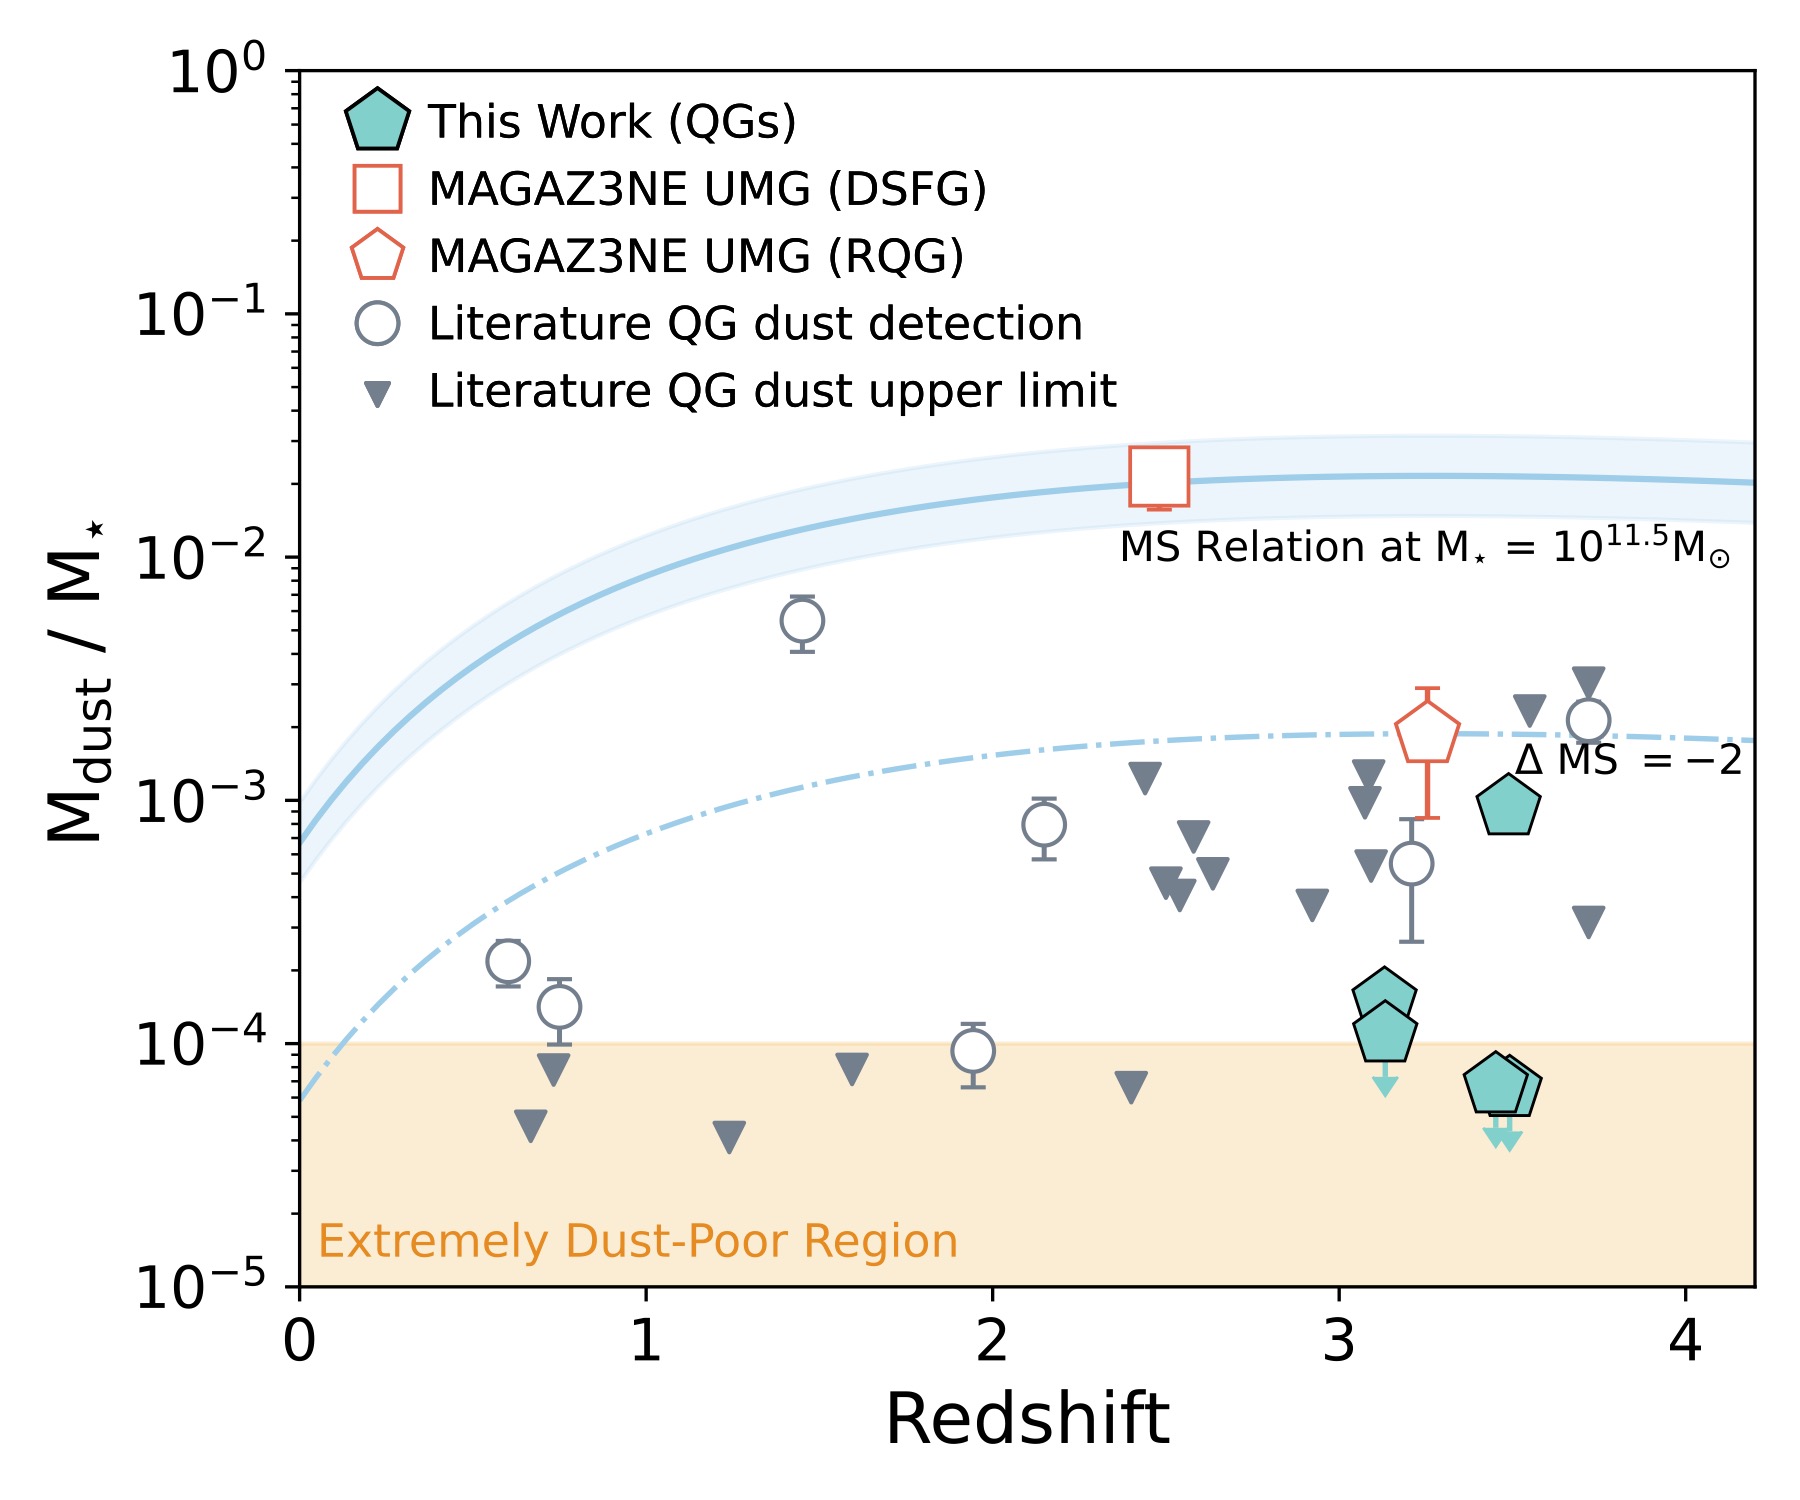
Extremely Dust-Poor Galaxies

The spectral energy distribution fitting also allows the authors to measure how much dust these galaxies contain relative to their stellar mass. This ratio provides a simple but powerful way to assess how much interstellar material remains in a galaxy — and therefore how much fuel is left for future star formation.

Three of the five ultramassive galaxies have ratios of Mdust/Mstar < 10-4 (Figure 2), placing them among the most dust-poor quenched galaxies confirmed at z > 3. The lone galaxy detected by ALMA contains slightly more dust, with Mdust/Mstar = 10-3, but even this is far below what would be expected for an actively star-forming galaxy. For comparison, typical star-forming galaxies at similar stellar masses host more than 100 times more dust.

Plot of dust-to-stellar mass ratio versus redshift

Figure 2: The ratio of dust mass to stellar mass versus redshift for massive quenched galaxies (QGs). This quantity measures how dust rich a galaxy is compared to its stellar mass. The ultramassive galaxies in this study (cyan pentagons) fall well below the dust content expected for star-forming galaxies (solid blue line), highlighting their extreme dust deficiency. [Adapted from Chang et al. 2026]

These results raise important questions about how galaxies can become ultramassive, quenched, and nearly dust-free within the first two billion years of cosmic history.

For now, ALMA has delivered a clear answer to the question of “dead or in disguise?”: at least some candidate ultramassive galaxies in the early universe really are quenched, and they are strikingly dust poor. By ruling out the dusty impostor scenario, this study shows that deep ALMA observations can cleanly distinguish genuinely quenched galaxies from dusty star-forming ones, even at the highest stellar masses and earliest cosmic times. How these galaxies lost their dust remains an open question, but one thing is clear: by the time cosmic noon arrived, some galaxies had already finished forming stars and quietly faded into dormancy.

Original astrobite edited by Viviana Cáceres.

About the author, Lucie Rowland:

I’m a fourth (and final!) year PhD student at Leiden Observatory in the Netherlands, studying massive, star forming galaxies in the early universe with ALMA and JWST. It’s a really exciting time to be interested in astronomy, so I hope to make groundbreaking new research more accessible!

The post Distant Galaxies: Dead or in Disguise? appeared first on AAS Nova.

  •  

A Wandering Supermassive Black Hole Eating a Star

disk of hot gas swirling around a black hole

Editor’s Note: Astrobites is a graduate-student-run organization that digests astrophysical literature for undergraduate students. As part of the partnership between the AAS and astrobites, we occasionally repost astrobites content here at AAS Nova. We hope you enjoy this post from astrobites; the original can be viewed at astrobites.org.

Title: The Wandering Supermassive Black Hole Powering the Off-Nuclear Tidal Disruption Event AT2024tvd
Authors: M. Guolo et al.
First Author’s Institution: Johns Hopkins University
Status: Published in ApJL

A Star Gets Eaten in the Wrong Neighborhood

We find supermassive black holes at the centers of most large galaxies. They end up there because of how galaxies form: as matter collapses and merges over time, material sinks to the gravitational center, and the black hole settles in.

So, what happens when we catch a star being ripped apart by a supermassive black hole that is not at the center of its galaxy?

That is exactly the puzzle posed by AT2024tvd, a tidal disruption event (TDE) spotted roughly 2,600 light-years from the center of a massive galaxy located 600 million light-years away from us (see Figure 1).

AT2024tvd from Hubble and JWST

Figure 1: A color image of AT2024tvd from the Hubble Space Telescope and JWST. The yellow dot inside the square marks the galaxy’s center, while the TDE is the white dot, which is visibly offset to the upper left, about 2,600 light-years away. [Adapted from Guolo et al. 2026]

We see TDEs when a black hole tears apart a star that gets too close to it. It happens because the black hole’s gravity pulls harder on the near side of the star than the far side, stretching the star until it comes apart. The stellar debris then forms a hot accretion disk, a ring of material swirling around the black hole that spirals inward and releases a burst of electromagnetic energy across many wavelengths — from visible light to X-rays. These events are valuable to astronomers because they briefly light up black holes that would otherwise be invisible, giving us a rare window to measure their properties. Since supermassive black holes live at galactic centers, that is also where we expect TDEs to happen, which makes a TDE found away from a galactic center rare and puzzling. The galactic center is often called the nucleus of a galaxy, so astronomers refer to these displaced events as “off-nuclear” TDEs. AT2024tvd is only the third known off-nuclear TDE, and this research article makes a strong case that it is the most remarkable one yet.

Measuring Mass Using Light

To figure out the mass of the black hole responsible for AT2024tvd, the authors needed to get creative. You cannot weigh a black hole directly, so astronomers have to work backward from what they can see. The key idea is that a black hole’s mass controls how its accretion disk behaves. A more massive black hole produces a larger, cooler disk, while a less massive one produces a smaller, hotter disk. By measuring how bright the disk is at different wavelengths and how hot it gets, you can figure out how massive the black hole must be.

The authors did this by modeling the light the event produced across many wavelengths. They combined data from several telescopes: the Zwicky Transient Facility, the Neil Gehrels Swift Observatory, Pan-STARRS, and two rounds of high-quality X-ray data from XMM-Newton. TDE light curves go through different phases. The early flare in visible and ultraviolet light is bright but complicated, and the physical processes behind it are not fully understood. But after a few hundred days, TDEs settle into a quieter “plateau phase,” where the ultraviolet and visible light come directly from the accretion disk. At this stage, the emission follows well-understood physics, and astronomers can model it reliably.

The authors used a model called kerrSED, which describes the spectral energy distribution (SED) of a spinning black hole’s accretion disk (kerr). It accounts for the disk’s temperature, its physical size, the black hole’s spin (how fast it rotates), and the angle at which we are viewing the system. It also accounts for a process called Comptonization, where hot electrons near the black hole boost lower-energy photons (particles of light) up to X-ray energies. By fitting this model to the observed light at multiple wavelengths simultaneously, the authors could pin down the disk properties and extract the black hole mass. The result was a clean fit: the disk model alone could explain all the observed light during the plateau phase, with nothing significant left over (see Figure 2).

brightness evolution of AT2024tvd

Figure 2: The brightness of AT2024tvd measured across a wide range of wavelengths, after correcting for absorption and the galaxy’s motion. The symbols show individual measurements from different telescopes, while the shaded contours represent the best-fit disk model and its uncertainty. Left: The early X-ray data, which is well explained by emission from the hot inner accretion disk. Right: The later data covering both visible/ultraviolet light and X-rays, all consistently explained by the same disk model. [Adapted from Guolo et al. 2026]

Not an Intermediate, but a Supermassive Black Hole

From their fit, the authors found a black hole mass of about one million solar masses. Black holes above about 100,000 solar masses are considered supermassive, while those below that threshold but above about 100 solar masses are called intermediate-mass black holes. So, this puts AT2024tvd in the supermassive category. This matters because the two previously known off-nuclear TDEs, called 3XMM J2150-05 and EP240222a, were both powered by intermediate-mass black holes. Those black holes were found inside small, dense collections of stars called ultra-compact dwarf galaxies that were orbiting larger host galaxies.

AT2024tvd is different. When the authors looked at deep images of the location where the TDE happened, they found no star cluster or small galaxy there. Whatever group of stars once surrounded this black hole has been almost entirely pulled apart by the gravity of the much larger parent galaxy. The ratio of the black hole’s mass to the mass of any remaining stars around it is extreme: greater than 3%, which is far above what we normally see. This is the signature of a “wandering” supermassive black hole, one that was brought in during a past galaxy merger and has been slowly sinking toward the center of its new host ever since, losing its surrounding stars along the way.

The authors compared AT2024tvd to other TDEs using established relationships between accretion disk properties and black hole mass (Figure 3). In terms of its disk temperature, luminosity, and inferred mass, AT2024tvd behaves like a typical nuclear TDE powered by a supermassive black hole. However, when placed on the black hole mass versus host stellar mass relation, it stands out as a strong outlier. The black hole mass is far too large for the small amount of surrounding stellar mass detected at its location.

plot of black hole mass versus host galaxy mass

Figure 3: AT2024tvd (yellow star) plotted on the relationship between black hole mass and host galaxy stellar mass. Red squares show nearby galaxies with dynamically measured black hole masses plotted against galaxy bulge stellar mass, while blue squares show the relation using total galaxy stellar mass. Purple points and green diamonds represent nuclear TDE host galaxies with black hole masses inferred from different TDE modeling techniques. Yellow diamonds mark the two previously known off-nuclear TDEs. AT2024tvd stands out as a clear outlier, with a very high black hole mass compared to the upper limit on any surrounding stellar mass. [Guolo et al. 2026]

The Big Picture

This discovery matters for several reasons. It shows that off-nuclear TDEs are not limited to intermediate-mass black holes sitting in small satellite galaxies. Some are powered by fully supermassive black holes that have been displaced from their original galactic centers. It also shows that TDE modeling, when done carefully during the plateau phase of the light curve (when the emission is dominated by well-understood accretion disk physics), can provide reliable black hole masses on its own, without assuming any relationship between the black hole and its host galaxy. This is particularly important for wandering black holes, where those relationships do not apply.

Looking ahead, upcoming surveys like Vera C. Rubin Observatory’s Legacy Survey of Space and Time are expected to find many more off-nuclear TDEs. Combined with X-ray follow-up from telescopes like XMM-Newton, these events could become our main tool for mapping out the population of displaced black holes in the nearby universe. One disrupted star at a time, we are starting to find black holes that theory told us should exist but that had, until now, stayed hidden.

Original astrobite edited by Kelsie Taylor and Veronika Dornan.

About the author, Serat Saad:

Serat is a first-year PhD student in astronomy at The Ohio State University. His research is on stellar and galactic dynamics, where he uses observational data to understand gravity. He also has interests in active galactic nuclei and tidal disruption events.

The post A Wandering Supermassive Black Hole Eating a Star appeared first on AAS Nova.

  •  

Black Holes Reveal Their Seeds

Illustration of an active galactic nucleus

Editor’s Note: Astrobites is a graduate-student-run organization that digests astrophysical literature for undergraduate students. As part of the partnership between the AAS and astrobites, we occasionally repost astrobites content here at AAS Nova. We hope you enjoy this post from astrobites; the original can be viewed at astrobites.org.

Title: A GLIMPSE of Intermediate Mass Black Holes in the Epoch of Reionization: Witnessing the Descendants of Direct Collapse?
Authors: Qinyue Fei et al.
First Author’s Institution: University of Toronto
Status: Published in ApJ

In the late 2010s, astronomers were getting hints of something strange going on in the early universe. Using the most powerful telescopes on the ground, we were able to find black holes in the centers of some of the most distant galaxies. The light from these active galactic nuclei (AGNs) was emitted over 12 billion years ago, revealing conditions close to the beginning of cosmic time.

To an astronomer, that’s the mundane part. I’m only half joking — thousands of AGNs had already been identified in the previous half century. However, the most distant of these sources were startling because their central black holes appeared much more massive than expected. To be specific, we know how much mass black holes can start with, and we can write down equations to predict how quickly they should grow. The AGNs we observed seemed to violate these predictions. This raised some serious questions and was highlighted as a major point of inquiry to focus on going into the 2020s.

Then JWST launched, and the mystery grew deeper. No matter where we looked, enormous black holes kept cropping up in astonishing numbers. Astronomers who model the universe with equations and computer simulations have tried to explain these results, but this has been a serious challenge. Some researchers have broken the emergency glass and reached for a highly theoretical tool: the direct-collapse black hole. Unlike the normal pathway for forming black holes (the deaths of massive stars), this model suggests that an enormous cloud of gas could directly collapse into a black hole without forming a star at all. The resulting black holes could have as much mass as a hundred thousand Suns put together — orders of magnitude more than a “normal” black hole. Although this pathway can explain the presence of huge black holes so early in the universe’s history, we’ve never directly seen this happen, so for now it remains just a theoretical possibility.

However, if direct-collapse black holes were widespread at early times, there is one indirect signature we might be able to detect: a large population of intermediate-mass black holes with masses between a hundred thousand and a million times that of the Sun. If we can find such a population, we’ll have strong evidence for the direct-collapse model. Let’s go looking!

Intermediate Mass, Impossible Difficulty

Identifying intermediate-mass black holes requires a tricky combination of spectral resolution and sensitivity. Light from an object must be examined very finely in order to detect the telltale features of an intermediate-mass black hole. However, these sources are already quite faint, so spreading their emission this thin means that any potential signal is very likely to get lost in the noise.

The authors of today’s article use an unprecedented set of observations to leap over this hurdle and directly probe intermediate-mass black holes. They not only use the most sensitive spectroscopic instrument (NIRSpec) on the most powerful space telescope (JWST), but they take advantage of a phenomenon known as gravitational lensing.

According to Einstein’s general theory of relativity, gravity is the result of matter curving spacetime. Areas with more concentrated matter will experience stronger curvature. When an object traveling in a completely straight line moves through curved space, its path appears bent. This same effect happens to light. Intriguingly, a large concentration of matter can redirect diverging rays of light to a focus, acting like an enormous magnifying glass.

Astronomers take advantage of gravitational lensing by pointing telescopes at massive clusters of galaxies. The intense gravity of these regions can magnify sources in the background by tens or even hundreds of times. Galaxies that would be impossibly faint to see under normal conditions can thus be observed if they are strongly lensed, making this a powerful technique to examine otherwise hidden objects.

Putting Faint AGNs Under a Lens

The Galactic Legacy Infrared Mid-Plane Survey Extraordinaire (GLIMPSE) program took extremely powerful observations of a galaxy cluster called Abell S1063 using JWST. The long exposure time, combined with the lensing power of the cluster, allows extremely faint sources in the background to be seen in unprecedented detail. The researchers scoured the data to search for signs of active black hole growth in the observed galaxies. Specifically, they carefully studied the emission lines in the spectrum of each object.

Normally, emission lines appear narrow. However, gas surrounding a massive black hole circulates at rapid speeds. A phenomenon known as the Doppler effect then comes into play. This is the same effect responsible for the characteristic rise and fall in the pitch of a siren from an emergency vehicle passing by. Emission from gas moving toward our line of sight appears bluer than it otherwise would, and gas moving away from us appears redshifted. The net effect is that a single emission line is widened, and we see characteristic “broad wings.” The width of the emission line can be used to estimate the mass of the central black hole, where broader wings imply a more massive black hole.

The researchers uncover 10 AGNs that display broadened Balmer series lines. Strikingly, they estimate that these galaxies have central black holes with masses as low as 400,000 times that of the Sun. While that might sound like a lot, it’s practically nothing compared to the monstrous 100-million-solar-mass black holes that JWST consistently turns up in other studies. Detecting such lightweight black holes, pushing into the realm of intermediate-mass black holes, is only possible due to the incredible sensitivity of these observations.

The researchers also compute what’s known as the black hole mass function. This is a measure of how many black holes exist at each mass. In other words, the black hole mass function measures how common lightweight black holes are compared to heavy ones. The mass function computed in this work and several other points of comparison are shown in Figure 1.

comparison of black hole mass functions

Figure 1: A comparison of black hole mass functions from various previous works and today’s article. The red hexagons are data points computed using the AGNs observed in this work, while blue circles and yellow squares are measurements computed using AGNs observed in previous articles. The red, green, and blue shaded areas represent the expected black hole mass function from various theoretical models. [Adapted from Fei et al. 2026]

Because the AGNs analyzed in today’s article host central black holes with much lower masses than any that have been observed in the past (at this early time in the universe), the authors are able to probe a completely new region of the black hole mass function. As seen in Figure 1, the leftmost red hexagon (lowest-mass data point) deviates from the roughly straight line traced by the other data points. This suggests that there are substantially more black holes with a few hundred thousand solar masses than previously expected.

Amazingly, this is exactly the measurement you would get if direct-collapse black holes (the hypothetical kind of massive black holes mentioned earlier in this article) were common in the early universe. If you scatter huge seeds across a large field, then you shouldn’t be surprised to see a sea of barely larger plants a few months later. Likewise, since these black holes start off so massive, they only need to grow a tiny bit to reach the threshold of that first red hexagon.

So is this proof that the early universe was filled with direct-collapse black holes, with this study probing the tip of an astonishing iceberg? It’s too early to tell for sure. While this is certainly an exciting result that sheds light on a previously unexplored population of objects, one can only do so much with a sample size of 10. More follow-up observations will be needed to measure the black hole mass function more precisely. Still, it’s amazing to think how much has changed in just a few years. JWST continues to provide unprecedented insight into some of the most breathtaking questions in all of astronomy.

Original astrobite edited by Tori Bonidie.

About the author, Ansh Gupta:

I’m an astronomy graduate student at the University of Texas at Austin working with Steven Finkelstein. I use data from JWST to study the formation and growth of the first galaxies and black holes in the universe. In my spare time, I enjoy playing piano, reading, and making YouTube videos.

The post Black Holes Reveal Their Seeds appeared first on AAS Nova.

  •  

Shining a Light on the Shadowy Movements in Saturn’s Rings

Editor’s Note: Astrobites is a graduate-student-run organization that digests astrophysical literature for undergraduate students. As part of the partnership between the AAS and astrobites, we occasionally repost astrobites content here at AAS Nova. We hope you enjoy this post from astrobites; the original can be viewed at astrobites.org.

Title: Dynamics of Planetary Rings Under Thermal Forces
Authors: Wen-Han Zhou et al.
First Author’s Institution: The University of Tokyo
Status: Published in ApJL

If you ask anyone what their favourite planet is, the answer you’ll most likely hear is Saturn. Why? Why else than the beautiful and intricate ring system surrounding the gas giant. The other gas and ice giants in our solar system — Jupiter, Uranus, and Neptune — have ring systems themselves but none quite as striking as Saturn’s. Would it surprise you to learn that astronomers’ best models have not yet totally explained why Saturn’s rings look the way they do?

In contrast, it may not surprise you to hear that people have been trying to explain the rings for as long as we have seen them with telescopes. We now know that planetary rings are collections of relatively small particles (think micrometre up to metre sized), most likely having once been the material of a larger body that was disrupted either by collisions or tidal forces. This material, due to the gravity of its local planet, is sculpted into a flat disc where more subtle interactions then lead to substructure forming within the disc such as gaps and ringlets. Many of these substructures are explained by well-understood physics — for example gaps being carved by embedded moonlets or resonances sculpting ring edges — though there remain some outstanding problems in our understanding.

The authors of today’s article set their sights on the problematic inner edge of Saturn’s A ring (Figure 1). They describe some mechanisms — namely the collisions of micrometeoroids within the rings — by which a sharp ring edge can be maintained, but there exists a gap in the understanding of how such an edge can form in the first place. All hope is not lost, though, as today’s authors reintroduce a physical process they call the “eclipse–Yarkovsky” effect, which seems to explain these phenomena.

horizontally sliced Saturn's rings

Figure 1: A horizontally sliced image of Saturn’s rings shows the rich substructure and gaps within the various rings. Saturn, which is not shown here, would be to the left of the image. The authors of today’s article are particularly concerned with the bright and sharp inner (left side) edges of the A and B rings. Click to enlarge. [NASA/JPL/Space Science Institute]

Billions of Rocket-Powered Bumper Cars

The idea behind this process revolves entirely around light. When sunlight hits a particle within a planetary ring, non-absorbed sunlight imparts a little “bump” onto a particle, ever so slightly altering its trajectory. At the same time, some of the sunlight is absorbed into the particle, which heats it up; light is soon re-emitted via thermal radiation, which, again, can slightly change the trajectory of these tiny particles. From a point on the surface of each ring particle (see rightmost side of Figure 2), the photons from this thermal radiation are all emitted in random directions; however, across the whole surface of the particle there is a net force! These tiny particles are spinning, and so the side just near “sunset” is hottest and emitting the most thermal photons. In this way, the pressure from the sunlight plus the thermal radiation of each particle imparts a net torque on the ring itself which changes the angular momentum of the ring.

diagram showing sunlight falling on Saturn and the planet casting a shadow on its rings

Figure 2: Starlight is the main source of light onto the particles that make up a planetary ring (right panel) though reflected light from the planet’s surface hits it too. This light “heats up” the ring and forms an asymmetry as the ring is eclipsed by the planet, which produces a net force. [Zhou et al. 2026]

What we described just then is essentially solar radiation pressure plus the Yarkovsky effect. It turns out that the net force from this process typically averages out to zero as the ring particles orbit around the planet. This assumes, though, that the sunlight is constantly shining on the ring. Stunning imagery of Saturn tells us that this isn’t the case, so what happens when we take into account the shadow cast on the ring from the planet? Today’s authors find that the net effect induces a positive change in angular momentum of the ring particles, which they call the eclipse–Yarkovsky effect.

After today’s authors detailed all of the math involved in this process (and there is a lot), they put it into practice to try to help explain Saturn’s curious rings. Including the eclipse–Yarkovsky effect together with other known effects that drive ring evolution allowed them to reproduce the optical depth profile (how thick the ring looks) of Saturn’s A ring better than ever before (notably the sharp inner edge in Figure 3). On top of this, the effect provides another avenue for moonlet formation in the outer edges of ring systems as the positive torque from the effect drives material out toward and away from the Roche limit.

plot of optical thickness versus radius

Figure 3: The authors try to explain the current structure of Saturn’s A ring by initialising it with a Gaussian profile of optical thickness versus radius (black dot-dashed line) and evolving it for 81 million years under different effects. When viscous effects are included (blue dashed line), the ring spreads out, but it’s only when the eclipse–Yarkovsky (EY) effect is included (red line) that the model closely matches the observed data (grey line). [Zhou et al. 2026]

Undeniably useful for Saturn, the eclipse–Yarkovsky effect may also explain some other conundra in the solar system. Mars may have once had rings, which are thought to have eventually clumped together to form the inner moon Phobos. This idea is problematic, though, in that current models suggest there should still be some residual ring system around Mars even after Phobos formed. Enter the eclipse–Yarkovsky effect: being 100 times stronger for Mars than Saturn (due to its more intense incident sunlight), the effect may have driven out and dispersed that residual ring altogether. While the authors are currently looking into this possibility, the reintroduction of the eclipse–Yarkovsky effect has already shown great promise for our most beautiful ringed planetary neighbour.

Original astrobite edited by Wasi Naqvi.

About the author, Ryan White:

I am a first-year PhD student at Macquarie University in Australia, working mainly on binary/multiple systems with massive stars (Wolf–Rayets in particular!). Outside of study, I’m probably drinking coffee, baking, reading, or going for a run. You can also find me procrastinating on Bluesky @astroryan.bsky.social.

The post Shining a Light on the Shadowy Movements in Saturn’s Rings appeared first on AAS Nova.

  •  

The First Starspot Spectrum Revealed by JWST

M-dwarf star with starspots

Editor’s Note: Astrobites is a graduate-student-run organization that digests astrophysical literature for undergraduate students. As part of the partnership between the AAS and astrobites, we occasionally repost astrobites content here at AAS Nova. We hope you enjoy this post from astrobites; the original can be viewed at astrobites.org.

Title: A Panchromatic JWST Spectrum of a Giant Starspot on the Fully Convective M Dwarf TOI-3884
Authors: C. A. Murray et al.
First Author’s Institution: University of Colorado Boulder
Status: Published in ApJ

We often picture stars as smooth, glowing spheres, as if they’ve been run through an Instagram filter. But real stars have spots: cooler, darker regions on a star’s surface caused by strong magnetic fields.

Annoyingly, these spots can seriously interfere with how we study exoplanet atmospheres.

How to Probe a Planetary Atmosphere

Planetary atmospheres are often probed through transmission spectroscopy. When a planet transits its star, some starlight passes through the planet’s atmosphere before reaching us. We can distinguish the light that has passed through the planet’s atmosphere by comparing the star’s light in transit versus out of transit. In doing so, we can isolate the atmospheric spectrum and look for absorption features of species like water or oxygen.

Easy, right?

How Starspots Get in the Way

Things get more complicated once we stop thinking of the star as if it’s been smoothed out by an Instagram filter. Starspots are cooler than the surrounding stellar surface, which means they emit a different spectrum. They are also constantly changing: new spots can form, old ones can disappear, and the star’s rotation carries them in and out of view. This changes things.

First of all, your star’s spectrum changes over time, which could mean that the star’s spectrum out of transit is not the same as the star’s spectrum during transit. On the other hand, the planet may transit across a starspot instead of a “normal” stellar region. In this case, the light we measure during the transit is affected by the spot, and it is no longer accurate to directly compare it with the overall stellar light outside the transit.

Ultimately, absorption features that we thought were from the planetary atmosphere could actually be coming from starspot contamination instead.

Starspot Models: Our Solution?

To deal with this, astronomers build starspot models, where they vary the spots in terms of the following:

  • The surface covering fraction: this parameter tells us how much of the stellar surface is covered in spots
  • The temperature contrast: this parameter tells us how much cooler (in ratio) the spot is compared to the rest of the stellar surface, and by proxy how much dimmer

These models are promising, but how do we know that we have chosen the right parameters?

A Unique Laboratory: TOI-3884

The TOI-3884 system is a unique laboratory for testing our starspot models. As seen in Figure 1, it has very convenient starspot geometry, with a large starspot located close to its pole. On top of that, we observe this star almost completely pole-on, which means that we always see this starspot, no matter how much the star rotates. To top this all off, the star hosts a close-in planet, which orbits the star from pole to pole.

Illustration of the TOI-3884 system

Figure 1: Illustration of the TOI-3884 system. The pole (and rotation axis) of the star is indicated with a black “x,” indicating that we see the star almost pole-on. The polar starspot is indicated in grey, and the transiting planet TOI-3884b is indicated in black. Different dates are shown, illustrating how the system evolves over the span of a few weeks. [Adapted from Mori et al. 2025]

The planet transits the star, and as it does so, it always passes over the polar starspot. This gives us a rare opportunity to probe the spectrum of a starspot. Similar to how we can use normal in/out of transit observations to probe a planetary atmosphere, we can now compare the observations during/after a “starspot transit” to probe the starspot region. Today’s authors do exactly this using six different transit observations from JWST.

So… How Good Are Our Models?

From the JWST observations, the authors extract a starspot spectrum for the first time. Figure 2 shows this as the spot contrast (how much dimmer the spot is than the surrounding stellar surface) plotted across different wavelengths. To see how well our models are doing, they compare this observed spectrum to two commonly used starspot models. The difference between the data and the models (the residual) is plotted in the lower panel.

spectrum of TOI-3884’s starspot.

Figure 2: The spectrum of TOI-3884’s starspot. The y-axis in the upper panel, the spot contrast, indicates how much dimmer the starspot is compared to the “normal” stellar surface. Different observations taken with JWST are indicated in different colored crosses, and other previous observations are overplotted in various other shapes. Model starspot spectra are shown in dashed or dotted black lines. The residuals between the model spectra and the JWST observations are shown in the bottom panel. [Adapted from Murray et al. 2026]

At wavelengths longer than about 1 micron, in the near-infrared regime, things look good! The residuals stay small, meaning the models do a solid job reproducing the observations. But move left into shorter wavelengths, in the optical regime, and the agreement quickly falls apart. The residuals grow, and it becomes clear that the models are missing something.

There’s still work to be done before we can confidently probe planetary atmospheres at optical wavelengths without worrying about stellar contamination, and this observed starspot spectrum provides a unique benchmark to test future starspot models. For now, the near-infrared remains a safer and more reliable window for planet atmosphere studies.

Original astrobite edited by Natalie Price.

About the author, Elise Koo:

I’m a PhD student at the University of Amsterdam, working to detect magnetic interactions between stars and their planets using radio and spectroscopic observations. Outside of research, I like to try out a variety of sports.

The post The First Starspot Spectrum Revealed by JWST appeared first on AAS Nova.

  •  

Life on the (Red) Edge

Earth in visible and near-infrared light

Editor’s Note: Astrobites is a graduate-student-run organization that digests astrophysical literature for undergraduate students. As part of the partnership between the AAS and astrobites, we occasionally repost astrobites content here at AAS Nova. We hope you enjoy this post from astrobites; the original can be viewed at astrobites.org.

Title: Retrieving the Red Edge on Earth-Like Planets with Heterogeneous Clouds and Surfaces
Authors: Zachary Burr et al.
First Author’s Institution: Jet Propulsion Laboratory; ETH Zurich
Status: Published in ApJ

In the next 25 years, astronomers could find signs of life on other planets with the launch of the Habitable Worlds Observatory. Atmospheric signs of life, known as atmospheric biosignatures, are how astronomers currently search for life on other planets. Figure 1 shows examples of atmospheric biosignatures with pictures of each chemical’s origin on Earth. Before E.T. can phone home, though, we have to understand what chemicals make up a planet’s atmosphere. To do this, astronomers can use spectroscopy to observe a planet’s atmosphere in different wavelengths and measure the types and quantities of chemicals present.

biosignatures in Earth's atmosphere

Figure 1: Atmospheric biosignatures present in Earth’s atmosphere. More abundant biosignatures include oxygen and ozone (byproducts of photosynthesis in plants and bacteria) and nitrous oxide (byproduct of bacteria that don’t need oxygen to survive). Less abundant biosignatures include isoprene (released from the breakdown of leaves that have fallen from trees) and sulfur gases (byproducts of cyanobacteria). [Kaz Gary]

There are many ways to observe the spectrum of a planet, but the one you’re probably most familiar with is transmission spectroscopy. You can learn more about transmission spectroscopy of exoplanet atmospheres and how to model transmission spectra with these bites: 1, 2, 3. However, all of the current techniques for exoplanet spectroscopy (including transmission spectroscopy) measure the star’s light and how the planet affects the star’s light. This means it’s heavily dependent on how we model the star’s light to indirectly observe the planet’s light. The only way to take the spectrum of a planet directly is with direct imaging: the technique that the future Habitable Worlds Observatory will use to find signs of life in planetary spectra.

But are atmospheric biosignatures the only way to tell if life exists on other planets? Short answer: absolutely not. Let’s take Earth as an example. If we imagine Earth as a directly imaged exoplanet and take spectra of the light it reflects, you’ll find that around near-infrared wavelengths (~700 nanometers or just past the red part of the visible light spectrum), the light reflected off of Earth increases sharply. This sharp increase is called the vegetation red edge and is caused by plant and ocean life on Earth’s surface as shown in Figure 2. This is made possible because chlorophyll (the thing that makes plants green) absorbs nearly all visible light but reflects near-infrared light. The vegetation red edge is an example of a surface biosignature. In today’s article, the authors determine if the vegetation red edge will be visible in spectra of Earth-like exoplanets!

Spectra of different sources of the vegetation red edge

Figure 2: Spectra of different sources of the vegetation red edge on Earth. The vegetation red edge is highlighted in gray where the spectra rapidly increase and then level off beyond the visible light part of the spectrum. Each color represents a different source with pictures of each source on the right-hand side of the plot. [O’Malley-James and Kaltenegger 2019]

Snapshots

Planets rotate; that’s how we have morning, noon, and night in 24 hours guaranteed. This means that different parts of the surface will be visible at different times when we take spectra. Sometimes, we may see more ocean than land, other times not. To determine if the vegetation red edge would be visible at all points in Earth’s day, the authors simulated nine different spectra of modern-day Earth representing nine snapshots of Earth’s rotation. Additionally, they also simulated a time-averaged spectrum that shows an entire Earth day in one snapshot without the time variability. These spectra are shown in Figure 3.

Spectra of a directly imaged modern-day Earth at nine different times in its rotation

Figure 3: Spectra of a directly imaged modern-day Earth at nine different times in its rotation. The y-axis is the ratio of the planet’s signal to the star’s signal and the x-axis is wavelength in microns. Each color represents a time in UTC and the black curve represents the time-averaged spectrum. [Burr et al. 2026]

The authors then run retrieval models on all nine spectra to see if the vegetation red edge would be detectable in each spectrum, including the time-averaged one. Retrieval models take into account characteristics of the planet that would affect how light moves through its atmosphere, such as the atmospheric chemicals present and the surface gravity. They then use this information to generate possible spectral models that could fit the data. The best-fit model allows astronomers to infer what the atmosphere is made of and properties of the planet such as surface gravity. Because we are looking at Earth in visible light, much of the light from the planet is reflected. Typically, models of Earth-like planets in visible wavelengths only include atmospheric albedo: the measure of how reflective a planet’s atmosphere is. However, surface biosignatures can also be reflective as shown by the vegetation red edge. The authors use this to their advantage and introduce a surface albedo into their model that changes with the amount of desert, vegetation, and ocean visible on Earth’s surface at that time. They then further divide the nine spectra into three different types based upon the visible surface: majority land; 50% land, 50% ocean; and majority ocean. Check out the article online to see a cool animation of the Earth rotating and how the spectrum looks different at each time!

Arr! There Be… Vegetables?

After running the models, the authors were able to detect a sharp increase in the surface albedo value in every spectrum, including the time-averaged one. This result is shown in Figure 4. The authors take this result one step further in order to validate that the vegetation red edge is actually a result of surface variation of vegetation. They re-run models on each of their spectra but instead include a constant surface albedo instead of a time-varying one. This resulted in incorrectly measured radii, chemicals, and surface gravity in nearly all of the models. Without the vegetation red edge and surface features, the models could not accurately determine if life was present on Earth.

Retrieved surface albedos for the nine time-varying spectra

Figure 4: Retrieved surface albedos for the nine time-varying spectra. The surface albedo is broken down into three different values (a₁, a₂, a₃). Each of these values represents a change in the surface albedo at different wavelengths (i.e., how reflective the surface is at three different wavelengths). The nine spectra were broken down by the amount of surface that was visible at that time and color-coded for each category. The time-averaged spectrum is shown in gray. Each category of spectra was able to retrieve an increase in reflected light from the surface at vegetation red edge wavelengths. The spectra that had the majority land visible have the biggest increase in the surface albedo. This makes sense since the amount of visible vegetation is the largest with majority-land planets. [Burr et al. 2026]

For the first time (to the author’s knowledge), the vegetation red edge has been shown to be a promising and observable biosignature in Earth-like atmospheres. This study has also laid the groundwork for future work on other surface biosignatures and their potential impact on spectra of habitable planets. Confirming signs of life in multiple different ways, both on the surface and in the atmosphere, will finally allow astronomers to say we are not alone in the universe. In fact, life likes to live on the (red) edge!

Original astrobite edited by Madison VanWyngarden.

About the author, Kaz Gary:

I am a fourth-year PhD candidate at The Ohio State University with a passion for planets. My current work focuses on modeling exoplanet observations for the Habitable Worlds Observatory and understanding planetary atmospheres. Outside of research, I help develop planetarium shows and love all forms of science communication. In my free time, I enjoy playing tabletop RPGs, painting, watching terrible reality TV, and hanging out with my pet hedgehog.

The post Life on the (Red) Edge appeared first on AAS Nova.

  •  

I Spy with My Large Binocular Eyes: A Dusty Torus Around a Supermassive Black Hole?

NGC 4151

Editor’s Note: Astrobites is a graduate-student-run organization that digests astrophysical literature for undergraduate students. As part of the partnership between the AAS and astrobites, we occasionally repost astrobites content here at AAS Nova. We hope you enjoy this post from astrobites; the original can be viewed at astrobites.org.

Title: Shocks, Winds, and a Torus: The Large Binocular Telescope Interferometer (LBTI) Resolves the Active Nucleus of NGC 4151
Authors: Jacob W. Isbell et al.
First Author’s Institution: University of Arizona
Status: Published in ApJ

At the centre of nearly every galaxy lies a supermassive black hole that dominates this innermost region. Not only is there this millions-of-solar-masses dark beast, but usually too a whole bunch of stuff — stars, gas, dust, and more — which is often quite bright! When there is plenty of this material quite close to the black hole, we believe physics takes control to flatten it into a family of disk and toroidal structures in what we call the unified model of active galactic nuclei (AGNs; see Figure 1).

schematic of the unified model of active galactic nuclei

Figure 1: The unified model of AGNs asserts that there is an inner accretion disk, surrounded by a dusty torus that cohabitates with clouds moving at different velocities (the so-called broad and narrow line regions), and sometimes even relativistic jets extending from the accretion disk to galactic scales; you can read more about AGN structure in this Astrobites guide. [Emma Alexander; CC BY 4.0]

When astronomers look at different active galaxies (read: galaxies with active supermassive black holes at their core), we see a range of phenomenologies related to their brightness, spectra, morphologies, and more. The unified model of AGNs seeks to explain these different AGN appearances simultaneously by positing that they all have the same physical structure, and we are just viewing them from different angles, hence seeing different features.

The cores of AGNs are often imaged at the smallest scales (e.g., their accretion disks, viewed with interferometers like the Very Large Telescope Interferometer) and the largest scales (e.g., their relativistic jets, viewed with radio interferometers), but comparatively less effort has gone to directly observing the predicted dusty tori in the mid-infrared. That is exactly what today’s authors set out to do using the Large Binocular Telescope Interferometer (LBTI) — a pair of 8.4-metre-aperture mirrors separated by just over 14 metres and combined to simulate a telescope effectively 29 metres wide. This lets astronomers take direct images at a much higher resolution than a smaller-aperture telescope, and hence directly peer into the region around AGNs where this dusty torus should lie.

Today’s authors turn the LBTI towards NGC 4151, a medium-luminosity AGN. With the large effective aperture of the LBTI, they were able to resolve scales in the AGN region as small as 4.4–9.1 pc, about 14–30 light-years depending on the wavelength (see Figure 2), in the mid-infrared. These observations revealed warm dust emission in a complex structure around the central supermassive black hole. The authors note a central bar at all wavelengths, with a significant extension of cool dust arcing to the west (right in the image) and warmer dust localised to the centre (as evident by 3.7- and 4.8-micron emission only nearest to the supermassive black hole and its accretion disk).

deconvolved images of the AGN core of NGC 4151

Figure 2: The deconvolved images of the AGN core of NGC 4151 show a very bright central source (the innermost region around the supermassive black hole), as well as some complex surrounding structure particularly at long wavelengths. The interpreted morphology is described in Figure 3. These images are deconvolved, meaning that known optical effects are corrected for on the raw data to produce a sharper image. [Adapted from Isbell et al. 2026]

To explain the observed morphology in Figure 1, the authors compare three different interpretations based on this new high-resolution imagery together with the results of previous studies looking at other scales and the spectrum of the AGN core. Each interpretation is illustrated and briefed in Figure 3.
illustration of the different regions surrounding NGC 4151's black hole and potential interpretations for the observed morphology

Figure 3: Three interpretations of the observed morphology are presented by the authors. The left panel illustrates the different regions surrounding the supermassive black hole (together with the results of other studies cited in the article). The right panel shows the suggested interpretations explaining the morphology. [Isbell et al. 2026]

The first interpretation is in keeping with the unified model of AGNs: a geometrically and optically thick torus of dust surrounds the inner region. In this interpretation, the surface of the dusty torus re-radiates light from the accretion disk to produce most of the mid-infrared emission. Additional mid-infrared emission could come from localised concentrations of gas or interactions between the outflow and the jet. The authors immediately disfavour this explanation, as other studies have shown bright ionised emission at the location of the would-be torus, which is not expected if an optically thick torus were to be present. Hence, these new observations somewhat challenge the one “flavour” of the unified model of AGNs.

The second interpretation aligns with a different version of the unified model: one in which a geometrically thin disk replaces a thick torus around the AGN core. Provided the disk is optically thin too, the authors favour this approach as it is consistent with the geometry of ionised emission that worked against the first interpretation. While other studies suggest that this thin disk should be optically thick, this morphology is at least better aligned with what we see in other AGNs.

The third interpretation suggests that the emission comes from only the radiation pressure–driven wind emanating from the AGN core. The authors disfavour this explanation, citing previous radiative transfer simulations that show that the flux should fall off with distance from the core too quickly to be consistent with the observations.

No matter the interpretation, these LBTI observations are an important glimpse into the future of mid-infrared AGN studies that will be done with 30-metre-class telescopes (such as the European Southern Observatory’s Extremely Large Telescope). This article, together with the group’s similar study on NGC 1068, is challenging and refining an accepted view of AGN morphology — the consequences of which apply to galaxies near and far — and poses new questions perfect for sophisticated hydrodynamic and radiative simulations.

Original astrobite edited by Margaret Verrico.

About the author, Ryan White:

I am a first-year PhD student at Macquarie University in Australia, working mainly on binary/multiple systems with massive stars (Wolf–Rayets in particular!). Outside of study, I’m probably drinking coffee, baking, reading, or going for a run. You can also find me procrastinating on Bluesky @astroryan.bsky.social.

The post I Spy with My Large Binocular Eyes: A Dusty Torus Around a Supermassive Black Hole? appeared first on AAS Nova.

  •  

Hunting for Exomoons Around a Lonely Planet

illustration of an exoplanet and exomoon around a star

Editor’s Note: Astrobites is a graduate-student-run organization that digests astrophysical literature for undergraduate students. As part of the partnership between the AAS and astrobites, we occasionally repost astrobites content here at AAS Nova. We hope you enjoy this post from astrobites; the original can be viewed at astrobites.org.

Title: A Deep Search for Exomoons Around WISE 0855 with JWST
Authors: Mikayla J. Wilson et al.
First Author’s Institution: University of California, Santa Cruz
Status: Published in AJ

The “Moon”-umental Question

The solar system hosts hundreds of moons, ranging from volcanic worlds like Io around Jupiter, to icy objects like Enceladus around Saturn, to captured objects like Neptune’s retrograde moon Triton. Moons are essential to our model of how the solar system formed and also offer some of the best chances we have for finding life beyond Earth.

Astronomers also expect exomoons, or moons orbiting planets outside the solar system, to be abundant around other giant exoplanets. But how common are exomoons? How do they compare to the moons in our solar system?

In order to begin answering those questions, we must first detect an exomoon, which has proved difficult despite decades of searching by astronomers. Fortunately, JWST presents a new opportunity to uncover the exomoon population by looking at lonely free-floating planets as they drift through space.

Why Free-Floating Planets?

One proposed method for searching for exomoons is by looking for their transits in front of their host planets, characterized by the dips in brightness of the planet as the moon passes in front, blocking the planet’s light. Looking for exomoon transits around planets orbiting stars is quite difficult, as the bright starlight can easily drown out the small signals of exomoon transits. Free-floating planets solve this issue by removing the star entirely, increasing our sensitivity to such detections. (See this bite for a good review.)

The authors of today’s article directed the exomoon hunt towards the free-floating WISE J085510.83-071442.5 (or WISE 0855). It has the prestige of being the coldest known brown dwarf (250–285K) while also sitting at a relatively low mass (3–10 Jupiter masses). Notably, it is also one of our closest neighbors at a distance of only 7.4 light-years, making it ideal for high-precision observations despite its faintness. Even though brown dwarfs are technically distinct from planets, the authors opt to refer to companions around WISE 0855 as moons given WISE 0855’s “planetary-mass” status. (It’s complicated…)

Repurposing JWST Data… for Moons!

The JWST observations used in this study contain 11 hours of near-infrared (2.87–5.27 microns) time-series spectra originally intended to study water clouds and weather on WISE 0855. Time-series brightness monitoring can also be used for transit searches, which the authors take advantage of.

One complication is that WISE 0855 is variable, meaning its intrinsic brightness changes over time. Variability is likely driven by clouds and other dynamic processes within its atmosphere. So how do the authors distinguish between a passing moon and a turbulent atmosphere? The key idea is that variability is wavelength dependent, meaning that the brightness of WISE 0855 will fluctuate differently depending on the observed wavelength. In contrast, transits are “gray,” meaning that the same amount of light is blocked at all wavelengths, producing a consistent feature across the entire spectrum.

Finding Moons with Statistics!

The authors apply this idea and pick out two wavelength regions of WISE 0855’s spectrum that contain two distinct variability patterns, which should both contain an identical moon transit signal (if present). They then generate a light curve (how brightness changes over time) for these two regions (see Fig. 1).

WISE 0855 light curves

Figure 1: (A) Light curves from two selected wavelength regions of WISE 0855’s spectrum with injected transit signals. Also plotted is the best-fit Gaussian processes + transit model for the two light curves. (B) Light curve data after subtracting the Gaussian processes portion of the best-fit model, revealing the example injected transit signals. [Wilson et al. 2025]

To appropriately model the variability, the authors employ Gaussian processes, a flexible tool that can model complex, quasi-periodic signals like atmospheric variability. They compare fits from two types of models:
  • Gaussian processes–only model: Assumes that all observed variability is intrinsic to the planet itself
  • Gaussian processes + transit model: Includes a simple trapezoidal exomoon transit signal that is simultaneously fit in both light curves

Using Bayesian evidence (a measure of how well each model explains the data), they determined which model was favored. So, what do they find?

The Bad News and the Good News

Based on Bayesian evidence, the authors conclude that there are no statistically significant detections of exomoons in the data. The results suggest very weak evidence for a ~0.53-Earth-radius moon at a wide separation from WISE 0855 — an unlikely scenario given that transit probability decreases at greater separations (and therefore longer orbital periods).

Yet, the study goes further: What kinds of moons is JWST able to detect, if any? To answer this, the authors performed injection and recovery tests, where they injected artificial transit signals of varying depths (exomoon sizes) into the data and tested how well their models were able to recover them (results shown in Fig. 2). They find that JWST is capable of detecting 96% of transits with depths ≥0.5%, equivalent to a Titan-like moon. Smaller Io-like moons were also detectable more than half of the time. This means that if a Titan analog had actually transited during these observations, we would almost certainly have seen it!

plot of successful detections of injected transit signals

Figure 2: Results showing the number of successful detections for the transit injection and recovery tests. Fifty transit injections are done for transit depths of 1%, 0.5%, 0.4%, 0.3%, 0.2%, and 0.1%. The transit depths represent different exomoon sizes, with the shaded regions representing Io-like and Titan-like moons. [Wilson et al. 2025]

JWST will continue to gather more time-series data of free-floating planets, brown dwarfs, and directly imaged exoplanets, each providing a new opportunity to help us better understand the moon population outside of our solar system. We’re still waiting for the first confirmed exomoon, but when that transit finally happens, we know that JWST will be ready.

Original astrobite edited by Kelsie Taylor.

About the author, Jared Bull:

I am a 2nd-year PhD student at Johns Hopkins University. I study brown dwarf variability and am interested in using time-series observations to uncover dynamic processes within their atmospheres. In my free time I like to read, cook, and do astrophotography.

The post Hunting for Exomoons Around a Lonely Planet appeared first on AAS Nova.

  •  

Feed the Fire, Fade the Metals

galaxy cluster MACS J1149.5+2223

Editor’s Note: Astrobites is a graduate-student-run organization that digests astrophysical literature for undergraduate students. As part of the partnership between the AAS and astrobites, we occasionally repost astrobites content here at AAS Nova. We hope you enjoy this post from astrobites; the original can be viewed at astrobites.org.

Title: Metal-Poor Star-Forming Clumps in Cosmic Noon Galaxies: Evidence for Gas Inflow and Chemical Dilution Using JWST NIRISS
Authors: Vicente Estrada-Carpenter et al.
First Author’s Institution: Arizona State University
Status: Published in ApJ

If you want to reconstruct a galaxy’s life story, one of the best “fossil records” is its metallicity. In astronomy this refers to the abundance of elements heavier than helium, which are made in stars and returned to a galaxy’s gas through winds and supernovae. Over time, more star formation usually means more metals mixed into the gas.

Now zoom to Cosmic Noon (roughly when the universe was most actively forming stars). Many galaxies in this epoch look “clumpy”; their star formation is concentrated in several bright knots scattered across the disk. The big question is where those clumps come from. Do they form from the galaxy’s own gas via internal disk instabilities, or do they light up when fresh, metal-poor gas flows in and both fuels star formation and dilutes the local metallicity?

The authors try to answer that question with JWST by measuring the metallicity of each clump relative to its immediate surroundings, rather than comparing clumps to a single galaxy-wide number (which can be misleading if the galaxy has a metallicity gradient).

They use JWST/Near Infrared Imager and Slitless Spectrograph (NIRISS) slitless grism spectroscopy from the CAnadian NIRISS Unbiased Cluster Survey (CANUCS) to study 20 lensed galaxies at redshift 0.6 < z < 1.35. (Lensing effectively acts like a zoom lens, helping to resolve smaller structures.) They focus on emission lines that trace star-forming gas, especially Hα (a star formation tracer) and sulfur lines [SII] and [SIII] (needed for their metallicity method).

Slitless spectra come with a headache: because there is no slit, different parts of a galaxy can overlap in the dispersed image. To make reliable emission-line maps from slitless data, the authors use a forward-modeling code called Sleuth, which allows the continuum to vary across the galaxy.

The authors identify clumps using the Hα map together with rest-frame ultraviolet imaging because these tracers are sensitive to star formation on different timescales: Hα highlights gas ionized by the youngest massive stars, while ultraviolet light traces young stellar light over longer periods. As a result a clump can be bright in one and not the other, especially if dust is involved.

To estimate gas-phase metallicity, they use the “strong-line” method, which infers metallicity from ratios of bright emission lines calibrated using models and empirical samples. Their main diagnostic is S23 = ([SIII] + [SII]) / Hα. Because some line ratios also depend on the ionization state (how strongly the gas is being ionized by young stars), they also use the sulfur ratio S32 = [SIII]/[SII] as a check and iterate to a self-consistent solution.

So, Are Clumps Really Chemically Different from Their Surroundings?

For each clump, the authors measure the metallicity inside the clump and compare it to an annulus just outside the clump (masking neighboring clumps to avoid mixing). When they plot “clump metallicity” versus “local disk metallicity,” most points fall below the 1-to-1 line, meaning the clumps are more metal poor than their surroundings (Figure 1). The mean offset is about 0.1 dex, which corresponds to roughly 20% dilution in the clump gas.

plot of gas-phase metallicity in star-forming clumps compared against metallicity of nearby disk regions

Figure 1: Each point compares a star-forming clump’s gas-phase metallicity to the metallicity of the nearby disk region immediately surrounding it. If clumps and disks had the same metallicity, they would lie on the dashed 1-to-1 line. Instead, most clumps sit below it, showing a typical ∼0.1 dex metallicity deficit, consistent with local chemical dilution. (The solid red line shows a best-fit linear trend to the clump measurement.) [Adapted from Estrada-Carpenter et al. 2025]

An extra wrinkle is that the galaxy medians hint at two populations: some galaxies have clumps with small offsets (near the 1-to-1 line), while others show larger offsets. The authors suggest this could mean two formation pathways, one dominated by internal gas reservoirs (smaller offsets) and another where inflow of metal-poor gas plays a bigger role (larger offsets). They are careful, though, as the sample is still small.

If inflow is really the driver, you should expect a link: the more strongly a clump is forming stars relative to its surroundings, the more diluted its metallicity should be. That is exactly what the authors find. The clumps that are most boosted in star formation are also the most metal diluted.

The article also emphasizes that clumps are not chemically uniform blobs. In at least one detailed example, the peaks in Hα (highest star formation) coincide with local minima in metallicity along a cut through the galaxy (Figure 2), suggesting internal star formation rate and metallicity gradients that reinforce the same story, intense star formation goes hand in hand with lower metallicity in the clump regions.

galaxy image showing spatial variation of H alpha and metallicity

Figure 2: Example galaxy from this study illustrating the clump-scale link between star formation and metallicity. The color image shows the galaxy with a rectangular strip marking the region used for a 1D cut. In the bottom panel, the turquoise line shows the Hα flux (a tracer of recent star formation), while the white line shows the metallicity along the same cut. Peaks in Hα flux line up with local dips in metallicity, showing that the brightest star-forming clumps are also the most chemically diluted compared to nearby regions. [Adapted from Estrada-Carpenter et al. 2025]

Are These Clumps Really “In Situ,” or Could They Be Small Satellites?

A reasonable alternative is that some clumps are actually small companion galaxies projected onto the disk. These could also look metal poor, because low-mass galaxies tend to be low metallicity. The authors look for evidence using face-on systems and find that more massive clumps tend to sit closer to galaxy centers, which is consistent with in-situ clumps that form in the disk and migrate inward, though it does not rule out satellites. They argue that kinematics from JWST/NIRSpec IFU will be needed for a definitive separation.

Why This Matters

Gas inflow, star formation, and feedback, together known as the baryon cycle, are key drivers of how galaxies grow. What this article adds is a spatially resolved view that compares each clump to its local environment, showing that regions of elevated star formation also tend to be locally metal poor. That pairing is hard to explain as a simple metallicity gradient or a galaxy-wide averaging effect, and it is exactly what you would expect if at least some clumps are being fueled by relatively metal-poor inflows. In short, these clumps may be snapshots of galaxies refueling in real time.

Original astrobite edited by Ryan White.

About the author, Niloofar Sharei:

I’m an astronomy PhD candidate at UC Riverside studying how galaxies grow through star-forming clumps. I track how these clumps emerge, evolve, and sometimes survive long enough to reshape their galaxies. When I’m not thinking about cosmic blobs, I’m reading, hiking, or listening to Bach.

The post Feed the Fire, Fade the Metals appeared first on AAS Nova.

  •  

The Oldest Starlight

illustration of stars in the early universe

Editor’s Note: Astrobites is a graduate-student-run organization that digests astrophysical literature for undergraduate students. As part of the partnership between the AAS and astrobites, we occasionally repost astrobites content here at AAS Nova. We hope you enjoy this post from astrobites; the original can be viewed at astrobites.org.

Title: Hunting for the First Explosions at the High-Redshift Frontier
Authors: Junehyoung Jeon et al.
First Author’s Institution: The University of Texas at Austin
Status: Published in ApJ

Back in the 1920s, astronomers discovered that we live within just one of many, many galaxies in the big, wide universe. Since then, we’ve been racing to search for the most distant galaxy that can be observed — in other words, searching for the oldest starlight we can see, since the light from these distant sources has been travelling towards us for most of the age of the universe. (Remember: more distant = higher redshift = longer lookback time.)

This race to the redshift frontier has had a pretty eventful history (see a great overview video here), which became even more eventful with the launch of JWST. JWST rapidly smashed the previous redshift (z) record of z = 10.6 by discovering a galaxy at z = 13.2, and then it broke its own record twice more. The current title holder sits at z = 14.4, observed less than 300 million years after the Big Bang.

Several galaxy candidates (to date unconfirmed) have now even been proposed at z ~ 25–32 (e.g., Capotauro), only 100 million years after the Big Bang! If real, these sources would pose a serious challenge to our understanding of the formation of the first galaxies, as galaxies shouldn’t really be observable at such early times. In today’s article, the authors put forward an intriguing alternative: what if some of these ultra-high-redshift candidates aren’t galaxies at all, but transient explosions from the universe’s first stars?

The First Stars and Their Explosive Endings

The earliest generation of stars (Population III; see my previous bite on these here) formed from pristine hydrogen and helium gas. Without metals to cool the gas efficiently, theory predicts that these stars were extremely massive, often exceeding 100 solar masses. While such stars would be short-lived, their deaths could be spectacular.

Population III stars of sufficient mass are predicted to end their lives as hyper-energetic pair-instability supernovae (PISNe). This is a long-winded name for a rapid, intensely hot explosion that leaves no remnant behind — not even a trace of the pre-existing star. Whilst nothing would remain of the star, the light emitted in that explosion could be bright enough to masquerade as a high-redshift galaxy candidate in current JWST surveys, but only if three key conditions are met:

  1. JWST must observe a sufficiently overdense region, where lots of Population III stars can form very early.
  2. A PISN must occur while JWST is “watching.”
  3. The explosion must be bright enough to rise above JWST’s detection limits.

Simulating a (Biased) Universe

To address the likelihood of these conditions having already been met by existing JWST observations, the authors turn to cosmological simulations. Rather than simulating an “average” patch of the universe, they focus on an extremely overdense region (Fig. 1). This creates a rare but important environment where structures collapse earlier than usual. These regions are exactly where large numbers of Population III stars are expected to form at the highest redshifts.

projection of the gas density in the simulated overdense region at z = 30.4

Figure 1: A projection of the gas density in the simulated overdense region at z = 30.4. The densest structures stand out clearly, tracing the locations where the first stars are able to form. Black dots mark newly formed groups of stars, while the most massive dark matter halo in the region is highlighted with an orange circle. The figure illustrates that in such an unusually dense patch of the early universe, star formation can already be underway just 100 million years after the Big Bang, creating the conditions needed for early Population III stars and their explosive deaths. [Adapted from Jeon et al. 2026]

In their simulations, star formation begins as early as z ~ 30–40 (within the first hundred million years after the Big Bang), producing Population III stars and, by extension, potential PISNe very shortly afterwards. While such overdense regions are rare, the authors show that the total area already surveyed by JWST (including large surveys such as CEERS, JADES, PRIMER, and COSMOS-Web) is large enough that it is plausible JWST has already observed at least one such region.

Catching a Cosmic Explosion in the Act

So, we can tick off condition #1: it’s possible that a sufficiently overdense region has already been observed by JWST. Next up, how lucky do we have to be to catch an explosion in the act (condition #2), so to speak? For this condition, cosmic time dilation actually works in our favour. A PISN explosion at z > 20 that lasts only months in its own rest frame can last for decades in the observed frame. (This whole time-being-relative thing sounds wacky because it is — please join me, Neil deGrasse Tyson, and countless others in struggling to imagine this.)

But would any such explosion be bright enough (condition #3)? Using theoretical PISN spectra, the authors show that these explosions could reach observed magnitudes of ~28–29 at z ~ 30 — right at the depth of current JWST deep surveys (Fig. 2). In fact, the predicted brightness and colours are somewhat comparable to those of some proposed z ~ 30 candidates (Fig. 3), raising the possibility that these objects could be PISNe rather than galaxies.

plot of predicted PISN brightness

Figure 2: This plot compares the predicted brightness of PISNe originating from different types of extremely massive stars to the depth reached by existing JWST surveys, showing that these explosions could remain detectable for ~20 years at peak brightness in the observed frame. [Jeon et al. 2026]

Theoretical PISNe spectra compared to a proposed z = 32 source

Figure 3: A comparison of theoretical PISNe spectra with the observed photometry of one proposed z ≈ 32 source (Capotauro). The coloured curves show model spectra for PISNe originating from extremely massive stars, at different stages of the explosion, while the data points represent the observed brightness of the high-redshift candidate across multiple JWST filters. [Jeon et al. 2026]

So… Are We Seeing the First Stars Die?

It’s not time to throw a party just yet. The authors note there are several caveats and uncertainties. The nature of Population III stars is still highly uncertain, JWST does not continuously monitor the same patch of sky, and identifying a PISN at such high redshift would be extremely challenging. Thanks to time dilation, these explosions would fade very slowly, making them hard to distinguish from steady sources using photometry alone. Alternatively, there are other plausible explanations for these ultra-high-redshift candidates: lower-redshift interlopers (a rather infamous example is CEERS-93316), local brown dwarfs, or even nearby exoplanets.

Still, the idea is exciting. If JWST were to detect a genuine PISN at z > 20, it would represent a direct glimpse of the very first stars, pushing observational astronomy into truly uncharted territory. For now, the most distant explosions in the universe may already be hiding in JWST images; we just have to learn how to recognise them.

Original astrobite edited by Nathalie Korhonen Cuestas.

About the author, Lucie Rowland:

I’m a fourth (and final!) year PhD student at Leiden Observatory in the Netherlands, studying massive, star forming galaxies in the early universe with ALMA and JWST. It’s a really exciting time to be interested in astronomy, so I hope to make groundbreaking new research more accessible!

The post The Oldest Starlight appeared first on AAS Nova.

  •  

A Possible GLIMPSE of the Universe’s First Stars

Population III stars

Editor’s Note: Astrobites is a graduate-student-run organization that digests astrophysical literature for undergraduate students. As part of the partnership between the AAS and astrobites, we occasionally repost astrobites content here at AAS Nova. We hope you enjoy this post from astrobites; the original can be viewed at astrobites.org.

Title: GLIMPSE: An Ultrafaint ≃105 M⊙ Pop III Galaxy Candidate and First Constraints on the Pop III UV Luminosity Function at z ≃ 6–7
Authors: Seiji Fujimoto et al.
First Author’s Institution: University of Toronto; The University of Texas at Austin
Status: Published in ApJ

You, me, your laptop, my $8 matcha, and just about everything else on Earth was forged in the fiery bellies of dying stars. Generations of stars had to live and die before the universe became enriched with any elements heavier than helium (what astronomers call “metals”). The first stars to undergo this cosmic cycle are known as Population III (Pop III) stars. Though their existence has been hypothesized since the 1960s, astronomers have failed to observe these distant metal-free stars or the faint, low-mass galaxies that host them.

The first Pop III stars likely formed around 100 million years after the Big Bang in pristine pockets of hydrogen gas. Although these are too distant for us to observe, we expect that as the universe started to become metal enriched, there were still existing pockets of gas introverted enough to survive unpolluted and form metal-free Pop III stars up to a redshift of z ~ 6–7 (when the universe was around 900 million years old)!

JWST is the perfect instrument to search for these systems. You can read other astrobites on the search for possible Pop III systems with JWST here and here. The authors of today’s article seek to develop the most efficient way of using JWST’s Near-Infrared Camera (NIRCam) to find the galaxies hosting Pop III stars. Using their selection method on existing NIRCam data, the authors identified one promising Pop III galaxy candidate.

I’m Not Like Other Galaxies

In order to find a Pop III galaxy, we need to take a look at galaxies’ spectral energy distributions (SEDs). These are graphs that show the energy emitted by a galaxy at different wavelengths of light. Pop III galaxies are expected to have SEDs that differ from your everyday, metal-enriched galaxy. NIRCam will be especially sensitive to three key spectral features that show up in the SEDs of Pop III galaxies: an absent [O III] line (light emitted by doubly ionized oxygen atoms), a strong H-alpha line (light emitted when a hydrogen atom transitions from its third to its second energy level), and a significant Balmer jump (light absorbed to ionize electrons in the second energy level of a hydrogen atom). To identify these key SED characteristics, the authors use SED fitting and color–color diagrams to execute an efficient Pop III search with NIRCam.

The first selection method involves SED fitting. Astronomers create template SEDs that represent different types of galaxies and then compare these templates to the observed SEDs to see which one matches best. In this work, the authors use metal-rich galaxy templates and Pop III templates to fit the galaxies observed with NIRCam. They then calculate the chi-squared χ2 (a statistical measure of best fit) between the data and all the SED templates. A galaxy is selected as a Pop III candidate if the Pop III model provides a good fit (χ2 < 10) to the photometry and is significantly better than any metal-rich model. It’s kind of like looking for Cinderella by making every woman in the kingdom try on the glass slipper.

A color-color diagram showing how Pop III models lie in a different parameter space than metal-rich galaxies.

Figure 1: Color–color diagram for selecting Pop III galaxies where the x and y-axes show the different NIRCam filters being subtracted. The cyan symbols are different Pop III models while the other colored dots are different metal-rich galaxy models. [Adapted from Fujimoto et al. 2025]

A color–color diagram plots the difference in magnitude between two filters on each axis. NIRCam filters are specially chosen to emphasize the SED characteristics above. When these filters are chosen, Pop III galaxies occupy a distinct region of this diagram as compared to metal-rich galaxies. For example, subtracting the F356W filter from the F277W filter is sensitive to the presence of the [O III] line and the Balmer jump. Figure 1 demonstrates how this color selection separates Pop III galaxies from typical galaxies.

O Pop III, Pop III, Wherefore Art Thou?

The authors apply their fresh new selection criteria to publicly available NIRCam data from large surveys. And (drum roll please) the slipper fits! The Pop III galaxy candidate GLIMPSE-16043 is an ultra-faint galaxy at z = 6.5. It was imaged in the GLIMPSE survey, which uses the technique of gravitational lensing to observe faint and distant galaxies.

The GLIMPSE survey targeted a massive galaxy cluster, Abell S1063. The cluster bends the light from distant galaxies and, like a giant lens, magnifies faraway objects, providing some of the deepest JWST imaging to date. The Pop III candidate passes both tests: it resides in the Pop III region of the color–color diagram, and its SED is best fit by a Pop III model, not a metal-rich galaxy model (see Figure 2). Next, spectroscopic follow-up is needed to ensure that this galaxy is truly metal free and not just extremely metal poor.

The spectral energy distribution of a Pop III galaxy candidate. This plot shows that the JWST data is best fit by a Pop III model rather than a metal-rich galaxy.

Figure 2: SED of GLIMPSE-16043 with the best-fit Pop III template (blue) and best-fit metal-enriched template (gray). The top panel is the galaxy imaged in different filters from NIRCam and the Hubble Space Telescope. [Fujimoto et al. 2025]

The authors conclude that our best shot at identifying additional Pop III galaxy candidates is using NIRCam to image large numbers of gravitationally lensed clusters. Without magnification from gravitational lensing, it may be impossible to see these ultra-faint Pop III galaxies. Once candidates have been identified, they can be followed up with deep spectroscopy to confirm their redshift and their lack of metals. Who knows? With these new methods, we may soon get a glimpse of the universe’s very first stars.

Original astrobite edited by Chris Layden and Margaret Verrico.

About the author, Madison VanWyngarden:

I am a first-year PhD student in astronomy and NSF Graduate Research Fellow at the University of Arizona. I study galaxy formation and evolution in the distant universe and am particularly interested in dusty star-forming galaxies. In my free time, I love reading, hiking, and baking bread!

The post A Possible GLIMPSE of the Universe’s First Stars appeared first on AAS Nova.

  •  
❌