Despite the name, the universe’s white dwarfs can glow in a wide range of colors—even green. For the first time, astronomers have spotted a star that appears green to the human eye, and the reddest ever recorded. These outlier stars help explain how certain white dwarf stars would shine in green, pink, cyan, yellow, and purple if we actually saw them up close in space. These colorful findings are described in a study recently published in the journal RAS Techniques and Instruments.
Looking for the ‘perfect radiator’
White dwarf stars are the dense remnants left behind after stars like our sun reach the end of their lifespan. For most stars, their color gives a hint to their temperature. Cooler stars appear orange, warm stars like our sun look white. The hottest glow pale blue, similar to how a blacksmith’s iron will go from red to orange to white hot. Astronomers believed that white dwarfs followed this same rule. They even earned their name after the earliest examples were surprisingly hot and glowed in a white/pale blue.
“Most stars, including most white dwarfs, behave like ‘perfect radiators,’ so their colour is set almost entirely by temperature. But nobody had really looked into what else might be possible for white dwarfs,” Mark Hollands, a study co-author and astronomer at the University of Warwick in England, said in a statement. “It turns out these incredibly dense stars can produce colours nobody expected, and some of them genuinely surprised me.”
According to the team, the key to these colors is density. The atmospheres surrounding the coolest white dwarfs can reach about the same density as water (roughly 1 gram per cubic centimeter). They are also millions of times denser than the sun’s photosphere, the lowest layer of its atmosphere. Under these higher density conditions, any trace elements present (carbon, calcium, sodium, etc.) interact with the surrounding dense helium plasma. As they interact with the plasma, they can absorb light across a wider spectrum of colors than they would at lower densities. This then shifts the star’s color away from the more typical orange, white, and blue.
Unfortunately, no white dwarf sky is close enough for its color to be seen directly. Instead, the team calculated their color from data astronomers routinely collect—a star’s spectrum. The spectrum is a “fingerprint” that’s produced when starlight splits apart by wavelength, similar to how a prism splits sunlight into a rainbow. Astronomers ran these spectra through a computer model of what colors human vision can see to check what color a star’s light would appear to our eyes.
Color-accurate simulated images of white dwarfs. Top Left panels: Sirius B is the nearest white dwarf to the Solar System, with a hot hydrogen atmosphere, resulting in a pale blue colour. WDJ1147-7449 is instead among the coolest nearby white dwarfs, giving it a featureless spectrum and an orange appearance. Top Right panels: Convective envelopes in these cool white dwarfs have dredged up carbon from their cores into their dense helium-dominated atmospheres, forming diatomic carbon molecules that lead to various pink hues. Bottom panels: Accretion of rocky debris from the white dwarf planetary systems enriches their cool helium atmospheres with elements such as calcium, magnesium, and sodium. The varying amounts/compositions of accreted material and white dwarf temperatures allow for a diverse array of colours, including green. In reality all stars would be many millions of times brighter than what can be shown on-screen. Image: Mark Hollands/University of Warwick
The first green and the reddest red
The team applied this method to several white dwarfs across the cosmos. They found that their colors fall into distinct groups linked to what makes up a star’s atmosphere. Carbon-rich white dwarfs generally appear pink or purple. Stars enriched with debris from busted asteroids and comets, the remains of old planetary systems, tend to be more yellow. Cooler white dwarfs with atmospheres of mixed hydrogen and helium show a more cyan or pale blue tinge. This cyan-pale blue is caused by hydrogen molecules colliding with helium atoms inside their ultra-dense atmospheres.
The most striking example is WD J1330+6435. This star is about 7,232 degrees Fahrenheit (4,000 degrees Celsius) and around 284 light-years away from Earth. Over time, it has gathered rocky material from its planetary system. All of this extra material enriched its atmosphere with calcium, lithium, and sodium. The result—a chartreuse green appearance in the team’s models. As far as the researchers are aware, no other star (living or dead) has ever been credibly reported as green.
Enriched from above: The cool white dwarf WDJ1330+6435 has accreted sodium-rich rocky material from its planetary system into its atmosphere. The immense atmospheric density causes the sodium to absorb light over broad range of yellow, orange, and red wavelengths, giving the WDJ1330+6435 a ghostly green appearance. Image: Mark A Garlick/University of Warwick.
“The traces of sodium in the atmosphere of this white dwarf absorb the orange part of the spectrum, leaving behind a ghostly green glow,” added Hollands. “Imagine standing on a planet and looking up at a green star. It feels like something out of science fiction.”
On the opposite end of the spectrum, the team identified what could be the reddest star ever recorded—WD J1011+2845. This white dwarf is only 48 light-years away from Earth, and has a deep convection zone. This zone is full of carbon that’s been lifted up from the star’s core to its surface. The carbon molecules then distort the star’s light so much that almost all of it is squeezed into wavelengths beyond 600 nanometres. This wavelength produces an unusual deep salmon-pink glow.
Enriched from below: The cool white dwarf WDJ0902+2010 has a deep convection zone within its helium dominated outer envelope. The convection zone has reached the white dwarf core, lifting interior carbon to the surface, and forming carbon molecules. These C2 molecules strongly absorb light across the optical range, including blue, green, and yellow wavelengths, resulting in WDJ0902+2010 appearing pink to the human eye. Image: Mark A. Garlick/University of Warwick.
What are the odds?
The team also studied 151 white dwarfs located within about 65 light-years (20 parsecs) from Earth. Only five of these showed unusual colors, two yellow and three pink. This suggests that about 1 in 30 of the universe’s white dwarfs shine with an unusually colored light.
The team then measured the color temperature of the remaining 146 white dwarfs. Color temperature is commonly used to describe light bulbs using degrees Kelvin—warm white at 3,000K, cool white at 6,000 K, etc. The median color temperature of the sample was approximately 6,800K, which our eyes perceive as white. This measurement corrects a common misconception that white dwarfs are typically blue. The hotter and bluer white dwarfs are mostly brighter, so they can be seen from further away and are over-represented in surveys that only look at a star’s brightness.
“One in thirty might not sound like a huge fraction, but across the entire population of white dwarfs in the Universe, that is still a lot of oddly coloured stars out there,” added study co-author and University of Warwick astronomer Boris Gänsicke. “Yet if we take the median across a representative population of white dwarfs, we found that the average white dwarf really is white.”
It’s true, the moon is shrinking. And astronomers now know how fast it’s contracting. While only satellite observations and the most delicate instruments can detect these shifts, the consequences of this shrinkage means moonquakes can occur anywhere on the lunar surface at a moment’s notice.
A team led by Smithsonian National Air and Space Museum planetary geologist Thomas Watters detailed their findings in a study recently published in The Planetary Science Journal. Researchers used data from NASA’s Lunar Reconnaissance Orbiter Camera (LROC), which has spent over 17 years generating millions of images of the moon’s surface. A shriveling lunar landscape may sound dramatic, but it’s occurring at a glacial pace. Based on these new calculations, the moon’s overall radius has decreased nearly 148 feet over the last 400–800 million years as it continues to cool. That’s about 2.4 to 4.3 inches per million years, or just 0.1 micrometer annually.
Although slow, the incremental activity’s effects are visible everywhere. On Earth, about 90 percent of all seismic activity occurs near the boundaries between lithospheric plates. But unlike its host planet, our moon is encased by a single, shell-like plate. This means interior cooling can generate slips and faults anywhere at any given time. After reviewing images taken by the LROC, the study’s authors tallied over 10,000 visible lunar faults.
“The number of these young faults revealed in LROC images is much greater than I ever imagined,” said Watters. “As the interior of the moon continues to cool and contract, it is expected that the growth of existing faults and formation of new faults continues today.”
While the faults can happen anywhere, some lunar regions are more likely than others to feature them. Areas with the thickest crust have fewer faults, which indicates they may be more stable than other, thinner sections. In addition to better understanding lunar history, the distribution and frequency of moonquakes may also help NASA better plan for a long-term human presence on the moon.
Griffith Observatory is one of Los Angeles’s most iconic landmarks. Part of the city’s sprawling “urban wilderness,” Griffith Park, the free public science center boasts dozens of exhibits and displays, including one of the first planetariums in the United States and the most-viewed telescope in the world.
But there’s a dark secret behind Griffith Observatory’s founding. It might never have been built if it weren’t for the desperation of its namesake, Griffith J. Griffith, a wealthy real estate magnate who had once been a pillar of his community. In 1906, when Griffith first proposed the observatory as a gift to the city, he was hoping to salvage his reputation after the shocking crime he had committed three years earlier: the attempted murder of his wife.
Who was Griffith J. Griffith?
Born in Wales, Griffith immigrated to the United States as a teenager in 1865, initially settling in Pennsylvania. A few years later he moved to San Francisco, where he worked as a business journalist covering the West Coast mining industry. Griffith then used his expert knowledge of mining to work as a consultant for mining companies, earning himself a fortune.
In 1882, Griffith moved to the rapidly growing city of Los Angeles and purchased 4,000 acres of the Rancho Los Feliz land grant with an eye toward development. He rented out parcels of this land for various businesses, from homes and hotels to an ostrich farm. (Although the farm eventually failed, it proved a popular tourist attraction: Some of California’s first passenger railways were built to bring sightseers to the ostriches.)
Acquaintances described Griffith as “a roly-poly pompous little fellow” and “an egomaniac.” Known for his brash personality and humor, he dressed flamboyantly, favoring a gold-handled cane and a top hat. Griffith also called himself “Colonel,” despite having never served in the military. His grandiosity led to the mocking nickname, “the Prince of Wales.”
Acquaintances described Griffith as “a roly-poly pompous little fellow” and “an egomaniac.” Image: Public Domain
Griffith’s doomed marriage
By the mid-1880s, Griffith was a member of Los Angeles high society. He rubbed shoulders with fellow wealthy developers whose names are still visible on city maps, such as the Bixbys, the Sepúlvedas, and the Mesmers.
While some of these families traced their lineages back to the colonial aristocrats of Mexico or New England, the Mesmers, like Griffith, were recent European immigrants, having come to the United States from Alsace, France. Griffith soon began courting 22-year-old Christina Mesmer, nicknamed Tina, who was considered one of the city’s most eligible young ladies.
Not only did Tina have prominent parents, she had personally inherited a major property from a childless family friend in 1885. Known as “the Briswalter tract” after the previous owner, Andre Briswalter, it was 240 acres in a prime development area just south of downtown L.A. Worth at least 35 million dollars today, the land was used by Briswalter himself for fruit orchards, but now encompasses the neighborhood of Historic South-Central.
Griffith knew that the Briswalter land would be his if he married Tina Mesmer, and made no secret of his motives. Three weeks before they were to be married, Tina informed Griffith that she had transferred partial ownership of the property to her father. It is unknown if Tina performed this transfer willingly, but Griffith wrote to her of his fear that she had become her father’s “pawn.” In the same letter, Griffith threatened to call off the wedding unless he was made sole owner.
Wishing to avoid scandal, the Mesmers relented and the wedding proceeded in 1887. However, the rocky start to the marriage was an ill omen of things to come. In public, the two presented a harmonious image of a high society couple. In private, tensions plagued their marriage, including over religion (the Mesmers were Catholic, while Griffith was Protestant).
In 1887, Christina ‘Tina’ Mesmer, a young Los Angeles socialite, married Griffith. Image: Public Domain
At home, Griffith was paranoid and menacing. Despite publicly supporting the Temperance movement, he was secretly an alcoholic, and his drinking worsened his behavior. Griffith’s paranoia reached a fever pitch after a narrow brush with death in 1891.
While the Griffiths were in a carriage on their way to the grave of Tina’s recently-deceased mother, someone fired a gun at them from another carriage, grazing Griffith’s head. The attacker, who fatally shot himself before he could be apprehended, turned out to be an investor from the failed ostrich farm, who had been ruined and owed Griffith back rent.
How the idea of Griffith Park first emerged
In 1896, despite his private troubles, Griffith was at the height of his power. Ever-ambitious, he sought a way to immortalize himself. He was also flush with cash, having sold off most of the Briswalter tract acquired from Tina, but still owed a tax debt that he hoped the city would forgive. That Christmas, the Griffiths donated more than 3,000 acres of Rancho Los Feliz to the city of Los Angeles for the formation of a public park, to be called, of course, Griffith Park.
While Griffith spoke of wanting to give back to the community and create “a place of rest and relaxation for the masses,” generosity may not have been his only motive. Critics called the huge donation a tax scheme, and pointed out that Griffith could afford to part with the land. Not only did he have Tina’s fortune, he had already rented out the most profitable parts of the Rancho Los Feliz, and what remained was no good for purposes like farming.
Griffith shoots his wife Mrs. Tina Griffith
The more his influence grew, the more unstable Griffith became. According to Tina’s later testimony at Griffith’s trial, he pulled a gun on her for the first time in May 1903, when she threatened to leave him during an argument. “He is very proud and did not want the public to know” of their marital disputes, she said.
A few months later, the Griffiths stayed at the Hotel Arcadia in Santa Monica with their only child, 15 year-old Vandell. Tina hoped that a family vacation would calm Griffith’s nerves, but Griffith was on edge. He repeatedly asked servers in the hotel restaurant to change his food and drink, believing it had been poisoned.
On the last night of the trip, Vandell Griffith went to the beach with the hotel owner’s son, leaving his parents alone in the hotel room. While Tina was packing, Griffith approached her with a gun in his hand. He forced her to kneel and started asking her about the death of Andre Briswalter years earlier.
Apparently, Griffith now suspected that the Mesmers had poisoned Briswalter, and planned to poison him next. Griffith then asked Tina if she had ever been unfaithful. She assured him that she had not, and that Briswalter’s death had been natural, but he fired off a bullet at point-blank range.
Tina Mesmer Griffith survives
Tina leapt from the window and rolled to safety, breaking her shoulder in the fall. Hotel staff soon found her and took her to a doctor. A surgeon who attended her injuries later reported that “if the bullet had struck Mrs. Griffith one-sixteenth of an inch below where it did, it would have gone through the eye socket and into the brain.”
Tina lost her right eye, and due to the risks of infection and blood loss, doctors were not sure whether she would survive. Miraculously, she did.
Police began searching for Griffith immediately, but it was three days before they found him at a nearby bar in the midst of an alcoholic bender. The subsequent trial became a massive media scandal. Tina took the witness stand wearing a veil and black glasses to hide her injuries.
A sketch published in The Los Angeles Times shows how Christina ‘Tina’ Mesmer wore a veil in the courtroom to conceal her injuries. Image: Public Domain
When she entered the courtroom, “she looked at [Griffith] casually as though he were someone she had never seen,” the Los Angeles Times reported, while Griffith remained motionless, listening intently. Tina testified for an hour before fainting from exhaustion, returning later that day for a second round of questioning. Only then did the extent of the Griffiths’ private problems become public knowledge.
The outcome of the trial
Griffith’s attorneys argued that he was not in his right mind; instead, his drinking had made him delusional, a case of “alcoholic insanity.” Griffith was fined and sentenced to just two years in prison.
Tina was granted a divorce on grounds of cruelty, one of the few legal justifications for divorce in 1903. She also received a cash settlement and full custody of Vandell, but she was unable to receive half of the estate, as she had asked for.
The couple’s properties had long been under Griffith’s name only, including what remained of Tina’s inheritance. As one of her lawyers told the Los Angeles Times, the law prevented her from obtaining “any approximation of what really should be hers.” However, Tina was left with enough to live on, and Griffith agreed to pay for Vandell’s future education as long as he didn’t attend a Catholic university.
The aftermath
After the trial, Tina moved in with her sister. Though she stepped away from city development, she devoted herself to Catholic charities and social events. She was apparently a big fan of whist, a four-player card game. She never remarried and continued to be known as “Mrs. Griffith” until her death in 1948 at the age of 86.
When Griffith emerged from San Quentin in December 1906, he appeared to be a changed man. He gave up drinking and devoted himself to the cause of prison reform, as well as improving facilities for visitors in the park that bore his name. He also came up with an idea for a second “Christmas gift” to rehabilitate himself in the eyes of the Los Angeles public: a free science center and an outdoor theater.
However, the city was now reluctant to associate with him. As one newspaper op-ed stated, Los Angeles was “neither so poor nor so lost to [a] sense of public decency that it can afford to accept this money.”
Griffith died of liver disease in 1919 without seeing this dream become reality, but he bequeathed the funds for the Observatory and the nearby Greek Theatre to the city in his will. The project would finally move forward more than ten years after his death.
It was Griffith and Tina’s son, Vandell Griffith, who oversaw the construction of the Observatory as president of the Los Angeles Park Board. (Vandell would later become a city police commissioner, and was described in a 1951 newspaper as “a dead honest man.”)
When the Griffith Observatory opened in 1935, it was an instant success, part of a new wave of interactive museums that made astronomy and other sciences accessible to the public. And it all goes back to a man who destroyed his own reputation. It’s a strange chapter in the history of Los Angeles, and a reminder that the legacies people leave can be complicated.
In That Time When, Popular Science tells the weirdest, most surprising, and little-known stories that shaped science, engineering, and innovation.
NASA’s Perseverance Mars rover has officially traveled 28.10 miles—farther across another planet’s surface than any other vehicle in history. Not only that, but the six-wheeled science lab accomplished this impressive feat almost entirely autonomously and in barely a third the time it took the previous recordholder.
“The original mission called for no more than 12.4 miles of driving. We’ve blown well past that,” Steven Lee, Perseverance and Curiosity project manager at NASA’s Jet Propulsion Laboratory, said in a statement.
Perseverance began operations on Mars on February 18, 2021, after landing in an ancient river delta selected for potential past microbial life called Jezero Crater. Since then, the rover has slowly but steadily made its way across the region, while conducting multiple sediment drilling surveys. These samples are then chemically analyzed using onboard laboratory equipment before the results are sent back to mission specialists at NASA.
Perseverance surpassed the previous travel record of 28.06 miles set by NASA’s Opportunity rover, before its communications with NASA ended on June 10, 2018. However, it took Opportunity nearly 15 years to accrue its distance while Perseverance exceeded the same mileage in less than six years, and on the 2,006th Martian day (sol) of its mission. Perseverance is currently traveling towards an area named Idubi through an expanse nicknamed “Lac de Charmes.” The region near Jezero Crater’s western rim hosts what may be the oldest landscape ever investigated in the solar system. Mars does not feature tectonic plates like Earth, which means its terrain is never eroded and subsumed into the planet’s substrates.
Mission engineers have not spent the last six years remotely steering Perseverance, either. The rover arrived on Mars equipped with a self-piloting system called AutoNav, which constructs 3D maps of the immediate surroundings to flag any potential hazards. AutoNav then charts a route between specific waypoints chosen by NASA specialists back home. Perseverance has completed 90 percent of its total excursion with AutoNav. Opportunity and its sibling rover, Spirit, only relied on a first version of the piloting system about five percent of the time.
Perseverance has a long road ahead of it, if all goes according to plan. In October, NASA approved the first mission extension that will continue the rover’s operations through about the end of 2028.
“With all mobility systems fully operational and favorable extended-ground-life test results, we expect Perseverance to keep adding to this record for many years to come,” added Lee.
Successfully sending Artemis II astronauts on their historic lunar flyby earlier this year required some of the latest and most precise technologies, but not everything in this mission needed the same intense equipment. As crewmates gazed through Orion’s capsule window at the moon’s eclipse of the sun on April 6, 2026, three of the travelers needed a way to easily sketch some of their preliminary observations. They took turns writing their notes on a shared tablet PC—and NASA has recently highlighted their work with a screenshot of their efforts.
Astronauts Reid Wiseman, Victor Glover, Christina Koch, and Jeremy Hansen had a lengthy list of tasks during their 10-day, 700,000-mile roundtrip. One of the most visually dramatic jobs involved carefully assessing lunar activity while passing across the moon’s dark side from a distance of about 46,000 miles away. The roughly hour-long observation period provided astronauts with an unprecedented opportunity to record meteorite activity.
A visualization of a dark Moon eclipsing the Sun is marked with handwritten notes in this April 6, 2026, screenshot from an Artemis II crew member’s tablet. Credit: NASA
The tablet screenshot includes notes taken by Wisemen (in blue), Hansen (in red), and Glover (in green) during the moon’s eclipse of the sun. The crew collectively spotted at least five faint flashes of light caused by impacts. According to Wiseman, the first three impacts occurred within about 10 minutes into their observations, while another two happened later during the flyby. Impacts two and four were likely also corroborated by Hansen and Glover.
Since the moon does not have an atmosphere like Earth’s, the lunar surface is regularly bombarded by space rocks. Most of them are comparatively small, but they will still pose a problem for future crewed trips to the surface,especially those stationed in a planned permanent lunar base. The data gathered by Artemis II on April 6 will help NASA better understand these dynamics, and plan for the safest environments possible for their astronauts.
Artemis II’s astronauts safely returned to Earth during a splashdown off the coast of San Diego at 8:07 p.m. EDT on April 11. If all goes as planned, Artemis III’s crew will launch on their mission no earlier than June 2027.
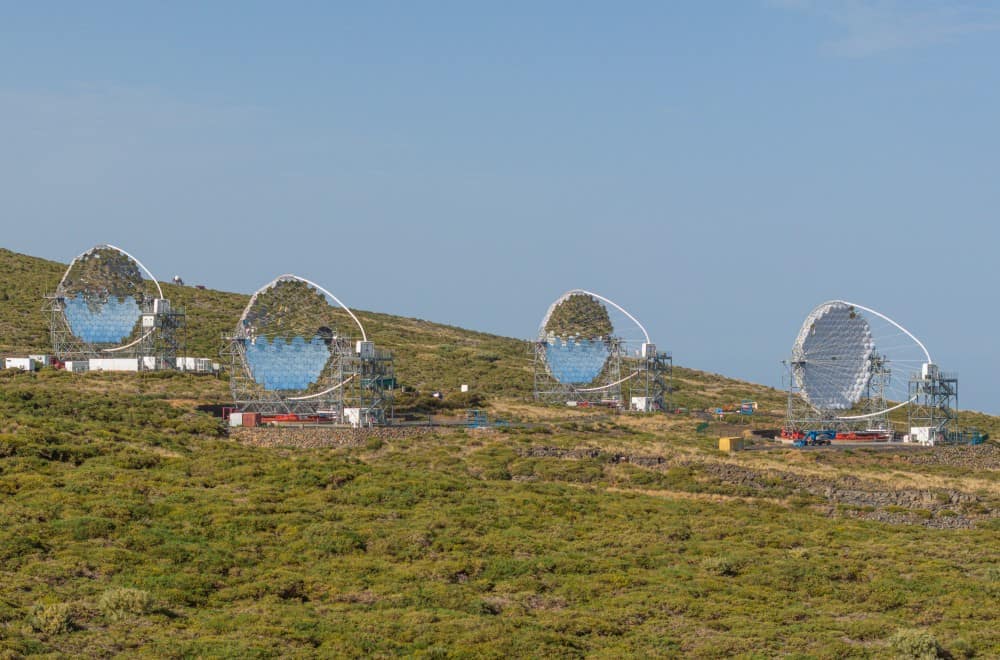
The construction of four 23 m-diameter telescopes belong to the Large-Sized Telescope (LST) array at the Roque de los Muchachos Observatory in La Palma, Spain.
The telescopes are designed to detect the faint Cherenkov light flashes when very high-energy gamma rays interact with the Earth’s atmosphere.
The LSTs are the most sensitive instruments in the world for observing gamma rays at energies between approximately 20 GeV and 3 TeV.
The first LST-1 telescope was built in 2020 and has already completed observations of pulsars, studies of active galactic nuclei at cosmological distances and rapid follow-up observations of transient phenomena such as novae and gamma-ray bursts.
The three other telescopes now join LST-1 and by observing the same gamma-ray showers simultaneously from multiple directions, it will provide improved sensitivity, angular resolution and energy reconstruction.
Their sensitivity to the lowest-energy gamma rays will enable astronomers to detect and study bright gamma-ray bursts at high redshift, potentially extending gamma-ray observations to sources at redshifts of around z∼4 to provide new insights into the early universe.
The telescopes will provide new insights into the early universe. (Courtesy: LST collaboration)
“The completion of the LST sub-array is the culmination of more than 15 years of international collaboration and technological innovation,” says Japanese astrophysicist Masahiro Teshima, who is principal investigator of the LST collaboration. “These telescopes will allow us to explore some of the most extreme environments in the universe, including supermassive black holes, neutron stars and the nature of dark matter.”
North-south divide
The telescope will form part of the Cherenkov Telescope Array Observatory (CTAO), which when operational in 2028 will operate between 20 GeV and 300 TeV and be the world’s most powerful observatory for gamma-ray astronomy.
The CTAO will consist of six LST telescopes as well as two other arrays: 23 telescopes belonging to the Medium-Sized Telescope (MST), which will operate between 80 GeV and 50 TeV, and 37 telescopes for the Small-Sized Telescope (SST) that will work between 2 TeV and 300 TeV.
The 66 telescopes will be distributed between CTAO-North at La Palma and CTAO-South at the Paranal Observatory in the Atacama Desert in Chile.
The LSTs form the low-energy core of CTAO-North and over the coming years they will undergo commissioning and be integrated into CTAO operations.
The NASA Exoplanet Exploration Program (ExEP) has a curated list of 164 nearest Sun-like stars that are easily visible from Earth. This list represents the first targets for a proposed large space telescope specially designed to find life in the universe, currently known as the Habitable Worlds Observatory (HWO).
After the HWO is completed, likely sometime in the 2040s, scientists will use the specialized telescope to directly image planets in those star systems. The telescope will search around Sun-like stars for planets in a region known as the habitable zone, where temperatures allow liquid water to exist. Scientists hope to find Earth-like planets with liquid water in the habitable zones of other stars.
While the 164 stars on ExEP’s list have qualities that make them good candidates for study, it remains unknown how many actually have terrestrial planets within their habitable zones. A team of scientists at Arizona State University used simulated data for ExEP’s 164 stars and their hypothetical planetary systems to assess which are most likely to have habitable worlds. Their results would help the HWO prioritize which star systems to observe.
The team started with a subset of 134 stars on ExEP’s list with no known exoplanets, giving researchers the freedom to simulate potential worlds around them. They used a software model called the DYNAmical Multi-planet Injection TEster (DYNAMITE) to predict the possibility that an unseen planet exists around each star by generating 100,000 simulated planetary systems around it. The simulations use mathematical formulas based on observations of real exoplanets to determine the sizes and orbital characteristics of hypothetical gas giants and rocky exoplanets. DYNAMITE then determines whether these planetary systems would be stable and include a terrestrial exoplanet in the star’s habitable zone.
The other 30 stars in the ExEP’s list have known exoplanets, but none of them are rocky planets in habitable zones. To predict whether these stars have unseen terrestrial planets in their habitable zones, the team used the same DYNAMITE process as before with the additional requirement that each star must have an exoplanet matching the one already found.
The space around a Sun-like star can be divided into three regions. The region closest to the star is too hot for liquid water to persist on an exoplanet’s surface, while the region farthest from the star is so cold that any water on an exoplanet would be frozen solid. Between these lies the habitable zone, where temperatures would allow liquid water to exist. However, it’s also possible that a combination of light and gravity could create habitable temperatures on large enough moons orbiting gas giants even beyond a star’s main habitable zone. Illustration by Andrew Bizal.
To increase the chances of finding a terrestrial planet in a habitable zone, the team also investigated potentially habitable moons orbiting gas giants in these systems. For each simulation that included a gas giant, the team inserted between 2 and 23 moons, with masses between 10% of Earth’s Moon and 50% of Earth. Then they simulated the surface temperatures of these moons based on how much starlight they receive and how strongly their host planet pulls on them. They deemed the moons potentially habitable if they were large enough to retain an atmosphere and had a temperature ideal for liquid water, even if they were not technically in their stars’ habitable zones.
For each star, the team calculated a metric based on the probabilities that the star had a terrestrial planet in its habitable zone, that the planet would remain in a stable habitable zone for at least 2 billion years, and that the star had a potentially habitable moon. They called this probability statistic a rankingmetric and used it to compare star systems.
Based on the ranking metric, the team found that the dimmer and cooler stars on their list generally had better chances of hosting a habitable-zone terrestrial planet than the brighter, hotter stars. They also found that stars without known exoplanets ranked more favorably. Around 70% of the stars with known exoplanets had less than a 1% probability of hosting a terrestrial planet in their respective habitable zones. Additionally, fewer than 0.1% of their simulated moons were habitable.
Overall, the researchers concluded that the HWO should prioritize observing cooler, Sun-like stars with no known exoplanets. They claimed that the exoplanets with known characteristics in their sample set were of sizes and in positions that made it unlikely for other exoplanets to be in their systems’ habitable zones. Even with expanded habitability criteria for moons, it would be very unlikely for HWO to find another Earth orbiting a gas-giant exoplanet. They ranked 47 stars in the highest-priority category (A Tier), 51 stars in the middle category (B Tier), and 66 stars in the lowest category (C Tier) to observe with HWO.
At the end of their study, the team remarked that the proposed HWO represents a potential next step in the search for other Earths, but scientists still need to identify the best targets for this future telescope. The HWO telescope should be able to image rocky exoplanets directly, so thorough research to prepare a list of high-priority targets will help avoid overlooking other Earths.
Since the 1976 Viking missions, when NASA first successfully placed uncrewed landers on Mars, scientists who study life in the universe, known as astrobiologists, have been gathering evidence to determine whether microorganisms ever lived on the red planet. It has been a challenging determination to make. Until a Mars sample return mission occurs, all necessary analyses must take place on Mars, using instruments designed as much to withstand the stresses of space travel as to collect data, which limits how thoroughly scientists can study Martian rocks. As a result, the search for evidence of microbial life on Mars is inherently incremental.
Recently, scientists added another piece of exciting, yet inconclusive, evidence to their search. In the summer of 2024, the Mars 2020 Perseverance Rover science team was searching for signs of ancient microbial life in a 3,700-million-year-old lake bed on Mars, known as Jezero Crater. In the process, they detected complex, carbon-containing organic molecules in mudstones within a river channel that once brought water to the now-dry lake bed.
Widely dispersed organic molecules associated with minerals that can support microbial life are exactly what astrobiologists would expect to see if microorganisms once lived in Jezero Crater. However, organic molecules can also form through geological processes, like when gases and minerals react at high temperatures and pressures at deep-sea vents on Earth. Therefore, astrobiologists must carefully assess organic molecules to determine their origin.
In July of 2026, more than 60 Perseverance science team members took a first step towards determining whether ancient microorganisms could have made the organic molecules found in Jezero Crater. They compared the organic molecule detections in Martian mudstones to similar detections of organic molecules in samples of known origin, including fossilized Earth life, meteorites, and minerals.
NASA scientists detected the organic molecules in Jezero Crater with a rover instrument called Scanning Habitable Environments with Raman and Luminescence for Organics and Chemicals (SHERLOC). SHERLOC uses a 248.6 nanometer (nm) wavelength laser to excite molecules in unknown materials. When molecules are excited, they absorb and scatter the laser light, causing characteristic shifts in the wavelength of the scattered light.
Instruments like this, known as Raman spectrometers, detect the shifted light and display the detections as lines called spectra, which scientists use to identify the unknown molecules. The Raman spectra from the 4 mudstones in Jezero crater showed shifts of about 1600 nm, which is characteristic of complex carbon molecules. These shifts appear as bands in the spectra that are often called G-bands.
Raman spectrometers are common laboratory instruments, but most use lasers with wavelengths of 485 nm or higher, so the spectra they produce can be slightly different from SHERLOC spectra even when the laser excites the same kind of molecule. To get around this issue, the scientists compared the Mars spectra with spectra of complex carbon molecules from fossilized Earth microorganisms, coal, graphite, meteorites, and synthetic samples collected by Raman instruments using the same wavelength laser that SHERLOC uses. They found that the spectra collected on Mars overlap with at least one example from every sample type except graphite.
These results don’t rule out the possibility that organic molecules in Jezero Crater were produced by ancient microbial life, but they can’t tell us exactly how they formed either. That determination will have to wait until the samples are brought to Earth so they can be studied with laboratory instruments.
The Perseverance team has made a small but critical contribution towards determining whether microbial life ever inhabited our closest planetary neighbor, Mars. Their efforts exemplify how the science of astrobiology and the search for possible extraterrestrial life slowly and carefully move forward. If we keep at it, humans may one day have a definitive answer to one of our most consequential questions: Are we alone?
At the centre of our galaxy lies a supermassive black hole, Sagittarius A* (Sgr A*), that’s more than four million times the mass of the Sun. Astronomers have now discovered the fastest-known star in the Milky Way zooming around this black hole in an extremely close orbit. Observations of this star, known as S301, could shed new light on the spin of Sgr A*.
Black holes are extremely large concentrations of matter condensed into very small regions of space. As a black hole spins, it drags the surrounding space–time around it, a phenomenon known as frame dragging or the Lense-Thirring effect. This frame dragging creates a cosmic whirlpool, twisting the fabric of space–time and warping the orbits of nearby stars. However, unless the orbiting star reaches very close proximity, this subtle effect is difficult to measure.
“Our group has determined the mass of the central black hole down to sub-percent precision,” says team member Felix Mang, a PhD student at Max Planck Institute for Extraterrestrial Physics (MPE) and author of the study published in Nature. “A black hole is characterized exclusively by its mass, spin, or angular momentum and electric charge; now that we’ve measured the mass really, really accurately, the next step is to measure the spin.”
Lying in the galactic centre approximately 27,000 light-years from Earth, Sgr A* offers another direct way to measure its spin. There are a few dozen stars whirling around the massive black hole on nearly Keplerian orbits. The stars that come closest to Sgr A* most effectively probe its spin as they reach into the deepest parts of the gravitational potential, altering their trajectories.
For example, the star S2 is on a 16-year orbit and has been meticulously tracked using the GRAVITY instrument on the European Southern Observatory’s Very Large Telescope Interferometer. GRAVITY’s emergent near-infrared interferometry enabled the detection of strong relativistic effects during S2’s close approach in 2018, including a 12-arcminute orbital precession consistent with the Schwarzschild metric derived from Einstein’s general theory of relativity.
Despite these measurable relativistic effects, even at its pericentre when it is closest to Sgr A*, S2 remains too far away to detect the black hole’s spin without prohibitively long years of observation.
Discovery of S301
Although S2 is not a suitable candidate for Sgr A* spin measurements, the newly discovered star S301 is an ideal cosmic probe. Mang notes that the star is “a bit heavier than the Sun, and it has a radius which is a bit bigger; but overall, it’s not that special”. S301 is under 1.5 solar masses with a radius about 1.4 to 1.6 times that of the Sun, and it is too faint to be one of the giant stars in the galactic centre. Although the main-sequence star S301 may seem fairly ordinary, its extremely eccentric orbit and very close approach to the supermassive black hole are remarkable.
“We found the star in Spring 2023,” recalls Mang. Upon detection, the team could not conclude whether it was a foreground or a background star. However, dedicated follow-up observations in 2024 revealed a pronounced acceleration in S301’s proper motion, or apparent angular change of position on the sky. “It was curving away from a linear trajectory, which gave us a hint that it may be bound to the black hole,” Mang explains. Continued observations in 2025 allowed the team to create a robust initial model of S301’s orbit, revealing it to be “indeed a very eccentric and tightly orbiting star, which was then later on confirmed”.
Armed with evidence that the star might be gravitationally bound to Sgr A*, the team looked to the past, hoping to lock down S301’s orbit. Combing through archival data, the astronomers searched for traces of the star before its close approach in 2023. As Mang notes, “getting these two pre-peri positions in 2021 and 2017 was rather challenging, [we were] digging through the data”. The meticulous hunting paid off and revealed a strong trace of S301 in 2021 and a weaker signature back in 2017.
With 19 distinct positions found across nearly a decade of data, the team outlined a clear elliptical orbit, revealing that the star had zoomed past the supermassive black hole at its closest approach in early 2023 and passed significantly closer to the black hole than S2 ever has.
Extreme path of S301
The team determined that S301 boasts an orbital period of just 8.7 years, making it the shortest known orbital period around Sgr A*. This breaks the previous record, held by the star S55, which takes about 12 years to complete its path.
But S301’s orbital period is only part of what makes its path extraordinary. With an eccentricity of about 0.98, S301’s elongated path brings the star to a pericentre distance of approximately 1.78 billion kilometres, roughly 10 times smaller than that of S2. At that closest approach, S301 speeds around at about 25,000 km/s, making it the fastest known star in the Milky Way.
Because S301 gets so close to the supermassive black hole, general relativity strongly affects its orbit. In particular, S301 experiences a phenomenon known as the Schwarzschild precession, which shifts the star’s orbit by about 2° per revolution. Over the course of roughly 1500–1600 years, those slight shifts accumulate into a full 360° rotation of the orbit.
While this dramatic shift is driven by the colossal mass of Sgr A*, S301’s extreme orbit is also subjected to a subtler spin-induced effect: the Lense-Thirring precession. As Sgr A* spins, the twisted space–time forces S301’s orbital plane to slowly wobble, making it a powerful probe of the curved space–time around Sgr A*. By precisely tracking the star’s motion, astronomers can examine how its trajectory is shifted by these two precession effects, thereby enabling them to measure the spin of the supermassive black hole.
Looking forward, the upcoming years should bring substantially better data. “The instrument we are observing with, GRAVITY, has undergone some major upgrades, which gives us more flux, and we also expect to get better astrometric precision,” Mang says. “Along with that, we expect the Extremely Large Telescope, and one of its first light instruments, MICADO, to be operational by roughly 2030.”
These advances will allow astronomers to trace the motion of S301 with incredible precision. As a result, the team is confident that these instruments will decode the mystery of Sgr A*’s spin. “Combining the astrometry or proper motion measured with GRAVITY on the sky of that star, and then having a perception of the velocity of that star in the plane or out of the plane of the sky with MICADO, will allow the measurement of SgrA*’s spin, probably within the next 10 years,” Mang explains.
Carbon is the 4th most abundant element in the universe. It’s everywhere, from the air you breathe to the carbohydrates in your food to the petroleum in the Earth’s crust. Like most elements, carbon was not created by the Big Bang, but came from 2 different types of stars that fuse lighter elements together.
Massive stars at least 8 times the Sun’s mass fuse 3 helium atoms into a carbon atom in their cores, through a mechanism called the triple-alpha process. They eventually expel this carbon into space, either through a stream of material called astellar wind or at the end of their lives during a core-collapse supernova.
Meanwhile, low-to-intermediate-sized stars between ½ and 8 times the Sun’s mass also induce the triple-alpha process. But unlike massive stars, they produce carbon not in their cores, but in a dense shell of helium that surrounds them during an advanced stage known as the asymptotic giant branch or AGB. AGB stars undergo cycles of swelling and contraction, during which they shed some of their material into space.
While scientists understand these processes, the contribution of each star type to the carbon supply in the universe remains uncertain. To address this, a team of scientists modeled how the chemical elements in the Milky Way Galaxy change over time with different contributions from the 2 carbon-creating processes. They then verified their findings by comparing them with the actual carbon concentration in the Milky Way.
To obtain the benchmark for the Milky Way Galaxy’s carbon content, the team turned to the catalog of stars observed by the Apache Point Observatory Galactic Evolution Experiment (APOGEE) survey. They selected 14,066 stars that were large and bright enough to yield reliable data but, unlike AGB and massive stars, were still at a stage of life when their newly produced carbon was still confined to their cores. The researchers used the carbon in the outer layers of these stars, known as subgiants, as a compositional record of the gas from which they formed, thereby estimating the Galaxy’s carbon content during their formation.
The scientists started with a computer program developed by another team that models how the Milky Way’s chemistry changes over time. First, the team calculated the potential amount of carbon produced by different types of stars using estimates from earlier studies. Then, they incorporated these results into a model that accounts for how stars form, fuse elements, and release carbon into the Galaxy, using a simulation program called the Versatile Integrator for Chemical Evolution, or VICE. The researchers ran 14 versions of this model, each assuming a different contribution of carbon from AGB stars relative to massive stars.
In their computer model, the Milky Way Galaxy began as a set of 200 concentric rings, each containing its own population of stars, different speeds at which stars form, and varying amounts of gas available to form new stars. The team then stitched these rings together by having stars migrate between them. They allowed these model Galaxies to settle over 10 billion years, then picked a random sample of 14,066 simulated stars to compare their carbon content with carbon in the same number of observed subgiants from APOGEE.
The team’s model most closely reproduced the actual carbon content of the Milky Way’s subgiant stars when AGB stars contribute between 10% and 40% of the Galaxy’s carbon, with the strongest agreement occurring at 15% to 30%. Even though they found that massive stars are the dominant source of carbon, they also found that smaller AGB stars could produce carbon more efficiently than previously thought, though they take longer to become carbon sources than their larger counterparts.
The team concluded that their estimates of how much carbon comes from AGB and massive stars provide a benchmark for future studies, as the connection between the production of elements inside stars and the processes by which those same stars lose mass remains poorly understood. They suggested that future researchers analyze larger sample sizes, examine other galaxies, and use data from future surveys to better understand the chemical history of the universe.
On 9 October 2022, a gamma-ray burst called GRB 221009A sent an enormous amount of high-energy radiation toward Earth. The Large High Altitude Air Shower Observatory (LHAASO) detected thousands of photons from the event, including some above 10 TeV. More than an hour later, the Carpet cosmic ray detector recorded something much harder to explain: a photon-like event with an estimated energy of 300 (+43/-38) TeV. At that energy, according to standard physics, the photon should have disappeared during its journey to Earth.
Giorgio Galanti of INAF and Marco Roncadelli of INFN have now examined what could allow such a photon to survive. Their explanation, reported in Physical Review Letters, involves two hypothetical effects: axion-like particles, or ALPs, and a possible violation of Lorentz invariance.
The space between galaxies is filled with background light, including the cosmic microwave background (CMB), the faint radiation left from the early universe. A 300 TeV gamma ray can collide with these low-energy photons and produce an electron and a positron. At this energy, the CMB is the dominant source of absorption.
“The CMB is extremely dense,” Galanti explains. A 300 TeV photon therefore has a mean free path far shorter than the distance from GRB 221009A, making the universe effectively opaque to it.
The numbers are difficult to put into perspective. Galanti and Roncadelli calculate that conventional propagation would result in only about 10-96 expected photons in the Carpet energy range. The Carpet event itself is also unusual because the detector did not find the muon signal expected from a hadronic cosmic-ray shower. The collaboration estimated the probability of a hadron being misidentified as the event at about 3 × 10⁻⁴.
Galanti says the researchers are taking the published Carpet result at face value while leaving open the question of whether it will ultimately prove to be a signal of new physics.
Two options to consider
One possible explanation involves ALPs, hypothetical particles that can mix with photons in magnetic fields. A photon can convert into an ALP, travel through a region where photons would be absorbed, and later convert back into a photon. This mechanism could help explain the LHAASO photons detected between roughly 10 and 20 TeV. But it runs into trouble at 300 TeV.
“ALPs alone fall short by roughly two orders of magnitude at 300 TeV,” Galanti says. They remain useful at lower energies, but the CMB absorption becomes too severe at the Carpet energy. The researchers found that within the range of ALP parameters under consideration, the expected number of Carpet photons stays below about 10-4, lower than the 0.0513 required at the 95% confidence level.
That led the researchers to consider another effect: a possible violation of Lorentz invariance, one of the foundations of relativity.
In the scenario they studied, the Lorentz invariant violation (LIV)-induced modifications of photon propagation change the threshold for photon–photon absorption. A 300 TeV photon can then interact with higher-energy background photons, which are much less abundant than the CMB photons responsible for ordinary absorption. The universe then becomes more transparent to the photon.
The researchers calculate upper limits of 1.22 × 10²¹ GeV for the linear LIV scale and 2.03 × 10¹³ GeV for the quadratic case, at 95% confidence.
The interesting part is that they don’t use LIV as a replacement for ALPs. As Galanti explains, ALPs function at LHAASO energies but not at Carpet energies, while LIV operates at Carpet energies but not at LHAASO energies. Their model incorporates both effects into a single theoretical framework.
There is another clue. A separate analysis by Dmitry Ofengeim and Tsvi Piran found that the more-than-one-hour delay between the LHAASO and Carpet events can also be explained with quadratic LIV. Their estimated scale is consistent with the limit obtained by Galanti and Roncadelli.
But Galanti is careful about what the result means.
“A single candidate photon from a single cosmic event cannot be claimed as an undisputed discovery,” he says. Confirmation would require repeated observations from multiple distant sources showing the same energy-dependent signatures.
Future observations from facilities including ASTRI Mini-Array, CTAO, SWGO and the expanded LHAASO could test whether similar high-energy signatures appear in gamma-ray bursts and distant active galaxies.
For now, the 300 TeV event remains an unusual observation with a possible explanation that goes beyond standard photon propagation.
Members of the Thirty Meter Telescope (TMT) International Organization have turned down Spain’s €1bn offer to build the instrument at the Roque de los Muchachos Observatory in La Palma. The package was put forward in July with funding also provided from the European Investment Bank and Spain’s Official Credit Institute. The decision makes Hawaii’s Mauna Kea as the only possible option for the telescope.
The TMT, if built, would use a segmented primary mirror consisting of 492 elements of zero-expansion glass for a 30 m-diameter primary mirror that will allow astronomers to resolve the faintest and oldest galaxies.
The TMT’s members include the University of California, the California Institute of Technology, Canada, India, and Japan.
Officials at the TMT have not released a final construction cost for the telescope, but it is expected to be at least $3bn, of which $2bn has been committed.
In 2009, the TMT organization choose Hawaii’s Mauna Kea peak as its location. However, in 2015 protests by indigenous Hawaiians, who regard the site as sacred, delayed the start of construction.
Some astronomers, however, were concerned by the potential move given that La Palma’s environmental conditions may limit the telescope’s scientific potential. In particular, the warmer climate and lower elevation of La Palma compared to Mauna Kea could affect mid-infrared observations, which require dry, cool conditions.
A year later, the NSF decided to pursue the GMT, which uses seven primary and seven secondary mirrors to give it an optical surface of 25.4 m. Building of the GMT is already under way at Chile’s Las Campanas peak with officials working toward a final design review.
In 2025, Spain then offered €400m to join the project if the TMT was built in La Palma. In July, the European Investment Bank and Spain’s Official Credit Institute said it would provide an additional €600m in loans towards construction.
Yet according to a statement from the Astrophysics Institute of the Canaries (IAC), which operates the Roque de los Muchachos Observatory, TMT officials have now rejected that offer.
The IAC say that TMT members were “unable to reach the consensus required to accept the financial offer”.
The IAC adds that despite the decision, the institute “remains fully committed to the scientific and technological development of the [Roque de los Muchachos Observatory]” and will continue to promote the installation of new infrastructure including the Cherenkov Telescope Array Observatory and the European Solar Telescope.
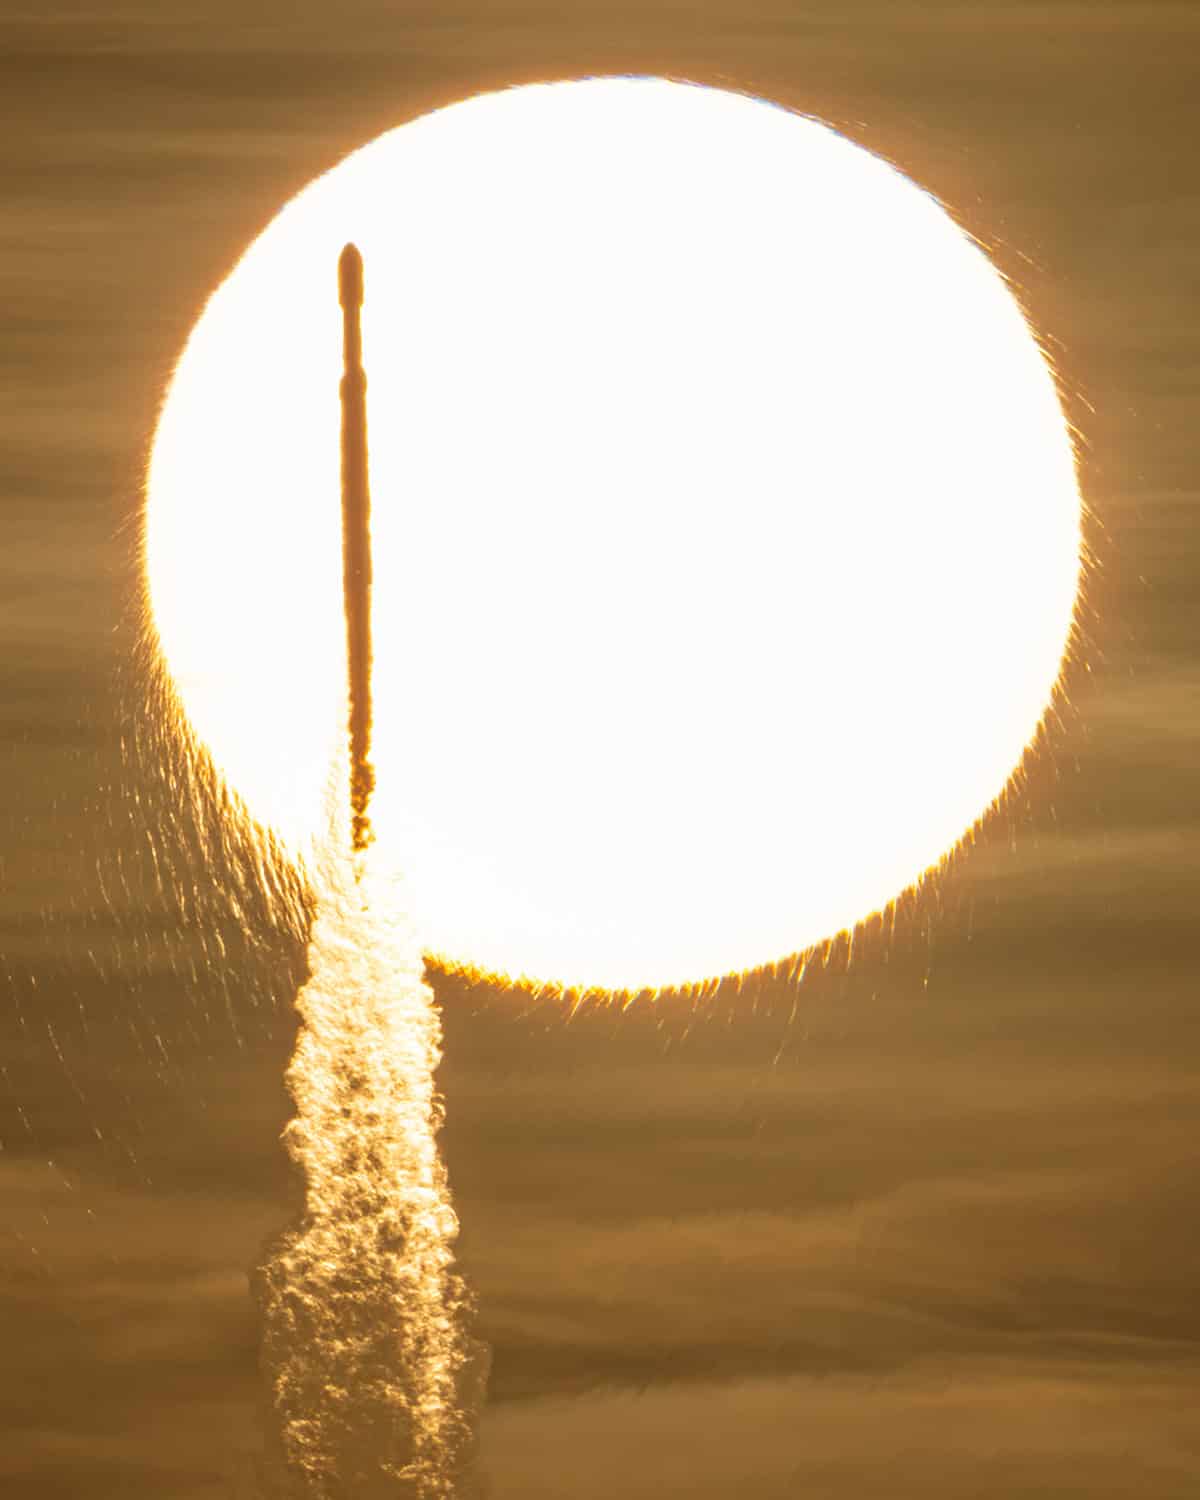
Lift off A SpaceX Falcon Heavy rocket with NASA’s Nancy Grace Roman Space Telescope on board is seen transiting the Sun during launch from the Kennedy Space Center in Florida on 30 August 2026. Named after the agency’s first chief astronomer, the telescope will survey billions of stars and galaxies with a field of view far larger than Hubble’s, helping scientists to study dark energy, exoplanets and the evolution of the universe. (Courtesy: NASA/John Kraus)
At 7.26 a.m. on Sunday 30 August 2026, a SpaceX Falcon Heavy rocket rose from the Kennedy Space Center in Florida, carrying NASA’s Nancy Grace Roman Space Telescope on its initial three-month journey beyond the Moon. As I watched online from my home in Sydney, Australia, that evening, the launch did not disappoint. There was all the familiar theatre of a rocket taking off: the brilliant column of flame, mission control calling out that it had gone through the point of peak aerodynamic stress, then the booster and main-engine cut-offs, before the fairing finally fell away.
Just 31 minutes after lift-off, Roman separated from its carrier rocket and began its long journey to L2, the second Sun–Earth Lagrange point, 1.5 million kilometres from Earth. Once it arrives there at the end of November, the gravitational balance will let Roman maintain its orbit with relatively little fuel. The Sun, Earth and Moon will all be on the same side of the spacecraft so that a single shield can block their light and heat, while the telescope faces away from them and stays cold.
Yet the most impactful part of Roman’s journey will be less visible. When its first images are released, hopefully in early 2027, the telescope will accelerate a change already long under way in astronomy. Rather than investigating carefully selected objects in the sky, astronomers are now increasingly mapping entire populations – monitoring a changing sky and searching enormous datasets for discoveries no single observer could conceivably find by eye. Roman will speed up that trend much further.
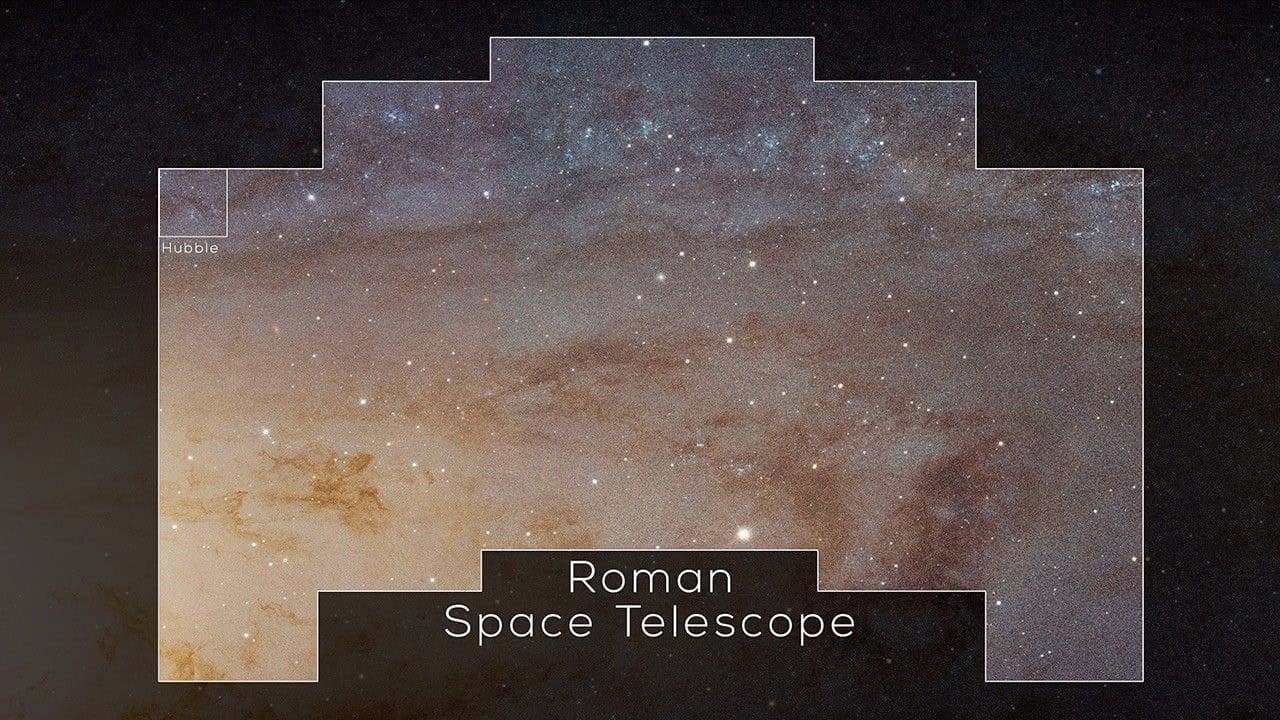
During the launch broadcast, I heard NASA administrator Jared Isaacman say Roman will study the “ecology of the universe”. Some cameras, he suggested, can provide an overview of a forest, while others can zoom in on individual birds and leaves. Roman, however, will combine both approaches. With a 2.4 m-diameter primary mirror, its images will be as sharp as those from the Hubble Space Telescope. But Roman’s Wide Field Instrument (WFI) can cover at least 100 times as much sky in a single pointing.
Bigger, brighter, better The Roman telescope will scan a much wider field of view than the Hubble Space Telescope (insert) ever could. (Courtesy: NASA)
With Roman, the detailed and population views become part of the same observation. Traditionally in astronomy, a sharp image of a single galaxy can reveal its stars, dust and morphology, while a wide but (usually) less detailed survey can tell us how galaxies are distributed. Roman will do both: it will record fine detail while retaining the wider view of the environments and populations to which individual objects belong. It will, in essence, allow astronomers to study in detail entire cosmic ecosystems as well as their constituent objects.
And that is what makes Roman so revolutionary.
From observing targets to interrogating surveys
For much of modern professional astronomy, observing began with a proposal to study an object of scientific interest. If it was accepted by an observatory’s time-allocation committee, the astronomer would travel to the telescope (or, later, log in remotely), collect a manageable quantity of data, reduce and analyse it, and retain exclusive access during a proprietary period while preparing their first research paper. The observer knew why each exposure had been taken.
That model has not disappeared. The Hubble and James Webb space telescopes remain extraordinarily powerful precisely because they can study selected targets in fantastic detail. Roman’s coronagraph, meanwhile, will test active optics that suppress starlight far more effectively than existing space-based coronagraphs, allowing it to image giant planets orbiting nearby stars and paving the way for future missions to photograph smaller, Earth-like worlds.
However, alongside targeted astronomy, a different observing mode has become increasingly important, namely observatories designed to produce systematic, reusable maps of the sky. The Gaia mission of the European Space Agency (ESA) is one such example. Over its 11-year life between 2014 and 2025, Gaia took more than three trillion (3 × 10¹²) observations of roughly two billion stars and other objects. Its public catalogues have allowed researchers to reconstruct the Milky Way’s structure, identify stellar streams and star clusters, examine binary stars and search for rare objects, often without ever applying for new telescope time.
Gaia’s third data release, which was made public in June 2022, included 10.5 million “variable sources” – any objects that change in brightness over time, sometimes regularly and sometimes unpredictably. They were all classified using supervised machine-learning techniques, in which an algorithm learns from previously labelled examples. No astronomer could personally have inspected that many light curves (records of brightness versus time).
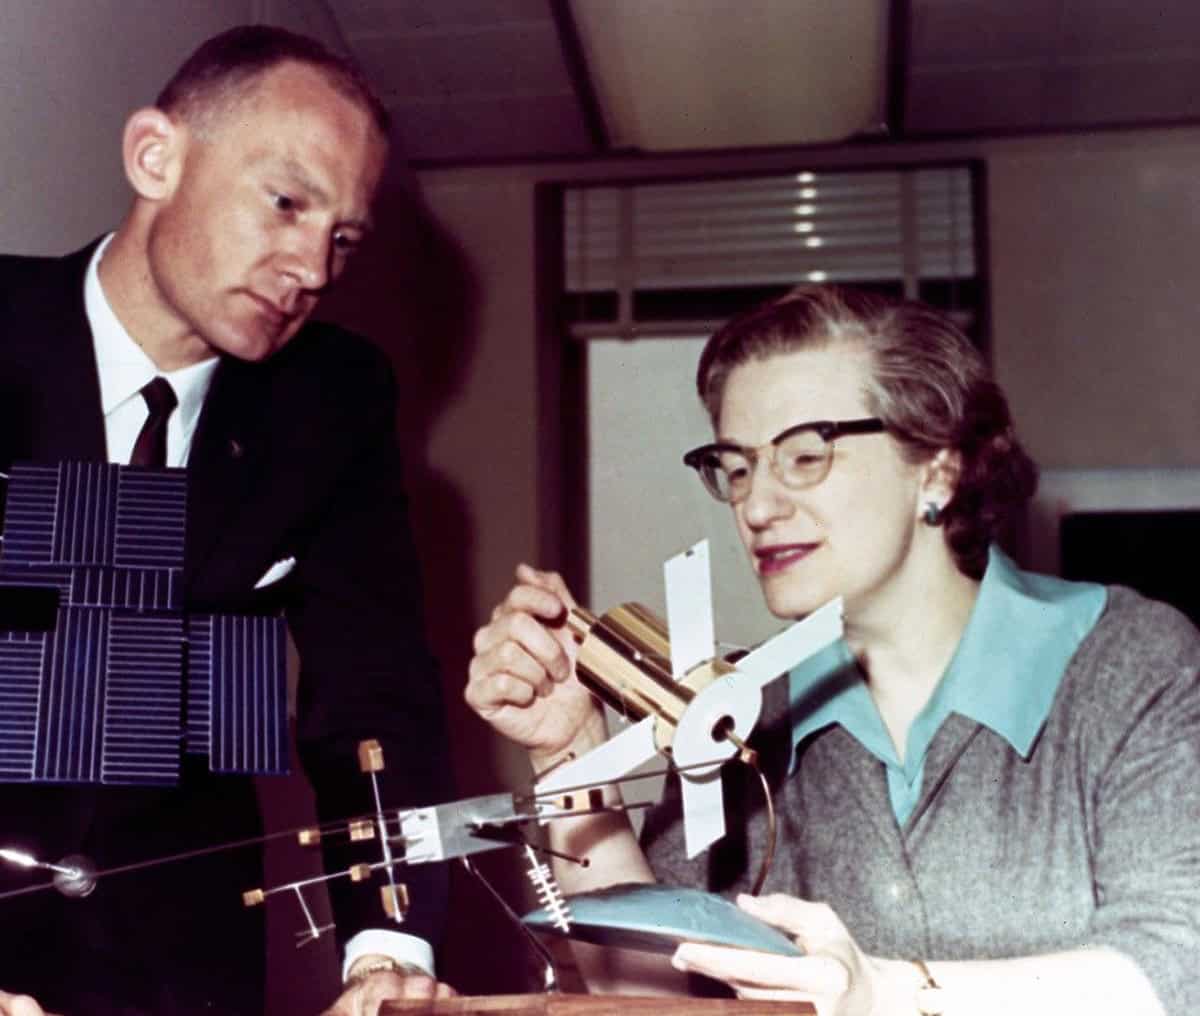
Space pioneer Nancy Grace Roman, born in 1925, was the first female executive at NASA and served as the agency’s first chief of astronomy throughout the 1960s and 1970s. She created NASA’s space astronomy programme and is known to many as the “Mother of Hubble” for her role in planning the Hubble Space Telescope. Pictured here explaining the Advanced Orbiting Solar Observatory to astronaut Edwin “Buzz” Aldrin, she was also an active public speaker, educator and advocate for women in science. (Courtesy: NASA)
The Vera C Rubin Observatory in Chile makes the new approach to professional astronomy even more explicit. Its decade-long Legacy Survey of Space and Time, which began in 2026, is collecting some 10 terabytes of data each and every night. Whenever its software detects that something has changed, it issues an alert. When alerts are triggered, they will be sent to automated “brokers”, which will cross-match them against existing catalogues, classify them and rank candidates for follow-up scrutiny. It is unlikely that an astronomer searching for supernovae, variable stars or hazardous asteroids, for example, will begin with the telescope’s raw images. Throughout modern astronomy, the starting point will instead be a filtered stream produced by a chain of algorithms.
Roman will carry this survey logic into space, beyond the blurring and infrared glow of the Earth’s atmosphere. As Roman’s deputy WFI scientist Ami Choi explained during the launch broadcast, the wide view is essential, especially for cosmologists. They don’t only need sharp measurements of individual galaxy shapes but also data on enough galaxies across a sufficiently large volume. That way they can distinguish the behaviour of the universe on large scales from the peculiarities of one small region.
Roman's three surveys
Roman’s three core surveys will show how a dataset can be designed to answer one question while creating the raw material for many others.
The High-Latitude Wide-Area Survey will map more than 5000 square degrees, which is more than 12% of the sky. It will do this using both imaging and “slitless” spectroscopy, in which spectra are recorded for every suitable object in the field rather than just individually selected targets.
Measuring the subtly distorted shapes of hundreds of millions of galaxies should reveal the distribution of dark matter – the mysterious, invisible stuff that makes up 27% of the universe by mass-energy – and also how cosmic structure has grown over time. Yet the same observations will also contain stars in the Milky Way, nearby galaxies, distant quasars, strong gravitational lenses and objects that no survey committee will ever have thought to put on a target list.
Roman’s High-Latitude Time-Domain Survey, meanwhile will repeatedly image “deep” fields at roughly five-day intervals, producing an anticipated 100,000 transient light curves. Type Ia supernovae, whose luminosities can be standardized to make them cosmic distance indicators, will trace the expansion history of the universe, but the repeated images should also expose variable galactic nuclei and rare explosions.
Finally, the Galactic Bulge Time-Domain Survey will revisit six fields of the sky about every 12 minutes during its most intensive observing seasons. Its main goal is to detect the temporary brightening of a star that occurs when the gravity of an unseen object passes in front and bends its light. Such “gravitational microlensing” events can reveal cold planets orbiting their host stars as well as free-floating planets and isolated black holes. The same sequence becomes a record of stellar variability and motion.
The reuse of data that we’ll see with Roman is not entirely new. Photographs recorded on physical glass plates often preserved far more sky than the astronomer who exposed them intended to study. Indeed, there have been instances of researchers trawling through old plate archives who’ve made discoveries decades after the photos were originally recorded. Electronic detectors, which produce digital images, made searching old data in this way far easier.
But what is new is the scale and the degree to which reuse is built into the Roman observatory from the outset. Many papers about data from the Roman mission will, I am sure, be written years later by researchers who were never involved in choosing the original data collection and may encounter the observation only as a row in a database.
Together, these observatories mark the arrival of what might be called astronomy’s “production era”. The phrase may sound industrial, but it describes a real shift in our professional practice. Telescope time remains precious, but it is no longer the only scarce resource. What will be increasingly hard to come by will be the capacity to process, connect and interpret what surveys have already observed, and to formulate a question sharp enough to extract meaning from an archive built for many purposes.
A picture too large to see
The data that Roman will yield is mind-boggling. Roman’s WFI has 18 infrared detector arrays with a total of about 300 million pixels. Even one field would require three dozen 4K television screens to display at full resolution. But Roman will tile thousands of such fields into surveys. During the pre-launch broadcast, Roman programme scientist Dominic Benford joked that NASA would need more than 500,000 TV sets to display the largest completed survey; laid out together, they’d cover some 45 city blocks.
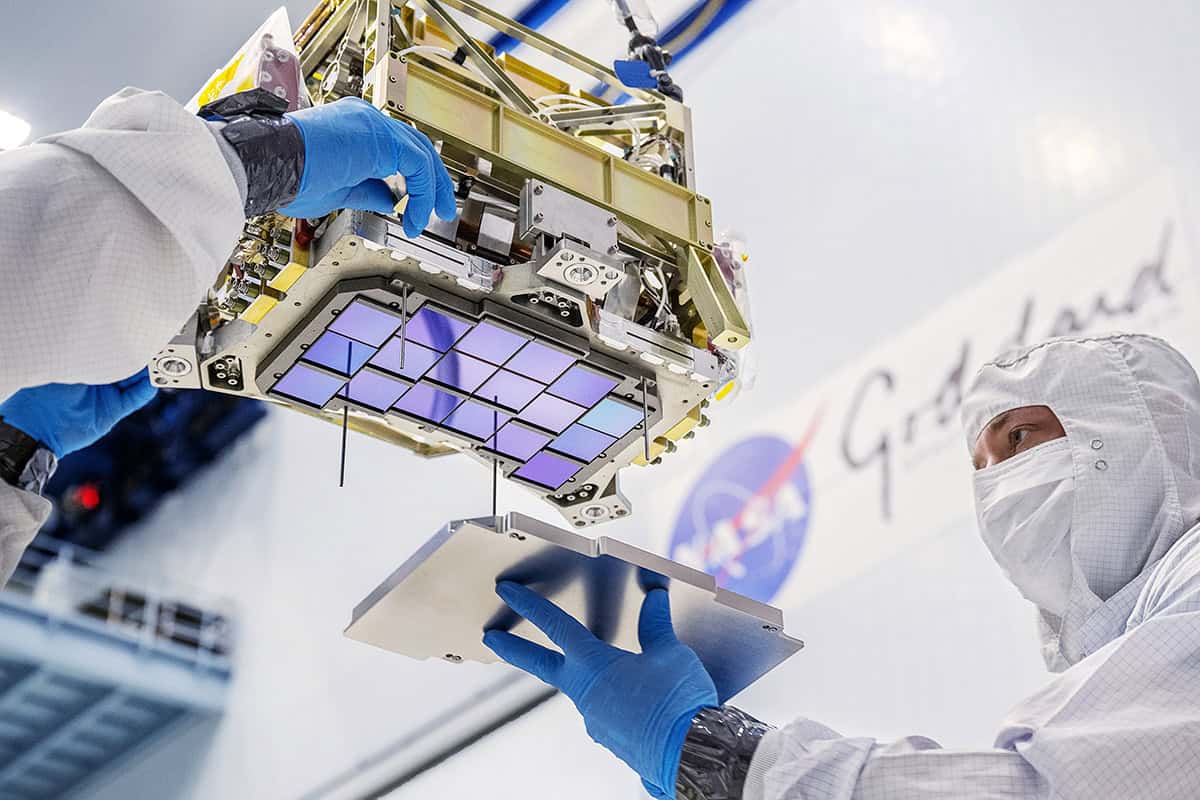
Instrumental magic The Roman telescope’s Wide Field Imager has 18 detectors that can create 300-million-pixel images over a 0.28 square degree field of view. (Courtesy: NASA/Goddard Space Flight Center)
Calling this a single “picture” is convenient but misleading. It will be a computationally constructed portrait assembled from many pointings, observing epochs and filters. The telescope collects photons; processing pipelines calibrate the detectors, remove instrumental signatures, align exposures and turn them into images, mosaics and catalogues. In survey astronomy, computation is not something that happens after the observation; it is part of observing.
During its lifetime, Roman is expected to return around 1.4 terabytes (1.4 × 1012 bytes) of compressed data each and every day. In fact, if you take into account the intermediate data generated when the information is processed, Roman’s archive could top 20 petabytes (20 × 1015 bytes) over its five-year primary mission. NASA expects automated methods, including machine learning, to help explore the torrent of data.
Automation is unavoidable, but it poses a subtle problem. Algorithms are excellent at finding examples of phenomena on which they have been trained. The discoveries that change science, however, often do not fit into established categories. An anomaly-detection system can flag statistical outliers, but deciding which outliers are artefacts, familiar objects in unusual circumstances or genuinely new phenomena remains a scientific assessment.
Human involvement in Roman won’t be entirely superfluous, however, and will still be required to make breakthroughs. Citizen scientists will play their part too. We need to encourage amateur sleuths to follow in the footsteps of people like Hanny van Arkel – the Dutch schoolteacher who in 2007 spotted an unfamiliar green cloud in data gathered by the Sloan Digital Sky Survey. “Hanny’s Voorwerp”, as it became known, is an ionized cloud preserving the light echo of a quasar that had faded dramatically.
Open data, uneven opportunity
Roman will need both kinds of intelligence: machines capable of surveying the statistical forest and people – whether professional astronomers or citizen scientists – willing to pause over a strange bird in one of its trees. But the question is not just how Roman’s data will be searched. It is also who will get to search them.
The Roman space telescope will fundamentally change who gets the first chance to make a discovery
Roman, you see, will fundamentally change who gets the first chance to make a discovery. Hubble observers can receive up to a year of exclusive, “proprietary” access to their new data, which is typical for space- and ground-based professional programmes. Roman, however, will have no such period. Calibrated exposures are intended to become public within days, with more elaborate mosaics and catalogues following in periodic releases.
In principle, therefore, anyone will be able to start looking at observational data as soon as it’s released. The beauty of Roman is that a PhD student, a researcher at a small institution, or members of large international consortium will all be able to get going at the same time. The move to “open data” will also benefit astronomers at institutions who have traditionally lacked access to major telescopes.
However, it also complicates familiar ideas about ownership and priority. Who receives credit when one team designs a survey, another builds the pipeline, a machine identifies a puzzling candidate, and a third group recognizes its significance? Will researchers feel pressure to publish quickly rather than investigate carefully when competitors can access the same data?
Indeed, open access does not automatically create equal opportunity. A 20-petabyte archive cannot simply be downloaded onto a laptop. Researchers need computing resources, efficient code and the expertise to use them. That’s why the Space Telescope Science Institute in Baltimore, Maryland, has developed the cloud-based Roman Research Nexus, which will let users analyse mission data where they are stored.
Rather than trying to transfer vast wodges of raw data to their home institutions, researchers will instead write or upload code to a cloud-based environment where the Roman archive is stored, run the analysis there and then download the results. Essentially, they will take their code to the data, not the data to the code. Without such a platform, nominal access to the archive would be of limited use.
Even so, differences in funding, training, network bandwidth and available time will continue to shape who can exploit the archive most effectively. Astronomers will, in other words, still need to understand telescopes, detectors, calibration and astrophysics. But they will increasingly work alongside software engineers and statisticians, evaluate machine-generated classifications and design searches that can operate across billions of sources. Knowing what not to trust in a catalogue may become as important as knowing where to point a telescope.
From 3596 pixels to 300 million pixels
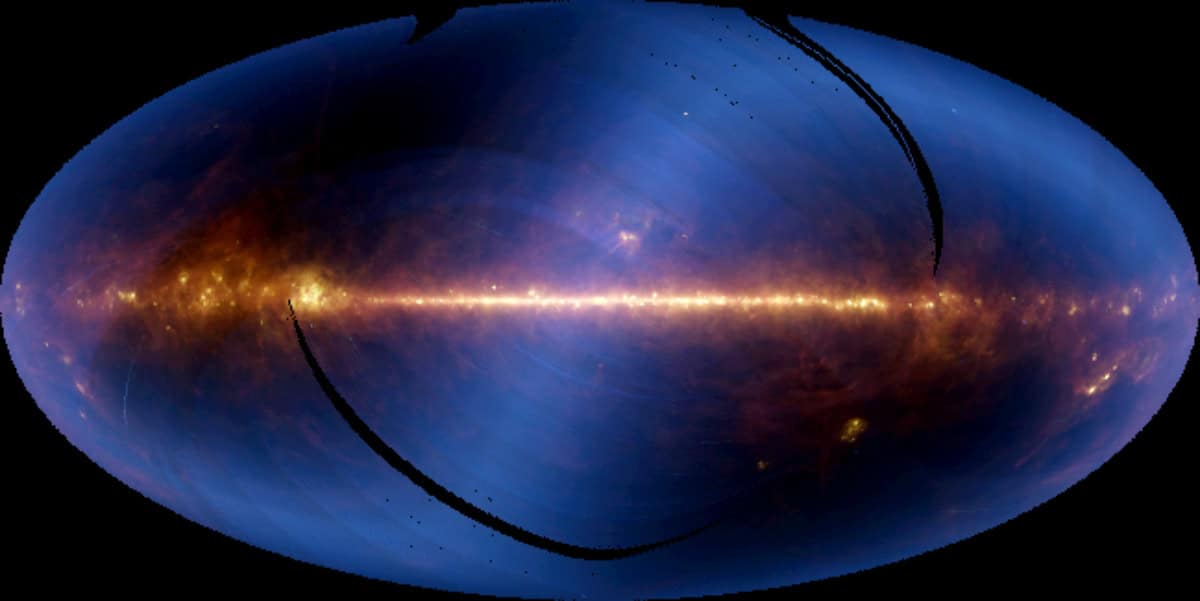
New development The Roman telescope is the next big thing in space-based infrared astronomy, which began in 1983 when NASA launched the Infrared Astronomical Satellite (IRAS). It created images such as this, in which the bright horizontal band is the plane of our Milky Way galaxy, with the centre of the galaxy located in the middle. Being so near, the Milky Way dominates our view of the entire sky, but when IRAS data was processed to show smaller regions of the sky, thousands of sources beyond our galaxy were revealed. (Courtesy: NASA/JPL)
In the early days of optical astronomy, researchers used traditional photographic plates to record individual images of the sky. To look at infrared light, astronomers turned to heat-sensitive detectors, but they’d still have to measure one position at a time, scanning a telescope across a source to build up information sequentially.
That logic changed in 1983 when NASA launched the Infrared Astronomical Satellite, which was the first space-based infrared observatory and had 62 separate detectors. By the 1990s, huge 256 × 256 arrays, encompassing 65,536 detector elements, had become common enough to support detailed infrared imaging of galaxies. Hubble’s Near Infrared Camera and Multi-Object Spectrometer, installed in 1997, used three arrays of this format.
I’ve seen the changes at first hand myself. In 1994 when I was doing my PhD at the University of Groningen in the Netherlands, I published my first paper on near-infrared astronomy, which I’d co-written with an undergraduate student I was supervising. It was based on infrared images of a galaxy taken with a camera on the 2.1 metre telescope at the Kitt Peak National Observatory in Arizona, which used an indium-antimonide detector with just 3596 pixels.
For my PhD itself, however, I observed a sample of galaxies using the European Southern Observatory’s 2.2-metre telescope at La Silla in Chile using a mercury cadmium telluride detector with 65,536 pixels. That was an 18-fold increase over the Kitt Peak camera, yet Roman’s focal plane, with its 18 detector arrays, contains more than 300 million physical pixels.
Progress is not just about pixel count. The advantages of working in space are even bigger because you get none of the atmospheric turbulence or infrared background that you do on Earth. However, it’s not all plain sailing. Space-borne infrared arrays need to be sensitive, uniform, low-noise and reliable; they also have to operate at cryogenic temperatures (roughly 90 K) and endure a harsh radiation environment.
In fact, Roman’s equipment represents decades of progress in materials science, fabrication, electronics, calibration and computing as well as our ability to make pixels ever-smaller. Its infrared detectors are cooled passively by radiators that discharge heat into space rather than by liquid helium.
Larger arrays have also changed what it means to select an astronomical target. A single detector requires an astronomer to decide where to measure: a small array records one selected view. Roman, however, will capture a panoramic field large enough to contain a huge amount of scientifically useful objects. It will transform astronomy, which will be less about choosing what to study and more about working out how to analyse huge data sets.
Looking differently
Roman will not replace targeted observatories or the astronomer’s intuition. Its most intriguing discoveries will often require the James Webb Space Telescope, Hubble or ground-based telescopes to inspect individual objects in greater detail. Instead, these facilities are complementary: one maps entire populations, another inspects exceptional objects, and each changes what the other knows to look for.
Roman’s launch on 30 August lasted little more than half an hour. But the transition the observatory represents has taken decades, driven by larger detectors, faster electronics, public archives and increasingly sophisticated software. I entered professional astronomy when infrared images containing tens of thousands of pixels were normal (see box). Roman will create survey portraits containing trillions of pixels, release its data rapidly to the world and ask humans and machines to explore them together.
When Roman reaches L2 and begins returning science data, its most important legacy may be a way of observing in which the sky becomes a shared, continuously growing dataset. And discovery begins with learning how to explore it.
Astronomers and astrobiologists use a wide range of tools in their search for extraterrestrial life. Probes, satellites, and rovers take photographs and collect data on the geology and chemistry of planets and moons in the solar system. Radio telescopes sweep the sky, looking for signals from intelligent civilizations. And telescopes like the JWST can observe the atmospheres of distant exoplanets, potentially finding ones similar to Earth’s.
A limitation of these methods is that they assume life on other worlds is fundamentally similar to life on Earth, requiring the same balance of molecules in the atmosphere, producing the same chemicals for their metabolic processes, or developing technologies analogous to those humans make. While researchers use these assumptions as baseline markers to look for, assuming such similarities might lead them astray. Scientists looking for life using too narrow a set of parameters might miss life unlike Earthlings. Or they might mistake coincidentally similar geological, chemical, or astronomical processes for having been made by living things.
So, to complement techniques that assume alien life resembles life on Earth, scientists also consider approaches that detect signs of life while making as few assumptions as possible about what it could look like, known as agnostic biosignatures. One of these life signs with few assumptions is complexity. Though it can be difficult to quantify precisely, living things tend to create more complex systems than nonliving things. A team of researchers recently tested whether living and nonliving worlds could be distinguished solely by examining the complexity of the light-reflection patterns from their surfaces.
For this, the team treated Earth and Mars, similar planets but one with life and one without, as stand-ins for exoplanets around other stars. They collected data on the light reflected off both planets’ surfaces from a space station monitoring Earth, known as the Deep Space Climate Observatory or DSCOVR, and an orbiter around Mars observing its atmosphere, known as the Hope Probe.
The team identified 3 nearly identical wavelengths of light that these machines observe from their respective planets. From the machine databases, they collected measurements of how much light each planet reflected, called its reflectance, at these 3 wavelengths over 486 local days. By using only individual wavelengths of light rather than full photographs, the team claimed that, if their test worked, researchers could apply it to distant exoplanets that cannot be photographed in detail.
Without looking for any particular chemical or signal, the team compared these measured reflectances using a series of statistical tests to determine the variation and randomness in their reflected light, which they considered representative of the complexity of the planets’ surfaces. The researchers found that of the 27 complexity metrics they tested, Earth scored higher than Mars on 25, Mars scored higher than Earth on 1, and the planets scored the same on 1. So, even though both planets have rocky surfaces with atmospheres, weather, and cyclical changes, the one with life is measurably more intricate and dynamic, and the researchers found this difference detectable even with a small stream of light at great distances.
The researchers claimed their test demonstrated that complexity could be a valid agnostic biosignature, with caveats. One is that Earth is quite distinct from Mars, in that it has oceans and a relatively thick atmosphere. This means that processes like making and dispersing clouds and the sharp contrast between land and water could add complexity to Earth’s measurements without direct ties to living things.
They suggested 2 possible explanations for how these complicating factors relate to life on Earth. Either life allows Earth to have these factors, or Earth is inherently complex regardless of life, and therefore it can’t be used to assess how life leads to measurable complexity. To say which is the case, one would have to replicate this test with a lifeless copy of Earth. However, the team argued that Earth’s biosphere is unlikely to be wholly unrelated to its water cycle.
To bolster the validity of their methods, the team plans to expand their sample of planets to include Venus, Saturn’s moon Titan, and simulated exoplanets with modeled biochemistry and atmospheres. If the model holds up, their methodology could represent a new category of mission to find alien life, with long searches for variations in reflected light uncovering properties of distant worlds that would otherwise go unnoticed.
Physicists at CERN have recreated the collisions that trigger cosmic-ray air showers in Earth’s atmosphere. Results from the ATLAS experiment on the Large Hadron Collider (LHC) show that none of the computer models used to simulate showers gets every detail right. Their measurements of particle production in proton–oxygen collisions are more than ten times more precise than the differences between the models – which could be improved by these latest results. This will be a step toward understanding the most energetic particles in the universe.
Cosmic rays are energetic particles (mostly protons) from outer space. They strike Earth’s atmosphere at nearly the speed of light, setting off cascades of secondary particles.
“Cosmic-ray air showers are sprays of particles raining down from high in the sky,” explains Jesse Liu of New York University, the lead author of a paper that describes the study. He adds that cosmic rays come from “extreme corners of our universe,” with exploding stars and supermassive black holes in distant galaxies as likely sources.
Still, the origin of the most energetic cosmic rays remains “one of the biggest mysteries in astrophysics,” says Karl-Heinz Kampert of the University of Wuppertal in Germany, who was not involved in the study. Such particles carry a hundred billion-billion electron volts or more – compared to the million-million electron volts achieved by the LHC. At the highest energies, only about one such particle hits each square kilometer of Earth’s surface per century. “The only way to measure them in sufficient numbers is to detect the extensive air showers they produce,” he says.
Difficult calculations
Interpreting these showers relies on computer simulations. But, the role of the strong nuclear force, which governs the underlying collisions, is notoriously difficult to calculate. The simulations therefore use models informed by accelerator data, yet “existing models widely disagree with one another on how these showers form,” says Liu.
The most energetic cosmic rays collide at energies far beyond the reach of the LHC, so “we must extrapolate the known properties of particle interactions at man-made accelerators to those occurring in the upper atmosphere,” Kampert explains. Moreover, the LHC’s beams had previously consisted only of protons or heavy nuclei such as lead, rather than the light nitrogen and oxygen nuclei found in air. “For more than a decade, the cosmic-ray community has been working to convince the CERN and particle physics communities of the importance of such measurements,” he says.
That changed in July 2025, when the LHC was reconfigured “to make protons acting as cosmic rays collide with oxygen nuclei playing the role of Earth’s atmosphere,” says Liu. The ATLAS detector recorded the charged particles these collisions produced.
Key parameter
ATLAS physicists studied “how many particles are created during collisions of protons and oxygen nuclei, alongside what energies and angles these particles fly out at,” Liu explains. They also determined the cross section, which “tells us how often these collisions occur,” he adds. Kampert calls it “a key parameter,” because it determines the average depth at which cosmic rays first interact in the atmosphere. This depth affects “essentially all air-shower measurements that are needed to infer the mass” of the incoming particle.
The measured cross section lies at the low end of model predictions, agreeing with only two of the seven models tested. The team also used it to infer the cross section for protons colliding with air, a quantity previously measured at such high energies only by cosmic-ray observatories. The result agrees with earlier air-shower measurements at similar energies.
“Our measurements are more than ten times more precise than the differences between the existing computer models,” says Liu. “Our data show that no model correctly describes the number of particles created in these collisions.” Some models misjudge the frequency of rare, particle-rich collisions by a factor of ten. A model called Angantyr best reproduces the particles’ energies and directions, but no model describes all the results consistently.
Blind spots and next steps
Kampert points out that the measurement has a blind spot because multipurpose detectors like CERN’s ATLAS and CMS are optimized to track particles flying out at relatively large angles to the beam. He explains, “most of the collision energy remains unseen by ATLAS and CMS and escapes close to the beam pipe, at very small angles. This unseen region most strongly influences the features of the air showers.” Specialized experiments, such as LHCf at CERN, are designed to fill this gap.
The next step, says Liu, is “to apply our data to improve the computer models of cosmic-ray showers.” Physicists will then check whether this eases the “muon puzzle” — facilities such as the Pierre Auger Observatory in Argentina see more muons, heavier cousins of electrons, in air showers than simulations predict. “Our proton–oxygen data are an important step toward resolving these puzzles and help decipher cosmic mysteries, namely what high-energy cosmic rays are made of and where they come from,” Liu adds.
“Model builders have been eagerly awaiting this data and have started improving their models based on it and earlier accelerator data,” says Kampert. Because Auger results suggest that the most energetic cosmic rays are mostly heavier nuclei such as carbon, nitrogen, oxygen and silicon, he calls data from oxygen–oxygen or nitrogen–nitrogen collisions “another important step forward.”
Earlier this year, he and colleagues outlined in Nature Reviews Physics how such data could feed into a common tuning of the models, an undertaking he calls “a great community effort involving researchers from different fields of science.”
“I hope [our work] strengthens the cross-disciplinary connections between particle physics and high-energy astrophysics, with much to learn from each other,” says Liu.
The image – The Quiet Predator – captures the Shark Nebula, which lies almost 650 light years away in the constellation Cepheus. The nebula is made of interstellar dust dense enough to block starlight with the blue-coloured areas in the image being “reflection nebulae” – clouds of interstellar dust that do not emit their own visible light but rather scatters and reflects light from nearby stars.
The image was taken in August 2025 with an Askar 140 APO telescope from the Jahra Governorate, Kuwait.
Sam Wen, founder and chief executive office of the astrophotography firm ZWO, says the image “is a stunning blend of technical excellence and artistic vision”.
“Showcasing the intricate structures of a rarely photographed nebula, the image combines remarkable detail with a striking composition and colour palette, inviting viewers to explore the hidden beauty of the cosmos,” adds Wen.
Alobaidly says it is a “tremendous honour” to receive the award.
“The juxtaposition of an oceanic predator prowling the skies above the Kuwaiti desert is something I find deeply poetic, and it is what first drew me to this remarkable region of the sky,” adds Alobaidly. “To me, it represents perfectly my love for both the Universe and the deserts of my ancestors.”
Alobaidly now hopes to continue using astrophotography for outreach and scientific research.
As well as winning the £10,000 top prize, the image will go on display along with other selected pictures from the competition at an exhibition at the National Maritime Museum observatory on 18 September.
The award – now in its 18th year – is run by the Royal Observatory Greenwich in association with ZWO and BBC Sky at Night Magazine.

 Login